Embed Size (px)
Citation preview

Water Loss Management In Distribution PipeBasic Knowledge

1. Water Balance IWA concept
3. Reduce Non Revenue water Concept
2. Water Loss Indicator
Why water loss is Important ?
- Lack of water resource
- Save operating cost
- Save energy for pumping
- Increase Level of operation pressure
- Reliability in distribution pipe system
- Excellent service quality


Background Leak
Main Leak
Can’t recordunavoidable
Can detect
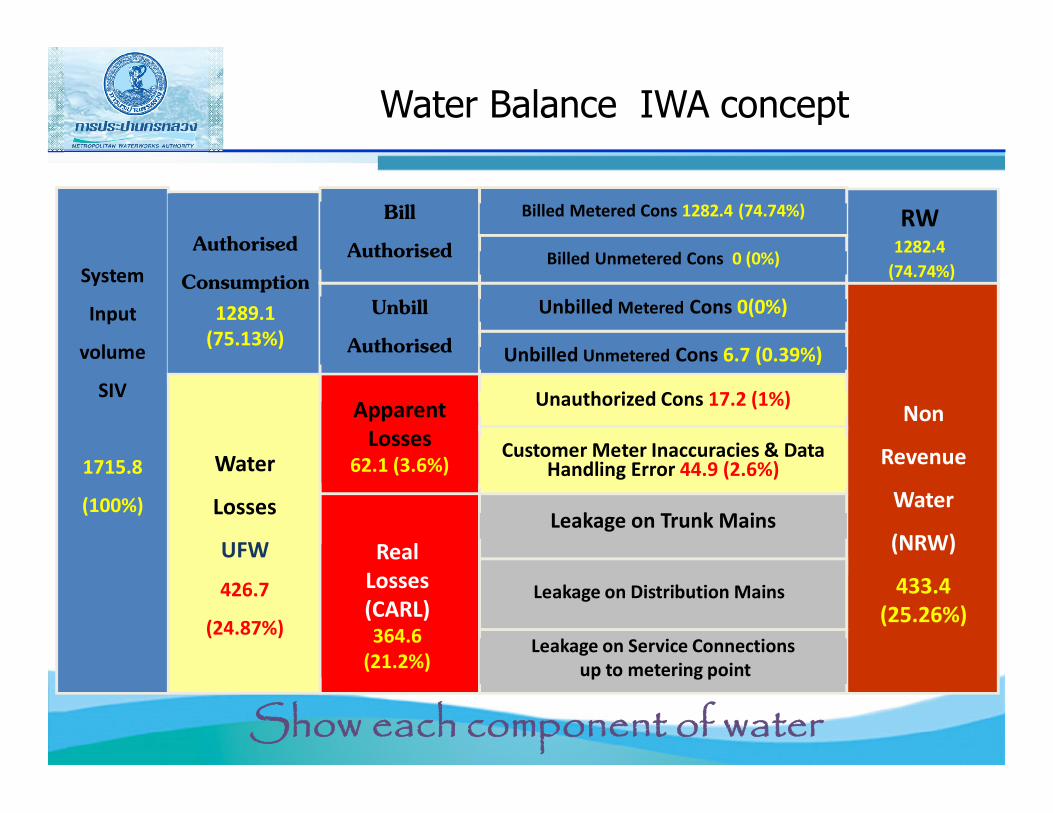
Water Balance IWA concept
System
Input
volume
SIV
1715.8
(100%)
AuthorisedConsumption
1289.1(75.13%)
RW1282.4
(74.74%)
Non
Revenue
Water
(NRW)
433.4 (25.26%)
Bill Authorised
UnbillAuthorised
ApparentLosses
62.1 (3.6%)
RealLosses(CARL)364.6
(21.2%)
Water
Losses
UFW
426.7
(24.87%)
Billed Metered Cons 1282.4 (74.74%)
Unbilled Unmetered Cons 6.7 (0.39%)
Unauthorized Cons 17.2 (1%)
Customer Meter Inaccuracies & Data Handling Error 44.9 (2.6%)
Leakage on Trunk Mains
Billed Unmetered Cons 0 (0%)
Unbilled Metered Cons 0(0%)
Leakage on Service Connectionsup to metering point
Show each component of water
Leakage on Distribution Mains

Billed Meter consumption = customer pay from billing system
Unbilled consumption = Amount water that can authorized from evaluate
Use in operation , Utility Blow off / Fire HydrantUse in construction/Repair
Authorized Consumption
Component of Authorized consumption
Customer useBlow off / Fire HydrantUse in construction

Apparent Loss / Commercial Loss
Physical loss / Real loss
Illegal in consumptionInaccuracy of Meter
Leakage in pipe
Water loss
Component of Water loss
UnbilledAuthoried
NRW

Advantage of using Water BalanceWB
- Show all components of water
- Clearly , Classify
- Low estimate Data / Realizable

Disadvantage of using Water BalanceWB
- Lack of Data / 1 Billing cycle for Water balance
- Customer billing cycle not finish in same time
- All of master meter must operation all time Error occur when estimate data

Water loss Indicator
UFW unaccounted of water
Volume / Percentage
NRW non revenue waterNRW non revenue water
Volume / Percentage
ILI Infrastructure leakage index
Non Unit

Water Audit Concept
Loss Indicator
“Top – Down”Water balance
Collect SIV , Componet each water
“Bottom - Up”Use MNF to evaluate
Amount of loss

MNF is the Minimum Flow rate at Night time
Assumption 1.Leakage all time 2. At night time Consumption is very low
3. MNF is nearless Leak flow 4. Use Daily MNF for estimate Water loss
Minimum Night Flow

%UFW
%UFW = %(SIV – Authorized consumption)/ SIV
Advance - Easy for Calculate - Easy for collecting data- Easy for monitoring Trend
In same area
Disadvantage - Error if over estimateAmount of water which Unmetered- Can not compare inSome area

Non revenue water
%NRW = %(SIV- Billed consumption) /SIV
Advantage - Easy - Refer to Revenue
Note - NRW > UFW

Example Calculate of UFW,NRW
SIV
5000
(100%)
AuthorizedRW?
Non
Revenue
Water
(NRW) ??
Billed
Unbilled
ApparentLosses
RealLosses(CARL)
Water
Losses
UFW ??
Billed Metered Cons 2500
Unbilled Unmetered Cons 300
Unauthorized Cons 100
Customer Meter Inaccuracies & Data Handling Error 150
Leakage on Trunk Mains 500
Billed Unmetered Cons 500
Unbilled Metered Cons 200
Leakage on Service Connectionsup to metering point 250
Leakage on Distribution Mains 500
3000 (60%)3000
500 3500 (70%)
1500 (30%)2000 (40%)
250
1250 24%

Area 1
Area 2
Area 3
Area 7
Area 4 Area 6
Area 5
15% 22%
32%
43%
7%
32%
38%
Water loss300 m3
270 m3
180 m3
600 m3
250 m3
350 m3
700 m3
Volume loss
450 กม.
800 กม.
250 กม.
180 กม.
700 กม.
400 กม. 300 กม.
Pipe length
%NRW
6
2
7
4
3
1
5
Volume
7
6
4
1
2
5
3
Length
7
5
1
4
6
3
2
High
Low
How to Ranking Area

Key factor independent to water loss
Water loss
Pipe length
Pressure
Seviceconnection

ILI infrastructure leakage index
ILI = CARL / UARL
Advantage - Use variable of factor - Use for Ranking Priority - Can compare for every area
Disadvantage - Many source of data - Hard to calculate

20
(Unavoidable Annual Real Losses, UARL)
Lm คอื Distribution pipe length (km)
Nc คอื No of Connection (point)
Lp คอื Service pipe length (Km)
P คอื Pressure ( m)
UARL= [18Lm + 0.8Nc + 25Lp]P (liter/day)
In each area that has differentComponent has unequal UARL
Standard operating Pressure = 50 m

(ILI)
CARL (Current annual real loss)
UARL(Unavoidable Annual Real Losses)
For example :
CARL from WB table 1,000,000 Liters/day
DMA has Pipe length = 30km , Service pipe = 3 km , 1500 concection , average P = 8 m
UARL = (18x30 + 0.8x1500 + 25x3)x8 = 14,520 Liter/sec
ILI: 1000000/14520 = 68.9

NRW
(%)
CARL
(Liters/Day)
UARL
(Liters/Day)
ILI
(times)
Area A 20 450 50 9
Area B 40 400 100 4
Area C 35 350 35 10
Example (ILI) VS NRW
1
147
.96
136
.83
91.1
3 123
.01
141
.48
352
.61
45.4
2
53.1
0
46.2
7
69.2
4
38.9
8
118
.13
164
.12
92.9
3
37.5
8
29.00 30.16
26.39
29.72 30.78
34.67
21.29
27.33
21.73
24.72
22.97
35.49
36.66
33.50
26.43
0
5
10
15
20
25
30
35
40
0
50
100
150
200
250
300
350
400
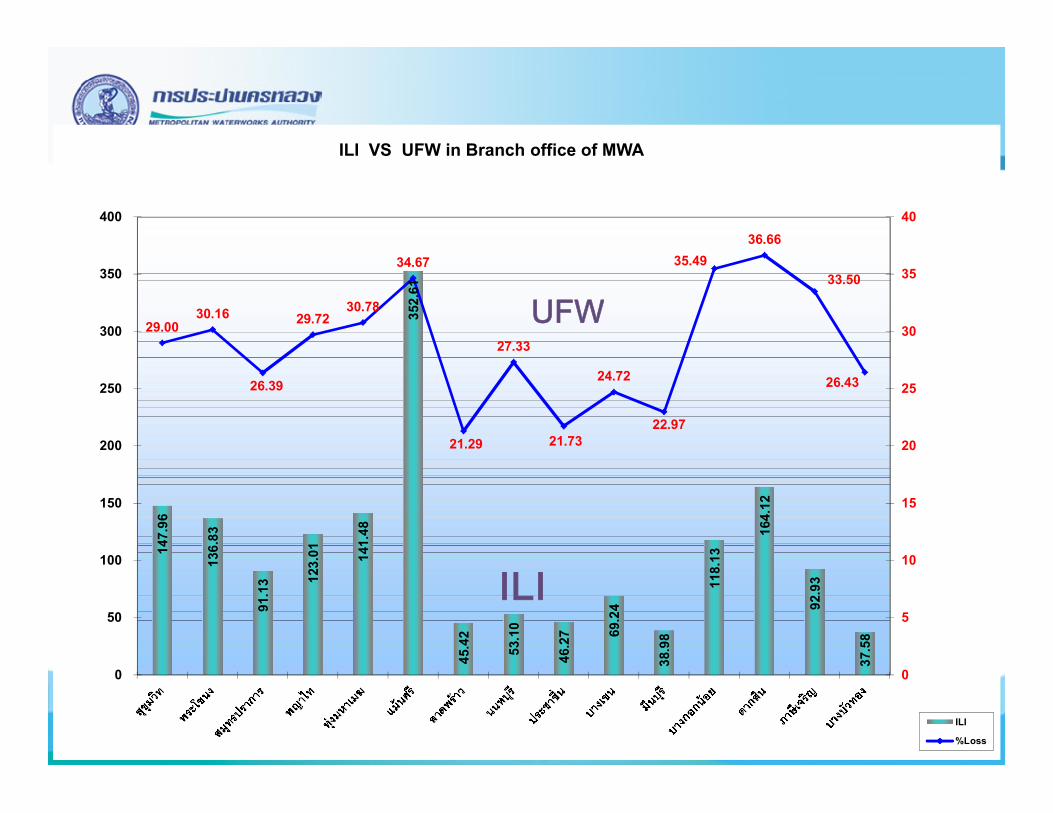
ILI VS UFW in Branch office of MWA
ILI
%Loss
ILI
UFW


CARL= 40%
ELL
Leakagemanagement
1)PressureManagement
2) Speed & Quality
of
Repairs
3) ALCALR - time
4) PipeReplacement4 Element of Sustainable Leakage Control Strategy as Contineous Improvement Activities
System Input Volume
PoorPressure Revenue
Water
High Pressure
Optimize Pressure
% Non-Revenue Water
UARL

Factor of loss volume
No of Leak point
Flow Rate
Uncontroling
-external force- Pipe Material
-Pipe age- Soil settlement
- Pressure- Leak area
- Metering Error - Illegal consumption

ELL Economic leakage level is the optimum
Level of leakage at the lowest Total Cost
Cost of water is vary direct to the amount of waterInvestment margin is vary indirect to %Reduce of NRWIn term of exponentioal
ELL

The Economic Balance
Cost of Leakage Control
LOSSES (ML/D)
Bac
kgro
un
d L
eak
age
and
Re
po
rte
d B
urs
t
CO
ST O
F LE
AK
AG
E C
ON
TRO
L A
ND
WA
TER
LO
SS
Economic Leakage LevelWhere the total cost is at a minimum
Economic Level of Leakage (ELL)

Leak Run Time Awareness
Time
Total volume loss= (A+L+R)time x Flow rate
AwarenessLocationRepair
AA LL RR
- Flow rate vary direct to Pressure - To reduce loss if can reduce ALR time

What is ALR time ?

Pressure Management
To control unnecessary flow rate
To increase consumption flow rate
To decrease error in meter recording
For efficient in Water loss activities

Relation between Loss & Pressure
n1(L/Lo) = (P/Po)N1
n1 Find from “Pressure step test”Generally = 0.5 – 1.5
FAVAD (Fixed and Variable Area Discharge)
L = Cd x A x (2gP)0.5
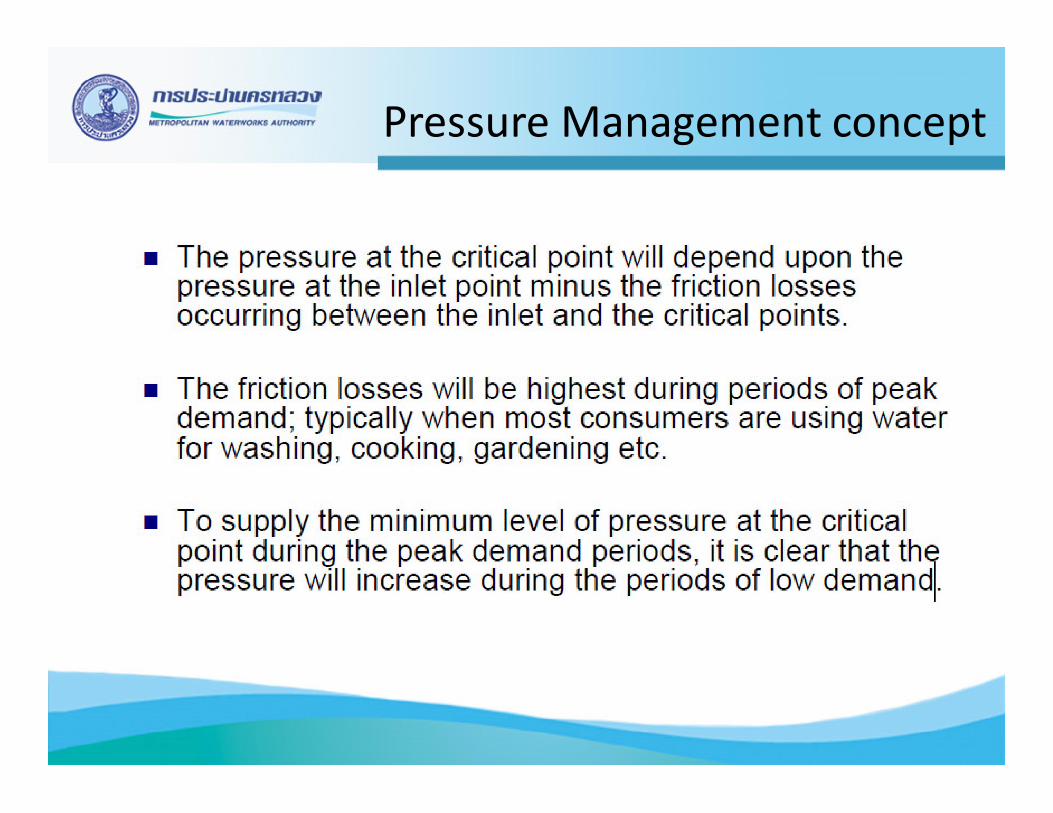
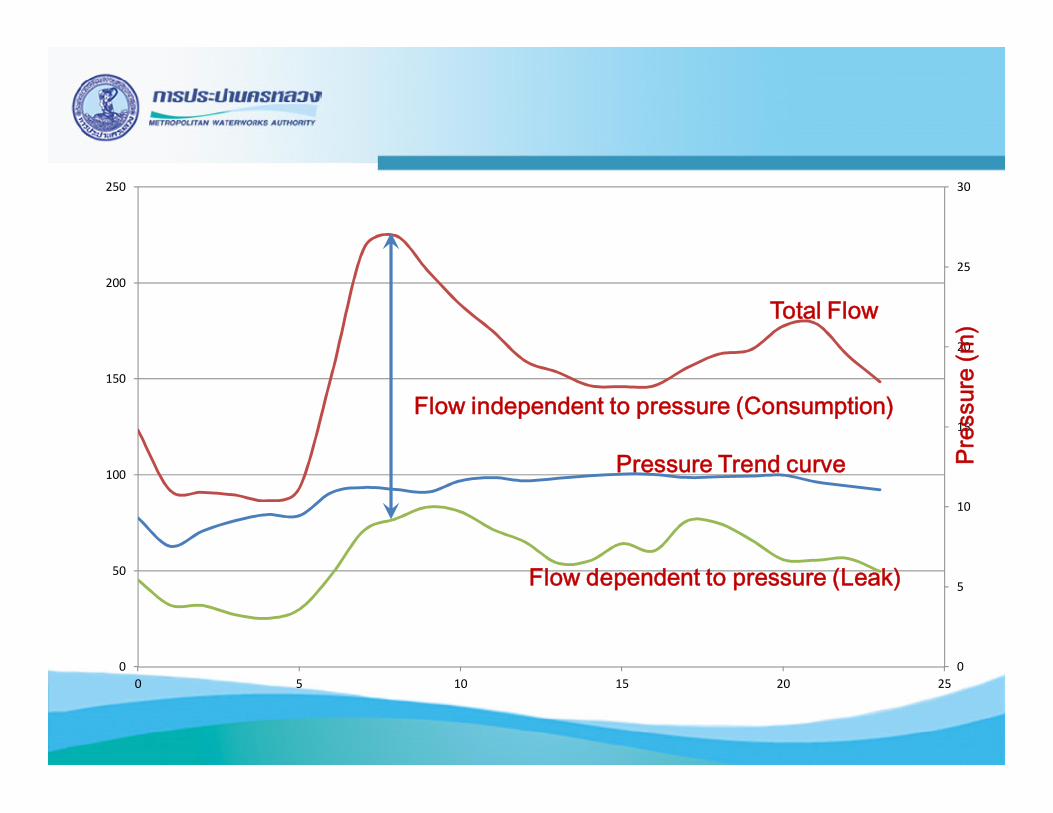
Pressure Management concept

Pressure Management concept
0
5
10
15
20
25
30
0
50
100
150
200
250
0 5 10 15 20 25
Flow independent to pressure (Consumption)
Pre
ssure
(m
)
Flow dependent to pressure (Leak)
Total Flow
Pressure Trend curve

Pressure Management

Active leakage control ??
Objective To Reduce Leak time A & L time
Monitoringsystem
Pin pointActivities
Loss & Ranking Warning & AleartSystem

Pipe replacement concept
Objective To Reduce Repair time
Protect for reburst pipe
Expand the life time of Pipe
- Limitation of Budget
- Plan for new investment project
- Limitation of Budget
- Financial analysis in project
- Evaluate & Priority of Pipe construction route
- Select the best of material & construction
technique by economic value
- Plan for new investment project

Q & AQ & A