Embed Size (px)
Citation preview
doi.org/10.26434/chemrxiv.12715502.v1
Water-Involved Methane Selective Catalytic Oxidation by Dioxygen overCopper-ZeolitesLanlan Sun, Yu Wang, Chuanming Wang, Zaiku Xie, Naijia Guan, Landong Li
Submitted date: 25/07/2020 • Posted date: 27/07/2020Licence: CC BY-NC-ND 4.0Citation information: Sun, Lanlan; Wang, Yu; Wang, Chuanming; Xie, Zaiku; Guan, Naijia; Li, Landong (2020):Water-Involved Methane Selective Catalytic Oxidation by Dioxygen over Copper-Zeolites. ChemRxiv.Preprint. https://doi.org/10.26434/chemrxiv.12715502.v1
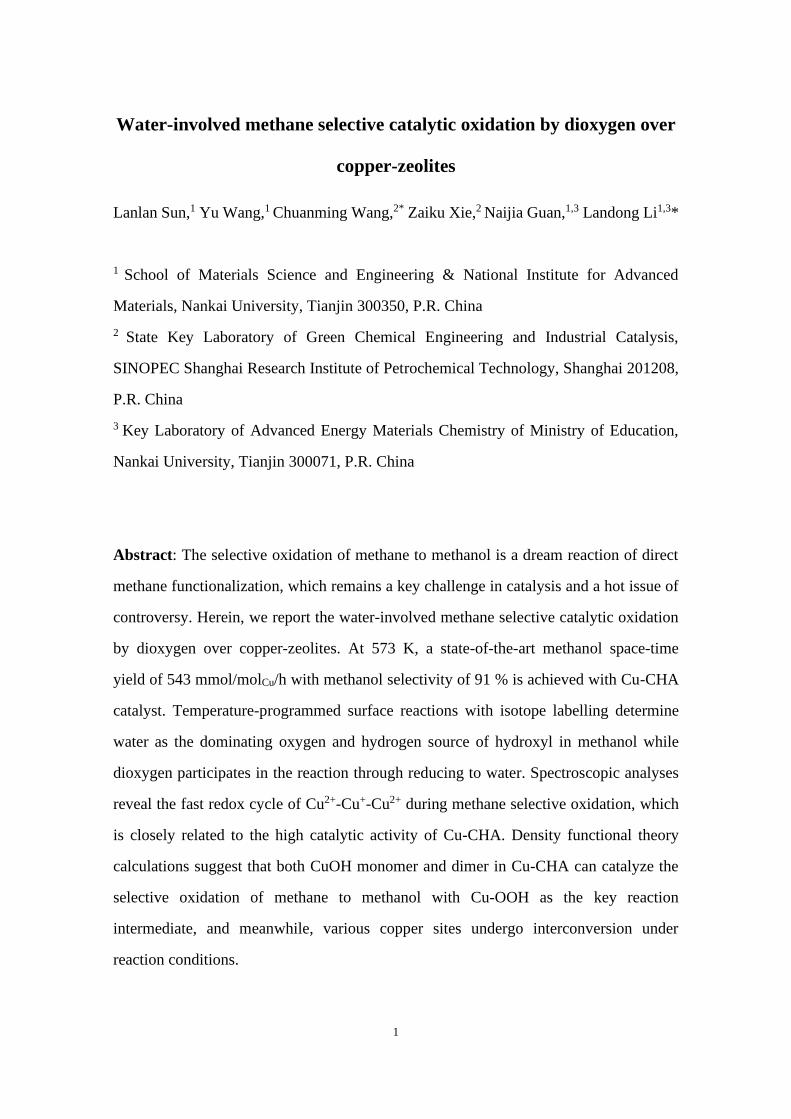
The selective oxidation of methane to methanol is a dream reaction of direct methane functionalization, whichremains a key challenge in catalysis and a hot issue of controversy. Herein, we report the water-involvedmethane selective catalytic oxidation by dioxygen over copper-zeolites. At 573 K, a state-of-the-art methanolspace-time yield of 543 mmol/molCu/h with methanol selectivity of 91 % is achieved with Cu-CHA catalyst.Temperature-programmed surface reactions with isotope labelling determine water as the dominating oxygenand hydrogen source of hydroxyl in methanol while dioxygen participates in the reaction through reducing towater. Spectroscopic analyses reveal the fast redox cycle of Cu2+-Cu+-Cu2+ during methane selectiveoxidation, which is closely related to the high catalytic activity of Cu-CHA. Density functional theorycalculations suggest that both CuOH monomer and dimer in Cu-CHA can catalyze the selective oxidation ofmethane to methanol with Cu-OOH as the key reaction intermediate, and meanwhile, various copper sitesundergo interconversion under reaction conditions.
File list (2)
download fileview on ChemRxivManuscript.pdf (2.03 MiB)
download fileview on ChemRxivSupplementary Materials.pdf (3.57 MiB)
1
Water-involved methane selective catalytic oxidation by dioxygen over
copper-zeolites
Lanlan Sun,1 Yu Wang,1 Chuanming Wang,2* Zaiku Xie,2 Naijia Guan,1,3 Landong Li1,3*
1 School of Materials Science and Engineering & National Institute for Advanced
Materials, Nankai University, Tianjin 300350, P.R. China
2 State Key Laboratory of Green Chemical Engineering and Industrial Catalysis,
SINOPEC Shanghai Research Institute of Petrochemical Technology, Shanghai 201208,
P.R. China
3 Key Laboratory of Advanced Energy Materials Chemistry of Ministry of Education,
Nankai University, Tianjin 300071, P.R. China
Abstract: The selective oxidation of methane to methanol is a dream reaction of direct
methane functionalization, which remains a key challenge in catalysis and a hot issue of
controversy. Herein, we report the water-involved methane selective catalytic oxidation
by dioxygen over copper-zeolites. At 573 K, a state-of-the-art methanol space-time
yield of 543 mmol/molCu/h with methanol selectivity of 91 % is achieved with Cu-CHA
catalyst. Temperature-programmed surface reactions with isotope labelling determine
water as the dominating oxygen and hydrogen source of hydroxyl in methanol while
dioxygen participates in the reaction through reducing to water. Spectroscopic analyses
reveal the fast redox cycle of Cu2+-Cu+-Cu2+ during methane selective oxidation, which
is closely related to the high catalytic activity of Cu-CHA. Density functional theory
calculations suggest that both CuOH monomer and dimer in Cu-CHA can catalyze the
selective oxidation of methane to methanol with Cu-OOH as the key reaction
intermediate, and meanwhile, various copper sites undergo interconversion under
reaction conditions.
2
Methane, the main component of natural gas, is an abundant fossil resource widely
distributed throughout the earth (1). In the energy-intensive industrial processes,
methane is first converted to the syngas via reforming or partial oxidation (2), and then
transformed to fuel and chemicals. By contrast, the direct functionalization of methane
appears to be more intriguing; however, it is greatly challenged by the large C-H bond
dissociation energy of 435 kJ/mol. Several strategies, for example the oxidative or
nonoxidative coupling (3-5) and the dehydroaromatization (6, 7), have been developed
for the direct transformation of methane to chemicals (8). The selective oxidation of
methane to methanol triggers persistent interests because this type of oxidative C−H
bond activation is thermodynamically favorable under relatively mild conditions. The
dream reaction of methane-to-methanol (MTM) has been accomplished with molecular
Periana catalyst (9) and its solid analogue (10) in strong acidic media via multistep
oxyfunctionalization, which unfortunately suffers from both economic and environment
concerns.
Inspired by nature methane monooxygenase (MMO) that can catalyze the oxidation
of methane by dioxygen under ambient conditions (11), the first-row transition metal
cations stabilized by zeolite matrix, for example iron-zeolites (12, 13) and
copper-zeolites (14-24), and copper in metal-organic frameworks (25, 26) have been
developed as candidate materials for MTM transformation. A stepwise strategy
consisting of i) sample activation in dioxygen at high temperature, ii) methane
introduction at low temperature and iii) product extraction with water steam, is
commonly employed, which tactfully blocks the co-existence of methane and dioxygen
and accordingly hinders the over-oxidation of methanol (16-21). However, this is a
chemical looping process and the maximum productivity of methanol is self-limited in
one complete cycle (typically a dozen hours). To establish a promising MTM
transformation, a continuous catalytic process is desired (27) and several key
requirements should be satisfied, namely i) the use of abundant and inexpensive
oxidants like dioxygen, ii) a high selectivity to methanol, iii) a sustainable methane
conversion rate, and iv) good catalyst stability during operation.
We report here the continuous production of methanol from methane selective
3
catalytic oxidation in the presence of water and dioxygen. With the elaborate optimizing
of catalytic materials and reaction conditions, high methanol selectivity and space-time
yield can be simultaneously achieved, which makes an important step forward for the
oxidative functionalization of methane. A clear picture of MTM mechanism is depicted
via the combination of spectroscopic analyses and theoretical calculations, which
clarifies the current misunderstandings and will stimulate the further development of
this dream reaction.
Catalytic performance of copper-zeolites in methane oxidation
Copper-zeolites were prepared via wet ion-exchange (see supplementary materials for
details, and Fig. S1-6 and Table S1 for preliminary characterization results) and applied
in methane catalytic oxidation in the presence of water and dioxygen under different
conditions. The reaction temperature was raised from 473 to 523~723 K to promote
methane conversion, and meanwhile, the concentration of dioxygen was regulated (from
impurities in methane and water, and extra dioxygen) to minimize byproduct carbon
dioxide production. Cu-CHA, in significant contrast to other copper-zeolites such as
Cu-MOR and Cu-MFI, exhibited remarkable catalytic activity in MTM (see catalyst and
reaction condition optimization in Fig. S7-21). The catalytic performance of Cu-CHA
was controlled by multiple factors, including but not limited to the reaction temperature,
the dioxygen concentration and the space velocity.
4
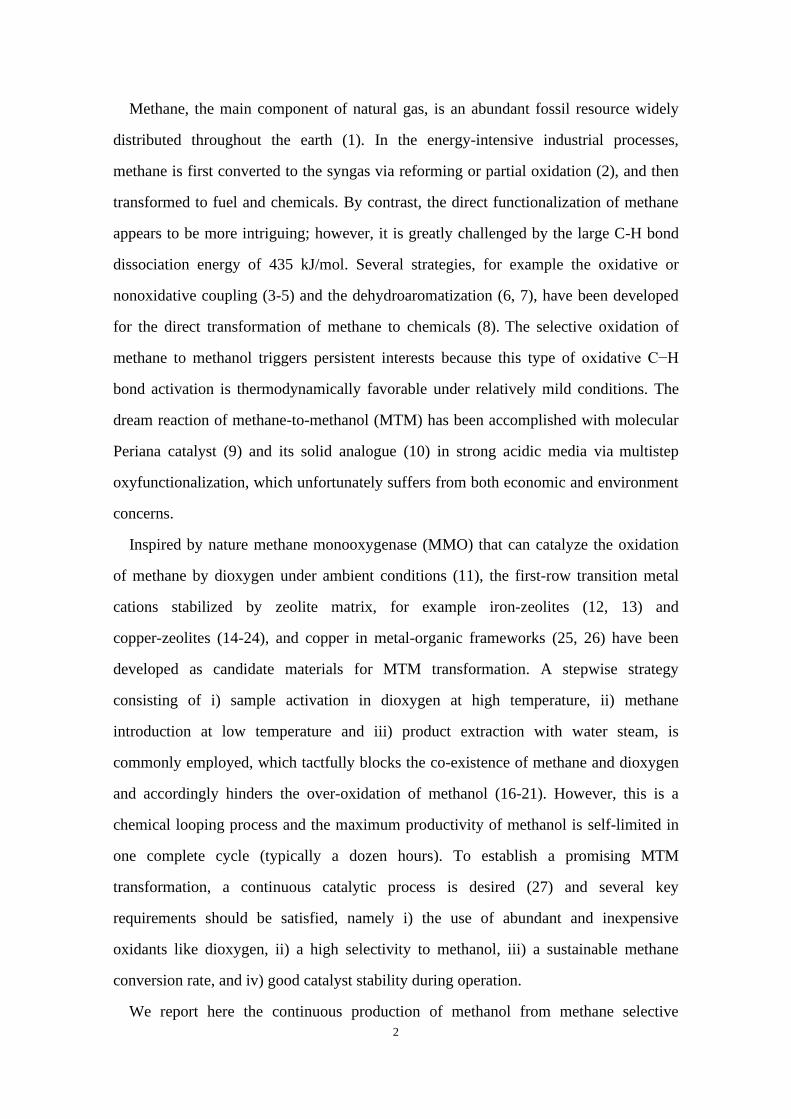
Figure 1. Steady-state methane selective catalytic oxidation to methanol. (a):
Methane conversion on Cu-CHA (square), Cu-MOR (circle) and Cu-MFI (diamond)
catalysts under different conditions. Typical reaction conditions: 0.1 g catalyst, total
flowrate= 60 mL/min; 98% CH4, 0 or 2% H2O, 50~3000 ppm O2; (b):
Time-on-stream behaviors of Cu-CHA in methane catalytic oxidation to methanol
(red column) and carbon dioxide (yellow column). Reaction conditions: 0.1 g
catalyst, total flowrate= 60 mL/min; 98% CH4, 2% H2O, 400 ppm O2, temperature=
573 K.
Experimentally, a methanol space time yield (STY) of 542 mmol/molCu/h (195
µmol/gcat/h) with methanol selectivity of 91 % was achieved at 573 K in the presence 2%
water and 400 ppm dioxygen (Fig. 1a). This STY value is over an order of
magnitude higher than previous reports on copper-zeolites in similar catalytic processes
(Table S2). High reaction temperature of 573 K is crucial to trigger the fast
Cu2+-Cu+-Cu2+ redox cycle (vide infra) to promote methane conversion, and meanwhile
523 573 623 673 723 523 573 623 673 723 523 573 623 673 723 523 573 623 673 723 523 573 623 673/ / / /0
100
200
300
400
500
600
700
ST
Y (
mm
ol/
mo
l Cu·h
)
Temperature (K)
0
20
40
60
80
100
Se
lectiv
ity (%
)
CH4-H2O-O2 (50 ppm) CH4-H2O-O2 (200 ppm) CH4-H2O-O2 (400 ppm) CH4-H2O-O2 (3000 ppm) CH4-O2 (3000 ppm) a
b
0 100 200 300 400 5000
200
400
600
800
1000
Reaction Time (h)
0
20
40
60
80
100
Pro
du
ct y
ield
(m
mo
l/m
ol C
u·h
)S
ele
ctivity
(%)
5
the extremely low dioxygen/methane ratio (<1/2000) is the key to maintain the high
selectivity toward desired product methanol. The time-on-stream behaviors of Cu-CHA
in MTM were further investigated, and both the methanol selectivity and STY were
amazingly stable in 500 hours’ operation (Fig. 1b). These data clearly demonstrate the
potential of a one-step catalytic process for the continuous production of methanol from
methane selective oxidation. Since 2 % water was employed as the reagent, methanol
aqueous solution with mass fraction of 1.2 % could be obtained from MTM (Fig. S22)
and it is valuable for further utilization.
Isotope labelling of reaction pathway
For insight into the reaction pathway of MTM, temperature-programmed surface
reactions (TPSR) with isotope labelling were performed. In the TPSR mode, methane
oxidation started at ~523 K, generating methanol as the desired product and carbon
dioxide as the byproduct on Cu-CHA in the presence of water and dioxygen (Fig. S23;
carbon dioxide was detected as the dominating product on Cu-MOR and Cu-MFI, Fig.
S24 & S25). Dihydrogen was also detected in the outlet, but its amount was lower than
methanol and slightly lagged behind methanol. In the absence of water, carbon
dioxygen was detected as the dominating product and trace methanol could be detected
at above 673 K when water was produced from methane total oxidation (Fig. S26),
indicating the key role of water in MTM. With 13CH4 as the isotopically labelled reagent,
the carbon source of methanol and carbon dioxide was definitely confirmed to be
methane (Fig. S27).
6
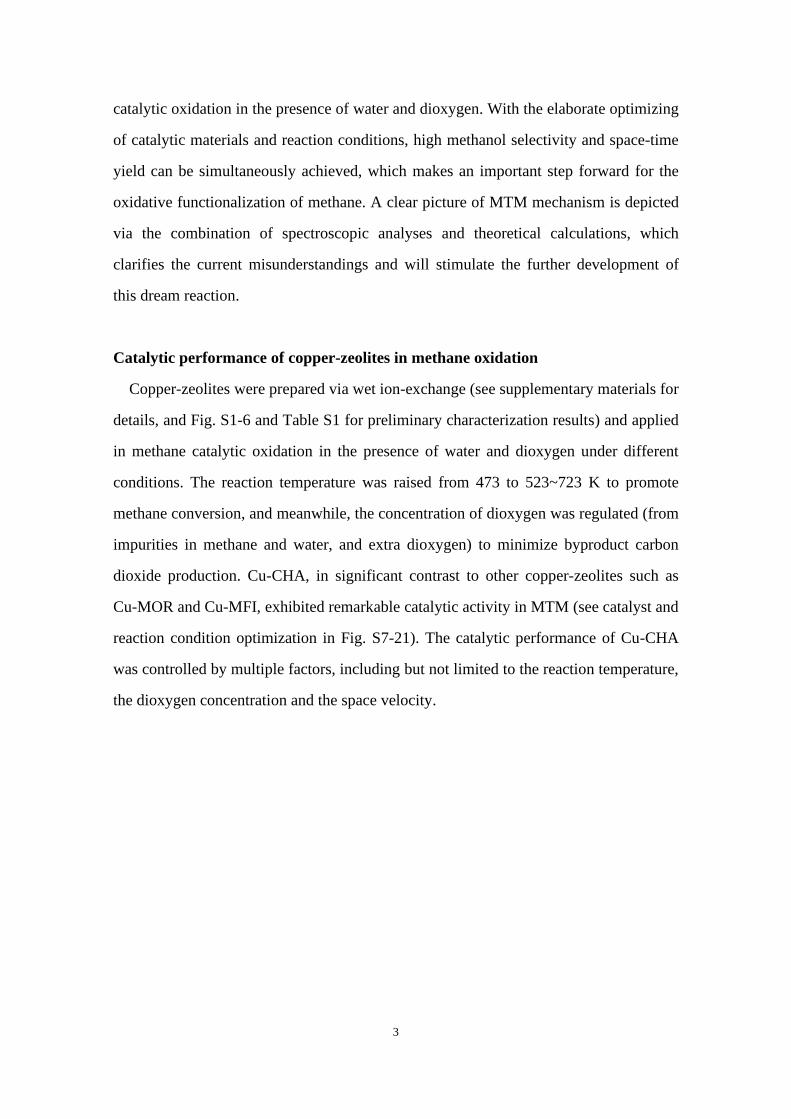
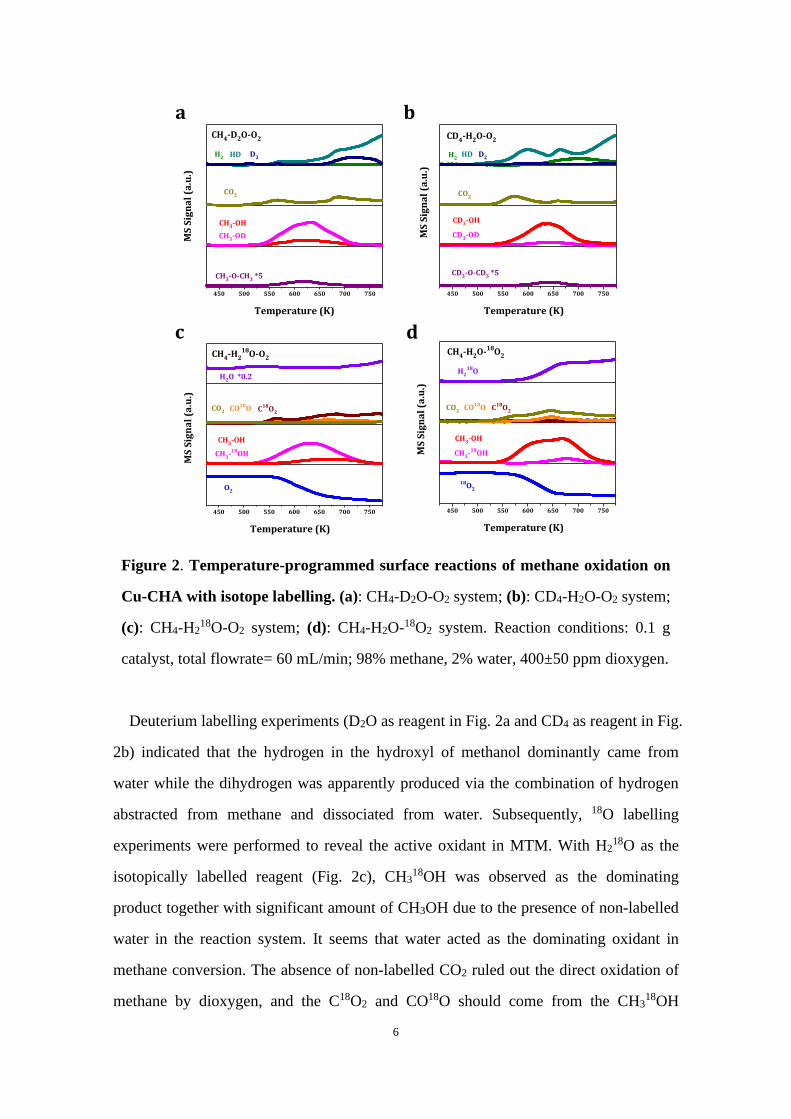
Figure 2. Temperature-programmed surface reactions of methane oxidation on
Cu-CHA with isotope labelling. (a): CH4-D2O-O2 system; (b): CD4-H2O-O2 system;
(c): CH4-H218O-O2 system; (d): CH4-H2O-18O2 system. Reaction conditions: 0.1 g
catalyst, total flowrate= 60 mL/min; 98% methane, 2% water, 400±50 ppm dioxygen.
Deuterium labelling experiments (D2O as reagent in Fig. 2a and CD4 as reagent in Fig.
2b) indicated that the hydrogen in the hydroxyl of methanol dominantly came from
water while the dihydrogen was apparently produced via the combination of hydrogen
abstracted from methane and dissociated from water. Subsequently, 18O labelling
experiments were performed to reveal the active oxidant in MTM. With H218O as the
isotopically labelled reagent (Fig. 2c), CH318OH was observed as the dominating
product together with significant amount of CH3OH due to the presence of non-labelled
water in the reaction system. It seems that water acted as the dominating oxidant in
methane conversion. The absence of non-labelled CO2 ruled out the direct oxidation of
methane by dioxygen, and the C18O2 and CO18O should come from the CH318OH
a b
c d
450 500 550 600 650 700 750
D2HD
CD3-OD
H2
CO2
CD3-OH
MS
Sig
na
l (a
.u.)
Temperature (K)
CD3-O-CD3 *5
CD4-H2O-O2
450 500 550 600 650 700 750
MS
Sig
na
l (a
.u.)
Temperature (K)
CO18O C18O2
CH3-OH
H218O
CO2
CH3-18OH
18O2
CH4-H2O-18O2
450 500 550 600 650 700 750
CH3-OH
CH3-OD
CO2
MS
Sig
na
l (a
.u.)
Temperature (K)
CH3-O-CH3 *5
D2HDH2
CH4-D2O-O2
450 500 550 600 650 700 750
O2
CO18O C18O2
CH3-OH
H2O *0.2
CO2
CH3-18OH
MS
Sig
na
l (a
.u.)
Temperature (K)
CH4-H218O-O2
7
reforming (major route, Equation 1) and oxidation (minor route, Fig. S28, Equation 2),
respectively. Meanwhile, the consumption of non-labelled dioxygen was observed
at >573 K, confirming the participation of dioxygen in MTM. With 18O2 as the
isotopically labelled reagent (Fig. 2d), the oxygen in methanol product was further
confirmed to be from water and the carbon dioxide byproduct mainly from methanol
reforming. The consumption of 18O2 and the formation of H218O were observed at >573
K, demonstrating the pathway of dioxygen participation in the reaction.
CH3OH + H2O → CO2 + 3H2 (1)
2CH3OH + 3O2 → 2CO2 + 4H2O (2)
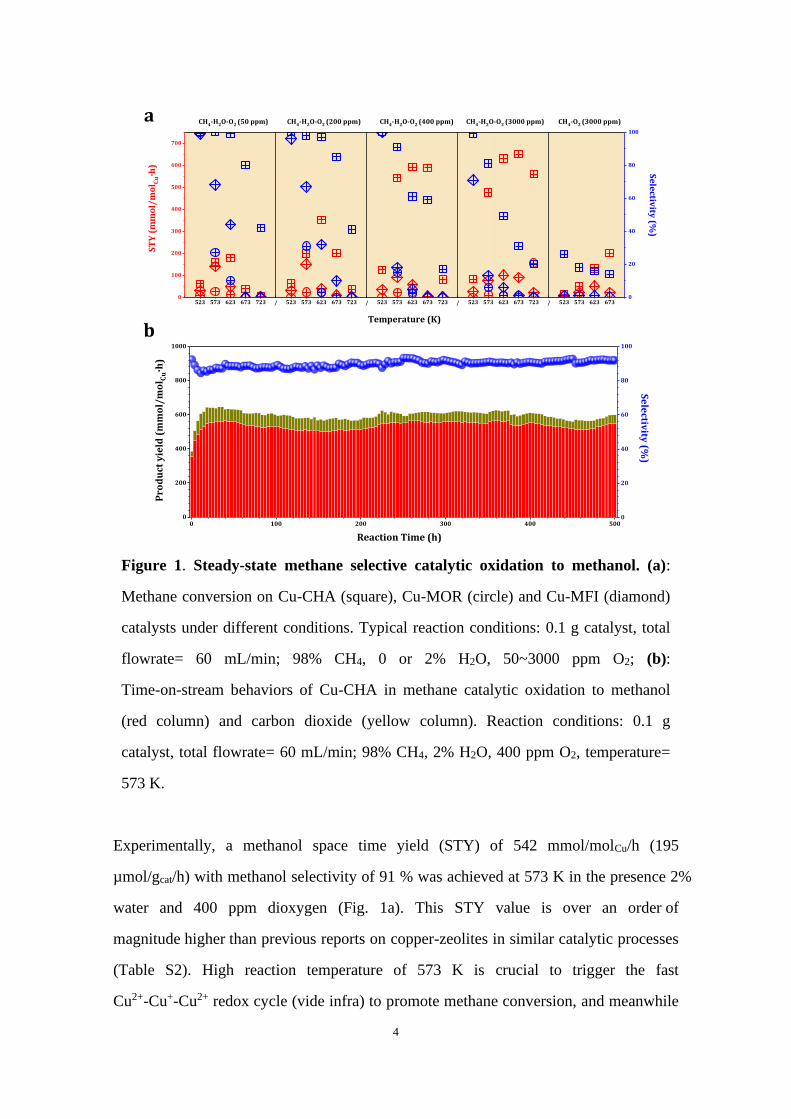
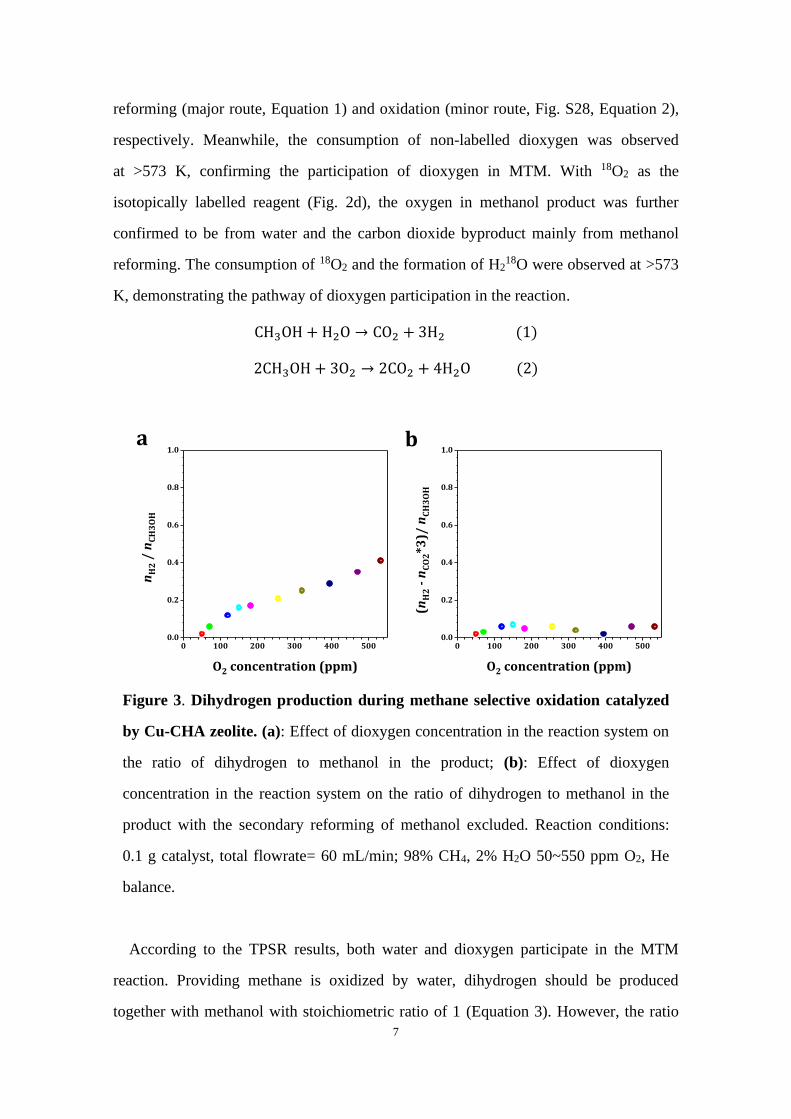
Figure 3. Dihydrogen production during methane selective oxidation catalyzed
by Cu-CHA zeolite. (a): Effect of dioxygen concentration in the reaction system on
the ratio of dihydrogen to methanol in the product; (b): Effect of dioxygen
concentration in the reaction system on the ratio of dihydrogen to methanol in the
product with the secondary reforming of methanol excluded. Reaction conditions:
0.1 g catalyst, total flowrate= 60 mL/min; 98% CH4, 2% H2O 50~550 ppm O2, He
balance.
According to the TPSR results, both water and dioxygen participate in the MTM
reaction. Providing methane is oxidized by water, dihydrogen should be produced
together with methanol with stoichiometric ratio of 1 (Equation 3). However, the ratio
0 100 200 300 400 5000.0
0.2
0.4
0.6
0.8
1.0
nH
2 /
nC
H3
OH
O2 concentration (ppm)
0 100 200 300 400 5000.0
0.2
0.4
0.6
0.8
1.0
(nH
2 -
nC
O2*3
)/ n
CH
3O
H
O2 concentration (ppm)
ba
8
of dihydrogen to methanol was far below 1 and also depended on the concentration of
dioxygen in the reaction system (Fig. 3a), i.e. nH2/nCH3OH ratio increased with increasing
dioxygen concentration from 50 to 550 ppm (high methanol selectivity of >85% was
achieved in all cases). Considering that methanol could be further transformed to carbon
dioxide via secondary reforming (Equation 1), the dihydrogen contribution from
reforming was further deducted to give the intrinsic nH2/nCH3OH ratio in methane
selective oxidation. It is amazing to reveal that only very low amount of dihydrogen was
produced along with methanol formation, i.e. (nH2-nCO2*3)/nCH3OH < 0.1, at all dioxygen
concentrations of 50~550 ppm. That is, dihydrogen was mainly produced from
secondary methanol reforming instead of methane direct oxidation, in good agreement
with the lagged formation of dihydrogen (Fig. S23). Now, we can present a picture of
MTM pathway in the presence of water and dioxygen (shown as [O] for simplicity), as
shown in Equation 4. From the view of element balance, methane can be oxidized by
[O], but the presence of water is essential to initiate the reaction and becomes the main
source of oxygen in methanol.
CH4 + H2O → CH3OH + H2 (3)
CH4 + H2O + [O] → CH3OH + H2O (4)
Dynamic changes in copper sites during reaction
The active copper sites in Cu-zeolites for MTM have been hotly debated (14, 16-20,
28-32). The topology and composition of zeolite host show significant impacts on the
structure of cooper sites, which also undergo dynamic changes under various conditions
(33-35). Here, the dynamic changes of copper sites in CHA under reaction relevant
conditions were investigated by ultraviolet-visible-near infrared (UV-Vis-NIR)
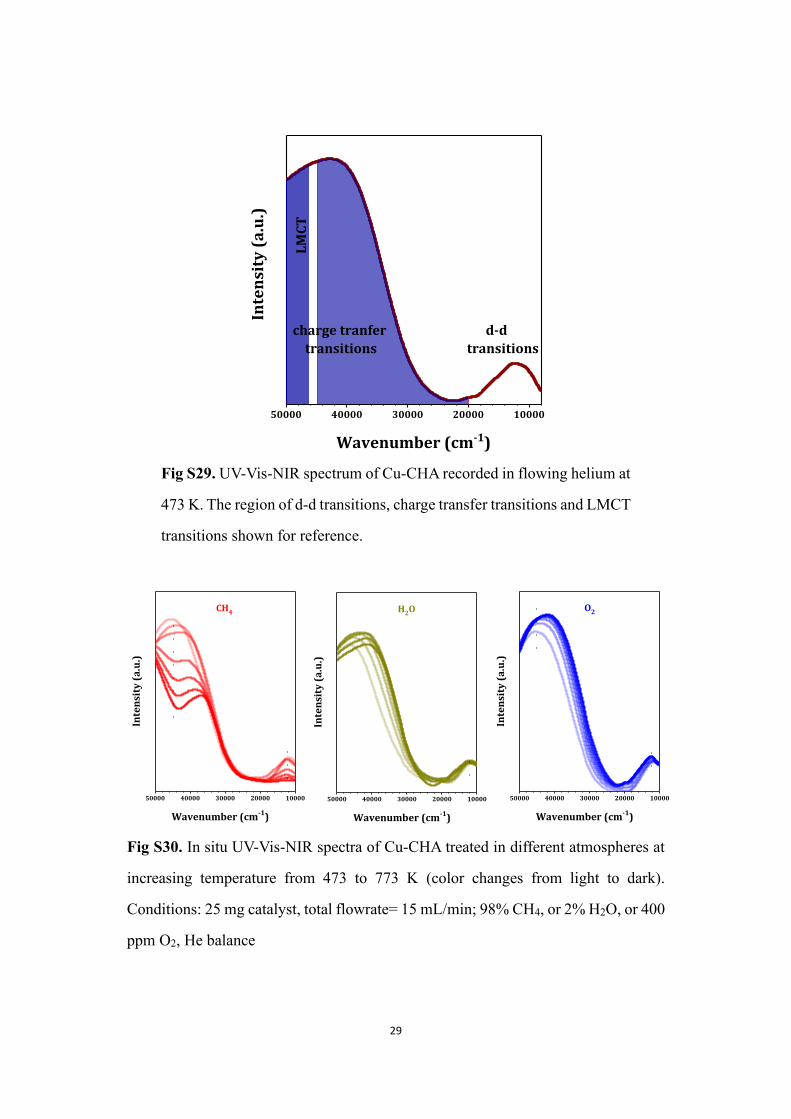
spectroscopy. The spectrum of Cu-CHA (473 K in He, Fig. S29) showed clear d-d
transitions of Cu2+ (3d9) at ~12000 cm-1 and ligand-to-metal charge transfer (LMCT)
transitions of isolated Cu2+ (O2-Cu2+→O-Cu+) at 50000~45000 cm-1 (36-38). The
Cu-CHA sample was then treated in different atmospheres at increasing temperature
from 473 to 773 K to demonstrate the dynamic changes of copper sites (Fig. S30).
9
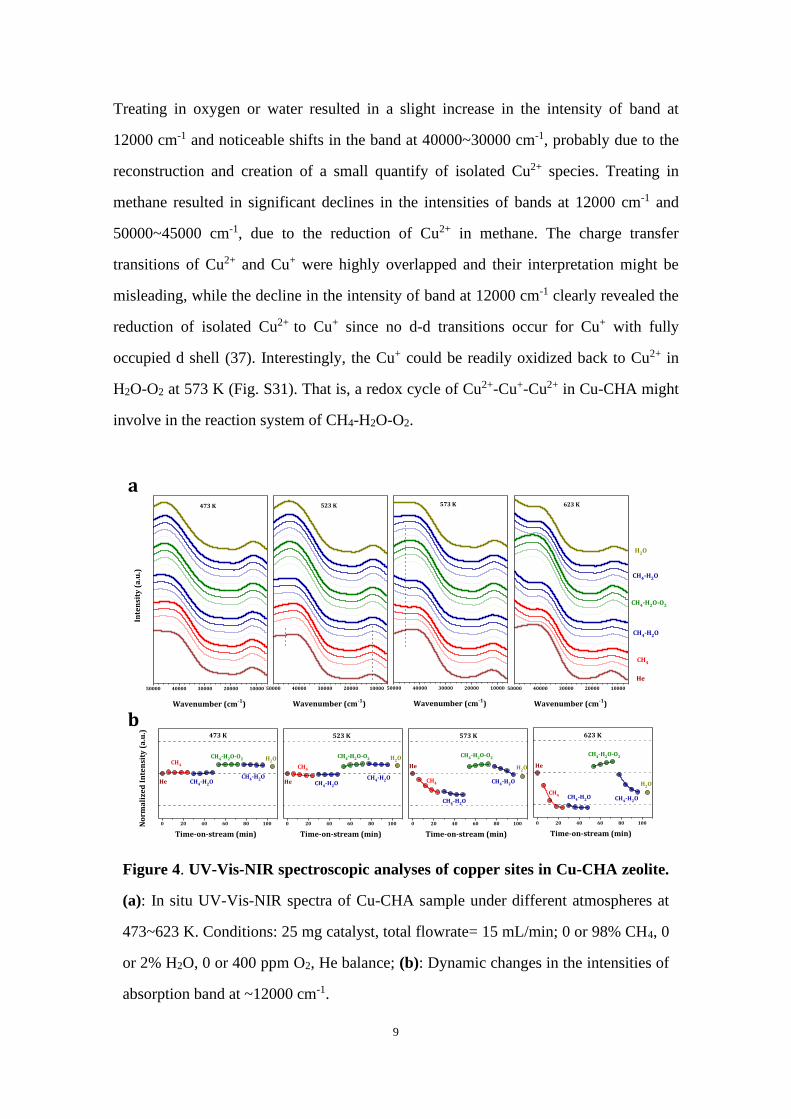
Treating in oxygen or water resulted in a slight increase in the intensity of band at
12000 cm-1 and noticeable shifts in the band at 40000~30000 cm-1, probably due to the
reconstruction and creation of a small quantify of isolated Cu2+ species. Treating in
methane resulted in significant declines in the intensities of bands at 12000 cm-1 and
50000~45000 cm-1, due to the reduction of Cu2+ in methane. The charge transfer
transitions of Cu2+ and Cu+ were highly overlapped and their interpretation might be
misleading, while the decline in the intensity of band at 12000 cm-1 clearly revealed the
reduction of isolated Cu2+ to Cu+ since no d-d transitions occur for Cu+ with fully
occupied d shell (37). Interestingly, the Cu+ could be readily oxidized back to Cu2+ in
H2O-O2 at 573 K (Fig. S31). That is, a redox cycle of Cu2+-Cu+-Cu2+ in Cu-CHA might
involve in the reaction system of CH4-H2O-O2.
Figure 4. UV-Vis-NIR spectroscopic analyses of copper sites in Cu-CHA zeolite.
(a): In situ UV-Vis-NIR spectra of Cu-CHA sample under different atmospheres at
473~623 K. Conditions: 25 mg catalyst, total flowrate= 15 mL/min; 0 or 98% CH4, 0
or 2% H2O, 0 or 400 ppm O2, He balance; (b): Dynamic changes in the intensities of
absorption band at ~12000 cm-1.
a
b
50000 40000 30000 20000 10000
H2O
CH4-H2O
CH4-H2O-O2
CH4-H2O
CH4
Wavenumber (cm-1)
Inte
nsi
ty (
a.u
.)
He
473 K
50000 40000 30000 20000 10000
H2O
CH4-H2O
CH4-H2O-O2
CH4-H2O
CH4
Wavenumber (cm-1)
Inte
nsi
ty (
a.u
.)
He
523 K
50000 40000 30000 20000 10000
H2O
CH4-H2O
CH4-H2O-O2
CH4-H2O
CH4
Wavenumber (cm-1)
Inte
nsi
ty (
a.u
.)
He
573 K
50000 40000 30000 20000 10000
H2O
CH4-H2O
CH4-H2O-O2
CH4-H2O
CH4
Wavenumber (cm-1)
Inte
nsi
ty (
a.u
.)
He
623 K
0 20 40 60 80 100
H2O
CH4-H2O
CH4-H2O-O2
CH4-H2O
CH4
Time-on-stream (min)
No
rma
lize
d I
nte
nsi
ty (
a.u
.)
He
473 K
0 20 40 60 80 100
H2O
CH4-H2O
CH4-H2O-O2
CH4-H2O
CH4
Time-on-stream (min)
No
rma
lize
d I
nte
nsi
ty (
a.u
.)
He
573 K
0 20 40 60 80 100
H2O
CH4-H2O
CH4-H2O-O2
CH4-H2OCH4
Time-on-stream (min)
No
rma
lize
d I
nte
nsi
ty (
a.u
.)
He
623 K
0 20 40 60 80 100
H2O
CH4-H2O
CH4-H2O-O2
CH4-H2O
CH4
Time-on-stream (min)
No
rma
lize
d I
nte
nsi
ty (
a.u
.)
He
523 K
10
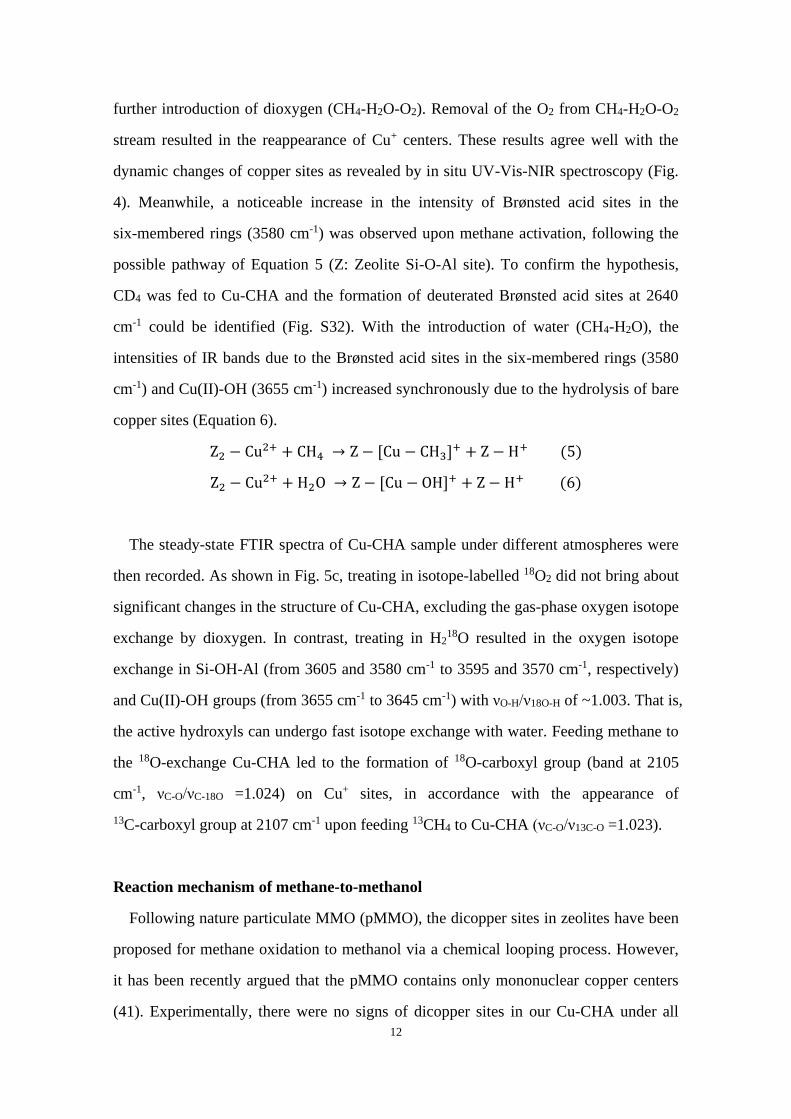
The dynamic changes of copper species in Cu-CHA under different atmospheres at a
constant temperature were then focused. At low temperatures of 473 and 523 K, the
introduction of dioxygen (CH4-H2O-O2) resulted in the oxidation of Cu+ species (those
existed in parent Cu-CHA due to the auto-reduction of Cu2+ in helium) to Cu2+, while
the Cu2+ species were quite stable in H2O or CH4-H2O (Fig. 4a). At high temperatures
of 573 and 623 K, the dynamic changes of copper species between the isolated Cu2+ and
Cu+ under different atmospheres were clearly demonstrated (Fig. 4b). Typically,
isolated Cu2+ species in Cu-CHA were quickly (partially) reduced by methane to Cu+,
which could not be oxidized back to Cu2+ simply by water. On the other hand, the
introduction of trace dioxygen resulted in the fast re-oxidation of Cu+ to Cu2+.
According to these results, isolated copper species should exist in the form of stable
Cu2+ in Cu-CHA in CH4-H2O-O2 at 473~623 K and the fast redox cycle of
Cu2+-Cu+-Cu2+ should involve in MTM reaction at 573~623 K. This should be the key
reason for the much higher MTM activity achieved in this study in comparison with
literature reports under slightly different reaction conditions (23, 24). Besides, no
fingerprint absorption features for dicopper species in the region of 20000~25000 cm-1
(28, 29) were observed under all employed conditions.
11
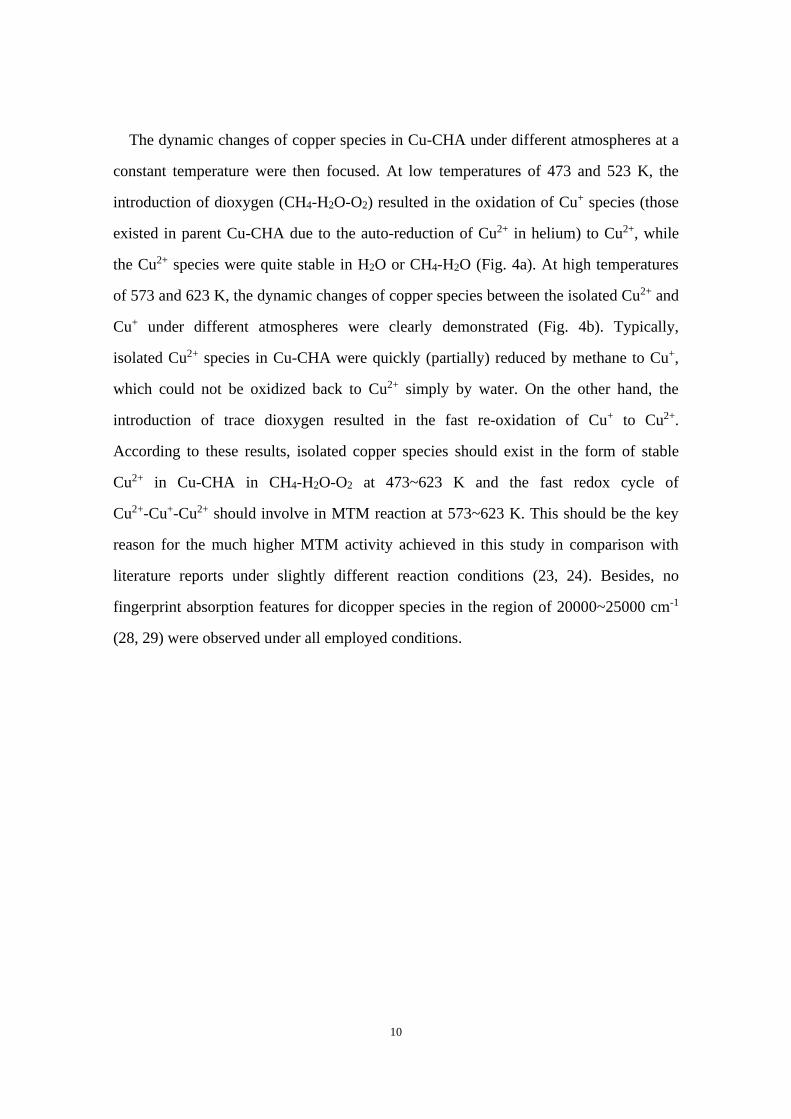
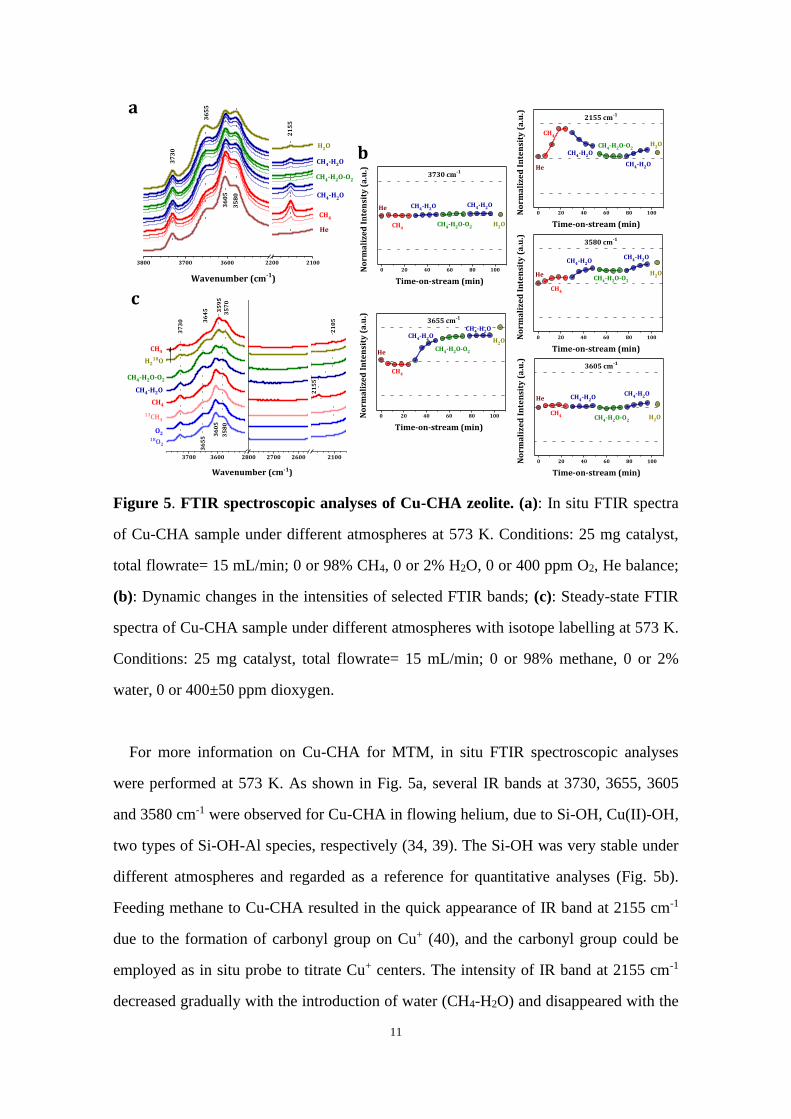
Figure 5. FTIR spectroscopic analyses of Cu-CHA zeolite. (a): In situ FTIR spectra
of Cu-CHA sample under different atmospheres at 573 K. Conditions: 25 mg catalyst,
total flowrate= 15 mL/min; 0 or 98% CH4, 0 or 2% H2O, 0 or 400 ppm O2, He balance;
(b): Dynamic changes in the intensities of selected FTIR bands; (c): Steady-state FTIR
spectra of Cu-CHA sample under different atmospheres with isotope labelling at 573 K.
Conditions: 25 mg catalyst, total flowrate= 15 mL/min; 0 or 98% methane, 0 or 2%
water, 0 or 400±50 ppm dioxygen.
For more information on Cu-CHA for MTM, in situ FTIR spectroscopic analyses
were performed at 573 K. As shown in Fig. 5a, several IR bands at 3730, 3655, 3605
and 3580 cm-1 were observed for Cu-CHA in flowing helium, due to Si-OH, Cu(II)-OH,
two types of Si-OH-Al species, respectively (34, 39). The Si-OH was very stable under
different atmospheres and regarded as a reference for quantitative analyses (Fig. 5b).
Feeding methane to Cu-CHA resulted in the quick appearance of IR band at 2155 cm-1
due to the formation of carbonyl group on Cu+ (40), and the carbonyl group could be
employed as in situ probe to titrate Cu+ centers. The intensity of IR band at 2155 cm-1
decreased gradually with the introduction of water (CH4-H2O) and disappeared with the
3800 3700 3600 2200 2100
21
55
35
80
36
05
36
55
H2O
CH4-H2O
CH4-H2O-O2
CH4-H2O
CH4
Wavenumber (cm-1)
He
37
30
3700 3600 2800 2700 2600 2100
21
55
21
05
CH4-H2O-O2
CH4-H2O
CH4
H218O
CH4
35
70
35
95
36
45
13CH4
O2
18O2
36
55
37
30
35
80
36
05
Wavenumber (cm-1)
0 20 40 60 80 100
H2O
CH4-H2O
CH4-H2O-O2
CH4-H2O
CH4
Time-on-stream (min)
No
rma
lize
d I
nte
nsi
ty (
a.u
.)He
3655 cm-1
0 20 40 60 80 100
H2O
CH4-H2O
CH4-H2O-O2
CH4-H2O
CH4
Time-on-stream (min)
No
rma
lize
d I
nte
nsi
ty (
a.u
.)
He
3730 cm-1
0 20 40 60 80 100
H2O
CH4-H2O
CH4-H2O-O2CH4-H2O
CH4
Time-on-stream (min)
No
rma
lize
d I
nte
nsi
ty (
a.u
.)
He
2155 cm-1
0 20 40 60 80 100
H2O
CH4-H2O
CH4-H2O-O2
CH4-H2O
CH4
Time-on-stream (min)
No
rma
lize
d I
nte
nsi
ty (
a.u
.)
He
3605 cm-1
0 20 40 60 80 100
H2O
CH4-H2O
CH4-H2O-O2
CH4-H2O
CH4
Time-on-stream (min)
No
rma
lize
d I
nte
nsi
ty (
a.u
.)
He
3580 cm-1
a
c
b
12
further introduction of dioxygen (CH4-H2O-O2). Removal of the O2 from CH4-H2O-O2
stream resulted in the reappearance of Cu+ centers. These results agree well with the
dynamic changes of copper sites as revealed by in situ UV-Vis-NIR spectroscopy (Fig.
4). Meanwhile, a noticeable increase in the intensity of Brønsted acid sites in the
six-membered rings (3580 cm-1) was observed upon methane activation, following the
possible pathway of Equation 5 (Z: Zeolite Si-O-Al site). To confirm the hypothesis,
CD4 was fed to Cu-CHA and the formation of deuterated Brønsted acid sites at 2640
cm-1 could be identified (Fig. S32). With the introduction of water (CH4-H2O), the
intensities of IR bands due to the Brønsted acid sites in the six-membered rings (3580
cm-1) and Cu(II)-OH (3655 cm-1) increased synchronously due to the hydrolysis of bare
copper sites (Equation 6).
Z2 − Cu2+ + CH4 → Z − [Cu − CH3]+ + Z − H+ (5)
Z2 − Cu2+ + H2O → Z − [Cu − OH]+ + Z − H+ (6)
The steady-state FTIR spectra of Cu-CHA sample under different atmospheres were
then recorded. As shown in Fig. 5c, treating in isotope-labelled 18O2 did not bring about
significant changes in the structure of Cu-CHA, excluding the gas-phase oxygen isotope
exchange by dioxygen. In contrast, treating in H218O resulted in the oxygen isotope
exchange in Si-OH-Al (from 3605 and 3580 cm-1 to 3595 and 3570 cm-1, respectively)
and Cu(II)-OH groups (from 3655 cm-1 to 3645 cm-1) with νO-H/ν18O-H of ~1.003. That is,
the active hydroxyls can undergo fast isotope exchange with water. Feeding methane to
the 18O-exchange Cu-CHA led to the formation of 18O-carboxyl group (band at 2105
cm-1, νC-O/νC-18O =1.024) on Cu+ sites, in accordance with the appearance of
13C-carboxyl group at 2107 cm-1 upon feeding 13CH4 to Cu-CHA (νC-O/ν13C-O =1.023).
Reaction mechanism of methane-to-methanol
Following nature particulate MMO (pMMO), the dicopper sites in zeolites have been
proposed for methane oxidation to methanol via a chemical looping process. However,
it has been recently argued that the pMMO contains only mononuclear copper centers
(41). Experimentally, there were no signs of dicopper sites in our Cu-CHA under all
13
conditions employed (Fig. 4a). The dicopper sites, even if might exist under certain
conditions, would undergo hydrolysis to monomeric cooper species in excess water. A
series of Cu-CHA samples with different copper loadings were further prepared and
their specific activity was compared. As shown in Fig. S33, the site specific methanol
yields were in the similar high level of 400~600 mmol/molCu/h at copper loadings of
0.6~2.3 wt.% while the methanol yield decreased to <300 mmol/molCu/h with further
increasing copper loading to 3.5 wt.%. In this context, it is rational to propose
monomeric cooper species, i.e. Cu(II)-OH observed by FTIR spectroscopy (Fig. 5), as
the catalytically active sites for MTM, although the formation of dicopper sites could
not be fully excluded.
a
b c
-300
-200
-100
0
100
-80
-292
-2
-101
-145
2
-48
6
-95
TS-DTS-CTS-B
+CH4
-210
-204
-42
-16
64
M10
M9
M8
M7
M6
M5
M4
M1
M3
M2
+CH4
-H2O
-CH
3O
H
+ O
2
-CH
3O
H
+H2 O
En
erg
y (
kJ/
mo
l)
TS-A
-26
TS-A TS-DTS-B TS-C
M3 M7 M9M5 M6M4
-300
-200
-100
0
+CH4
-204
-306
-31
-90
-64
-13
-95
-74
-CH
3O
H
D5
TS-F
D4
D3
TS-E
D2
D1
En
erg
y (
kJ/
mo
l)
TS-E TS-F
D5D1 D2
Cu-Monomer Cu-Dimer
TS-A
TS-B
TS-C
TS-D
TS-E
TS-F
M2M1
M3
M4
M5
M6
M7
M8
M9
D1 D2
D3
D4
D5
D0M0
14
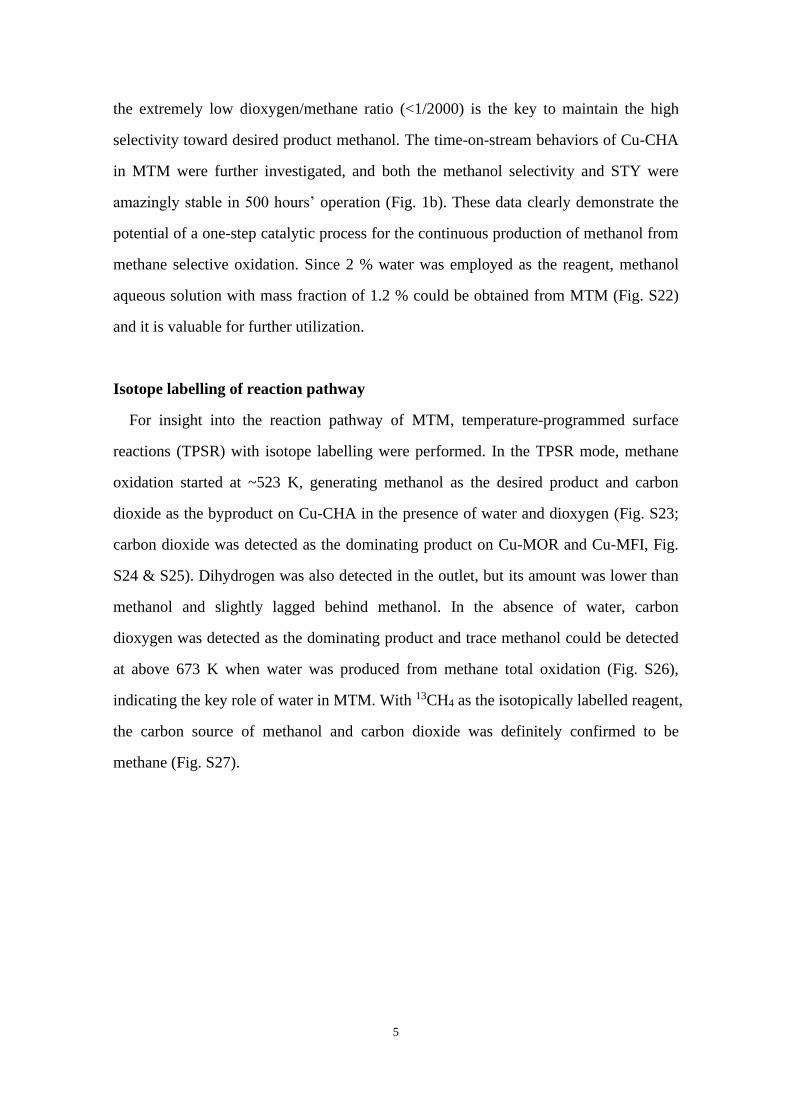
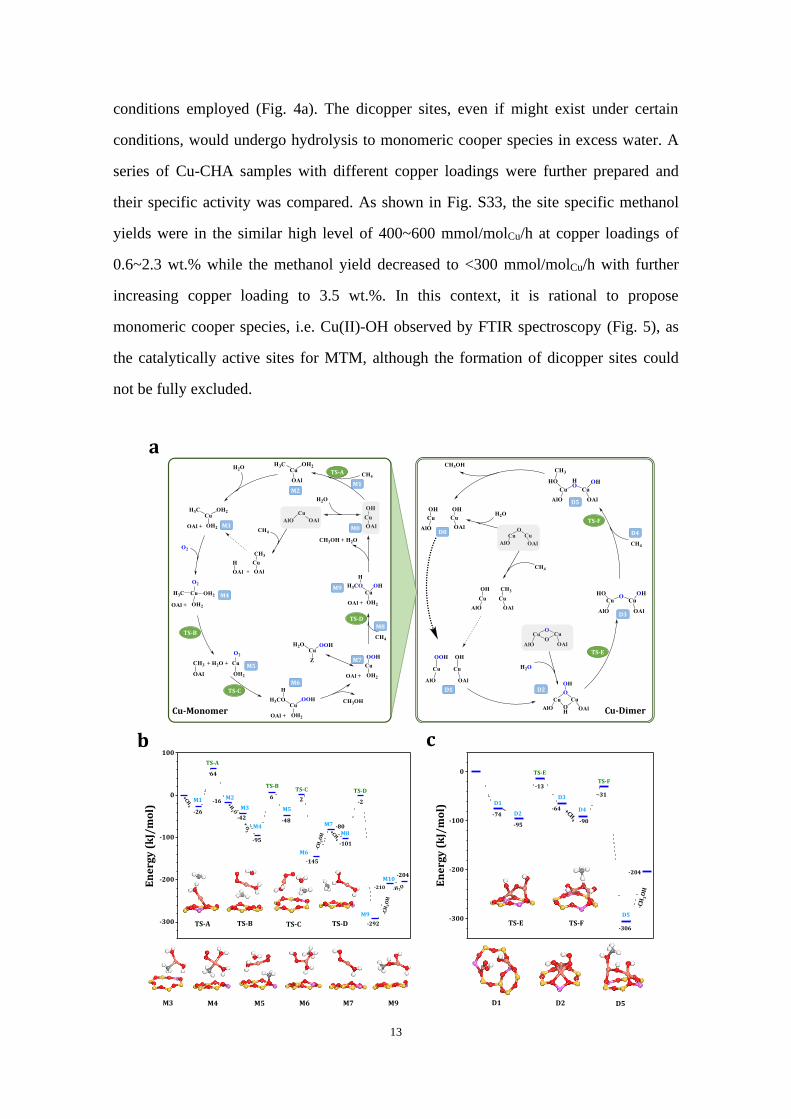
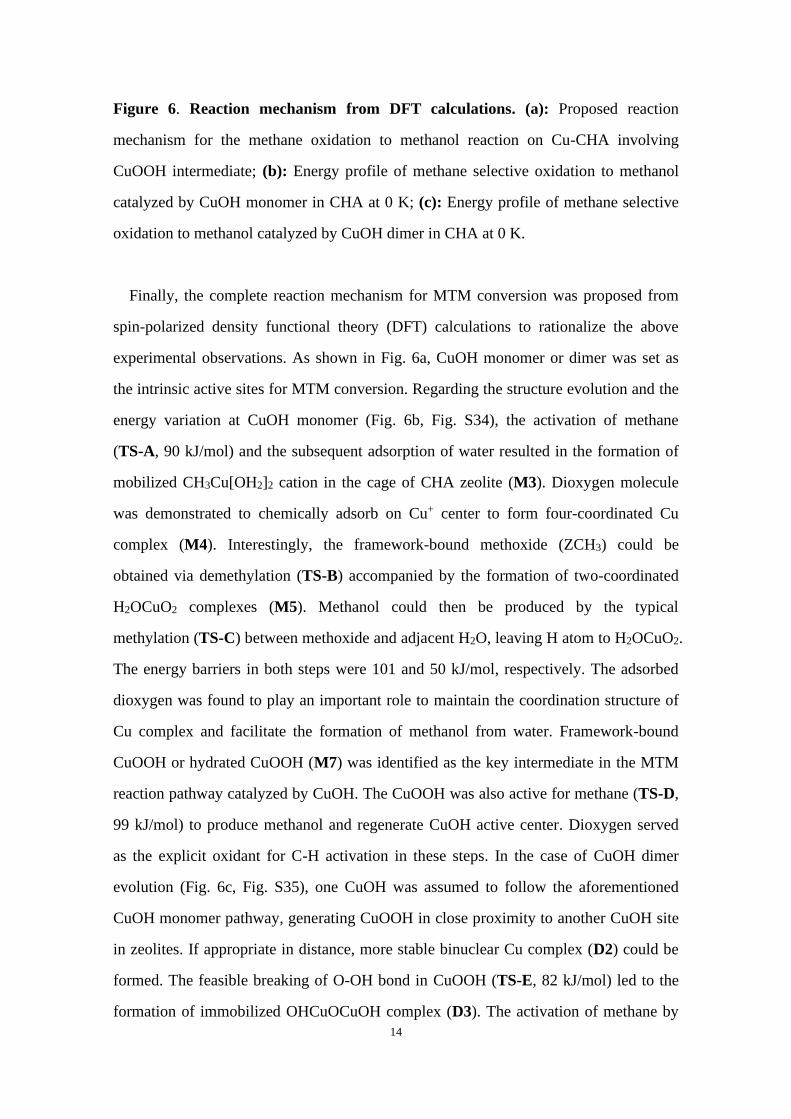
Figure 6. Reaction mechanism from DFT calculations. (a): Proposed reaction
mechanism for the methane oxidation to methanol reaction on Cu-CHA involving
CuOOH intermediate; (b): Energy profile of methane selective oxidation to methanol
catalyzed by CuOH monomer in CHA at 0 K; (c): Energy profile of methane selective
oxidation to methanol catalyzed by CuOH dimer in CHA at 0 K.
Finally, the complete reaction mechanism for MTM conversion was proposed from
spin-polarized density functional theory (DFT) calculations to rationalize the above
experimental observations. As shown in Fig. 6a, CuOH monomer or dimer was set as
the intrinsic active sites for MTM conversion. Regarding the structure evolution and the
energy variation at CuOH monomer (Fig. 6b, Fig. S34), the activation of methane
(TS-A, 90 kJ/mol) and the subsequent adsorption of water resulted in the formation of
mobilized CH3Cu[OH2]2 cation in the cage of CHA zeolite (M3). Dioxygen molecule
was demonstrated to chemically adsorb on Cu+ center to form four-coordinated Cu
complex (M4). Interestingly, the framework-bound methoxide (ZCH3) could be
obtained via demethylation (TS-B) accompanied by the formation of two-coordinated
H2OCuO2 complexes (M5). Methanol could then be produced by the typical
methylation (TS-C) between methoxide and adjacent H2O, leaving H atom to H2OCuO2.
The energy barriers in both steps were 101 and 50 kJ/mol, respectively. The adsorbed
dioxygen was found to play an important role to maintain the coordination structure of
Cu complex and facilitate the formation of methanol from water. Framework-bound
CuOOH or hydrated CuOOH (M7) was identified as the key intermediate in the MTM
reaction pathway catalyzed by CuOH. The CuOOH was also active for methane (TS-D,
99 kJ/mol) to produce methanol and regenerate CuOH active center. Dioxygen served
as the explicit oxidant for C-H activation in these steps. In the case of CuOH dimer
evolution (Fig. 6c, Fig. S35), one CuOH was assumed to follow the aforementioned
CuOH monomer pathway, generating CuOOH in close proximity to another CuOH site
in zeolites. If appropriate in distance, more stable binuclear Cu complex (D2) could be
formed. The feasible breaking of O-OH bond in CuOOH (TS-E, 82 kJ/mol) led to the
formation of immobilized OHCuOCuOH complex (D3). The activation of methane by
15
OHCuOCuOH (TS-F) only needed to overcome a low barrier of ~59 kJ/mol to produce
methanol and to regenerate CuOH dimer. Comparing the kinetics in Cu monomer and
dimer pathways (TS-D versus TS-F), it seemed that HOCuOCuOH might be more
active than CuOOH for methane activation. Herein, we would like to highlight that
CuOH and the previous proposed active species like Cu(II), CuOCu, CuOOCu could be
readily interconverted by the participation of methane or water (Fig. 6a, Figs. S36-39).
The proposed reaction pathway originated from CuOH provides an alternative to
produce methanol without dihydrogen (Fig. 3b) and reveals the direct role of dioxygen
in MTM conversion. In the experiments, the fast redox cycle of Cu2+-Cu+-Cu2+ during
MTM reaction was clearly identified (Fig. 4) and the presence of Cu+ was proved to be
necessary for the chemisorption of dioxygen by theoretical calculations (Fig. 6). That is,
the fast redox cycle of Cu2+-Cu+-Cu2+ is the origination of the high activity of Cu-CHA
under our reaction conditions. According to theoretical calculations, the oxygen in
methanol might come from both water and dioxygen (see dioxygen labelling in Fig. 6a),
while the fast oxygen isotope exchange between CuOH and water (Fig. 5c) made water
as the apparent oxygen source of methanol (Fig. 2c, 2d). Water is known as a must for
the methane-to-methanol conversion while it plays an important role in the catalytic
route by hydrolyzing the Cu-O bond, which resulted in the formation of mobilized
CH3Cu[OH2]2 cations from framework-bound species and the transformation of
dicopper species (CuOCu, CuOOCu) to monomeric cooper species (CuOH).
Conclusions
A catalytic route of methane selective oxidation to methanol in the presence of water
and dioxygen was demonstrated, and the specific roles of water and dioxygen were
clearly explicated. With the elaborate optimizing of catalyst and reaction parameters, a
state-of-the-art methanol space-time yield of 543 mmol/molCu/h with methanol
selectivity of 91 % was achieved at 573 K with a Cu-CHA catalyst. The reaction
pathway of MTM was established by kinetic analyses with isotope labelling. The
apparent oxygen and hydrogen source of hydroxyls in methanol was determined to be
water while dioxygen indeed participated in the reaction through reducing to water,
16
resulting in the unique process of water-involved methane oxidation by dioxygen. The
fast redox cycle of Cu2+-Cu+-Cu2+ was identified by in situ spectroscopy under certain
reaction conditions and revealed to be closely related to the high catalytic activity of
Cu-CHA.
On the basis of all the experiment fragments, a detailed mechanism of MTM was
interpreted via density functional theory calculations. Both CuOH monomer and dimer
in Cu-CHA could catalyze the selective oxidation of methane to methanol, with
CuOOH as the key intermediate. The previous proposed active species like Cu(II),
CuOH, CuOCu and CuOOCu could be readily interconverted with the participation of
methane or water under reaction conditions. These findings have addressed most
misconceptions in MTM reaction over copper-zeolites (42) and will make a major step
forward in methane oxidative functionalization.
References
1. McFarland, E. Unconventional chemistry for unconventional natural gas. Science 338,
340-342 (2012).
2. Sun, L., Wang, Y., Guan, N. & Li, L. Methane activation and utilization: Current
status and future challenges. Energy Technol. 8, 1900628 (2020).
3. Keller, G. E. & Bhasin, M. M. Synthesis of ethylene via oxidative coupling of
methane, J. Catal. 73, 9-19 (1982).
4. Ito, T. & Lunsford, J. H. Synthesis of ethylene and ethane by partial oxidation of
methane over lithium-doped magnesium oxide. Nature 314, 721-722 (1985).
5. Guo, X. et al. nonoxidative conversion of methane to ethylene, aromatics, and
hydrogen. Science 344, 616-619 (2014).
6. Spivey, J. J. & Hutchings, G. Catalytic aromatization of methane. Chem. Soc. Rev. 43,
792-803 (2014).
7. Gao, J. et al. Identification of molybdenum oxide nanostructures on zeolites for
natural gas conversion. Science 348, 686-690 (2015).
8. Horn, R. & Schlögl, R. Methane activation by heterogeneous catalysis. Catal. Lett.
145, 23-39 (2015).
17
9. Periana, R. A. et al. Platinum catalysts for the high-yield oxidation of methane to a
methanol derivative. Science 280, 560-564 (1998).
10. Palkovits, R., Antonietti, M., Kuhn, P., Thomas, A. & Schüth, F. Solid catalysts for
the selective low-temperature oxidation of methane to methanol. Angew. Chem. Int. Ed.
48, 6909-6912 (2009).
11. Sirajuddin, S. & Rosenzweig, A. C. Enzymatic oxidation of methane. Biochemistry
54, 2283-2294 (2015).
12. Parfenov, M. V., Starokon, E. V., Pirutko, L. V. & Panov, G. I. Quasicatalytic and
catalytic oxidation of methane to methanol by nitrous oxide over FeZSM-5 zeolite, J.
Catal. 318, 14-21 (2014).
13. Snyder, B. E. R. et al. The active site of low temperature methane hydroxylation in
iron containing zeolites. Nature 536, 317-321 (2016).
14. Groothaert, M. H., Smeets, P. J., Sels, B. F., Jacobs, P. A. & Schoonheydt, R. A.
Selective oxidation of methane by the bis(µ-oxo)dicopper core stabilized on ZSM-5 and
mordenite zeolites. J. Am. Chem. Soc. 127, 1394-1395 (2005).
15. Alayon, E. M., Nachtegaal, M., Ranocchiari, M. & van Bokhoven, J. A. Catalytic
conversion of methane to methanol over Cu-mordenite. Chem. Commun. 48, 404-406
(2012).
16. Wulfers, M. J., Teketel, S., Ipek, B. & Lobo, R. F. Conversion of methane to
methanol on copper-containing small-pore zeolites and zeotypes. Chem. Commun. 21,
4447-4450 (2015).
17. Grundner, S. et al. Single-site trinuclear copper oxygen clusters in mordenite for
selective conversion of methane to methanol. Nat. Commun. 6, 7546-7554 (2015).
18. Sushkevich, V. L., Palagin, D., Ranocchiari, M. & van Bokhoven, J. A. Selective
anaerobic oxidation of methane enables direct synthesis of methanol. Science 356,
523-527 (2017).
19. Sushkevich, V. L., Palagin, D. & van Bokhoven, J. A. The effect of the active-site
structure on the activity of copper mordenite in the aerobic and anaerobic conversion of
methane into methanol. Angew. Chem. Int. Ed. 57, 8906-8910 (2018).
18
20. Pappas, D. K. et al. Methane to methanol: Structure-activity relationships for
Cu-CHA. J. Am. Chem. Soc. 139, 14961-14975 (2017).
21. Pappas, D. K. et al. The nuclearity of the active site for methane to methanol
conversion in Cu-mordenite: A quantitative assessment. J. Am. Chem. Soc. 140,
15270-15278 (2018).
22. Ipek, B. & Lobo, R. F. Catalytic conversion of methane to methanol on Cu-SSZ-13
using N2O as oxidant. Chem. Commun. 52, 13401-13404 (2016).
23. Narsimhan, K., Iyoki, K., Dinh, K. & Román-Leshkov, Y. Catalytic oxidation of
methane into methanol over copper-exchanged zeolites with oxygen at low temperature.
ACS Cent. Sci. 2, 424-429 (2016).
24. Dinh, K. T. et al. Continuous partial oxidation of methane to methanol catalyzed by
diffusion-paired copper dimers in copper-exchanged zeolites. J. Am. Chem. Soc. 141,
11641-11650 (2019).
25. Ikuno, T. et al. Methane oxidation to methanol catalyzed by Cu-oxo clusters
stabilized in NU-1000 metal–organic framework. J. Am. Chem. Soc. 139, 10294-10301
(2017).
26. Baek, J. et al. Bioinspired metal-organic framework catalysts for selective methane
oxidation to methanol. J. Am. Chem. Soc. 140, 18208-18216 (2018).
27. Dinh, K. T. et al. Viewpoint on the partial oxidation of methane to methanol using
Cu- and Fe-exchanged zeolites. ACS Catal. 8, 8306-8313 (2018).
28. Woertink, J. S. et al. A [Cu2O]2+ core in Cu-ZSM-5, the active site in the oxidation
of methane to methanol. Proc. Natl. Acad. Sci. USA 106, 18908-18913 (2009).
29. Vanelderen, P. et al. Spectroscopic definition of the copper active sites in mordenite:
selective methane oxidation. J. Am. Chem. Soc. 137, 6383-6392 (2015).
30. Kulkarni, A. R., Zhao, Z.-J., Siahrostami, S., Nørskov, J. K. & Studt, F.
Monocopper active site for partial methane oxidation in Cu-exchanged 8MR zeolites.
ACS Catal. 6, 6531-6536 (2016).
31. Mahyuddin, M. H., Staykov, A., Shiota, Y., Miyanishi, M. & Yoshizawa, K. Roles
of zeolite confinement and Cu–O–Cu angle on the direct conversion of methane to
methanol by [Cu2(μ-O)]2+-exchanged AEI, CHA, AFX, and MFI zeolites. ACS Catal. 7,
19
3741-3751 (2017).
32. Ipek, B. et al. Formation of [Cu2O2]2+ and [Cu2O]2+ toward C–H bond activation in
Cu-SSZ-13 and Cu-SSZ-39. ACS Catal. 7, 4291-4303 (2017).
33. Alayon, E. M. C., Nachtegaal, M., Bodi, A. & van Bokhoven, J. A. Reaction
conditions of methane-to-methanol conversion affect the structure of active copper sites.
ACS Catal. 4, 16-22 (2014).
34. Paolucci, C. et al. Catalysis in a cage: Condition-dependent speciation and dynamics
of exchanged Cu cations in SSZ-13 zeolites. J. Am. Chem. Soc. 138, 6028-6048 (2016).
35. Paolucci, C. et al. Dynamic multinuclear sites formed by mobilized copper ions in
NOx selective catalytic reduction. Science 357, 898-903 (2017).
36. Korhonen, S. T., Fickel, D. W., Lobo, R. F., Weckhuysen, B. M. & Beale, A. M.
Isolated Cu2+ ions: active sites for selective catalytic reduction of NO. Chem. Commun.
47. 800–802 (2011).
37. Giordanino, F. et al. Characterization of Cu-exchanged SSZ-13: a comparative FTIR,
UV-Vis, and EPR study with Cu-ZSM-5 and Cu-β with similar Si/Al and Cu/Al ratios,
Dalton Trans. 42, 12741-12761 (2013).
38. Oord, R., Schmidt, J. E. & Weckhuysen, B.M. Methane-to-methanol conversion
over zeolite Cu-SSZ-13, and its comparison with the selective catalytic reduction of
NOx with NH3. Catal. Sci. Technol. 8, 1028-1038 (2018).
39. Borfecchia, E. et al. Cu-CHA – a model system for applied selective redox catalysis.
Chem. Soc. Rev. 47, 8097-8133 (2018).
40. Hadjiivanov, K. I. & Vayssilov, G. Characterization of oxide surfaces and zeolites
by carbon monoxide as an IR probe molecule. Adv. Catal. 47, 307-511 (2002).
41. Ross, M. O. et al. Particulate methane monooxygenase contains only mononuclear
copper centers. Science 364, 566-570 (2019).
42. Ravi, M. et al. Misconceptions and challenges in methane-to-methanol over
transition-metal-exchanged zeolites. Nat. Catal. 2, 485-494 (2019).
Acknowledgments
We acknowledge the National Natural Science Fund of China (21722303, 21673295,
20
21421001) and 111 Project (B12015, B18030) for supporting the work.
Author Contributions
L.S. and Y.W. conducted material preparations, performance tests and spectroscopic
analyses. C.W. and Z.X. contributed to theoretical calculations and directed the
theoretical section. N.G. analyzed the data and provided helpful discussions. L.L.
directed and supervised the project. L.S., C.W. and L.L. prepared the manuscript.
Competing Interests
The authors declare no competing financial interests.
Additional information
Supplementary Materials is available for this paper, including Materials and Methods,
Figures S1-S39, Tables S1-S2.
Materials & Correspondence should be addressed to C.W. or L.L.

download fileview on ChemRxivManuscript.pdf (2.03 MiB)
1
Supplementary Materials for
Water-involved methane selective catalytic oxidation by dioxygen
over copper-zeolites
Lanlan Sun, Yu Wang, Chuanming Wang*, Zaiku Xie, Naijia Guan, Landong Li*
Correspondence to:
[email protected] (C. Wang) & [email protected] (L. Li)
This PDF file includes:
Materials and Methods
Figs. S1 to S39
Tables S1 to S2
2
Materials and Methods
Zeolite host: CHA (H-SSZ-13, SiO2/Al2O3=22), MFI (H-ZSM-5, SiO2/Al2O3=25) and
MOR (H-modenite, SiO2/Al2O3=23) from Shandong Qilu Huaxin High-Tech Co. Ltd.
and used as received.
Gases and chemicals: Methane (>99.995%), helium (>99.999%) and dioxygen
(>99.995%) from Air Liquide (China) Co. Ltd.; Copper actetate monohydrate
(analytical reagent), i.e. Cu(CH3COO)2·H2O, from Alfa Aesar (China) Chemical Co.
Ltd.
Isotope reagents: D2O (99.9% enrichment), H218O (97% enrichment), 18O (98%
enrichment), CD4 (99% enrichment) and 13CH4 (99% enrichment) from ISOTEC
Laboratories Inc.
Preparation of Cu-zeolites via wet ion exchange
Cu-zeolite samples were prepared via repeated wet ion exchange under controlled pH
value. In a typical experiment, 0.5 g zeolite host was placed in the three-necked flask
and exchanged with 30 mL 0.01 M Cu(CH3COO)2 for 6 h with pH value kept at 5±0.2
(unless otherwise stated) under stirring. The resulting solid was filtrated and thoroughly
washed. The final product was dried at 353 K overnight and calcined in flowing air at
773 K for 6 h.
Characterization of Cu-zeolites
The chemical compositions of Cu-zeolites were analyzed on an IRIS Advantage
inductively coupled plasma atomic emission spectrometer (ICP-AES).
The X-ray diffraction (XRD) patterns of Cu-zeolite samples were recorded on a
Bruker D8 diffractometer using Cu-Kα radiation (λ= 0.1541 nm) at a scanning rate of
6 o/min in the region of 2θ = 5-50o.
The textual properties of Cu-zeolites were determined by argon adsorption-
desorption isotherms at 87 K collected on a Quantachrome iQ-MP gas adsorption
analyzer. The total surface areas were calculated via the Brunauer Emmett Teller (BET)
equation and the micropore properties were determined using the t-plot method.
3
Scanning electron microscopy (SEM) images of Cu-zeolite samples were obtained
on a JSM-7500F electron microscope.
Transmission electron microscopy (TEM) images of Cu-zeolite samples under study
were acquired on a FEI Tecnai G2 F20 electron microscope. High angle annular dark
filed scanning transmission electron microscopy (HAADF-STEM) images were
acquired on a FEI Talos electron microscope. The element mapping analysis was
performed under HAADF-STEM mode using a FEI built-in energy dispersive spectrum.
FTIR spectra of Cu-zeolite samples were collected on a Bruker Tensor 27
spectrometer in the diffuse reflectance mode with Harrick Praying Mantis setup and a
liquid nitrogen cooled high sensitivity mercury-cadmium-telluride detector. The in situ
diffuse reflectance FTIR spectroscopic analyses under different reaction conditions
were performed in a Harrick CHC-CHA-3 chamber.
UV-vis-NIR spectra of Cu-zeolite samples were collected on a PerkinElmer Lambda
750 UV/VIS/NIR spectrometer in the diffuse reflectance mode with a Harrick Praying
Mantis setup. The in situ UV-vis-NIR spectroscopic analyses under different reaction
conditions were performed in a HVC-DRM-5 chamber.
The hydrogen temperature-programmed reduction (H2-TPR) of Cu-zeolites was
performed on a Quantachrome ChemBET 3000 chemisorption analyzer. In a typical
experiment, Cu-zeolite sample of ca. 0.1 g was calcined in dry air at 673 K for 1 h and
cooled to 323 K in flowing Ar. H2-TPR profile was recorded in flowing 10%H2/Ar at a
heating rate of 10 K/min from 323 to 1023 K.
Steady-state methane catalytic oxidation to methanol
The selective catalytic oxidation of methane was performed on a fixed-bed micro-
reactor at ambient pressure. Typically, catalyst sample of 0.1 g (sieve fraction 250-400
μm) was placed in the quartz reactor and the reactant gas mixture containing methane,
water and dioxygen was fed to the quartz reactor at designated temperature. The total
flow rate was controlled at 60 mL/min, corresponding to a gas hourly space velocity
(GHSV) of 30,000 /h. The reaction outlet was on-line analyzed by a gas chromatograph
(SHIMADZU GC-2014) equipped with a thermal conductivity detector (TCD, with one
4
MS-13X packed column and two Porapak N packed columns) and a flame ionization
detector (FID, with one Plot Q capillary column). Methane, carbon monoxide, carbon
dioxide and dihydrogen were analyzed by TCD, while methane, C1 oxygenates and
C2+ hydrocarbons were analyzed by FID (argon as an internal standard, methane as a
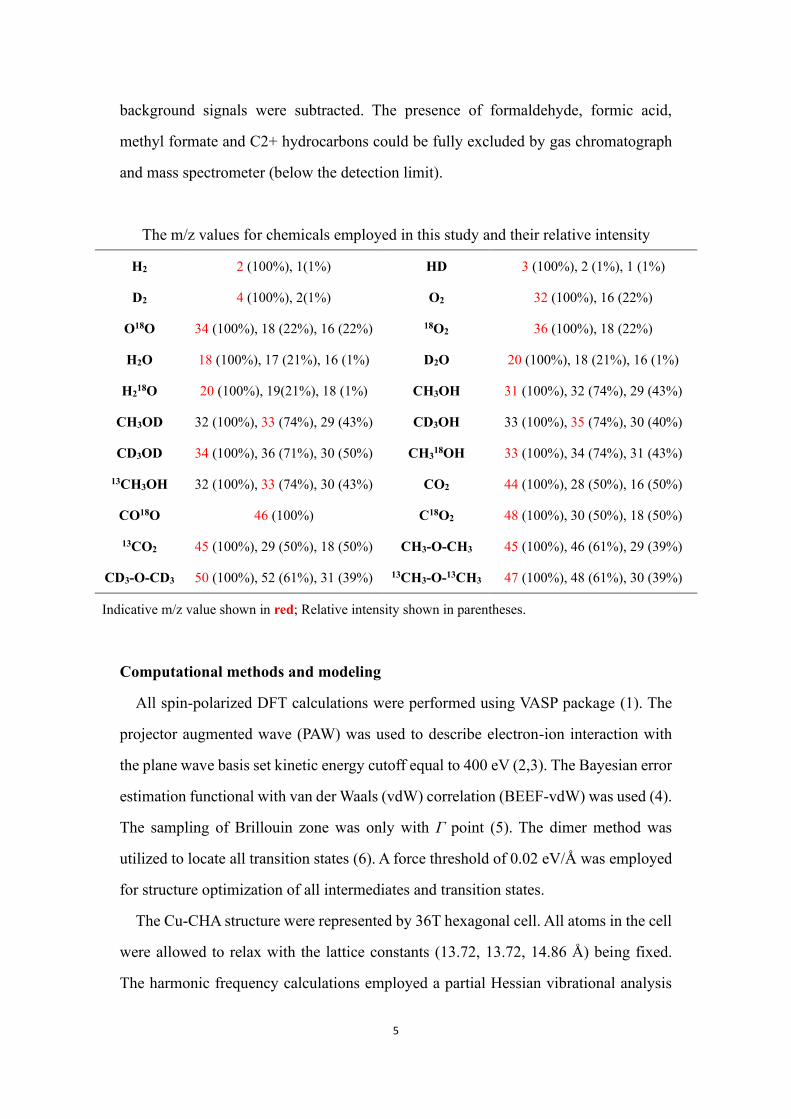
link between TCD and FID). The concentration of methanol (also for carbon monoxide,
carbon dioxide, etc.) was quantitatively determined by external standard method (see
below for typical calibration curves) and the yield of methanol (𝑌CH3OH) was obtained
via volume conversion. The methanol selectivity was determined by normalization:
𝑆CH3OH(%) = [CH3OH]outlet
∑ Product∗ 100% , (byproducts below the detect limitation of gas
chromatograph were ignored and the possible coke deposition was fully excluded even
after long-term running). The conversion of methane was calculated as: 𝐶CH4 (%) =
𝑌CH3OH
𝑆CH3OH∗ 100%.
Temperature-programmed surface reactions of methane catalytic oxidation
The temperature-programmed surface reactions (TPSR) were also performed in the
fixed-bed reactor. In a typical experiment, sample of ca. 0.1 g was placed in the quartz
reactor and the reactant gas mixture was fed to the quartz reactor at 60 mL/min at 393
K. After the reaction outlet reached steady, the TPSR was initiated by heating up from
393 to 793 K at a rate of 5 K/min. The reaction outlet was on-line analyzed by a mass
spectrometer (Pfeiffer Omnistar GSD 320). The m/z values were carefully selected for
target reagents and products (see table below), and the overlapped fractions and
0E+00 1E-10 2E-10 3E-100
1000
2000
3000
4000
Pe
ak
Are
a (
a.u
.)
nmethanol
0.0E+00 1.0E-09 2.0E-09 3.0E-090
300
600
900
1200
Pe
ak
Are
a (
a.u
.)
nCarbon dioxide
5
background signals were subtracted. The presence of formaldehyde, formic acid,
methyl formate and C2+ hydrocarbons could be fully excluded by gas chromatograph
and mass spectrometer (below the detection limit).
The m/z values for chemicals employed in this study and their relative intensity
H2 2 (100%), 1(1%) HD 3 (100%), 2 (1%), 1 (1%)
D2 4 (100%), 2(1%) O2 32 (100%), 16 (22%)
O18O 34 (100%), 18 (22%), 16 (22%) 18O2 36 (100%), 18 (22%)
H2O 18 (100%), 17 (21%), 16 (1%) D2O 20 (100%), 18 (21%), 16 (1%)
H218O 20 (100%), 19(21%), 18 (1%) CH3OH 31 (100%), 32 (74%), 29 (43%)
CH3OD 32 (100%), 33 (74%), 29 (43%) CD3OH 33 (100%), 35 (74%), 30 (40%)
CD3OD 34 (100%), 36 (71%), 30 (50%) CH318OH 33 (100%), 34 (74%), 31 (43%)
13CH3OH 32 (100%), 33 (74%), 30 (43%) CO2 44 (100%), 28 (50%), 16 (50%)
CO18O 46 (100%) C18O2 48 (100%), 30 (50%), 18 (50%)
13CO2 45 (100%), 29 (50%), 18 (50%) CH3-O-CH3 45 (100%), 46 (61%), 29 (39%)
CD3-O-CD3 50 (100%), 52 (61%), 31 (39%) 13CH3-O-13CH3 47 (100%), 48 (61%), 30 (39%)
Indicative m/z value shown in red; Relative intensity shown in parentheses.
Computational methods and modeling
All spin-polarized DFT calculations were performed using VASP package (1). The
projector augmented wave (PAW) was used to describe electron-ion interaction with
the plane wave basis set kinetic energy cutoff equal to 400 eV (2,3). The Bayesian error
estimation functional with van der Waals (vdW) correlation (BEEF-vdW) was used (4).
The sampling of Brillouin zone was only with Г point (5). The dimer method was
utilized to locate all transition states (6). A force threshold of 0.02 eV/Å was employed
for structure optimization of all intermediates and transition states.
The Cu-CHA structure were represented by 36T hexagonal cell. All atoms in the cell
were allowed to relax with the lattice constants (13.72, 13.72, 14.86 Å) being fixed.
The harmonic frequency calculations employed a partial Hessian vibrational analysis
6
(PHVA). The zero point energies (ZPE), enthalpies, entropies, and Gibbs free energies
were then calculated from harmonic frequencies.
References
(1) G. Kresse, J. Furthmuller, Phys. Rev. B, 1996, 54, 11169-11186.
(2) P. E. Blochl, Phys. Rev. B, 1994, 50, 17953-17979.
(3) G. Kresse, D. Joubert, Phys. Rev. B, 1999, 59, 1758-1775.
(4) J. Wellendorff, K. T. Lundgaard, A. Møgelhøj, V. Petzold, D. D. Landis, J. K.
Nørskov, T. Bligaard, K. W. Jacobsen, Phys. Rev. B, 2012, 85, 235149.
(5) H. J. Monkhorst, J. D. Pack, Phys. Rev. B, 1976, 13, 5188-5192.
(6) G. Henkelman, H. Jonsson, J. Chem. Phys., 1999, 111, 7010-7022.
7
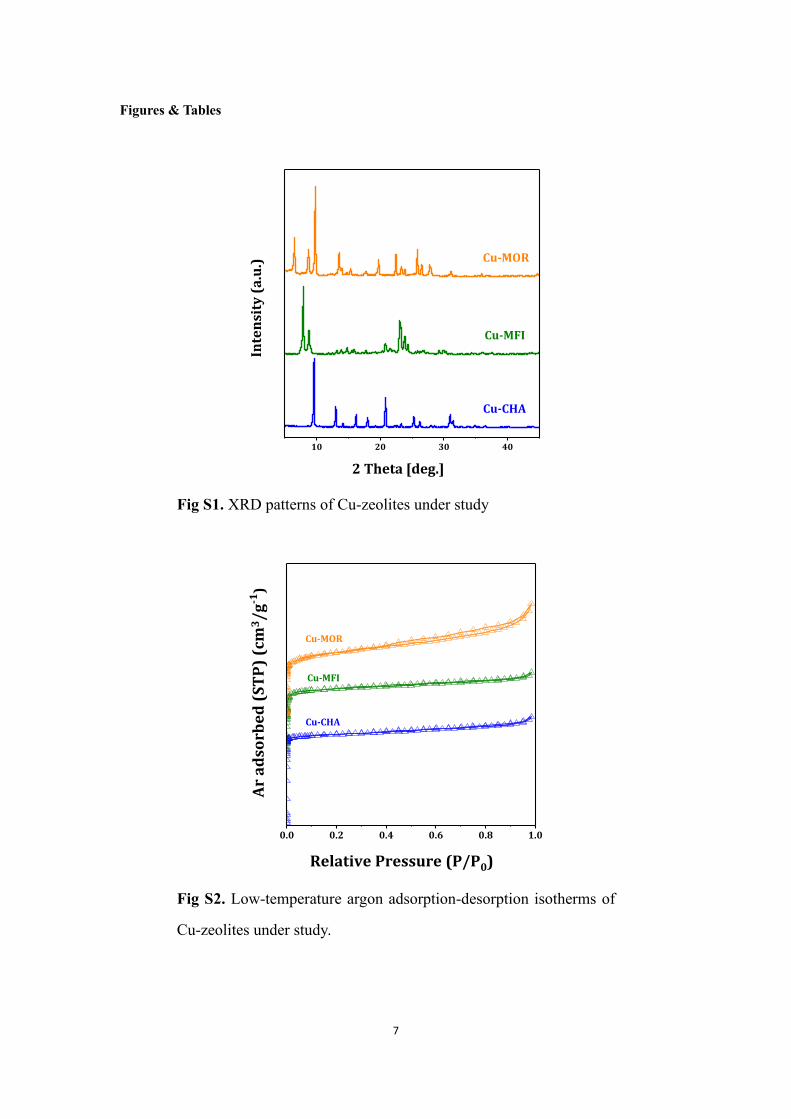
Figures & Tables
Fig S1. XRD patterns of Cu-zeolites under study
Fig S2. Low-temperature argon adsorption-desorption isotherms of
Cu-zeolites under study.
10 20 30 40
Cu-CHA
Cu-MFI
Inte
nsi
ty (
a.u
.)
2 Theta [deg.]
Cu-MOR
0.0 0.2 0.4 0.6 0.8 1.0
Ar
ad
sorb
ed
(S
TP
) (c
m3/
g-1
)
Cu-MOR
Relative Pressure (P/P0)
Cu-MFI
Cu-CHA
8
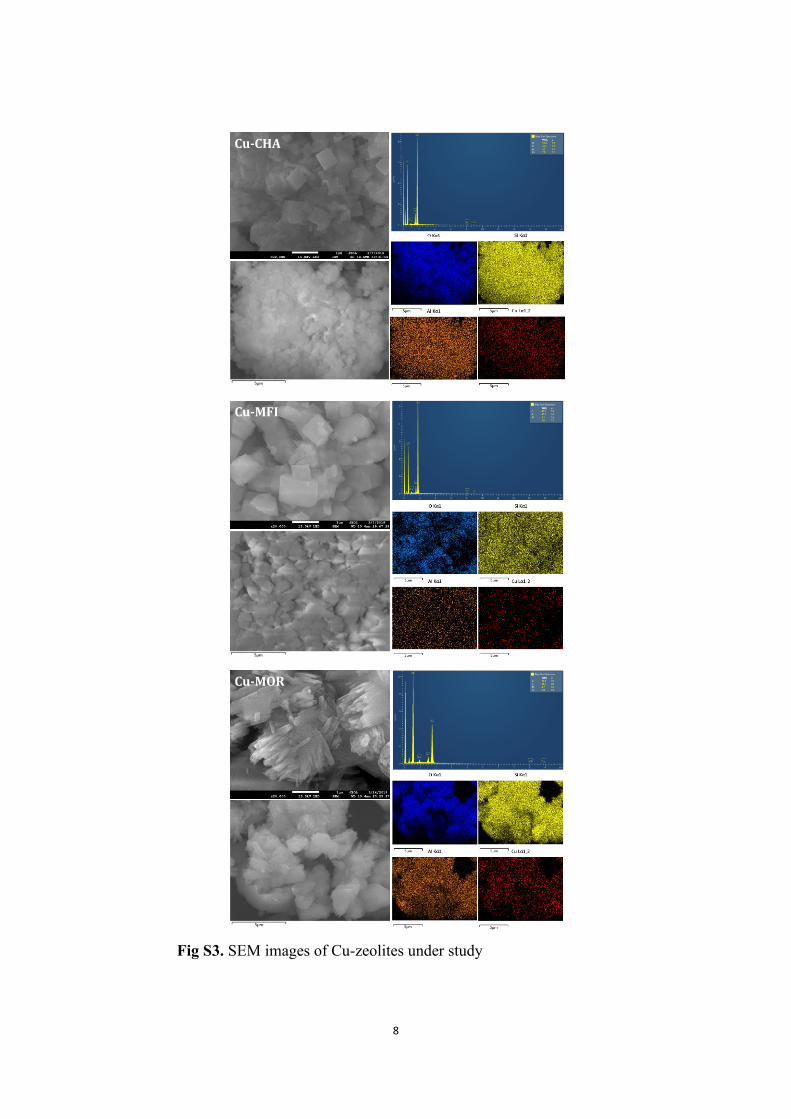
Fig S3. SEM images of Cu-zeolites under study
Cu-CHA
Cu-MFI
Cu-MOR
9
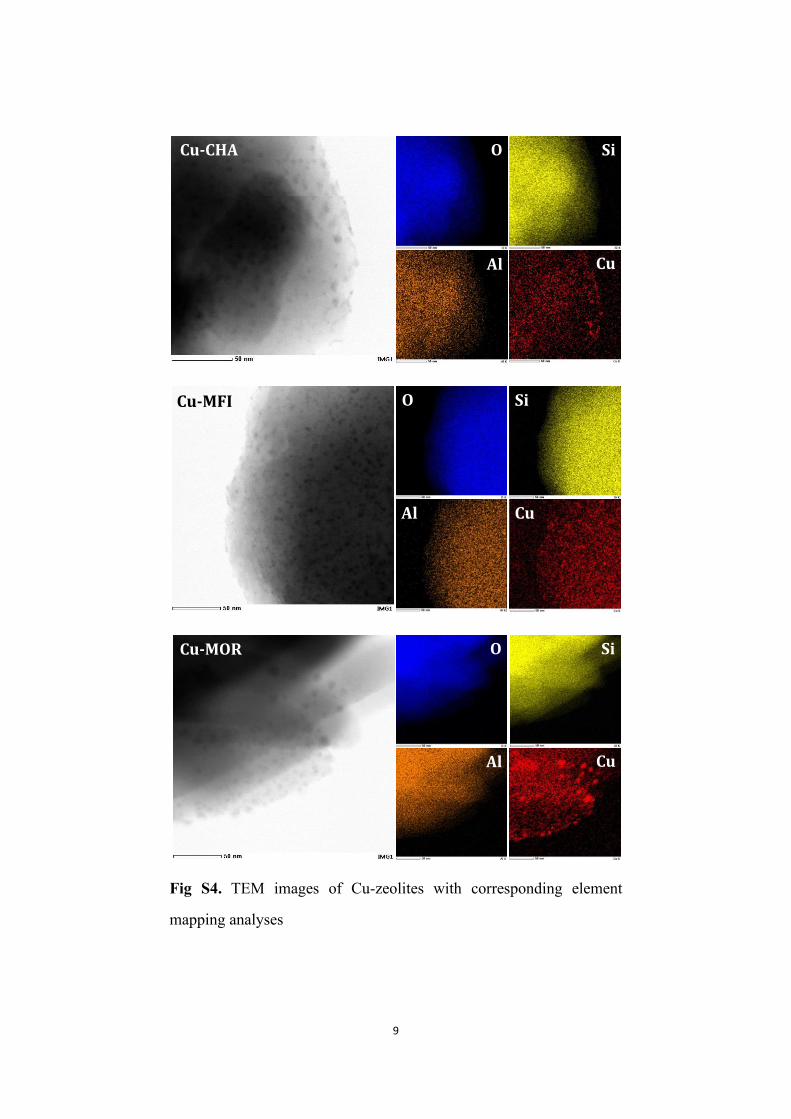
Fig S4. TEM images of Cu-zeolites with corresponding element
mapping analyses
Cu-CHA SiO
Al Cu
Cu-MFI
Al
Si
Cu
O
Cu-MOR
Al Cu
SiO
10
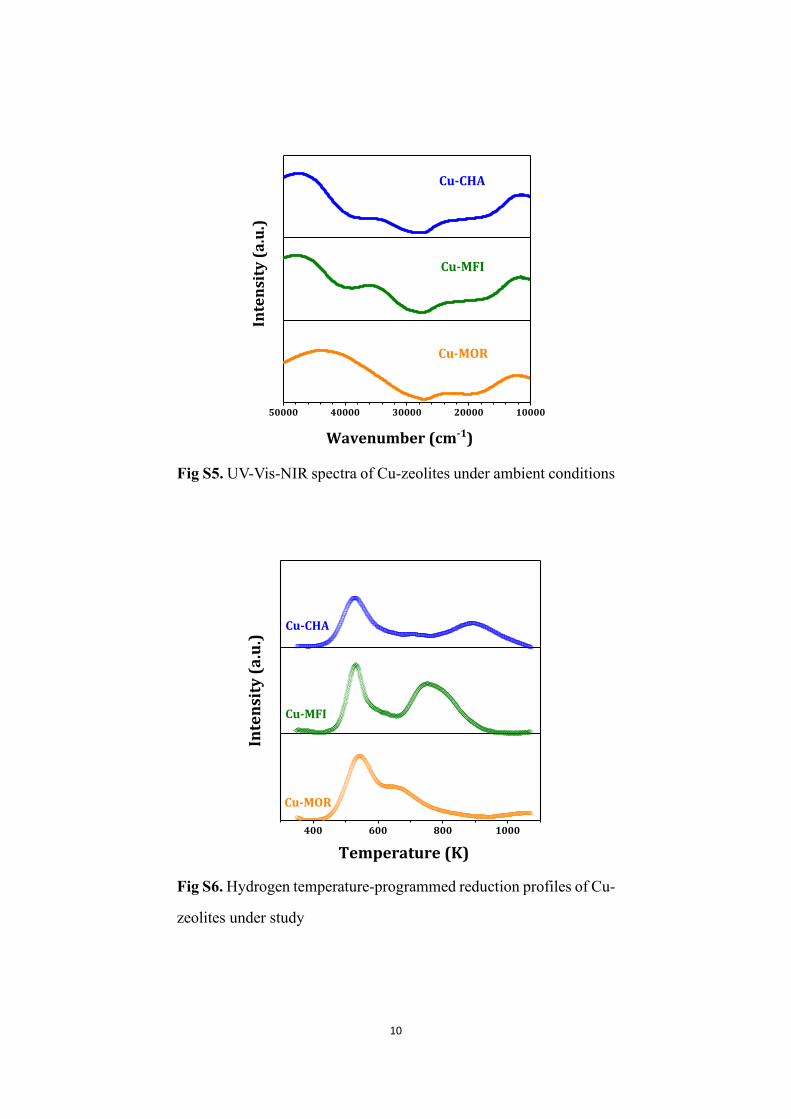
Fig S5. UV-Vis-NIR spectra of Cu-zeolites under ambient conditions
Fig S6. Hydrogen temperature-programmed reduction profiles of Cu-
zeolites under study
50000 40000 30000 20000 10000
Cu-MOR
Cu-MFIIn
ten
sity
(a
.u.)
Wavenumber (cm-1)
Cu-CHA
400 600 800 1000
Cu-MOR
Cu-MFI
Inte
nsi
ty (
a.u
.)
Temperature (K)
Cu-CHA
11
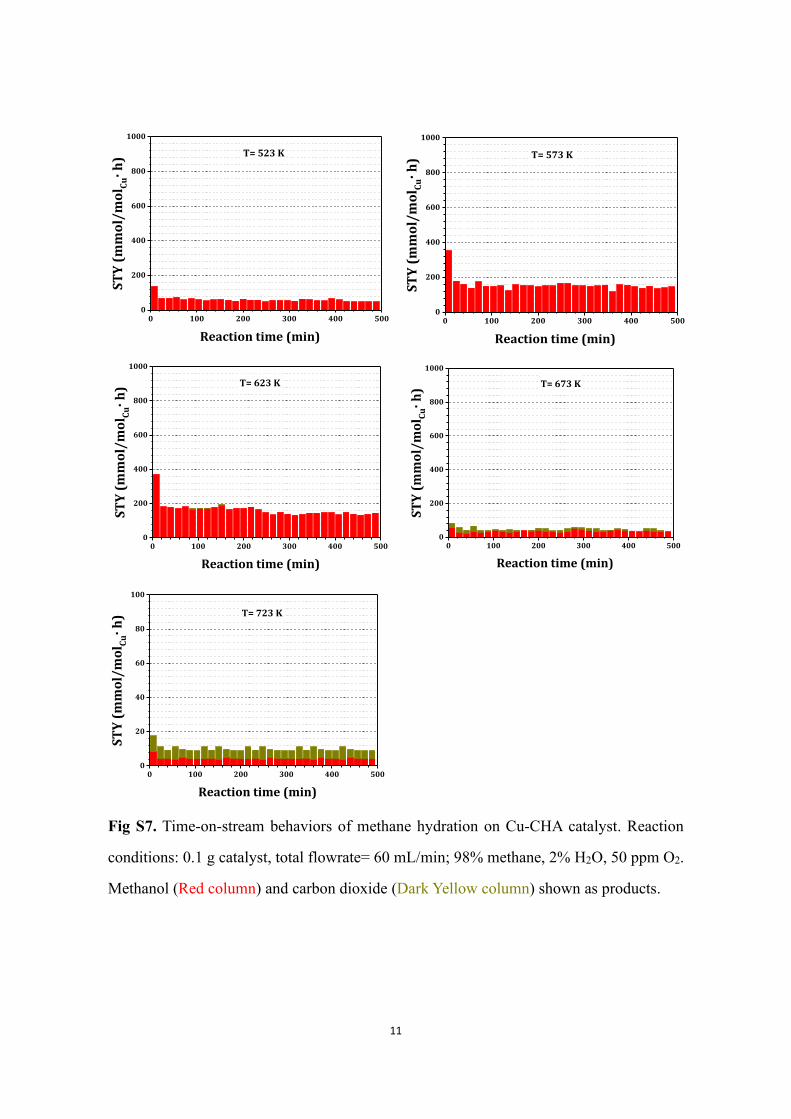
Fig S7. Time-on-stream behaviors of methane hydration on Cu-CHA catalyst. Reaction
conditions: 0.1 g catalyst, total flowrate= 60 mL/min; 98% methane, 2% H2O, 50 ppm O2.
Methanol (Red column) and carbon dioxide (Dark Yellow column) shown as products.
0 100 200 300 400 5000
200
400
600
800
1000
ST
Y (
mm
ol/
mo
l Cu· h
)
Reaction time (min)
T= 523 K
0 100 200 300 400 5000
200
400
600
800
1000
T= 573 K
ST
Y (
mm
ol/
mo
l Cu· h
)
Reaction time (min)
0 100 200 300 400 5000
200
400
600
800
1000
T= 623 K
ST
Y (
mm
ol/
mo
l Cu· h
)
Reaction time (min)
0 100 200 300 400 5000
200
400
600
800
1000
ST
Y (
mm
ol/
mo
l Cu· h
)
Reaction time (min)
T= 673 K
0 100 200 300 400 5000
20
40
60
80
100
T= 723 K
ST
Y (
mm
ol/
mo
l Cu· h
)
Reaction time (min)
12
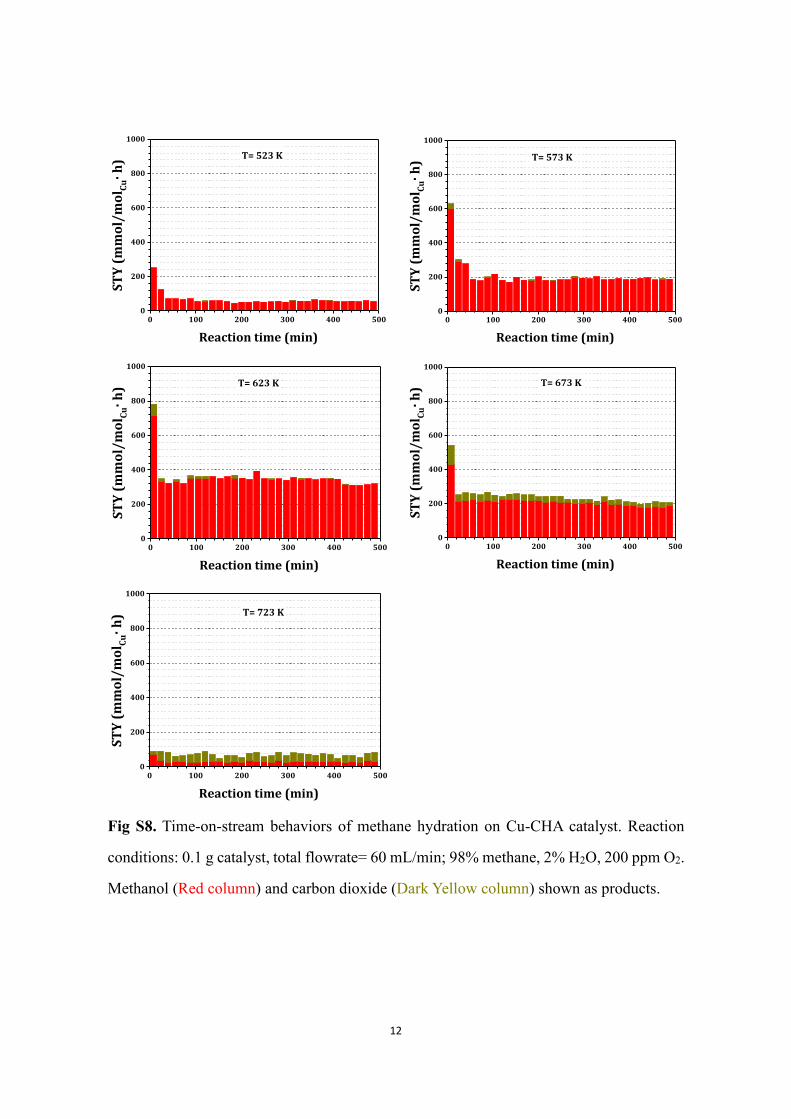
Fig S8. Time-on-stream behaviors of methane hydration on Cu-CHA catalyst. Reaction
conditions: 0.1 g catalyst, total flowrate= 60 mL/min; 98% methane, 2% H2O, 200 ppm O2.
Methanol (Red column) and carbon dioxide (Dark Yellow column) shown as products.
0 100 200 300 400 5000
200
400
600
800
1000
ST
Y (
mm
ol/
mo
l Cu· h
)
Reaction time (min)
T= 523 K
0 100 200 300 400 5000
200
400
600
800
1000
T= 573 K
ST
Y (
mm
ol/
mo
l Cu· h
)
Reaction time (min)
0 100 200 300 400 5000
200
400
600
800
1000
T= 623 K
ST
Y (
mm
ol/
mo
l Cu· h
)
Reaction time (min)
0 100 200 300 400 5000
200
400
600
800
1000
ST
Y (
mm
ol/
mo
l Cu· h
)
Reaction time (min)
T= 673 K
0 100 200 300 400 5000
200
400
600
800
1000
T= 723 K
ST
Y (
mm
ol/
mo
l Cu· h
)
Reaction time (min)
13
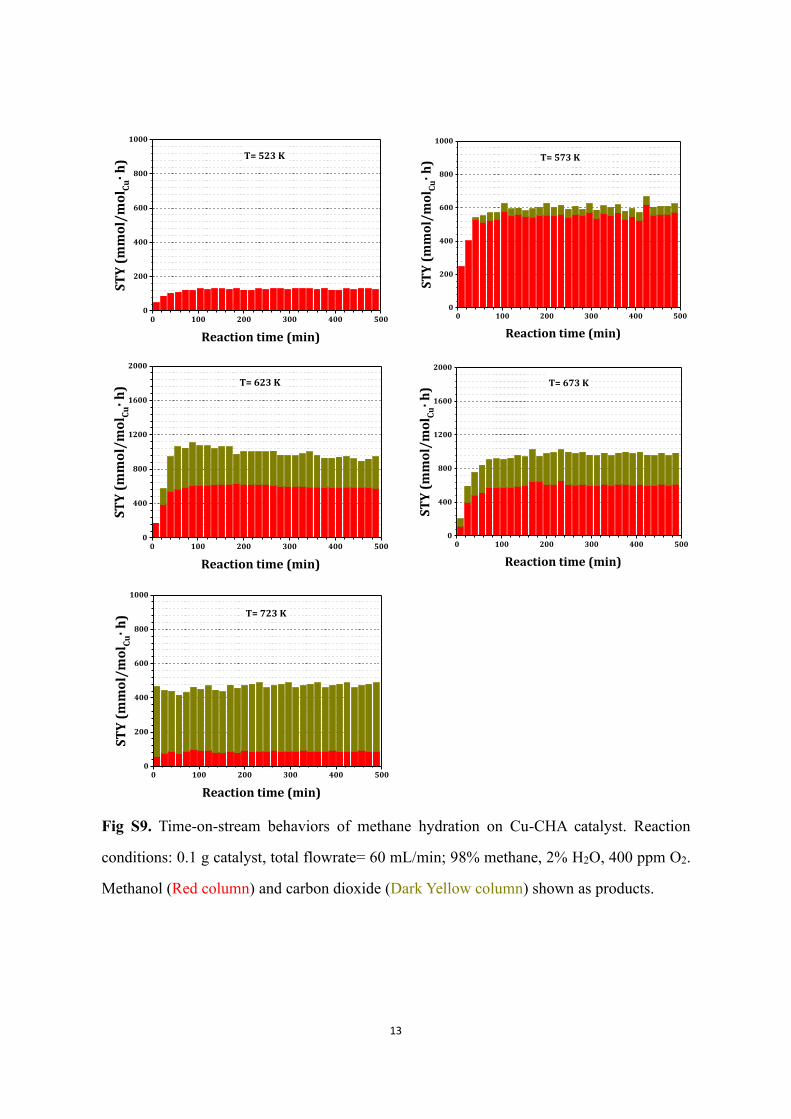
Fig S9. Time-on-stream behaviors of methane hydration on Cu-CHA catalyst. Reaction
conditions: 0.1 g catalyst, total flowrate= 60 mL/min; 98% methane, 2% H2O, 400 ppm O2.
Methanol (Red column) and carbon dioxide (Dark Yellow column) shown as products.
0 100 200 300 400 5000
200
400
600
800
1000
ST
Y (
mm
ol/
mo
l Cu· h
)
Reaction time (min)
T= 523 K
0 100 200 300 400 5000
200
400
600
800
1000
T= 573 K
ST
Y (
mm
ol/
mo
l Cu· h
)
Reaction time (min)
0 100 200 300 400 5000
400
800
1200
1600
2000
T= 623 K
ST
Y (
mm
ol/
mo
l Cu· h
)
Reaction time (min)
0 100 200 300 400 5000
400
800
1200
1600
2000
ST
Y (
mm
ol/
mo
l Cu· h
)
Reaction time (min)
T= 673 K
0 100 200 300 400 5000
200
400
600
800
1000
T= 723 K
ST
Y (
mm
ol/
mo
l Cu· h
)
Reaction time (min)
14
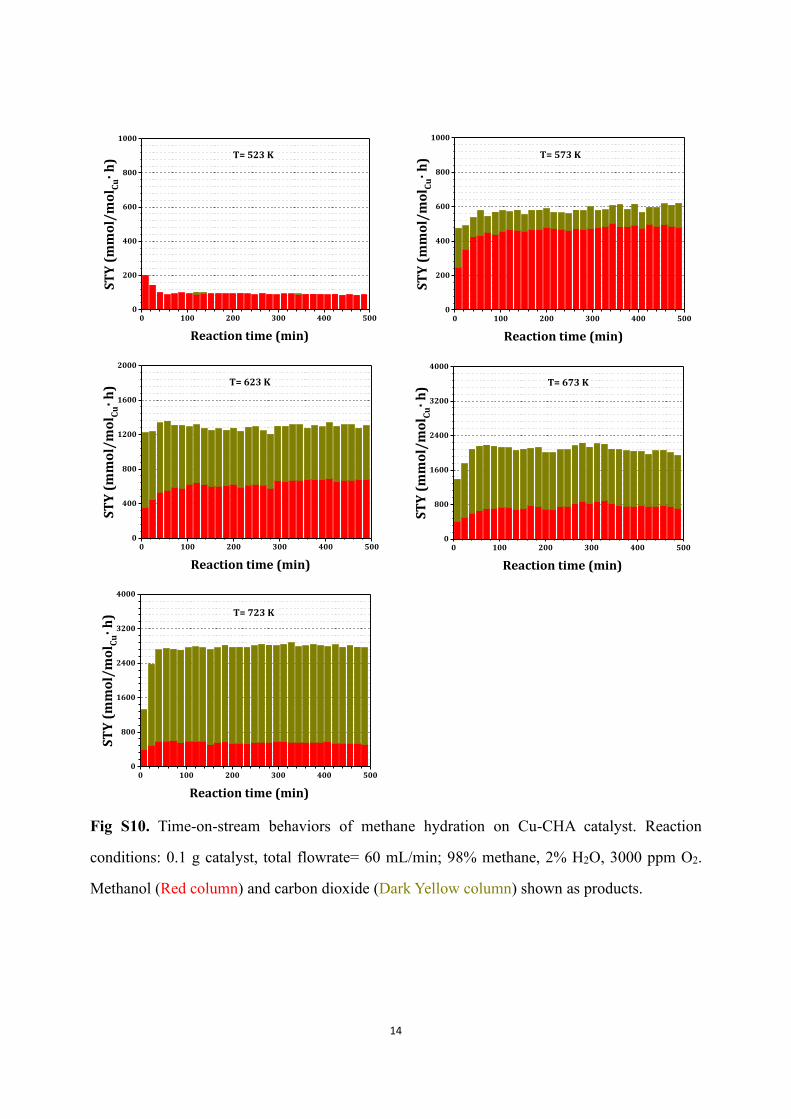
Fig S10. Time-on-stream behaviors of methane hydration on Cu-CHA catalyst. Reaction
conditions: 0.1 g catalyst, total flowrate= 60 mL/min; 98% methane, 2% H2O, 3000 ppm O2.
Methanol (Red column) and carbon dioxide (Dark Yellow column) shown as products.
0 100 200 300 400 5000
200
400
600
800
1000
ST
Y (
mm
ol/
mo
l Cu· h
)
Reaction time (min)
T= 523 K
0 100 200 300 400 5000
200
400
600
800
1000
T= 573 K
ST
Y (
mm
ol/
mo
l Cu· h
)
Reaction time (min)
0 100 200 300 400 5000
400
800
1200
1600
2000
T= 623 K
ST
Y (
mm
ol/
mo
l Cu· h
)
Reaction time (min)
0 100 200 300 400 5000
800
1600
2400
3200
4000
ST
Y (
mm
ol/
mo
l Cu· h
)
Reaction time (min)
T= 673 K
0 100 200 300 400 5000
800
1600
2400
3200
4000
T= 723 K
ST
Y (
mm
ol/
mo
l Cu· h
)
Reaction time (min)
15
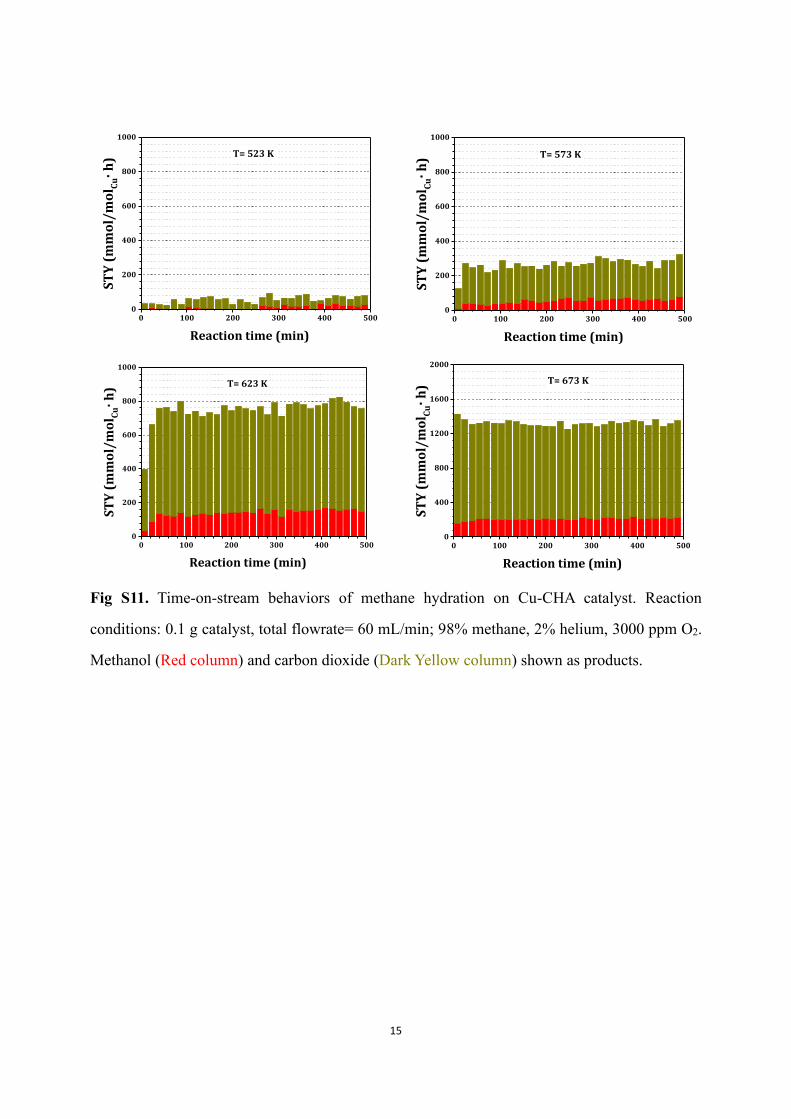
Fig S11. Time-on-stream behaviors of methane hydration on Cu-CHA catalyst. Reaction
conditions: 0.1 g catalyst, total flowrate= 60 mL/min; 98% methane, 2% helium, 3000 ppm O2.
Methanol (Red column) and carbon dioxide (Dark Yellow column) shown as products.
0 100 200 300 400 5000
200
400
600
800
1000
ST
Y (
mm
ol/
mo
l Cu· h
)
Reaction time (min)
T= 523 K
0 100 200 300 400 5000
200
400
600
800
1000
T= 573 K
ST
Y (
mm
ol/
mo
l Cu· h
)
Reaction time (min)
0 100 200 300 400 5000
200
400
600
800
1000
T= 623 K
ST
Y (
mm
ol/
mo
l Cu· h
)
Reaction time (min)
0 100 200 300 400 5000
400
800
1200
1600
2000
ST
Y (
mm
ol/
mo
l Cu· h
)
Reaction time (min)
T= 673 K
16
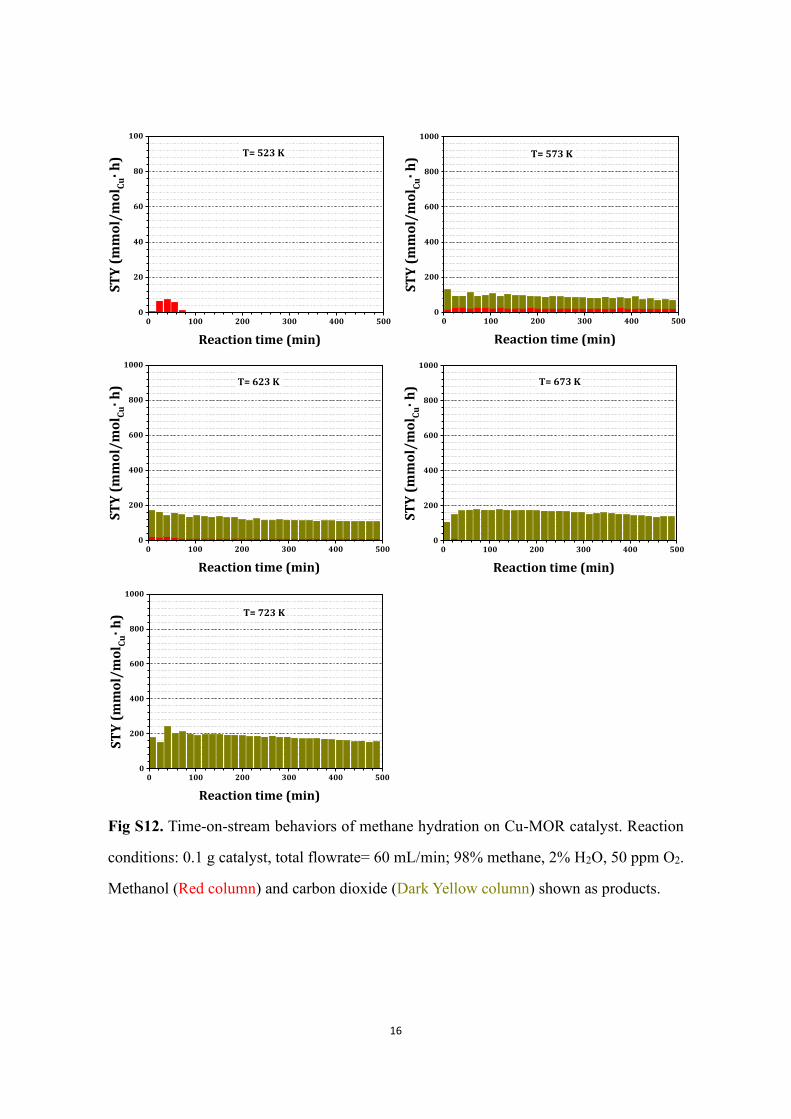
Fig S12. Time-on-stream behaviors of methane hydration on Cu-MOR catalyst. Reaction
conditions: 0.1 g catalyst, total flowrate= 60 mL/min; 98% methane, 2% H2O, 50 ppm O2.
Methanol (Red column) and carbon dioxide (Dark Yellow column) shown as products.
0 100 200 300 400 5000
20
40
60
80
100
ST
Y (
mm
ol/
mo
l Cu· h
)
Reaction time (min)
T= 523 K
0 100 200 300 400 5000
200
400
600
800
1000
T= 573 K
ST
Y (
mm
ol/
mo
l Cu· h
)
Reaction time (min)
0 100 200 300 400 5000
200
400
600
800
1000
T= 623 K
ST
Y (
mm
ol/
mo
l Cu· h
)
Reaction time (min)
0 100 200 300 400 5000
200
400
600
800
1000
ST
Y (
mm
ol/
mo
l Cu· h
)
Reaction time (min)
T= 673 K
0 100 200 300 400 5000
200
400
600
800
1000
T= 723 K
ST
Y (
mm
ol/
mo
l Cu· h
)
Reaction time (min)
17
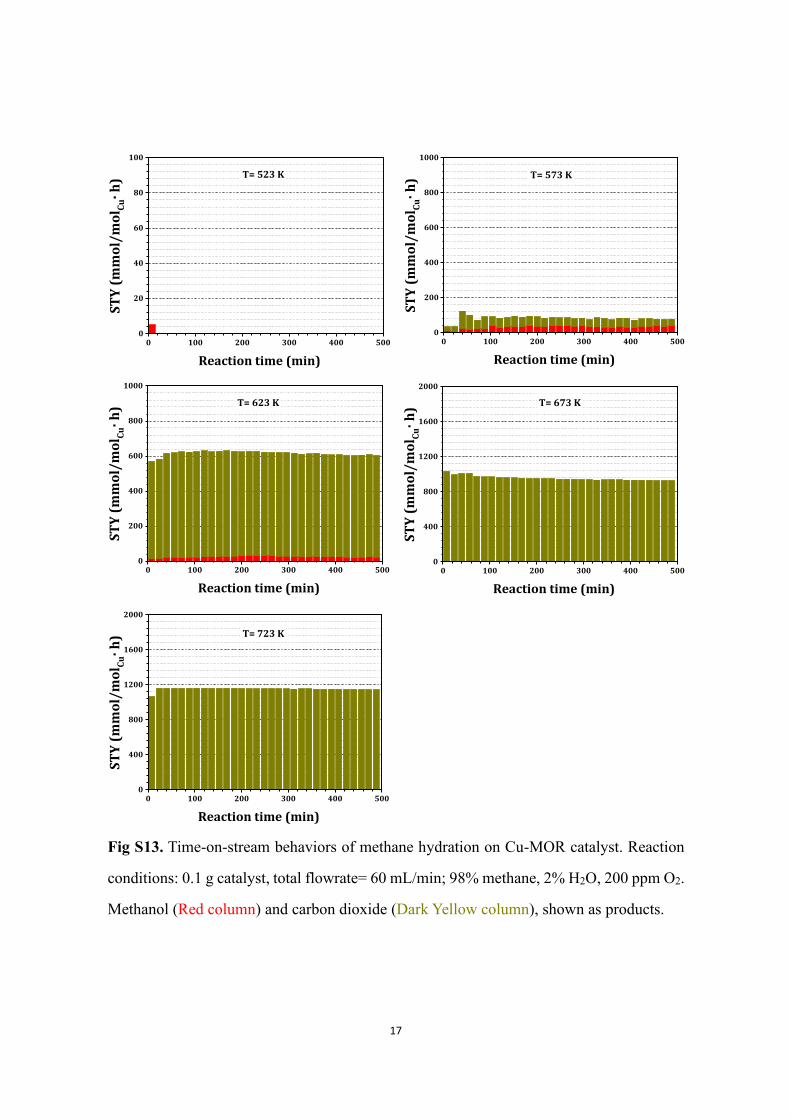
Fig S13. Time-on-stream behaviors of methane hydration on Cu-MOR catalyst. Reaction
conditions: 0.1 g catalyst, total flowrate= 60 mL/min; 98% methane, 2% H2O, 200 ppm O2.
Methanol (Red column) and carbon dioxide (Dark Yellow column), shown as products.
0 100 200 300 400 5000
20
40
60
80
100
ST
Y (
mm
ol/
mo
l Cu· h
)
Reaction time (min)
T= 523 K
0 100 200 300 400 5000
200
400
600
800
1000
T= 573 K
ST
Y (
mm
ol/
mo
l Cu· h
)
Reaction time (min)
0 100 200 300 400 5000
200
400
600
800
1000
T= 623 K
ST
Y (
mm
ol/
mo
l Cu· h
)
Reaction time (min)
0 100 200 300 400 5000
400
800
1200
1600
2000
ST
Y (
mm
ol/
mo
l Cu· h
)
Reaction time (min)
T= 673 K
0 100 200 300 400 5000
400
800
1200
1600
2000
T= 723 K
ST
Y (
mm
ol/
mo
l Cu· h
)
Reaction time (min)
18
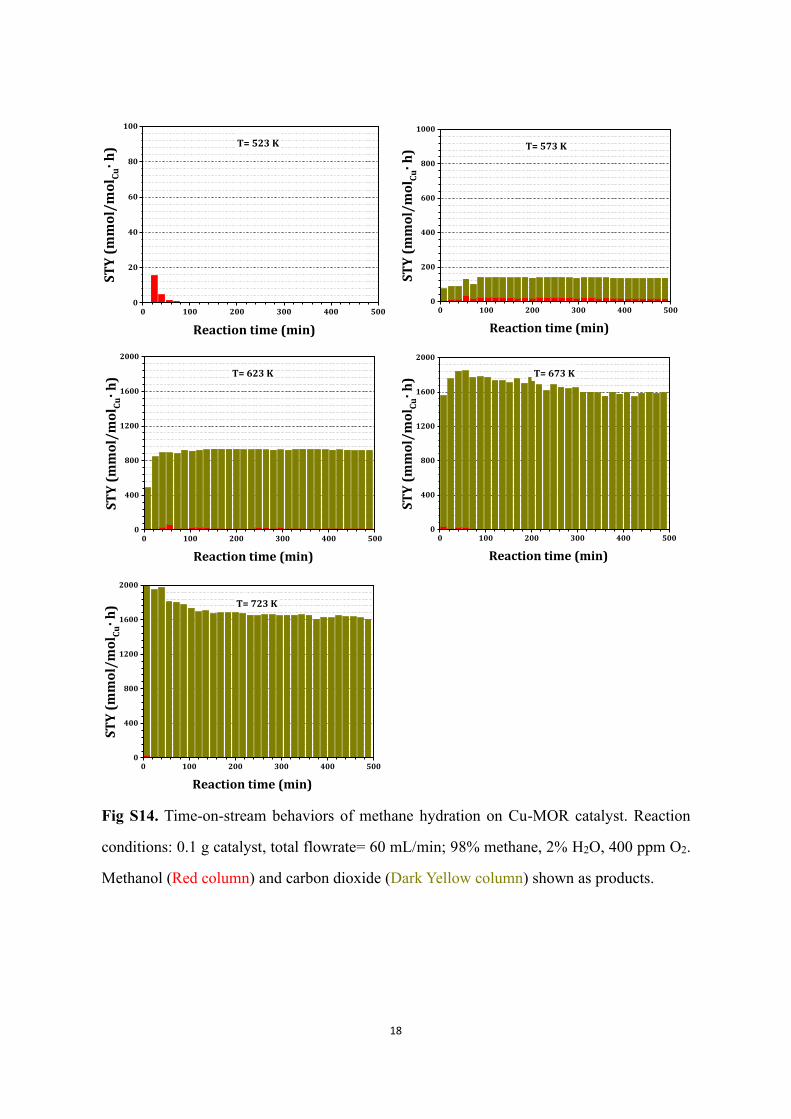
Fig S14. Time-on-stream behaviors of methane hydration on Cu-MOR catalyst. Reaction
conditions: 0.1 g catalyst, total flowrate= 60 mL/min; 98% methane, 2% H2O, 400 ppm O2.
Methanol (Red column) and carbon dioxide (Dark Yellow column) shown as products.
0 100 200 300 400 5000
20
40
60
80
100
ST
Y (
mm
ol/
mo
l Cu· h
)
Reaction time (min)
T= 523 K
0 100 200 300 400 5000
200
400
600
800
1000
T= 573 K
ST
Y (
mm
ol/
mo
l Cu· h
)
Reaction time (min)
0 100 200 300 400 5000
400
800
1200
1600
2000
T= 623 K
ST
Y (
mm
ol/
mo
l Cu· h
)
Reaction time (min)
0 100 200 300 400 5000
400
800
1200
1600
2000
ST
Y (
mm
ol/
mo
l Cu· h
)
Reaction time (min)
T= 673 K
0 100 200 300 400 5000
400
800
1200
1600
2000
T= 723 K
ST
Y (
mm
ol/
mo
l Cu· h
)
Reaction time (min)
19
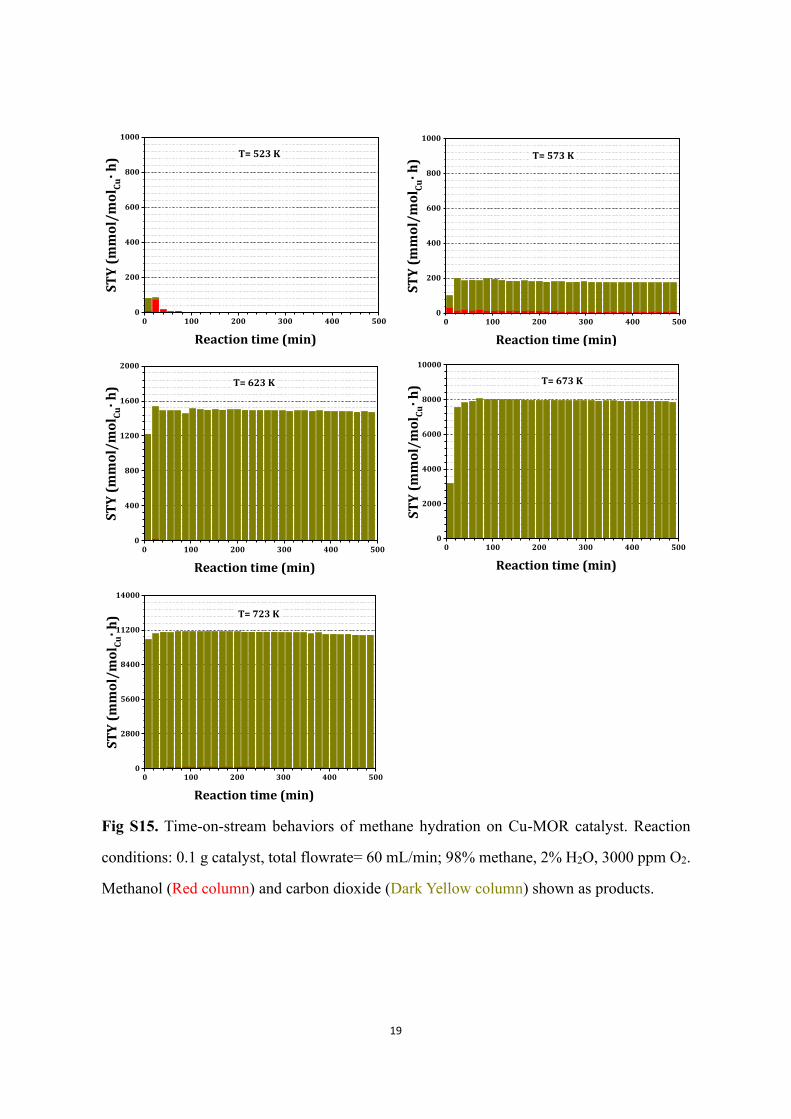
Fig S15. Time-on-stream behaviors of methane hydration on Cu-MOR catalyst. Reaction
conditions: 0.1 g catalyst, total flowrate= 60 mL/min; 98% methane, 2% H2O, 3000 ppm O2.
Methanol (Red column) and carbon dioxide (Dark Yellow column) shown as products.
0 100 200 300 400 5000
200
400
600
800
1000
ST
Y (
mm
ol/
mo
l Cu· h
)
Reaction time (min)
T= 523 K
0 100 200 300 400 5000
200
400
600
800
1000
T= 573 K
ST
Y (
mm
ol/
mo
l Cu· h
)
Reaction time (min)
0 100 200 300 400 5000
400
800
1200
1600
2000
T= 623 K
ST
Y (
mm
ol/
mo
l Cu· h
)
Reaction time (min)
0 100 200 300 400 5000
2000
4000
6000
8000
10000
ST
Y (
mm
ol/
mo
l Cu· h
)
Reaction time (min)
T= 673 K
0 100 200 300 400 5000
2800
5600
8400
11200
14000
T= 723 K
ST
Y (
mm
ol/
mo
l Cu· h
)
Reaction time (min)
20
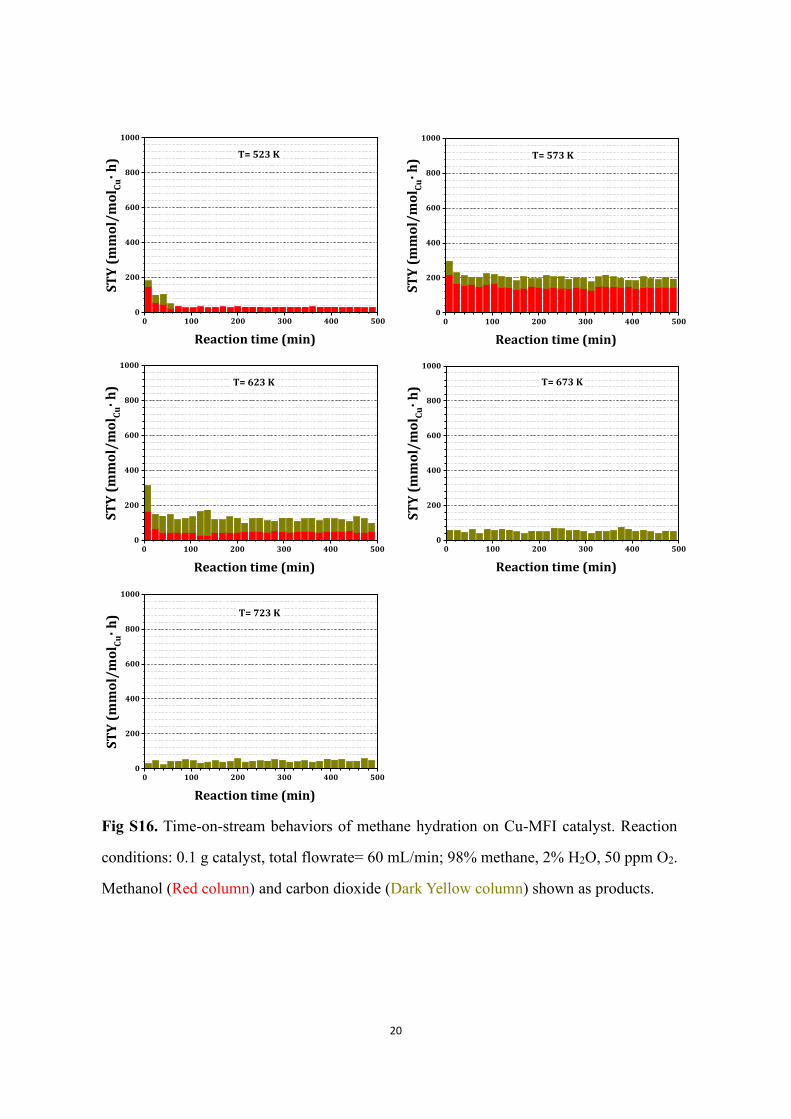
Fig S16. Time-on-stream behaviors of methane hydration on Cu-MFI catalyst. Reaction
conditions: 0.1 g catalyst, total flowrate= 60 mL/min; 98% methane, 2% H2O, 50 ppm O2.
Methanol (Red column) and carbon dioxide (Dark Yellow column) shown as products.
0 100 200 300 400 5000
200
400
600
800
1000
ST
Y (
mm
ol/
mo
l Cu· h
)
Reaction time (min)
T= 523 K
0 100 200 300 400 5000
200
400
600
800
1000
T= 573 K
ST
Y (
mm
ol/
mo
l Cu· h
)
Reaction time (min)
0 100 200 300 400 5000
200
400
600
800
1000
T= 623 K
ST
Y (
mm
ol/
mo
l Cu· h
)
Reaction time (min)
0 100 200 300 400 5000
200
400
600
800
1000
ST
Y (
mm
ol/
mo
l Cu· h
)
Reaction time (min)
T= 673 K
0 100 200 300 400 5000
200
400
600
800
1000
T= 723 K
ST
Y (
mm
ol/
mo
l Cu· h
)
Reaction time (min)
21
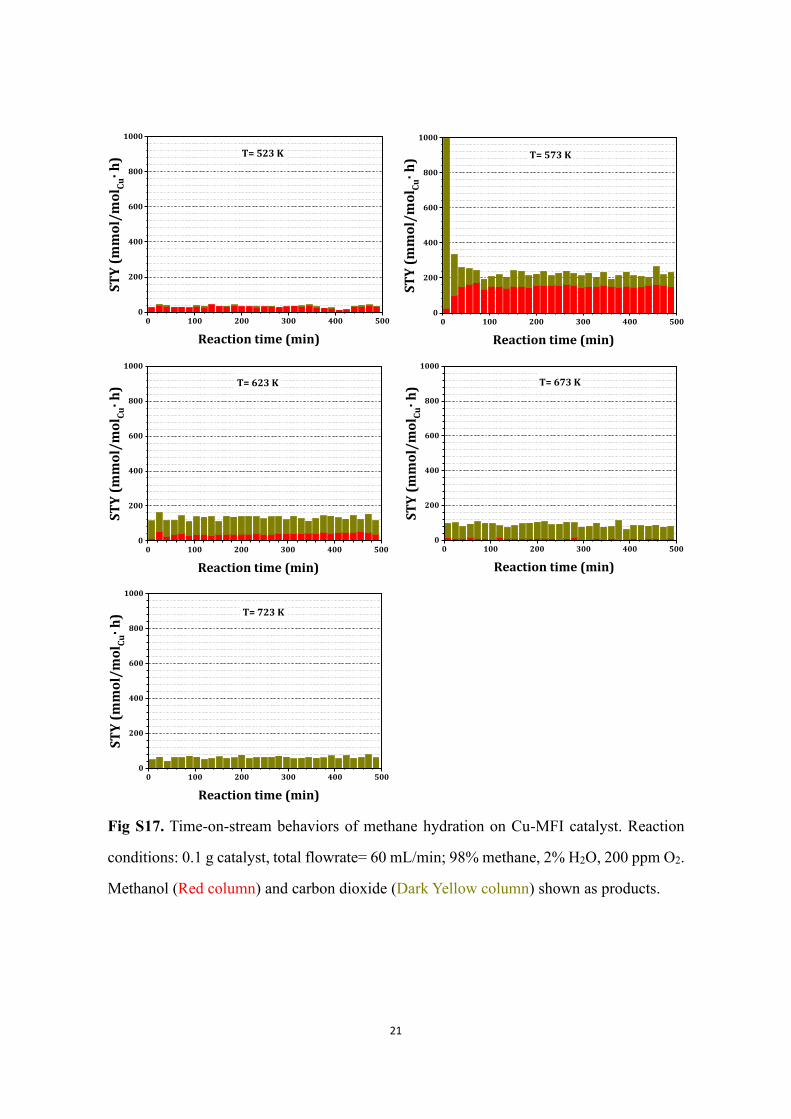
Fig S17. Time-on-stream behaviors of methane hydration on Cu-MFI catalyst. Reaction
conditions: 0.1 g catalyst, total flowrate= 60 mL/min; 98% methane, 2% H2O, 200 ppm O2.
Methanol (Red column) and carbon dioxide (Dark Yellow column) shown as products.
0 100 200 300 400 5000
200
400
600
800
1000
ST
Y (
mm
ol/
mo
l Cu· h
)
Reaction time (min)
T= 523 K
0 100 200 300 400 5000
200
400
600
800
1000
T= 573 K
ST
Y (
mm
ol/
mo
l Cu· h
)
Reaction time (min)
0 100 200 300 400 5000
200
400
600
800
1000
T= 623 K
ST
Y (
mm
ol/
mo
l Cu· h
)
Reaction time (min)
0 100 200 300 400 5000
200
400
600
800
1000
ST
Y (
mm
ol/
mo
l Cu· h
)
Reaction time (min)
T= 673 K
0 100 200 300 400 5000
200
400
600
800
1000
T= 723 K
ST
Y (
mm
ol/
mo
l Cu· h
)
Reaction time (min)
22
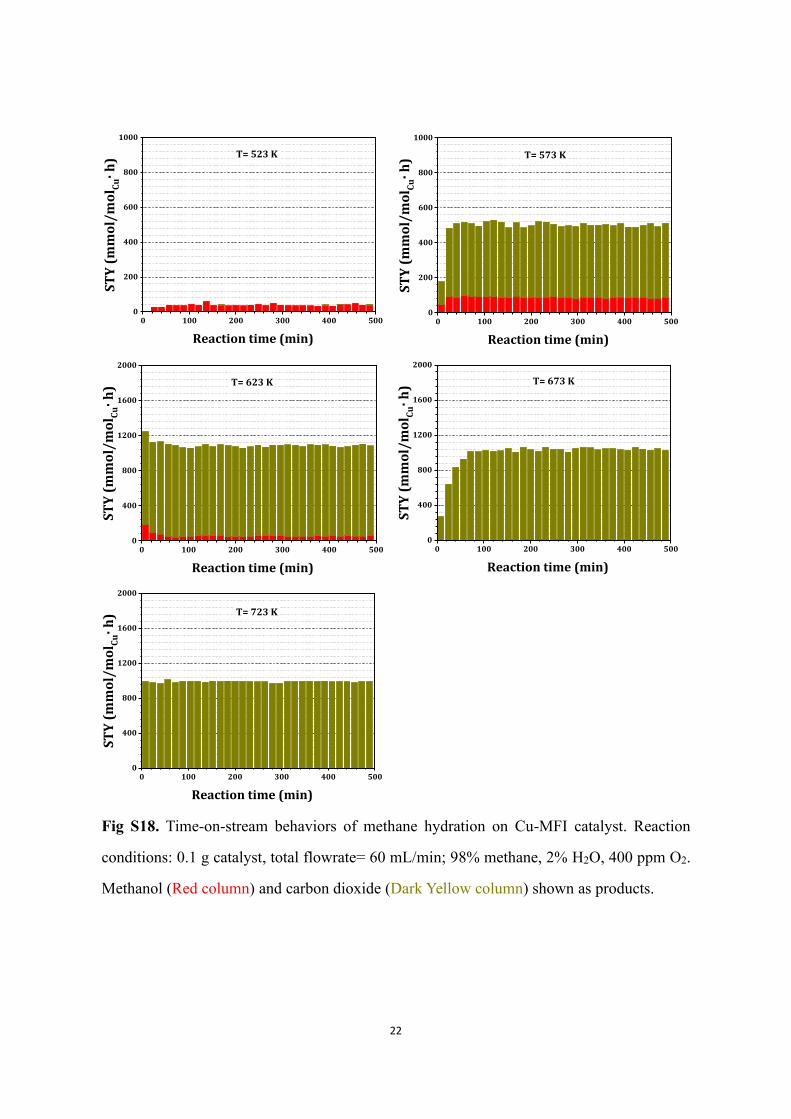
Fig S18. Time-on-stream behaviors of methane hydration on Cu-MFI catalyst. Reaction
conditions: 0.1 g catalyst, total flowrate= 60 mL/min; 98% methane, 2% H2O, 400 ppm O2.
Methanol (Red column) and carbon dioxide (Dark Yellow column) shown as products.
0 100 200 300 400 5000
200
400
600
800
1000
ST
Y (
mm
ol/
mo
l Cu· h
)
Reaction time (min)
T= 523 K
0 100 200 300 400 5000
200
400
600
800
1000
T= 573 K
ST
Y (
mm
ol/
mo
l Cu· h
)
Reaction time (min)
0 100 200 300 400 5000
400
800
1200
1600
2000
T= 623 K
ST
Y (
mm
ol/
mo
l Cu· h
)
Reaction time (min)
0 100 200 300 400 5000
400
800
1200
1600
2000
ST
Y (
mm
ol/
mo
l Cu· h
)
Reaction time (min)
T= 673 K
0 100 200 300 400 5000
400
800
1200
1600
2000
T= 723 K
ST
Y (
mm
ol/
mo
l Cu· h
)
Reaction time (min)
23
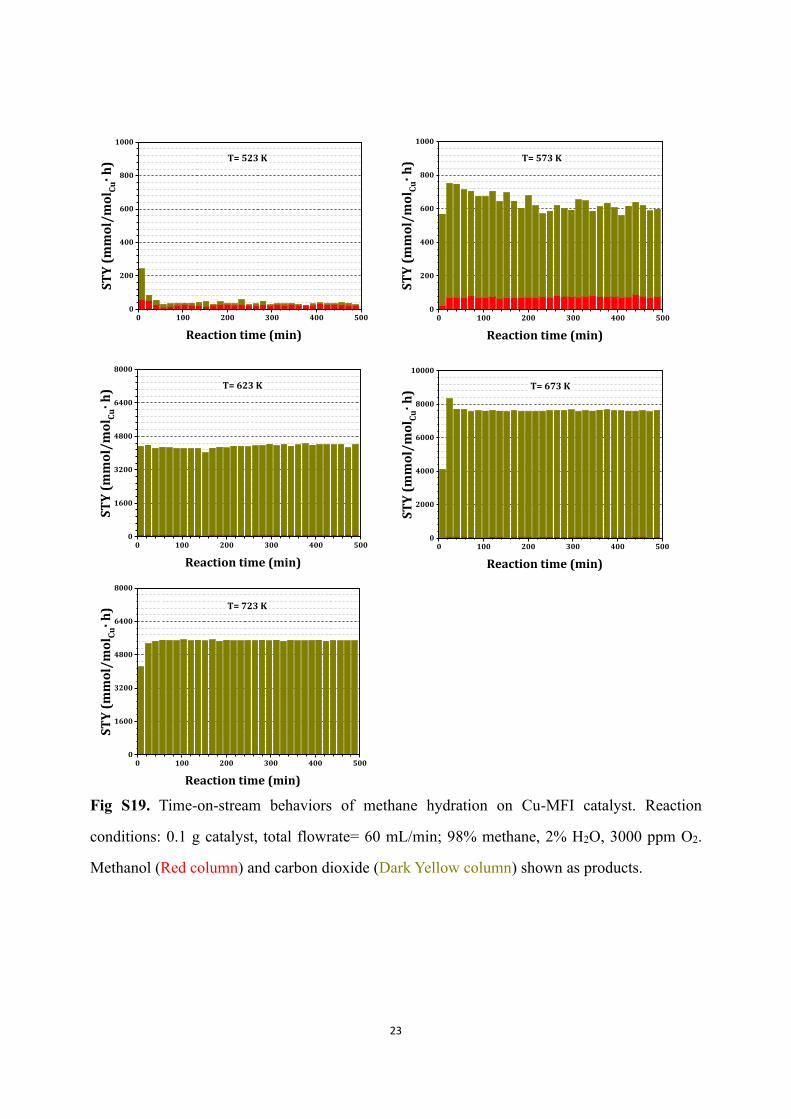
Fig S19. Time-on-stream behaviors of methane hydration on Cu-MFI catalyst. Reaction
conditions: 0.1 g catalyst, total flowrate= 60 mL/min; 98% methane, 2% H2O, 3000 ppm O2.
Methanol (Red column) and carbon dioxide (Dark Yellow column) shown as products.
0 100 200 300 400 5000
200
400
600
800
1000
ST
Y (
mm
ol/
mo
l Cu· h
)
Reaction time (min)
T= 523 K
0 100 200 300 400 5000
200
400
600
800
1000
T= 573 K
ST
Y (
mm
ol/
mo
l Cu· h
)
Reaction time (min)
0 100 200 300 400 5000
1600
3200
4800
6400
8000
T= 623 K
ST
Y (
mm
ol/
mo
l Cu· h
)
Reaction time (min)
0 100 200 300 400 5000
2000
4000
6000
8000
10000
ST
Y (
mm
ol/
mo
l Cu· h
)
Reaction time (min)
T= 673 K
0 100 200 300 400 5000
1600
3200
4800
6400
8000
T= 723 K
ST
Y (
mm
ol/
mo
l Cu· h
)
Reaction time (min)
24
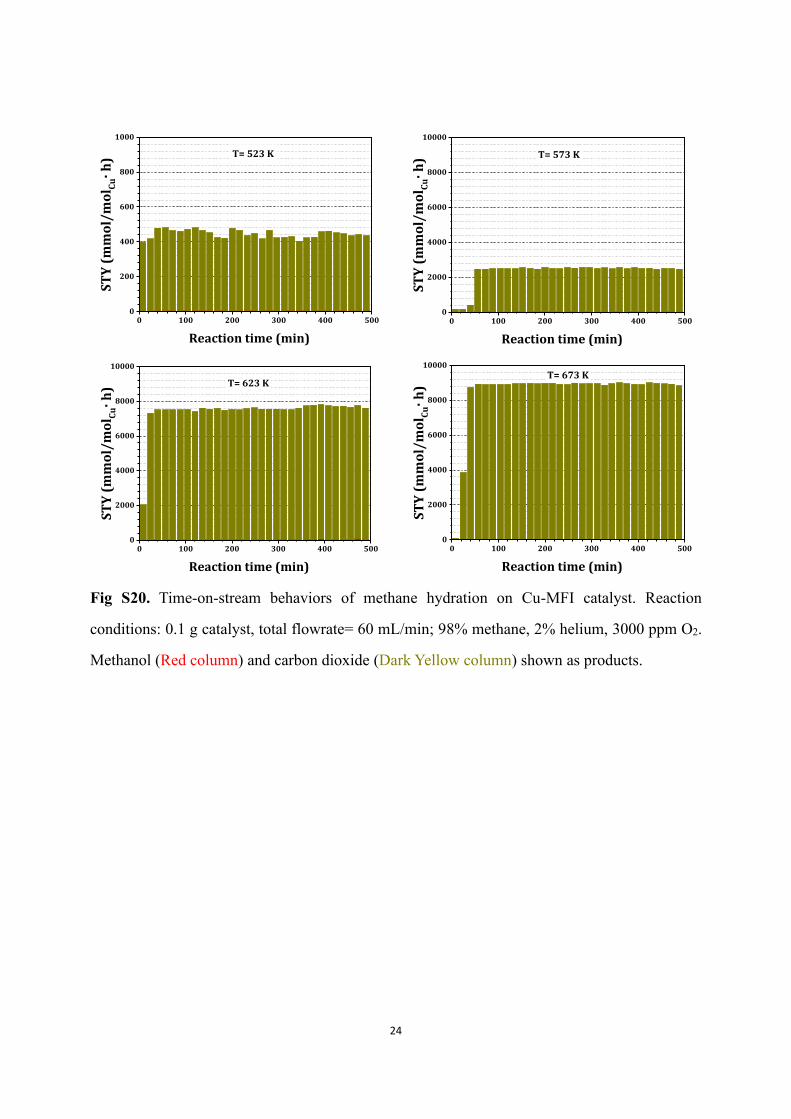
Fig S20. Time-on-stream behaviors of methane hydration on Cu-MFI catalyst. Reaction
conditions: 0.1 g catalyst, total flowrate= 60 mL/min; 98% methane, 2% helium, 3000 ppm O2.
Methanol (Red column) and carbon dioxide (Dark Yellow column) shown as products.
0 100 200 300 400 5000
200
400
600
800
1000
ST
Y (
mm
ol/
mo
l Cu· h
)
Reaction time (min)
T= 523 K
0 100 200 300 400 5000
2000
4000
6000
8000
10000
T= 573 K
ST
Y (
mm
ol/
mo
l Cu· h
)
Reaction time (min)
0 100 200 300 400 5000
2000
4000
6000
8000
10000
T= 623 K
ST
Y (
mm
ol/
mo
l Cu· h
)
Reaction time (min)
0 100 200 300 400 5000
2000
4000
6000
8000
10000
ST
Y (
mm
ol/
mo
l Cu· h
)
Reaction time (min)
T= 673 K
25
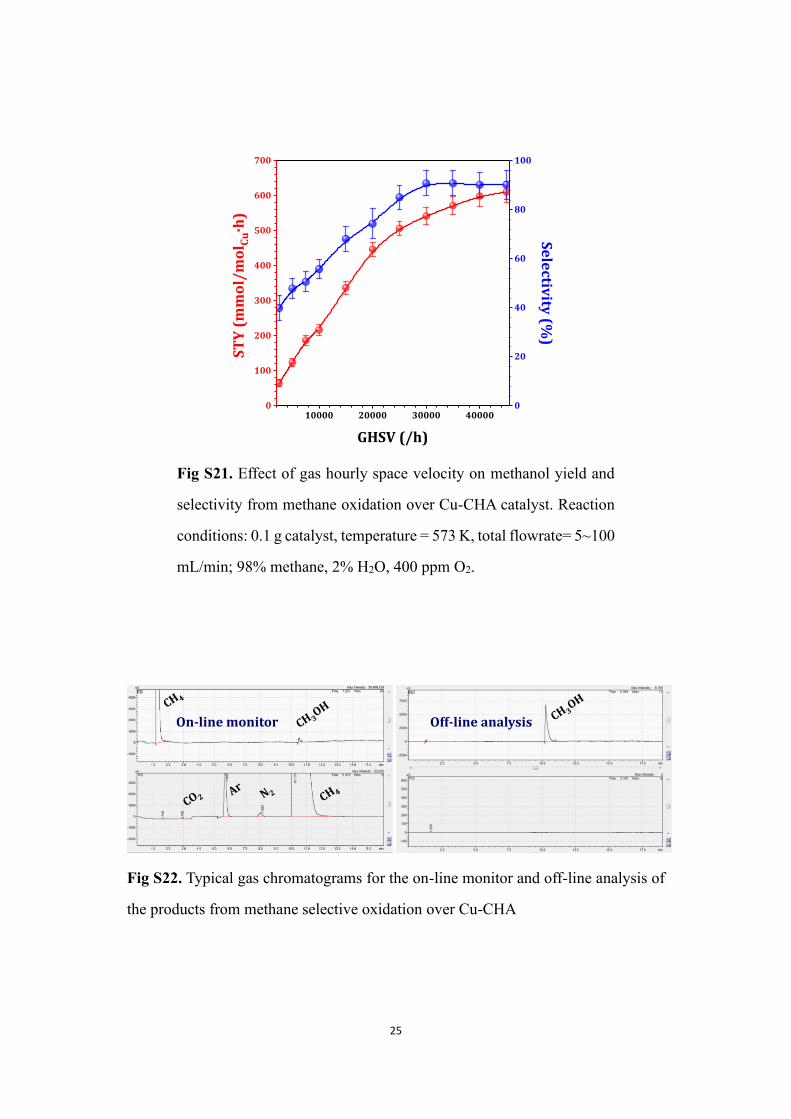
Fig S21. Effect of gas hourly space velocity on methanol yield and
selectivity from methane oxidation over Cu-CHA catalyst. Reaction
conditions: 0.1 g catalyst, temperature = 573 K, total flowrate= 5~100
mL/min; 98% methane, 2% H2O, 400 ppm O2.
Fig S22. Typical gas chromatograms for the on-line monitor and off-line analysis of
the products from methane selective oxidation over Cu-CHA
10000 20000 30000 400000
100
200
300
400
500
600
700
Se
lectiv
ity (%
)S
TY
(m
mo
l/m
ol C
u·h
)
GHSV (/h)
0
20
40
60
80
100
On-line monitor Off-line analysis
26
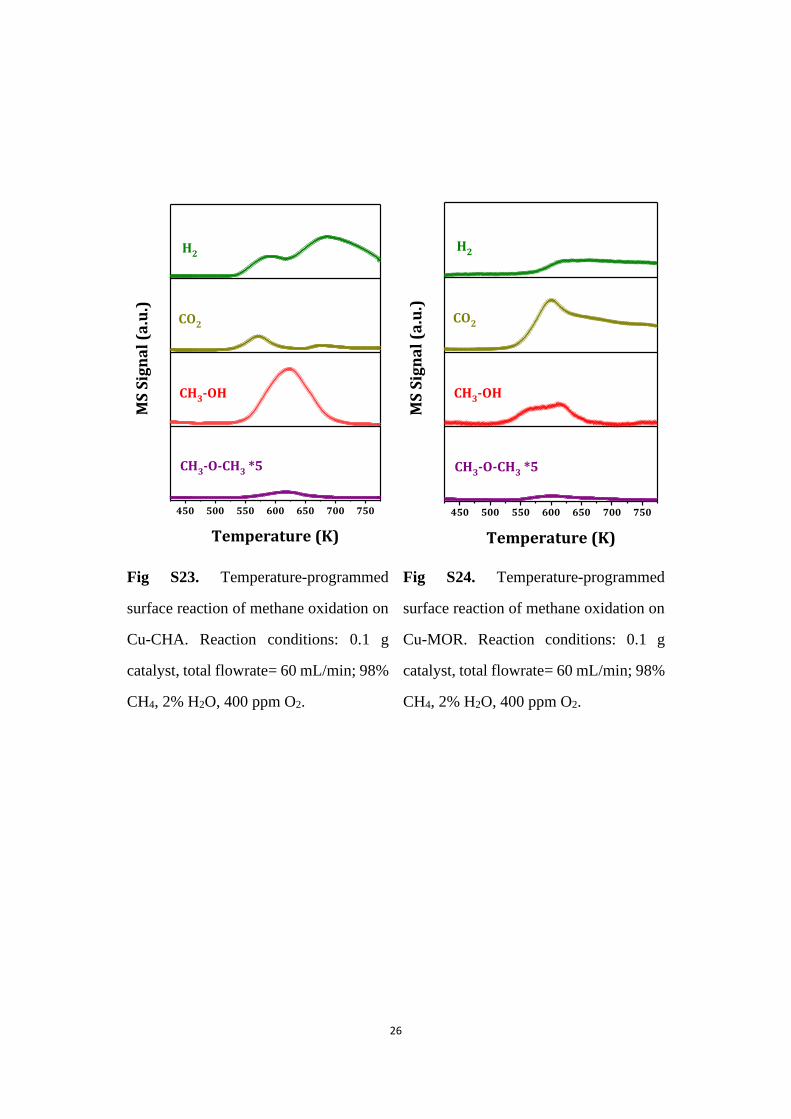
Fig S23. Temperature-programmed
surface reaction of methane oxidation on
Cu-CHA. Reaction conditions: 0.1 g
catalyst, total flowrate= 60 mL/min; 98%
CH4, 2% H2O, 400 ppm O2.
Fig S24. Temperature-programmed
surface reaction of methane oxidation on
Cu-MOR. Reaction conditions: 0.1 g
catalyst, total flowrate= 60 mL/min; 98%
CH4, 2% H2O, 400 ppm O2.
450 500 550 600 650 700 750
H2
CO2
CH3-OH
MS
Sig
na
l (a
.u.)
Temperature (K)
CH3-O-CH3 *5
450 500 550 600 650 700 750
H2
CO2
CH3-OH
MS
Sig
na
l (a
.u.)
Temperature (K)
CH3-O-CH3 *5
27
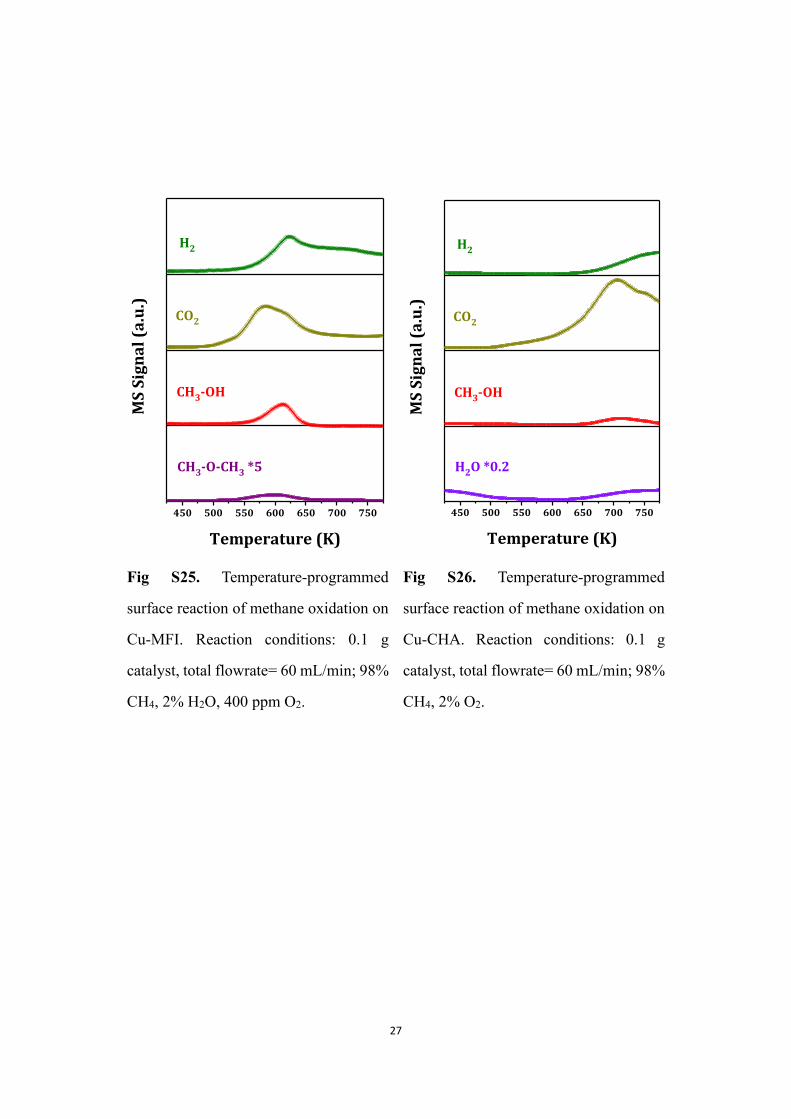
Fig S25. Temperature-programmed
surface reaction of methane oxidation on
Cu-MFI. Reaction conditions: 0.1 g
catalyst, total flowrate= 60 mL/min; 98%
CH4, 2% H2O, 400 ppm O2.
Fig S26. Temperature-programmed
surface reaction of methane oxidation on
Cu-CHA. Reaction conditions: 0.1 g
catalyst, total flowrate= 60 mL/min; 98%
CH4, 2% O2.
450 500 550 600 650 700 750
H2
CO2
CH3-OH
MS
Sig
na
l (a
.u.)
Temperature (K)
CH3-O-CH3 *5
450 500 550 600 650 700 750
H2
CO2
CH3-OH
MS
Sig
na
l (a
.u.)
Temperature (K)
H2O *0.2
28
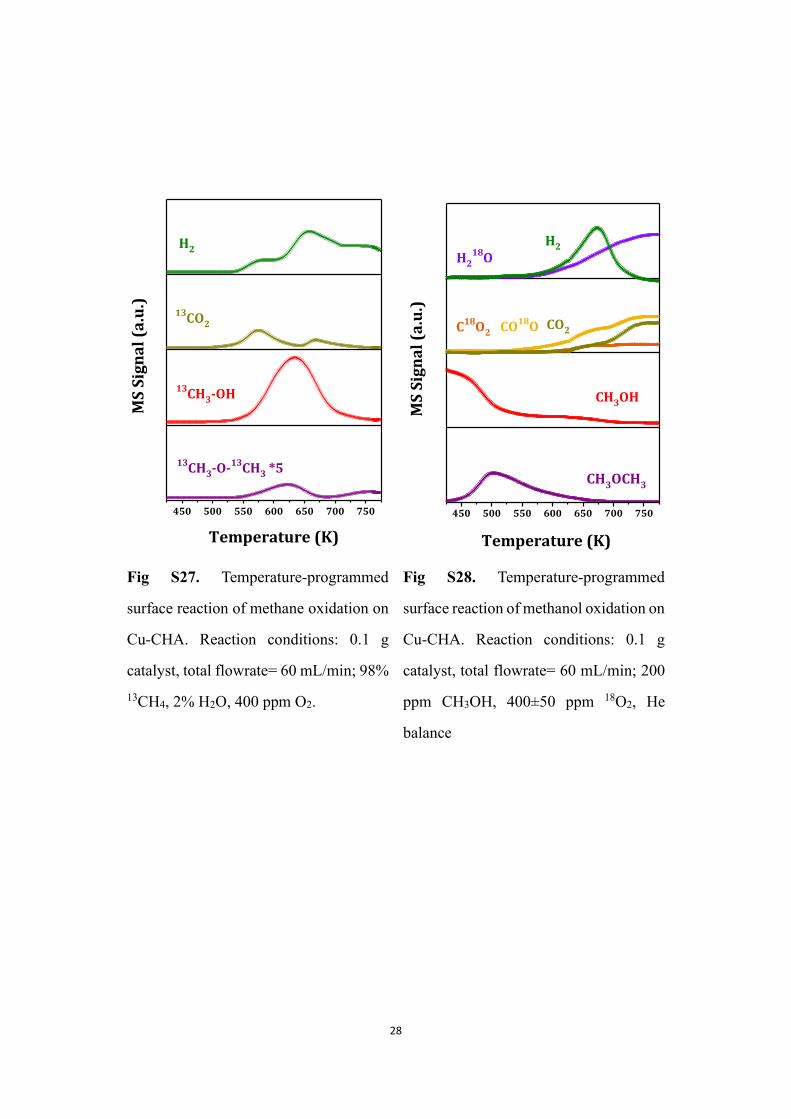
Fig S27. Temperature-programmed
surface reaction of methane oxidation on
Cu-CHA. Reaction conditions: 0.1 g
catalyst, total flowrate= 60 mL/min; 98%
13CH4, 2% H2O, 400 ppm O2.
Fig S28. Temperature-programmed
surface reaction of methanol oxidation on
Cu-CHA. Reaction conditions: 0.1 g
catalyst, total flowrate= 60 mL/min; 200
ppm CH3OH, 400±50 ppm 18O2, He
balance
450 500 550 600 650 700 750
H2
13CO2
13CH3-OH
MS
Sig
na
l (a
.u.)
Temperature (K)
13CH3-O-13CH3 *5
450 500 550 600 650 700 750
H2
CO18OC18O2
CH3OCH3
H218O
CO2
MS
Sig
na
l (a
.u.)
Temperature (K)
CH3OH
29
Fig S29. UV-Vis-NIR spectrum of Cu-CHA recorded in flowing helium at
473 K. The region of d-d transitions, charge transfer transitions and LMCT
transitions shown for reference.
Fig S30. In situ UV-Vis-NIR spectra of Cu-CHA treated in different atmospheres at
increasing temperature from 473 to 773 K (color changes from light to dark).
Conditions: 25 mg catalyst, total flowrate= 15 mL/min; 98% CH4, or 2% H2O, or 400
ppm O2, He balance
50000 40000 30000 20000 10000
LM
CT
charge tranfer
transitions
Inte
nsi
ty (
a.u
.)
Wavenumber (cm-1)
d-d
transitions
50000 40000 30000 20000 10000
Inte
nsi
ty (
a.u
.)
Wavenumber (cm-1)
CH4
50000 40000 30000 20000 10000
Inte
nsi
ty (
a.u
.)
Wavenumber (cm-1)
O2
50000 40000 30000 20000 10000
Inte
nsi
ty (
a.u
.)
Wavenumber (cm-1)
H2O
30
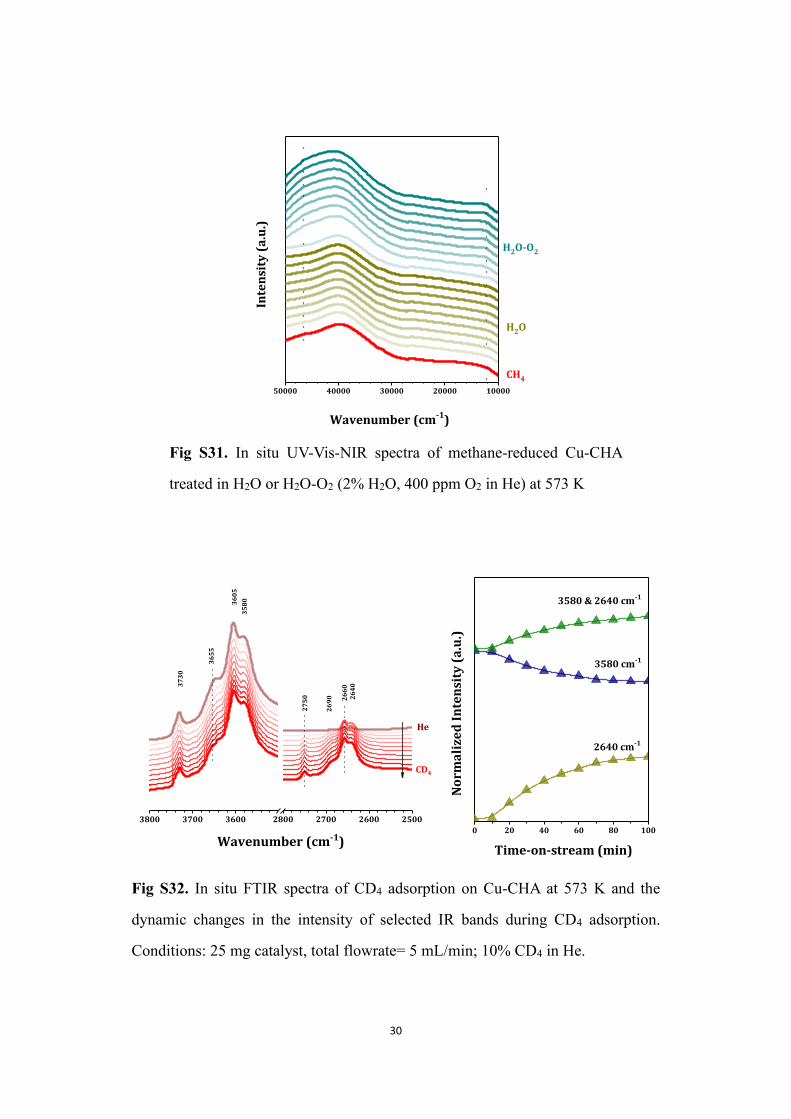
Fig S31. In situ UV-Vis-NIR spectra of methane-reduced Cu-CHA
treated in H2O or H2O-O2 (2% H2O, 400 ppm O2 in He) at 573 K
Fig S32. In situ FTIR spectra of CD4 adsorption on Cu-CHA at 573 K and the
dynamic changes in the intensity of selected IR bands during CD4 adsorption.
Conditions: 25 mg catalyst, total flowrate= 5 mL/min; 10% CD4 in He.
50000 40000 30000 20000 10000
H2O-O2
H2O
Wavenumber (cm-1)
Inte
nsi
ty (
a.u
.)
CH4
0 20 40 60 80 100
3580 & 2640 cm-1
3580 cm-1
2640 cm-1
Time-on-stream (min)
No
rma
lize
d I
nte
nsi
ty (
a.u
.)
3800 3700 3600 2800 2700 2600 2500
CD4
36
55
26
90 26
60
27
50
37
30
35
8036
05
26
40
Wavenumber (cm-1)
He
31
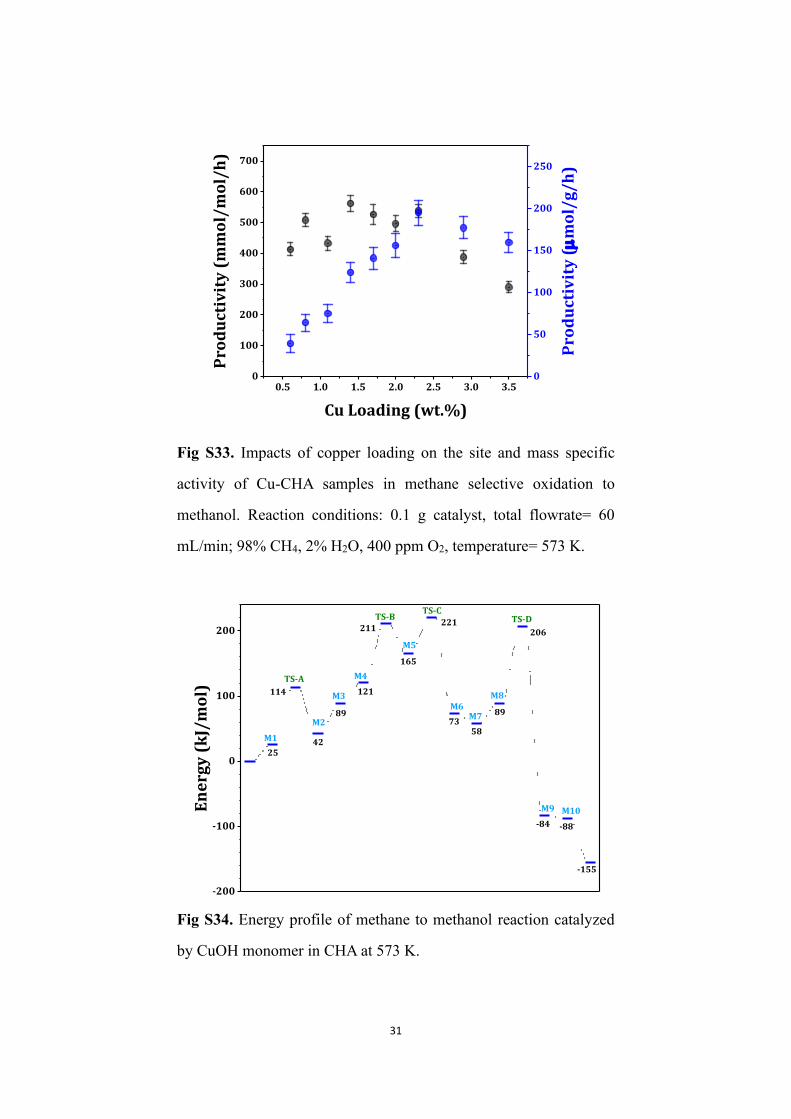
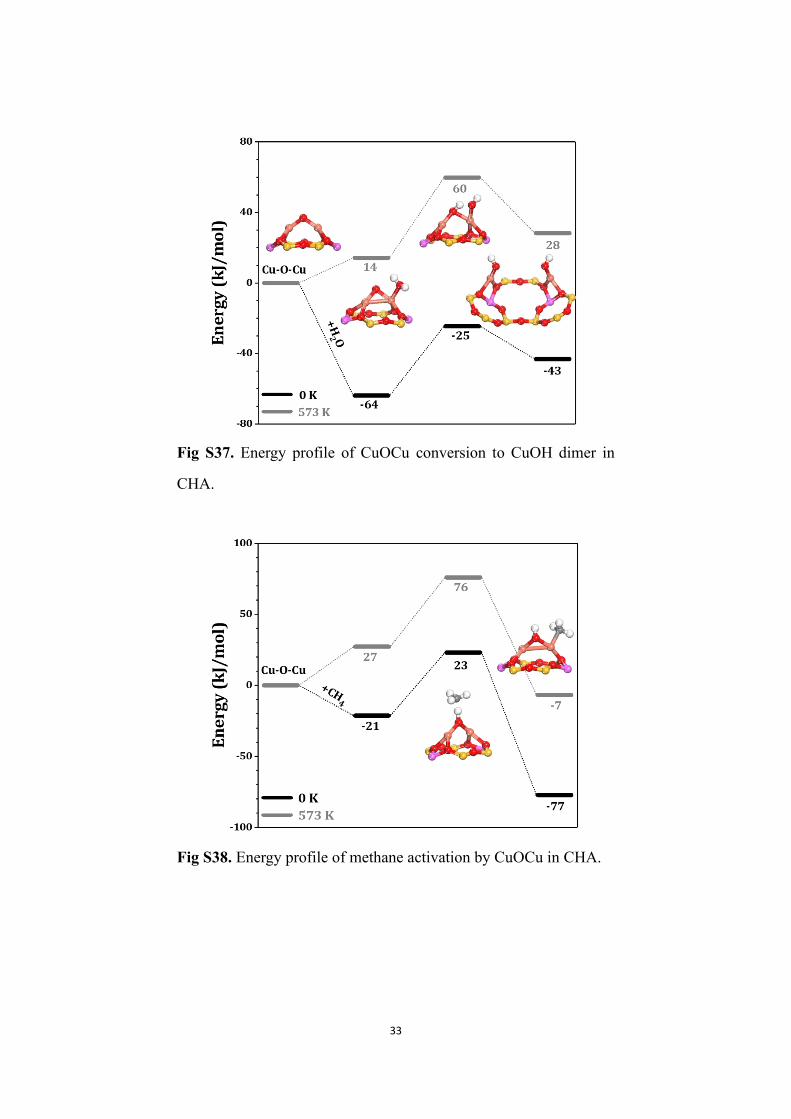
Fig S33. Impacts of copper loading on the site and mass specific
activity of Cu-CHA samples in methane selective oxidation to
methanol. Reaction conditions: 0.1 g catalyst, total flowrate= 60
mL/min; 98% CH4, 2% H2O, 400 ppm O2, temperature= 573 K.
Fig S34. Energy profile of methane to methanol reaction catalyzed
by CuOH monomer in CHA at 573 K.
0.5 1.0 1.5 2.0 2.5 3.0 3.50
100
200
300
400
500
600
700
Cu Loading (wt.%)
Pro
du
ctiv
ity
(m
mo
l/m
ol/
h)
0
50
100
150
200
250
Pro
du
ctiv
ity
(
mo
l/g
/h
)
-200
-100
0
100
200
-155
-88-84
206
89
5873
221
165
211
121
89
114
4225
TS-DTS-C
TS-B
TS-A
En
erg
y (
kJ/
mo
l)
M10M9
M8
M7M6
M5
M4
M1
M3
M2
32
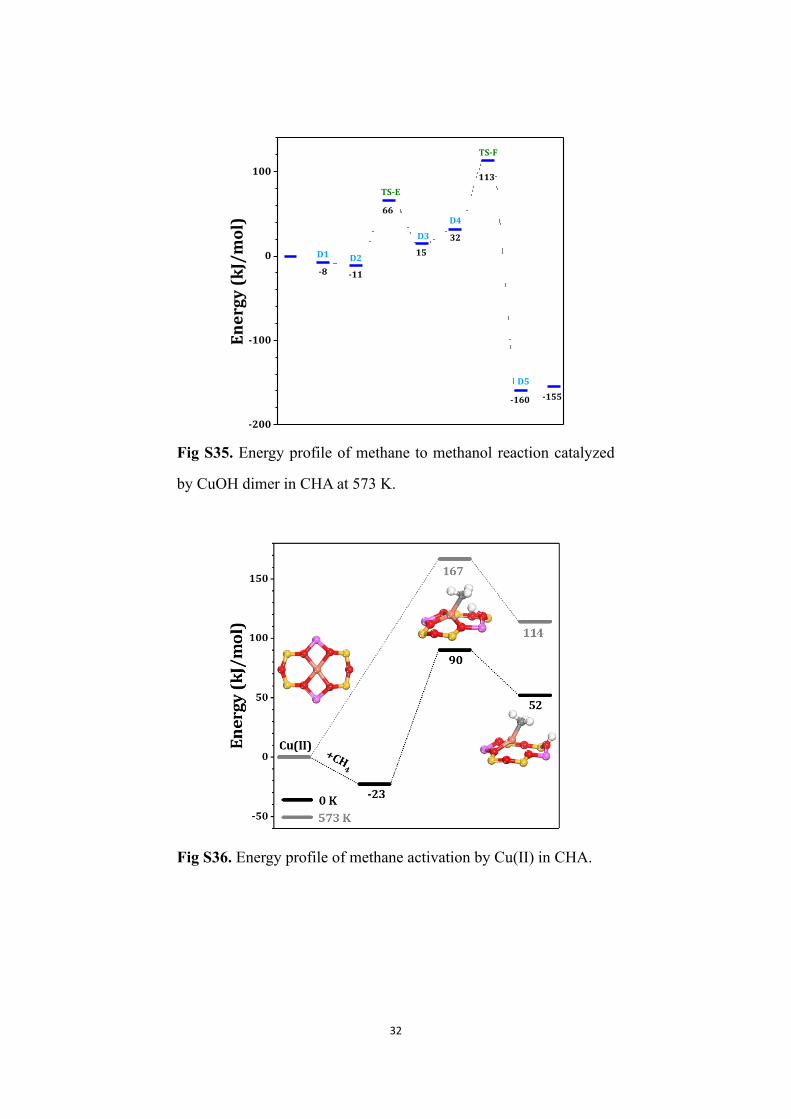
Fig S35. Energy profile of methane to methanol reaction catalyzed
by CuOH dimer in CHA at 573 K.
Fig S36. Energy profile of methane activation by Cu(II) in CHA.
-200
-100
0
100
-155-160
113
32
15
66
-11-8
TS-F
TS-E
D5
D4
D3
D2D1
En
erg
y (
kJ/
mo
l)
33
Fig S37. Energy profile of CuOCu conversion to CuOH dimer in
CHA.
Fig S38. Energy profile of methane activation by CuOCu in CHA.
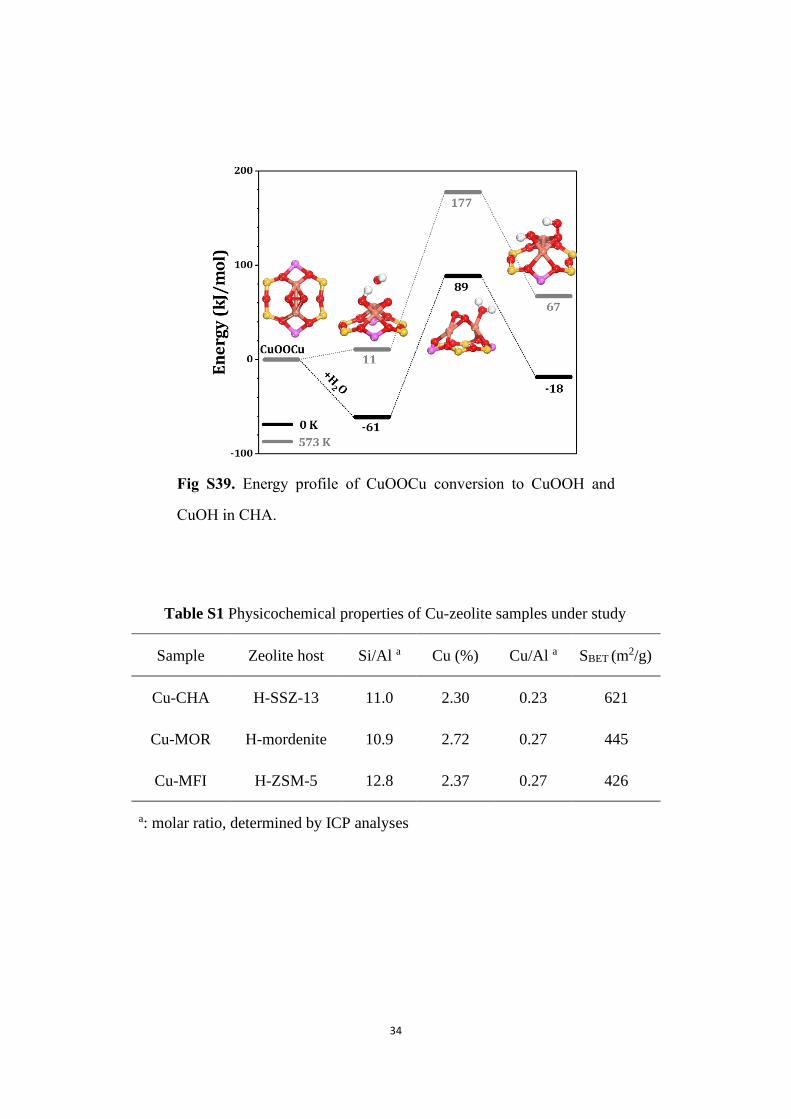
34
Fig S39. Energy profile of CuOOCu conversion to CuOOH and
CuOH in CHA.
Table S1 Physicochemical properties of Cu-zeolite samples under study
Sample Zeolite host Si/Al a Cu (%) Cu/Al a SBET (m2/g)
Cu-CHA H-SSZ-13 11.0 2.30 0.23 621
Cu-MOR H-mordenite 10.9 2.72 0.27 445
Cu-MFI H-ZSM-5 12.8 2.37 0.27 426
a: molar ratio, determined by ICP analyses
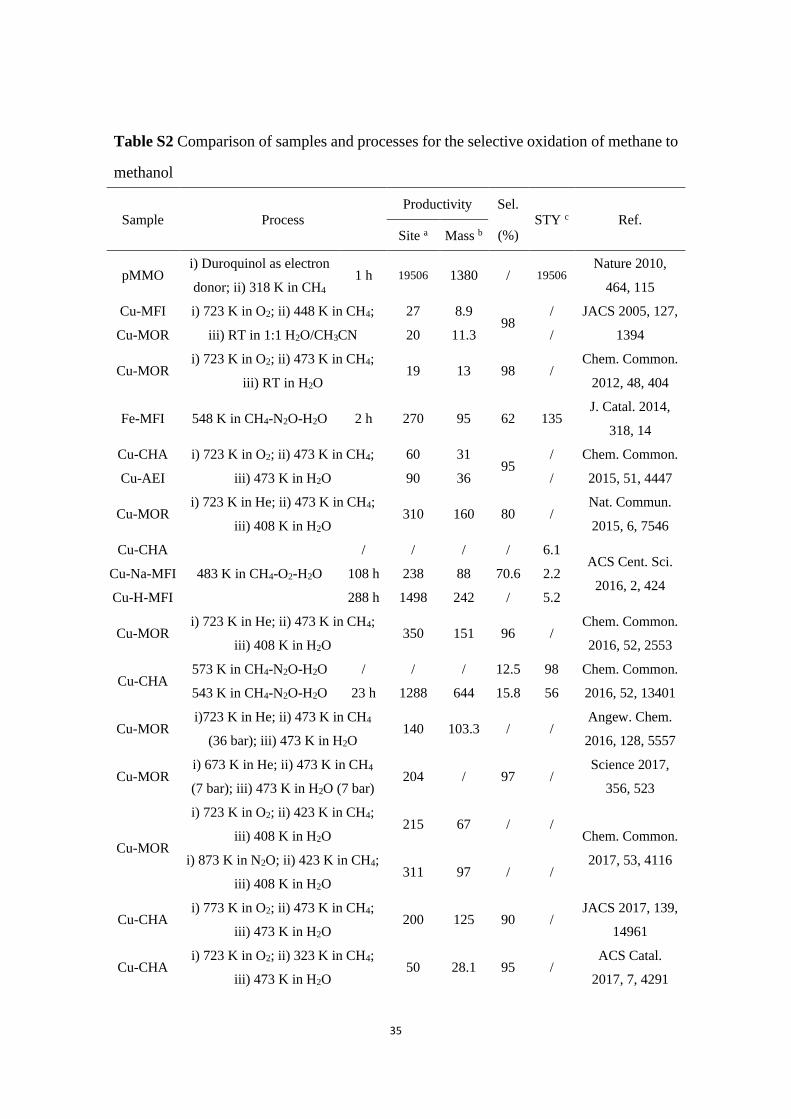
35
Table S2 Comparison of samples and processes for the selective oxidation of methane to
methanol
Sample Process Productivity Sel.
(%) STY c Ref.
Site a Mass b
pMMO i) Duroquinol as electron
donor; ii) 318 K in CH4 1 h 19506 1380 / 19506
Nature 2010,
464, 115
Cu-MFI i) 723 K in O2; ii) 448 K in CH4;
iii) RT in 1:1 H2O/CH3CN
27 8.9 98
/ JACS 2005, 127,
1394 Cu-MOR 20 11.3 /
Cu-MOR i) 723 K in O2; ii) 473 K in CH4;
iii) RT in H2O 19 13 98 /
Chem. Common.
2012, 48, 404
Fe-MFI 548 K in CH4-N2O-H2O 2 h 270 95 62 135 J. Catal. 2014,
318, 14
Cu-CHA i) 723 K in O2; ii) 473 K in CH4;
iii) 473 K in H2O
60 31 95
/ Chem. Common.
2015, 51, 4447 Cu-AEI 90 36 /
Cu-MOR i) 723 K in He; ii) 473 K in CH4;
iii) 408 K in H2O 310 160 80 /
Nat. Commun.
2015, 6, 7546
Cu-CHA
483 K in CH4-O2-H2O
/ / / / 6.1 ACS Cent. Sci.
2016, 2, 424 Cu-Na-MFI 108 h 238 88 70.6 2.2
Cu-H-MFI 288 h 1498 242 / 5.2
Cu-MOR i) 723 K in He; ii) 473 K in CH4;
iii) 408 K in H2O 350 151 96 /
Chem. Common.
2016, 52, 2553
Cu-CHA 573 K in CH4-N2O-H2O / / / 12.5 98 Chem. Common.
2016, 52, 13401 543 K in CH4-N2O-H2O 23 h 1288 644 15.8 56
Cu-MOR i)723 K in He; ii) 473 K in CH4
(36 bar); iii) 473 K in H2O 140 103.3 / /
Angew. Chem.
2016, 128, 5557
Cu-MOR i) 673 K in He; ii) 473 K in CH4
(7 bar); iii) 473 K in H2O (7 bar) 204 / 97 /
Science 2017,
356, 523
Cu-MOR
i) 723 K in O2; ii) 423 K in CH4;
iii) 408 K in H2O 215 67 / /
Chem. Common.
2017, 53, 4116 i) 873 K in N2O; ii) 423 K in CH4;
iii) 408 K in H2O 311 97 / /
Cu-CHA i) 773 K in O2; ii) 473 K in CH4;
iii) 473 K in H2O 200 125 90 /
JACS 2017, 139,
14961
Cu-CHA i) 723 K in O2; ii) 323 K in CH4;
iii) 473 K in H2O 50 28.1 95 /
ACS Catal.
2017, 7, 4291
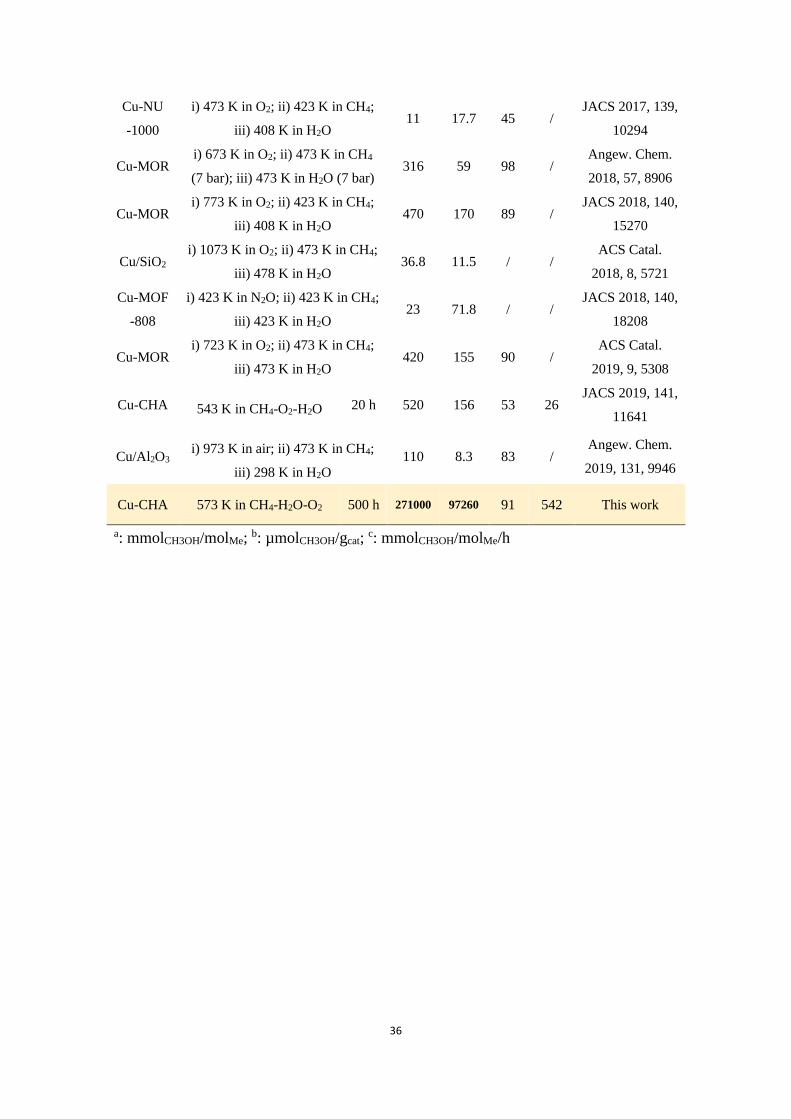
36
Cu-NU
-1000
i) 473 K in O2; ii) 423 K in CH4;
iii) 408 K in H2O 11 17.7 45 /
JACS 2017, 139,
10294
Cu-MOR i) 673 K in O2; ii) 473 K in CH4
(7 bar); iii) 473 K in H2O (7 bar) 316 59 98 /
Angew. Chem.
2018, 57, 8906
Cu-MOR i) 773 K in O2; ii) 423 K in CH4;
iii) 408 K in H2O 470 170 89 /
JACS 2018, 140,
15270
Cu/SiO2 i) 1073 K in O2; ii) 473 K in CH4;
iii) 478 K in H2O 36.8 11.5 / /
ACS Catal.
2018, 8, 5721
Cu-MOF
-808
i) 423 K in N2O; ii) 423 K in CH4;
iii) 423 K in H2O 23 71.8 / /
JACS 2018, 140,
18208
Cu-MOR i) 723 K in O2; ii) 473 K in CH4;
iii) 473 K in H2O 420 155 90 /
ACS Catal.
2019, 9, 5308
Cu-CHA 543 K in CH4-O2-H2O 20 h 520 156 53 26 JACS 2019, 141,
11641
Cu/Al2O3 i) 973 K in air; ii) 473 K in CH4;
iii) 298 K in H2O 110 8.3 83 /
Angew. Chem.
2019, 131, 9946
Cu-CHA 573 K in CH4-H2O-O2 500 h 271000 97260 91 542 This work
a: mmolCH3OH/molMe; b: µmolCH3OH/gcat;
c: mmolCH3OH/molMe/h

download fileview on ChemRxivSupplementary Materials.pdf (3.57 MiB)