Embed Size (px)
Citation preview
MQP-WMC-1916
Kinetic Analysis and Development of a Complete Catalytic
Oxidation of Methane
Experiment for Unit Operations II
A Major Qualifying Project Report
Submitted to the Faculty
of the
WORCESTER POLYTECHNIC INSTITUTE
In partial fulfillment of the requirements for the
Degree of Bachelor of Science
Submitted by:
____________________________________
Timothy Dobosz
____________________________________
Joshua Powell
____________________________________
Thomas Wise
Approved:
____________________________________
William M. Clark, Advisor
April 5, 2013
ii
Abstract
Catalysts are widely used in the chemical process industry to increase yields and
production rates of industrial reactions. Using the packed bed reactors in Goddard Hall at
Worcester Polytechnic Institute, which contain palladium and platinum as catalysts, the kinetics
of complete methane oxidation over each catalyst were examined. The activation energy was
calculated for this reaction over both catalysts and was found to be within the range provided by
literature. Similarly, reaction orders with respect to methane were calculated and were
determined to be reasonably close to literature values. The existing system was redesigned to
deliver quicker and simpler results via the replacement of the gas chromatograph with two
carbon dioxide meters. It was determined that the carbon dioxide meters were a sufficient
replacement for the gas chromatograph for the purposes of unit operations experimentation. As a
result of the changes made to the physical system, a new experimental procedure was proposed.
The procedure was designed to provide a more complete study and understanding of catalysis for
senior chemical engineering students.
iii
Acknowledgements
First and foremost, we would like to thank Professor William M. Clark for all of his
assistance to our project group. Professor Clark’s support throughout the duration of the project
enabled us to accomplish our goals. Professor Clark always helped mitigate every unforeseen
difficulty that delayed the progress of our project. For all of his help throughout the entire
academic year, we sincerely thank Professor Clark.
Second, we would like to thank Giacomo Ferraro for his effort. Giacomo was essential to
the redesign and rebuilding process of our reactor system. His mechanical expertise and working
knowledge of the reactor system were crucial to the successful completion of this project.
Finally, we would like to thank the Department of Chemical Engineering at Worcester
Polytechnic Institute. The department provided our group with all of the financial backing that
was necessary to achieve the goals of the project. Without the support of the department, this
project would never have existed.
iv
Executive Summary
Catalysts are widely used in the chemical process industry to increase yields and
production rates of industrial reactions. Worcester Polytechnic Institute introduces the study of
kinetics in two undergraduate classes; Kinetics and Reactor Design (ChE 3501) and Unit
Operations of Chemical Engineering II (ChE 4402); however, only ChE 4402 includes the study
of catalysis in its syllabus. One experiment in this laboratory course, offered to senior-level
chemical engineering students, is designed for the analysis of complete methane oxidation via a
palladium catalyst in a differential packed bed reactor.
The physical system for this experiment had problems prior to the start of this project.
First, the reactor system had extraneous equipment and piping, which was necessary for liquid
reactions. This equipment was obsolete because recent experimental procedures only called for
gas-phase reactions to be carried out. The either broken or redundant valves that were attached to
the maze of piping were cumbersome, which made the system difficult to operate. Also, the gas
chromatograph took too long to collect data from the reactor. Students running the catalytic
reactor would often have to stay long past the class time allotted for experimentation. It was
necessary to remedy the shortcomings of this experiment to provide a better experience for
students taking this lab.
The goal of this project was to improve the general understanding of catalytic reaction
systems for future senior chemical engineering students taking unit operations II at Worcester
Polytechnic Institute. Additionally, this project was intended to improve the quality of the unit
operations catalysis experiment through the system redesign and the kinetic analysis of the
reaction. The goal of this project was achieved through the execution of three main objectives.
The first of these objectives was to collect data from the catalytic reactor system using the gas
v
chromatograph already present in the system. The second objective was to install a reliable
instrument to allow more efficient data collection than the gas chromatograph, namely the
microprocessor based CO2 meters. The third objective was to redesign and reconstruct the
reactor system, and to compare the experimental results to previously gathered results.
After experimentation was completed, the reaction rate, reaction order, and activation
energies were calculated and tabulated. The reaction orders obtained from the gas chromatograph
and the CO2 meters did not match each other. The activation energy results for temperature
dependence proved that the modes of data collection were all fairly consistent. This confirmed
the ability of the CO2 meters to function similarly to one another. These values from the CO2
meters fell within the range given by the literature. Additionally, the reaction order with respect
to methane was determined to be reasonably close to the values published in literature.
During the B-term lab session, the gas chromatograph became dysfunctional due to an
external, unforeseen software issue. The CO2 meters were immediately, permanently installed to
allow experimentation to continue. At the completion of the course, the system was redesigned to
shorten experimental time as well as to simplify and improve the general experiment quality. All
of the extraneous parts that were originally intended for liquid flow were eliminated from the
system. Both of the reactor beds, which were contaminated with rust, were cleaned prior to
reinstallation. The first reactor was repacked with glass beads and 5.01g of 0.5% platinum
supported on alumina catalyst. The second reactor was repacked with glass beads and 5.03g of
0.5% palladium catalyst supported on alumina catalyst. The system operation was affected by
the redesign through a reduced residence time for the process stream, the result of the reduced
piping in the system and the removal of the unnecessary equipment. At the standard air flow rate
for this experiment (858 mL/min), the residence time was reduced from 90-120s to 15-30s.
vi
Both CO2 meters collected reproducible reaction rate data of 5.6x10⁻⁵
mol CO2/s*gcat and
2.6x10⁻⁴
mol CO2/s*gcat before and after redesign, respectively. Furthermore, the value recorded
by the 30% meter for reaction order increased from 1.18 to 1.32 after the redesign. These
significant increases could be attributed to the catalyst replacement and general cleaning in the
reactor. These changes resulted in the elimination of excess carbon deposit and rust that had
accumulated internally. Therefore, upon re-packing the reactor, which had not been done in
several years, the reactivity may have increased. The efficacy of the new reaction would lead to
the plausibility of a reaction rate and order increase.
The addition of platinum catalyst to the experiment was important to the unit operations
laboratory because the other experiments do not pertain to catalysis. It is expected that students
examine the difference in function between different catalysts and understand that some are more
effective for such reactions as methane oxidation. Students should determine that palladium is
much more effective than platinum for the catalytic oxidation of methane. The oxidized surface
of palladium is much more reactive than the metallic platinum catalyst at the temperatures for
this specific experiment.
vii
Table of Contents
Abstract ......................................................................................................................................................... ii
Acknowledgements ...................................................................................................................................... iii
Executive Summary ..................................................................................................................................... iv
Table of Figures ........................................................................................................................................... ix
Table of Tables ............................................................................................................................................. x
Chapter 1: Introduction ................................................................................................................................. 1
Chapter 2: Literature Review ........................................................................................................................ 4
Chapter 2.1: Reactor Engineering ............................................................................................................. 4
Chapter 2.1.1: Batch Reactor ............................................................................................................... 4
Chapter 2.1.2: Continuous Stirred-Tank Reactors ............................................................................... 5
Chapter 2.1.3: Packed Bed Reactor ...................................................................................................... 6
Chapter 2.1.4: Comparing the Batch, CSTR, and PBR ........................................................................ 9
Chapter 2.2: Kinetic Rate Laws .............................................................................................................. 10
Chapter 2.2.1: Zero Order Rate Law .................................................................................................. 11
Chapter 2.2.2: First Order Rate Law ................................................................................................. 11
Chapter 2.2.3: Second Order Rate Law .............................................................................................. 12
Chapter 2.2.4: Non-Integer Rate Law ................................................................................................ 13
Chapter 2.2.5: Activation Energy ....................................................................................................... 13
Chapter 2.3: Methane Concerns in the Environment .............................................................................. 14
Chapter 2.3.1: The Catalytic Oxidation of Methane ........................................................................... 14
Chapter 2.3.2: Methane Behavior ....................................................................................................... 14
Chapter 2.3.3: Palladium Catalyst Behavior ...................................................................................... 15
Chapter 2.3.4: Methane Oxidation Mechanism .................................................................................. 16
Chapter 2.3.5: Platinum v. Palladium Catalyst Behavior for Methane Oxidation ............................. 17
Chapter 2.3.6: Economics of Palladium and Platinum as Catalysts .................................................. 18
Chapter 2.4: Existing Unit Operations Experiment ................................................................................ 19
Chapter 2.4.1: Gas Chromatograph ................................................................................................... 21
Chapter 2.4.2: Issues in the Experiment ............................................................................................. 23
Chapter 2.4.3: CO2 Meter ................................................................................................................... 24
Chapter 3: Methodology ............................................................................................................................. 25
viii
Chapter 3.1: Operation of the Reactor System........................................................................................ 26
Chapter 3.3: Redesign of the Reactor System ......................................................................................... 30
Chapter 4: Results ....................................................................................................................................... 32
Chapter 4.1: Validation of the Reaction Rate and Order Results ........................................................... 32
Chapter 4.2: Validation of the Activation Energy Results ...................................................................... 33
Chapter 4.3: Comparison between Palladium and Platinum as a Catalyst.............................................. 34
Chapter 4.4: Redesign of Reactor System .............................................................................................. 35
Chapter 5: Discussion ................................................................................................................................. 36
Chapter 5.1: The Kinetics of the Reaction .............................................................................................. 36
Chapter 5.2: Gas Chromatograph Efficiency versus CO2 Meter Efficiency ........................................... 36
Chapter 5.2.1: The Re-packed Reactors ............................................................................................. 37
Chapter 5.2.2: The CO2 Meters ........................................................................................................... 38
Chapter 5.2.3: System Redesign ......................................................................................................... 42
Chapter 5.2.4: System Reassembly ..................................................................................................... 43
Chapter 5.3: Addition of the Platinum Catalyst ...................................................................................... 45
Chapter 6: Conclusions and Recommendations .......................................................................................... 47
Chapter 7: References ................................................................................................................................. 49
Appendix A: Pt. Raw Data from 30% Meter at 650K ................................................................................ 53
Appendix B: Pd. Raw Data from 30% Meter at 550K ................................................................................ 54
Appendix C: Pd. Raw Data from 3% Meter at 550K .................................................................................. 56
Appendix D: Pd. Raw Data at Variable Temperature ................................................................................. 57
Appendix E: Pt. Raw Data at Variable Temperature .................................................................................. 59
Appendix F: Water Contamination Data .................................................................................................... 61
Appendix G: Proposed New Experimental Procedures .............................................................................. 62
Appendix H: Operating Procedure for CO2 Meters .................................................................................... 65
Appendix I: Calibration Procedure for CO2 Meters .................................................................................... 66
ix
Table of Figures
Figure 1. Effects of a Gradual Temperature Increase in a PBR18
................................................................. 8
Figure 2. Basic CSTR: Image Modified From: Riggs, James B. & Karim, Nazmul M.18
............................ 9
Figure 3. Basic Batch Reactor with Impeller. ............................................................................................... 9
Figure 4. Basic Packed Bed Reactor: Image Modified from Curtis et. al.20
............................................... 10
Figure 5. Drawing of Packed Bed Reactor Internals................................................................................... 20
Figure 6. Block Diagram of the Relevant Components to the Catalytic Reactor Experiment. ................... 21
Figure 7. Gas Chromatograph Sample Method for Analysis of Combustion of Methane .......................... 22
Figure 8. Redesigned Catalytic Reactor System. ........................................................................................ 35
Figure 9. Process Flow Diagram for Old Design of System. ...................................................................... 42
Figure 10. Before and After of the System Redesign. ................................................................................ 44
Figure 11. Reaction Order for Platinum Catalyst using the 30% Meter at 650K. ...................................... 53
Figure 12. Reaction Order for Palladium Catalyst using the 30% Meter at 550K Before Redesign. ......... 54
Figure 13. Reaction Order for Palladium Catalyst Using 30% Meter at 550 After Redesign. ................... 55
Figure 14. Reaction Order for Palladium Catalyst Using 3% Meter at 550K After Redesign. .................. 56
Figure 15. Activation Energy for Palladium Using 30% Meter. ................................................................. 57
Figure 16. Activation Energy for Palladium Using 30% Meter. ................................................................. 58
Figure 17. Activation Energy for Platinum Using 30% Meter. .................................................................. 59
Figure 18. Activation Energy for Platinum Using 3% Meter. .................................................................... 60
Figure 19. CO2 Concentration v. CH4 Feed % at 550K on Pd ................................................................... 61
Figure 20. CO2 Meter Operation Tutorial Part 1 ......................................................................................... 65
Figure 21. CO2 Meter Operation Tutorial Part 2 ......................................................................................... 65
Figure 22. CO2 Meter Calibration Tutorial Part 1 ....................................................................................... 66
Figure 23. CO2 Meter Calibration Tutorial Part 2 ....................................................................................... 66
x
Table of Tables
Table 1. Retention Times for the Four Components in the Gas Chromatograph Feed. .............................. 22
Table 2: Comparison of Reaction Rates and Orders Obtained by Different Data Collection Methods ...... 32
Table 3: Comparison of Activation Energy Obtained by Different Data Collection Methods ................... 33
Table 4: Comparison of Palladium and Platinum Catalysts ........................................................................ 34
Table 5. Raw Data from the 30% CO2 Meter at 650K for Platinum Catalyst............................................. 53
Table 6. Raw Data from the 30% CO2 Meter at 550K for Palladium Catalyst Before Redesign. .............. 54
Table 7. Raw Data from the 30% CO2 Meter at 550K for Palladium Catalyst After Redesign.................. 55
Table 8. Raw Data from the 3% CO2 Meter at 550K for Palladium Catalyst After Redesign.................... 56
Table 9. Raw Data from the 30% Meter for Palladium Catalyst Variable Temperature. ........................... 57
Table 10. Raw Data from the 3% Meter for Palladium Catalyst Variable Temperature. ........................... 58
Table 11. Raw Data from the 30% Meter for Platinum Catalyst Variable Temperature. ........................... 59
Table 12. Raw Data from the 3% Meter for Platinum Catalyst Variable Temperature. ............................. 60
Table 13. Saturation Information for Water in Air. .................................................................................... 61
1
Chapter 1: Introduction
Chemical reactions are essential for the welfare of society. Reactions are found naturally
in processes such as photosynthesis, allow transportation through the combustion of fossil fuels,
and are carried-out every day in the practice of cooking. While most people observe chemical
reactions every day of their lives, many chemical engineers oversee the processing of chemicals
as a career. The principal function of a chemical engineer is to safely design and improve
industrial chemical manufacturing systems. These systems are designed to transform low value
raw materials into high value products for sale. This transformation is executed industrially
through the practice of controlling designed chemical reactions. It is important for chemical
engineers to understand the principles of reaction engineering such that the chemical products
that they make can be sold according to the specifications of the consumer.
Industrially, the use of catalysts for reaction has been of the utmost importance. A
catalyst is a substance that enables a chemical reaction to take place at a faster rate or under
different conditions than otherwise possible. The field of catalysis, although formally named in
1836, has existed for thousands of years. Fermentation of beer and wine was one of the first most
notable uses of a catalyst. Today, over 90% of all industrial chemicals are produced using a
catalyst at some point during their synthesis1. The market for industrial catalyst use is expected
to further expand with the continuous growth of the chemical industry. The catalyst sector of the
chemical industry is projected to be worth $17.2 billion in 20142. Catalysts are important because
their use allows for substantially more volume of chemicals to be produced compared to a non-
catalytic process. For example, nitric acid production in 1906 was increased from 300 kg/day to
3,000 kg/day by introducing corrugated platinum strips to the process1. It is very important for
chemical engineers to understand the principles of catalysis.
2
Worcester Polytechnic Institute introduces the study of kinetics in two undergraduate
classes; Kinetics and Reactor Design, and Unit Operations of Chemical Engineering II (ChE
3501 and 4402 respectively). The study of both kinetics and catalysts is part of the syllabus only
for ChE 4402. One experiment completed in this laboratory course, offered to senior-level
chemical engineering students, is designed for the analysis of complete methane oxidation via a
palladium catalyst in a differential packed bed reactor. The first of two experimentation periods
demands that the students operate the system at a constant reactor temperature with controlled
methane inlet composition changes. This experiment is carried out to calculate the reaction rate
and order of the reaction. The second period of experimentation demands that the students
operate the system at a constant methane inlet composition with controlled reactor operating
temperature changes. This experiment is carried out to calculate the activation energy required
for the reaction to proceed and to understand temperature effects on an exothermic reaction. The
combination of these two data sets provides students with the information they need to calculate
the necessary parameters of the reaction and to better understand catalytically driven reactions.
The catalytic reactor system has three major problems. The first problem with the
experiment is that the data collection time necessary for full results takes longer than the time
allotted for the laboratory period. This is due to the innate time for the reaction to reach steady
state and due to the fifteen minute data collection period of the gas chromatograph in the system.
Given a set of operating conditions, the gas chromatograph will record data and its analysis
would be repeated until it proves that the reaction has reached steady state. It is common for one
data point to consume over an hour to gather using the gas chromatograph. The second problem
with this experiment is that the system is very cumbersome. Primarily, the system has excessive
piping/tubing, which makes the system confusing to operate properly. Furthermore, the layout of
3
the system is not logical and does not follow a consistent flow direction. In addition, many of the
valves and thermocouples are broken. Although most of the broken valves are not in use, the
plausibility of leaks becomes likely due to equipment malfunction. Extraneous equipment such
as mixers and liquefiers further complicate the system.
This project was carried out to improve the general understanding of catalytic reaction
systems for future senior chemical engineering students taking unit operations II at Worcester
Polytechnic Institute. The goal of this project was to shorten the data collection period of the
catalytic reactor, while providing a more logical physical system with comparable intellectual
challenge to the old experiment. The goal of this project was achieved through the execution of
three main objectives. The first of these objectives was to collect data from the catalytic reactor
system using the gas chromatograph already present in the system. It was necessary to use this
data collection method so that there was information about the system before any alterations
were made. The second major objective was to install a reliable instrument that allows more
efficient data collection than the gas chromatograph. This objective prompted an alternative data
collection method, and to compare its experimental results to those found using the gas
chromatograph. The third objective was to redesign and reconstruct the reactor system and to
compare the experimental results to previously gathered results. This was done such that the
system would be simpler to use through the removal of any excessive piping, equipment, and
instrumentation.
4
Chapter 2: Literature Review
This chapter provides research regarding the general field of reactor engineering, kinetic
rate laws, methane concerns in the environment, the methane oxidation reaction, and the existing
unit operations experiment at Worcester Polytechnic Institute. These fields were deemed
relevant to the work done on the packed bed experiment in the unit operations lab.
Chapter 2.1: Reactor Engineering
One of the primary subsections of chemical engineering is reactor engineering. Chemical
engineering emphasizes the processing of raw materials through reactions to produce useful
substances or to deplete harmful substances from the environment. In order to conduct these
reactions, a reactor must be designed to withstand the nature of the reaction.
Chapter 2.1.1: Batch Reactor
Batch reactors, commonly utilized in chemical processing, operate under the guidelines
that there is no continuous feed flowing into the reactor. Batch reactors are generally described
as tanks with reactants sitting in solution. The solution can sit for hours at a time and reacts to
form the desired products. An assumption is made in most batch reactors that the reactor is well
stirred, meaning there is no concentration gradient.3 This model, however, is extremely
ineffective and there will inevitably be a concentration gradient of the reactant, which is not
desirable for a batch reactor.4
In order to counteract this slow residence time and design a batch reactor properly,
agitators are added into the reactor. Through the addition of agitators, such as impellers and
propellers, it is intended that the solution will mix and homogenize, thus lessening the
concentration gradient. Furthermore, baffles and walls can be added into the reactor to cause
5
changes in flow through the reactor, which will also disrupt the concentration gradient.5Adding
baffles and walls, however, also creates separate compartments for reaction in the batch reactor.
These separate compartments cause flow fields and cause the batch system to operate under non-
steady state conditions, which is normal for the batch reactor.6 This could hinder the overall
conversion of the reactor by disrupting consistent reacting with modified flow through the
mixing stages of the reactor.
The major cost of the batch reactor comes from labor. The amount of time it takes to set
up the reactants and then remove the products from the batch reactor can be expensive.
Furthermore, the down time of the batch reactor means additional costs.5 These disadvantages in
the batch reactor make it unfavorable for chemical processing.
Chapter 2.1.2: Continuous Stirred-Tank Reactors
Continuous stirred-tank reactors (CSTR) are another type of reactor that is commonly
used in the chemical industry. The CSTR can be used for fast and slow reactions. For slow
reactions, however, there must be multiple CSTRs placed in series so as to convert the proper
amount of reactants.7 This is a very efficient and effective method for conversion. The highest
conversions in CSTRs are observed in the liquid phase, where ample mixing can occur due to
installation of impellers and baffles.8
By installing baffles and impellers into the CSTR, the fluid flow is changed, creating a
more turbulent flow due to mixing while also increasing the reaction rate (much like in the batch
reactor). The baffles and impellers reduce the concentration gradient and move the reaction
toward completion.8 CSTRs are extremely efficient for reversible reactions due to the constant
ability to mix and generally low residence time. CSTRs have a constant flow through the
6
reactor, which means that the fluid may not settle and remain in the reactor. This slows the
reverse direction of a reversible reaction considerably since solely reactants enter the reactor.7
Furthermore, multiple CSTRs in series increase the volume for reaction is increased, but
also increase the probability of the reverse reaction.9 This could increase the cost of materials
within the reactor and therefore increase the overall cost of the reactor. For slow reactions, there
is no resolution for this cost, although the use of impellers and baffles could increase the reaction
rate and therefore progress the reaction faster.8
Chapter 2.1.3: Packed Bed Reactor
The last type of reactor that is commonly used for chemical processing is the packed bed
reactor (PBR). The packed bed reactor has multiple designs that make it an effective reactor to
use. Generally, a PBR has a catalyst that is immobilized in the usually tubular reactor bed. The
reactive species, however, is a mobile fluid. Therefore, this reactor is used for heterogeneous
reactions with a solid catalyst.10
A PBR can be a single bed reactor, a multiple bed reactor or a multi-tube reactor.11
The
single bed reactor is generally used for adiabatic processes since there is no separation of
reactants to lessen the effects of temperature variations.12
If the reaction is exothermic or
endothermic, the single bed adiabatic reactor has the potential to form a hot spot temperature.
These temperatures are exceptionally high and can decrease the reaction rate or deactivate the
catalyst due to thermal degradation or sintering. Also, the reactor could become unsafe to
operate.13
There are two types of hot spots that can cause the packed bed reactor to operate
ineffectively: the hot spot can act in a plug flow manner and migrate through the reactor, or the
reactor can have a temperature runaway which usually occurs in reactors with recycle streams.
7
With a staged reactor without recycle, hot spots are likely to occur. However, by adding a
recycle, the potential for temperature runaway is increased as the likelihood of a hot spot forming
is decreased. The balance between these two events is necessary for a successful and safe use of
the packed bed reactor.14
In the case of the hot spot formation, the hot spot is generally not mobile. This deviates
flow away from the reactants ideal plug flow movements because some fluid will travel faster
than other fluids due to the temperature, and therefore energy, increase. The temperature
runaway model does continue to flow, which could cause dangerous temperatures to be reached
throughout the entire reactor. This is not ideal either as it can disrupt conversion of reactant.14
The more efficient design for the PBR is the multi-tube reactor. This reactor has
hundreds of thousands of tubes with inner diameters ranging from 15 to 25 millimeters.15
The
reactor is run with multiple tubes and is generally run close to runaway temperature for
feasibility reasons.16
It is expected that these reactors will offer the maximum yield. However,
the time consumption in packing these reactors as well as different pressure drops resulting in
different residence times between tubes causes concerns for this type of reactor.15
The multi-
tube reactor is now the most common processing reactor for the PBR because its efficiency for
heterogeneous processes. Heterogeneous processes are governed by the heat transfer between
the fluid, catalyst and the heating and cooling media. This creates many advantages for the PBR
in process engineering.17
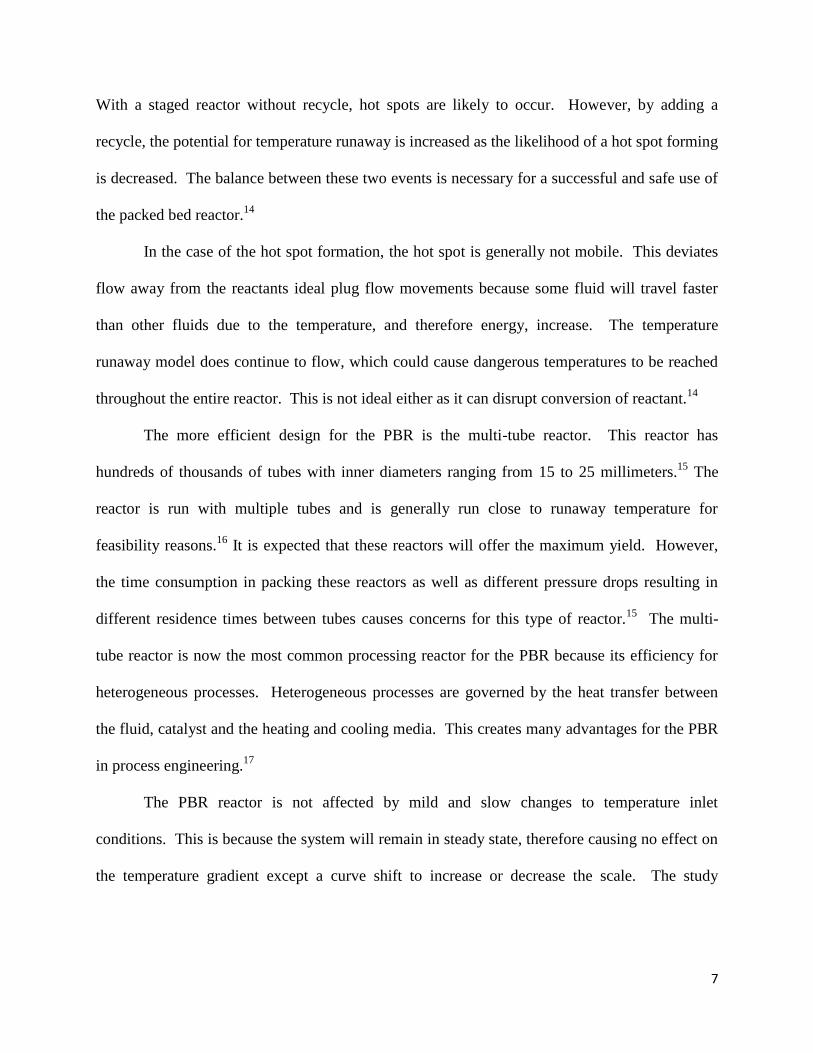
The PBR reactor is not affected by mild and slow changes to temperature inlet
conditions. This is because the system will remain in steady state, therefore causing no effect on
the temperature gradient except a curve shift to increase or decrease the scale. The study
8
conducted by Menzinger et. al. shows this gradual temperature increase graphically to prove it is
strictly a transformation along the graph with no slope variations. This graph is shown below in
Figure 118
.
Figure 1. Effects of a Gradual Temperature Increase in a PBR18
The PBR allows the observation of significant perturbations in temperature and other
areas of reaction if the system has an activator-inhibitor system operating at varying rates. The
activator-inhibitor system is a kinetic condition in which the reactor has positive feedback as
well as a self-accelerator. Exothermic reactions already have this system in place due to heat
release from the reaction. This heat release acts as the activator while the consumption of
reactant acts as the inhibitor. This system can balance out and cause perturbations to the reactor
such as a hot spot zone to disrupt the reactor.18
Another mode of perturbation occurs when the temperature of the inlet is drastically and
quickly increased or decreased. An increase in temperature will cause potentially dangerous
temperature conditions for the reactor due to a spike in the inlet conditions. If the temperature to
the reactor is cooled, however, a hot spot zone can also develop. This is due to the slowed
9
reaction rates generally associated with cooler temperatures. The high reactant composition
upstream will travel faster to the hot zone of the reactor where a quick reaction will occur.14
This quick reaction, if exothermic, will develop an immediate hot zone which is very unsafe for
operation and could render the catalyst useless for further reaction.
Chapter 2.1.4: Comparing the Batch, CSTR, and PBR
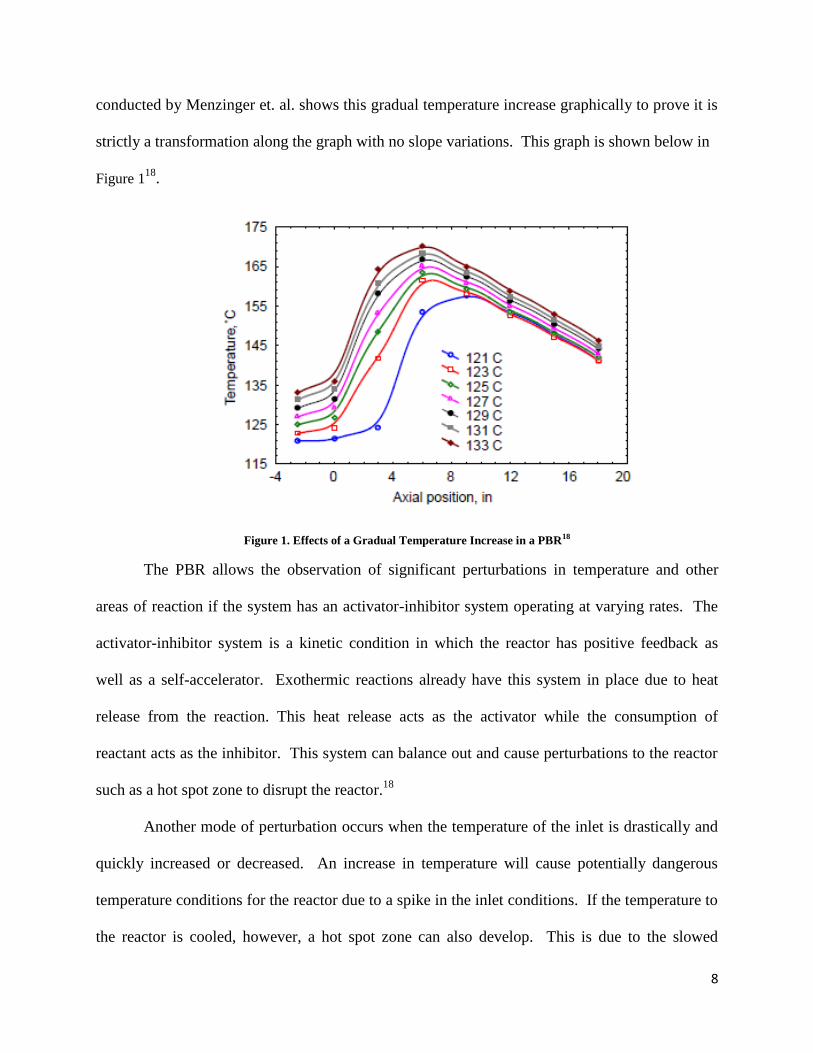
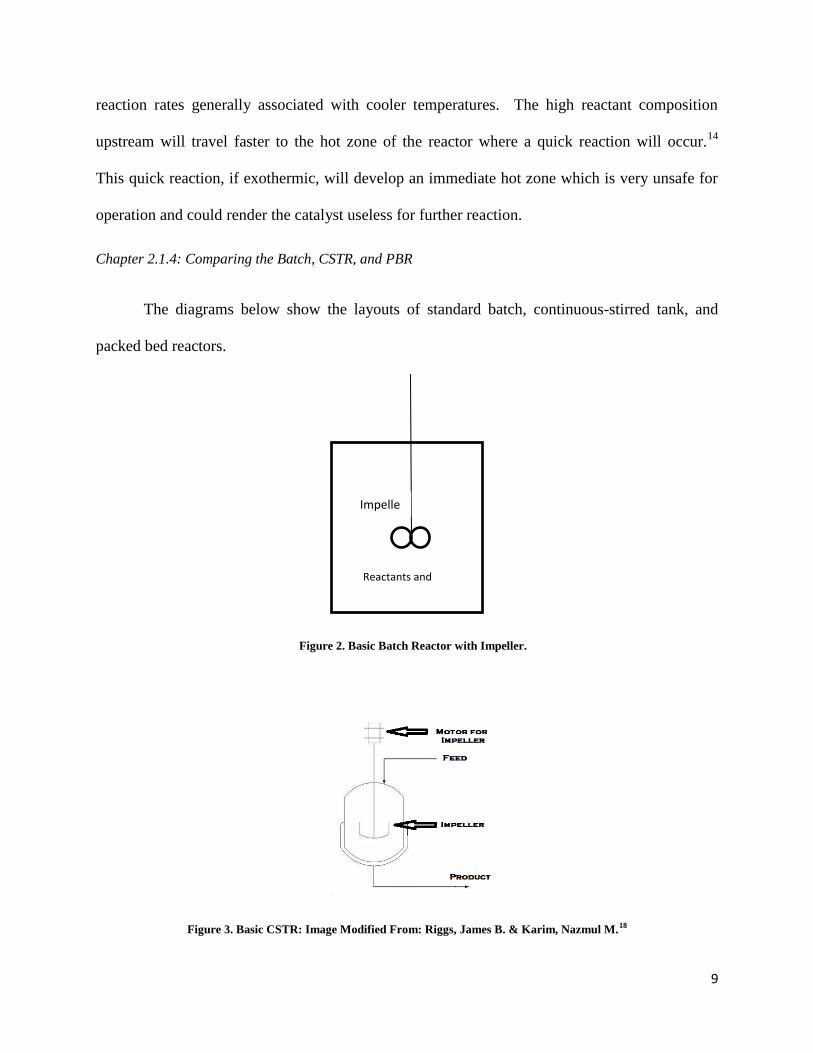
The diagrams below show the layouts of standard batch, continuous-stirred tank, and
packed bed reactors.
Figure 3. Basic CSTR: Image Modified From: Riggs, James B. & Karim, Nazmul M.18
Impelle
r
Reactants and
Products
Figure 2. Basic Batch Reactor with Impeller.
10
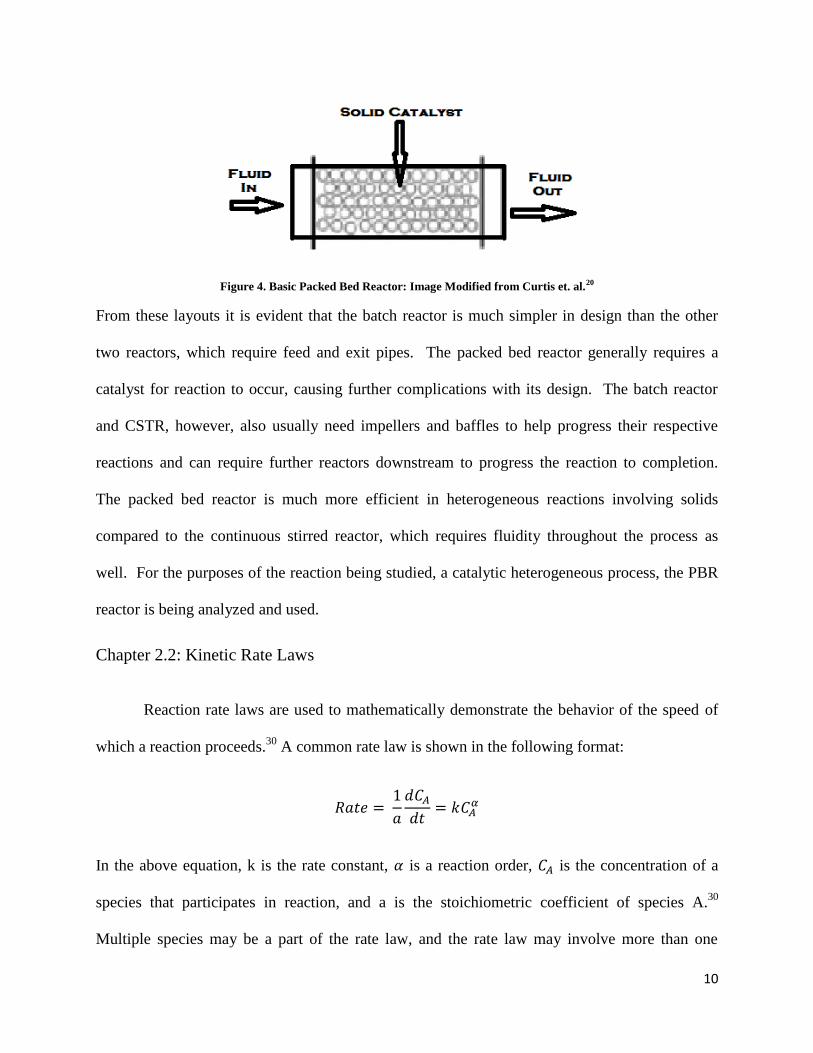
Figure 4. Basic Packed Bed Reactor: Image Modified from Curtis et. al.20
From these layouts it is evident that the batch reactor is much simpler in design than the other
two reactors, which require feed and exit pipes. The packed bed reactor generally requires a
catalyst for reaction to occur, causing further complications with its design. The batch reactor
and CSTR, however, also usually need impellers and baffles to help progress their respective
reactions and can require further reactors downstream to progress the reaction to completion.
The packed bed reactor is much more efficient in heterogeneous reactions involving solids
compared to the continuous stirred reactor, which requires fluidity throughout the process as
well. For the purposes of the reaction being studied, a catalytic heterogeneous process, the PBR
reactor is being analyzed and used.
Chapter 2.2: Kinetic Rate Laws
Reaction rate laws are used to mathematically demonstrate the behavior of the speed of
which a reaction proceeds.30
A common rate law is shown in the following format:
In the above equation, k is the rate constant, is a reaction order, is the concentration of a
species that participates in reaction, and a is the stoichiometric coefficient of species A.30
Multiple species may be a part of the rate law, and the rate law may involve more than one
11
concentration term. The order of the reaction is the sum of the exponents on all of the
concentration terms.30
The rate constant is independent of the reactant concentrations but is
dependent on temperature, as seen in the equation below:
In the above equation, is a pre-exponential factor, is the activation energy, is the gas
constant, and is the temperature.30
Chapter 2.2.1: Zero Order Rate Law
A reaction rate law is said to be zero order if the reaction rate is not proportional to the
concentration of the reactants, and is therefore equal to the rate constant:
The separation and integration of this ordinary differential equation yields the equation:
Therefore, a plot of product composition v. time will yield a linear curve, which is a method to
prove that an experimental reaction is of zero order kinetics,. This kind of reaction is only
dependent on the temperature of the reaction system. At a constant temperature, the rate will
proceed at a constant rate until the reactant has been depleted from the system.
Chapter 2.2.2: First Order Rate Law
A reaction rate law is said to be first order if the rate is linearly dependent on the
concentration of one reactant (and zero order in all others) in the following form:
12
The rearrangement and integration of this ordinary differential equation yields the following:
Therefore, a method to prove that an experimental reaction is of first order kinetics, a plot of
ln[CA] v. time will yield a linear curve. This kind of reaction is dependent both on temperature
and on reactant concentration. At a constant temperature, the rate will decrease with time as the
reactants are depleted from the system. A reaction with multiple reactants may be classified as
pseudo-first order if CB >> CA. The concentration change of species B compared to the
concentration change of species A will be negligible, therefore constant. This means that a rate
law that is a function of two species, one in large excess of the other may be rewritten as:
where:
Chapter 2.2.3: Second Order Rate Law
A reaction is said to be second order if the rate is proportional to the square of the
reactant concentration of one species:
The rearrangement and integration of this ordinary differential equation yields the following:
13
Therefore, a method to prove that an experimental reaction is of second order kinetics is to plot
1/CA v. time, which will yield a linear curve. This type of rate is dependent both on the
temperature and the concentration of the reacting species.30
Chapter 2.2.4: Non-Integer Rate Law
Non-integer rate laws are a result of very different chemical behavior than integer rate
laws. The integer rate laws typically follow an elementary reaction mechanism, or a mechanism
that involves only the step of the overall reaction. However, non-integer rate laws involve more
complicated mechanisms, which can be a result of hundreds of steps to achieve the overall
reaction. A method to determine the reaction order of a reaction is to plot reaction rate v. initial
reactant composition. The slope of this linear curve is the reaction order.
Chapter 2.2.5: Activation Energy
The activation energy is the energy barrier to overcome in order for a reactant to become
an activated complex, thus providing the potential to become a product.30
The activation energy
of many reactions are reduced when a catalyst is introduced into the system. This is desired
industrially because the reduced activation energy enables the reaction to commence faster. To
calculate the activation energy of a reaction system, the Arrhenius Equation may be used:
The activation energy may be calculated from a plot of v.
. The linear slope of this curve
multiplied by the gas constant is the activation energy of the system.30
14
Chapter 2.3: Methane Concerns in the Environment
Methane, among other hydrocarbons is released to the atmosphere both naturally and via
man-made engineered systems in massive quantities daily. Natural annual methane emissions
were estimated (in 2009) to be 208 Tg globally, whereas the emissions due to human-related
activities in the United States alone were estimated to be 686.3 Tg.21
Methane emissions are of
serious concern to the scientific community because of its implications in the greenhouse
effect.22
Therefore, methane emissions are actively reduced from industrial processes. A process
that is commonly used to reduce methane emissions is via catalytic oxidation in a packed-bed
reactor.
Chapter 2.3.1: The Catalytic Oxidation of Methane
Methane and oxygen will oxidize completely under certain conditions to form carbon
dioxide and water according to the following reaction:
CH4 + 2 O2 → CO2 + 2 H2O
The activation energy required to drive the reaction is 91.2 kJ/mol, as the reaction will not
proceed when the reactants are exposed to standard conditions.25
To create the necessary
conditions to promote reaction progress, it is necessary to induce high temperatures and expose
the reactants to a catalyst surface. Due to industrial demands and need for catalyst presence, this
reaction will typically be carried out in a packed bed reactor.
Chapter 2.3.2: Methane Behavior
Methane is found to be less reactive for oxidation on metallic surfaces than longer
organic chains.23
This phenomenon is a result of the carbon-hydrogen bond strength. Carbon-
carbon bonds have a bond energy of 384 kJ/mol, whereas carbon-hydrogen bonds have a bond
15
energy of 413 kJ/mol.24
Because methane has the highest C-H bonding percentage out of any
organic compound, higher oxidation rates would be observed for longer and more branched
hydrocarbons than methane. The difference in reaction rates for hydrocarbon oxidation suggests
that the carbon-hydrogen activation on the catalyst surface is the rate-determining step in this
process.23
According to a study of hydrocarbon oxidation rate using thirty different prepared
catalysts, palladium was found to be the most active catalyst for this reaction.25
More
specifically, palladium catalyst impregnated on alumina yielded a rate constant at least 27 and
nearly 20 times greater than the next most effective catalyst at 573K and 723K, respectively. On
the catalyst surface, studies have shown that the reaction involves lattice oxygen, which suggests
an oxidation-reduction mechanism, which will be discussed later in the chapter.
23
Chapter 2.3.3: Palladium Catalyst Behavior
There are two stable states of palladium catalyst. At temperatures less than 1055 K the
oxidized palladium phase (PdO) is stable, whereas the metallic palladium phase (Pd) is stable at
temperatures above this temperature.23
The catalyst may be impregnated on a variety of different
supports, which is a substance that is coated in catalyst. For the purposes of this research, the
PdO was assumed to be the stable phase due to the temperature constraints and α-alumina was its
support. This oxidation state of palladium catalyst allows for the complete oxidation of methane
to occur much faster than most other catalysts.
The oxidation of methane on a catalyst surface is a highly exothermic reaction. The
released heat may cause instabilities in the reaction rate and also conversion. These perturbations
may cause large variations in local catalyst temperature, which may lead to changes in the
temperature of the catalyst, and therefore a potential oxidation state change.26
16
The reactivity of the catalyst is affected by the products of the methane oxidation reaction
(H2O, CO, and CO2). Water is one of the products that is created and can be harmful, in which
case it is considered water poisoning. Although water poisoning is not fully understood, a
proposed poisoning effect may be the formation of palladium (II) hydroxide (PdOH) on the
catalyst surface. It was proposed that the breaking of the OH bond in the PdOH is the rate-
determining step in this process for temperatures less than 725K.23
The effects of water
poisoning were found to be fully recoverable for low-surface area α-alumina over a matter of
hours. The presence of water further influences the reaction by increasing the activation energy.
The “wet” activation energy, or the presence of water on the surface, was measured to be as
much as double that of the “dry”, therefore hindering the ability for the reaction to proceed with
ease.23
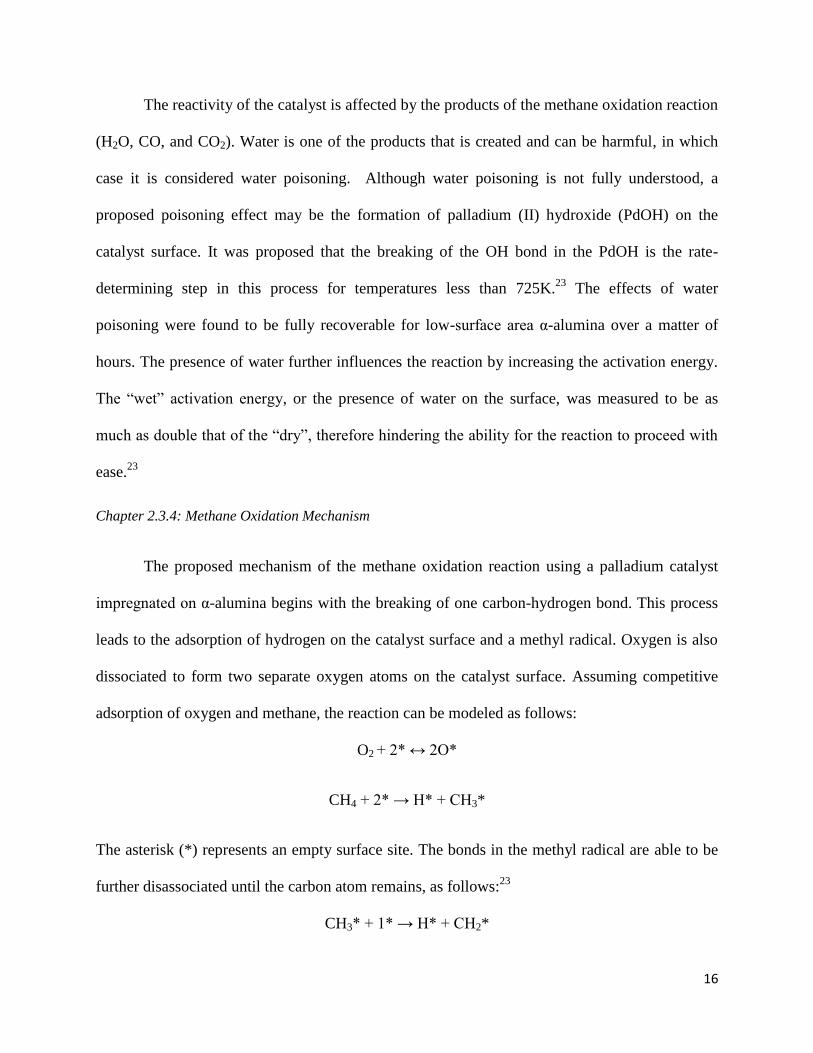
Chapter 2.3.4: Methane Oxidation Mechanism
The proposed mechanism of the methane oxidation reaction using a palladium catalyst
impregnated on α-alumina begins with the breaking of one carbon-hydrogen bond. This process
leads to the adsorption of hydrogen on the catalyst surface and a methyl radical. Oxygen is also
dissociated to form two separate oxygen atoms on the catalyst surface. Assuming competitive
adsorption of oxygen and methane, the reaction can be modeled as follows:
O2 + 2* ↔ 2O*
CH4 + 2* → H* + CH3*
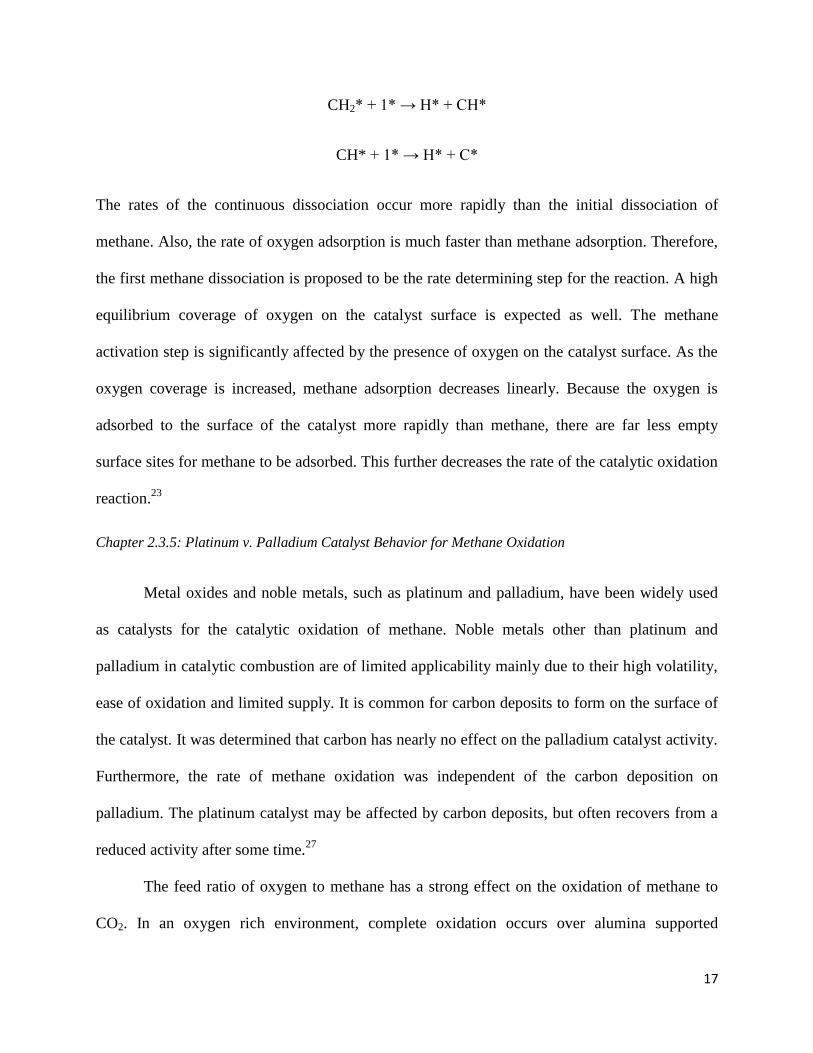
The asterisk (*) represents an empty surface site. The bonds in the methyl radical are able to be
further disassociated until the carbon atom remains, as follows:23
CH3* + 1* → H* + CH2*
17
CH2* + 1* → H* + CH*
CH* + 1* → H* + C*
The rates of the continuous dissociation occur more rapidly than the initial dissociation of
methane. Also, the rate of oxygen adsorption is much faster than methane adsorption. Therefore,
the first methane dissociation is proposed to be the rate determining step for the reaction. A high
equilibrium coverage of oxygen on the catalyst surface is expected as well. The methane
activation step is significantly affected by the presence of oxygen on the catalyst surface. As the
oxygen coverage is increased, methane adsorption decreases linearly. Because the oxygen is
adsorbed to the surface of the catalyst more rapidly than methane, there are far less empty
surface sites for methane to be adsorbed. This further decreases the rate of the catalytic oxidation
reaction.23
Chapter 2.3.5: Platinum v. Palladium Catalyst Behavior for Methane Oxidation
Metal oxides and noble metals, such as platinum and palladium, have been widely used
as catalysts for the catalytic oxidation of methane. Noble metals other than platinum and
palladium in catalytic combustion are of limited applicability mainly due to their high volatility,
ease of oxidation and limited supply. It is common for carbon deposits to form on the surface of
the catalyst. It was determined that carbon has nearly no effect on the palladium catalyst activity.
Furthermore, the rate of methane oxidation was independent of the carbon deposition on
palladium. The platinum catalyst may be affected by carbon deposits, but often recovers from a
reduced activity after some time.27
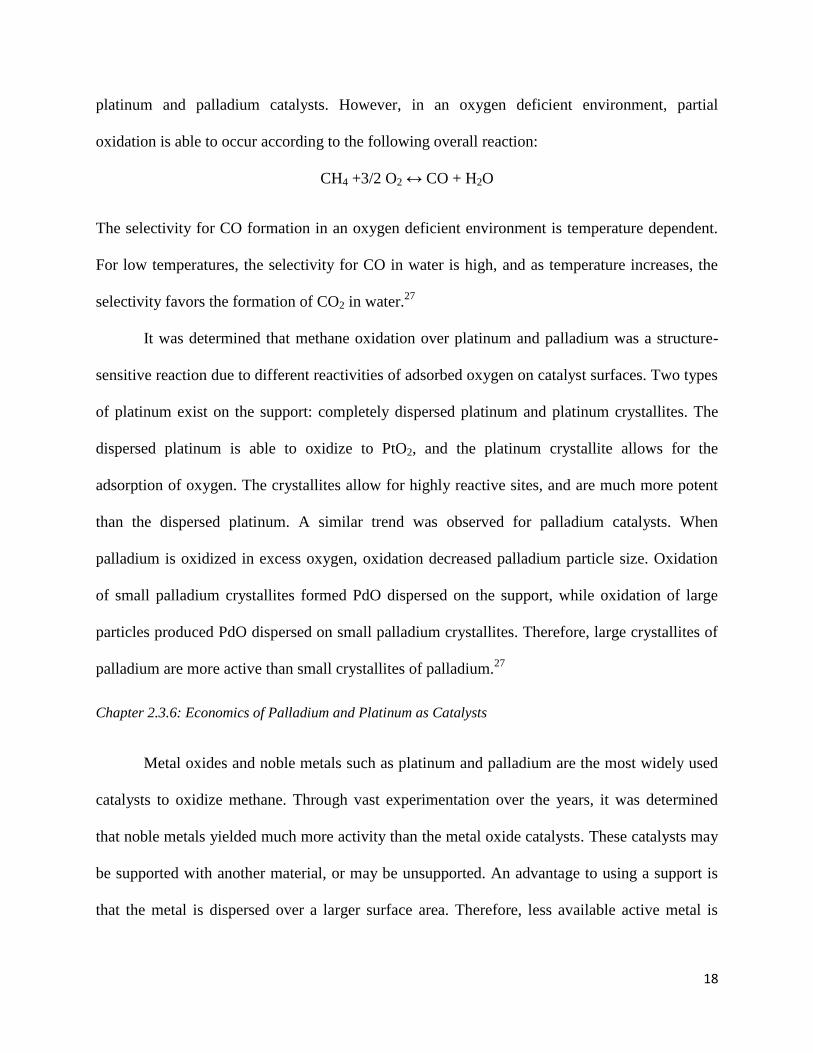
The feed ratio of oxygen to methane has a strong effect on the oxidation of methane to
CO2. In an oxygen rich environment, complete oxidation occurs over alumina supported
18
platinum and palladium catalysts. However, in an oxygen deficient environment, partial
oxidation is able to occur according to the following overall reaction:
CH4 +3/2 O2 ↔ CO + H2O
The selectivity for CO formation in an oxygen deficient environment is temperature dependent.
For low temperatures, the selectivity for CO in water is high, and as temperature increases, the
selectivity favors the formation of CO2 in water.27
It was determined that methane oxidation over platinum and palladium was a structure-
sensitive reaction due to different reactivities of adsorbed oxygen on catalyst surfaces. Two types
of platinum exist on the support: completely dispersed platinum and platinum crystallites. The
dispersed platinum is able to oxidize to PtO2, and the platinum crystallite allows for the
adsorption of oxygen. The crystallites allow for highly reactive sites, and are much more potent
than the dispersed platinum. A similar trend was observed for palladium catalysts. When
palladium is oxidized in excess oxygen, oxidation decreased palladium particle size. Oxidation
of small palladium crystallites formed PdO dispersed on the support, while oxidation of large
particles produced PdO dispersed on small palladium crystallites. Therefore, large crystallites of
palladium are more active than small crystallites of palladium.27
Chapter 2.3.6: Economics of Palladium and Platinum as Catalysts
Metal oxides and noble metals such as platinum and palladium are the most widely used
catalysts to oxidize methane. Through vast experimentation over the years, it was determined
that noble metals yielded much more activity than the metal oxide catalysts. These catalysts may
be supported with another material, or may be unsupported. An advantage to using a support is
that the metal is dispersed over a larger surface area. Therefore, less available active metal is
19
wasted on the sub-surface. Also, the use of a support reduces thermal degradation of the active
metals.27
An important factor to consider when selecting a catalyst is the effect of sintering that can
potentially occur. Sintering is a process in which particles combine to form one solid mass. This
unavoidable process is complicated and typically irreversible. Sintering occurs rapidly at
temperatures at or above 1073K.23
Sintering of the catalyst, its support, or both causes thermal
deactivation, and thus an uneconomical process. Deactivated catalysts need to be replaced in
order for the reaction to proceed as desired.23
Replacing the palladium catalysts is very expensive, as palladium is among the ten most
valuable metals in the world.8 In 2009, the cumulative average price of palladium was $8,483/kg.
In comparison, the average price of platinum (in 2009) was $38,290/kg. Because palladium is
much more active for the oxidation of methane and is much less expensive than platinum, it is
obvious that palladium is the more economic catalyst to use8. This reaction, including the
palladium catalyst is the basis of the existing experiment conducted in the unit operations
laboratory.
Chapter 2.4: Existing Unit Operations Experiment
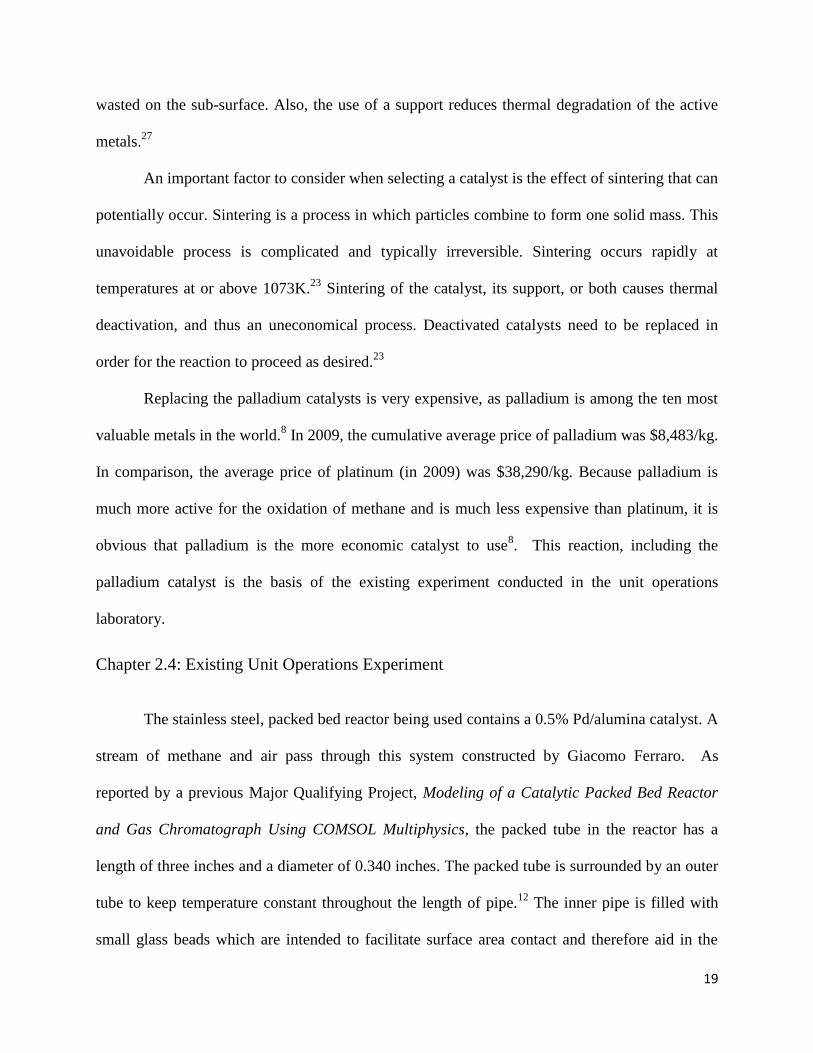
The stainless steel, packed bed reactor being used contains a 0.5% Pd/alumina catalyst. A
stream of methane and air pass through this system constructed by Giacomo Ferraro. As
reported by a previous Major Qualifying Project, Modeling of a Catalytic Packed Bed Reactor
and Gas Chromatograph Using COMSOL Multiphysics, the packed tube in the reactor has a
length of three inches and a diameter of 0.340 inches. The packed tube is surrounded by an outer
tube to keep temperature constant throughout the length of pipe.12
The inner pipe is filled with
small glass beads which are intended to facilitate surface area contact and therefore aid in the
20
reaction. As the methane and air are adsorbed and react on the catalyst in the reactor, carbon
dioxide and water are produced. This system also utilizes nitrogen, an inert gas which is meant
to clean the system in order to preserve the catalyst. A drawing of the system can be found in the
figure below.
Figure 5. Drawing of Packed Bed Reactor Internals
The packed catalytic reactor in the unit operations laboratory utilizes two main pipe
configurations: a bypass and a reaction configuration. By closing certain valves in the system,
the feed streams can flow directly to the gas chromatograph and bypass the reactors. This
arrangement facilitates the measurement of the reactant composition. The other valve
configuration causes the feed streams to pass through the reactor and undergo reaction before
entering the gas chromatograph.
21
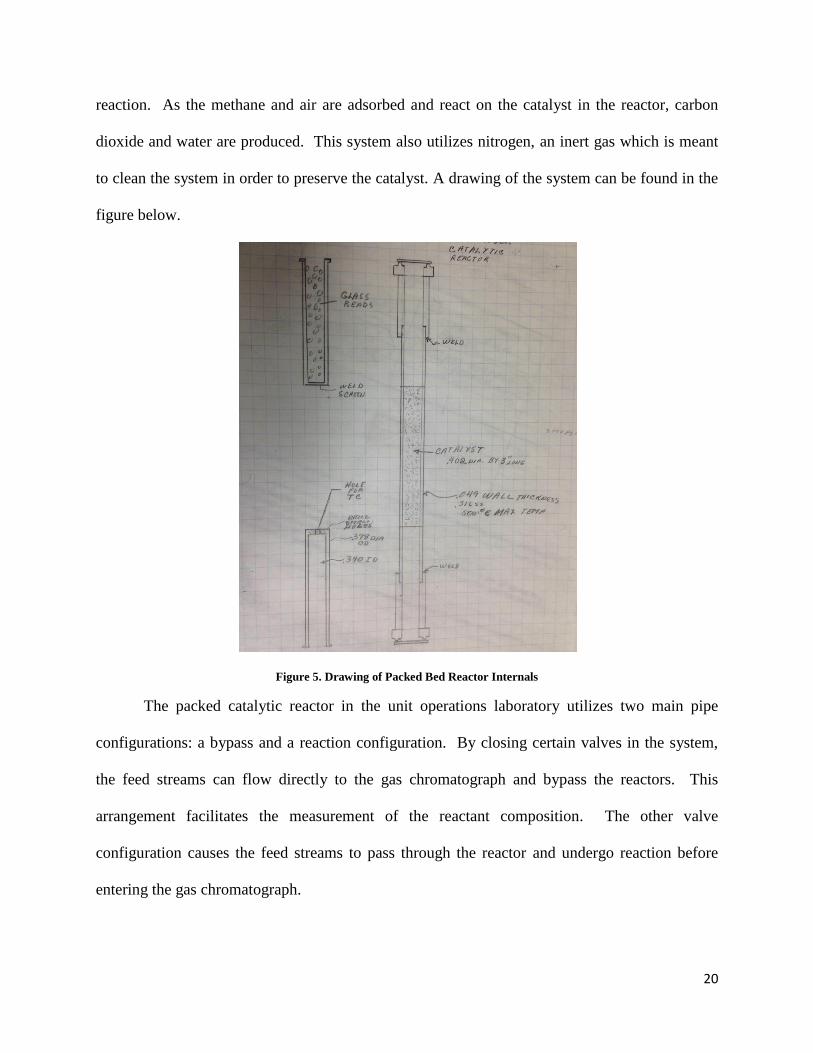
The primary objectives of the packed bed reactor experiment in the unit operations
laboratory are to investigate the kinetics of the oxidation of methane, calculate the reaction order
with respect to methane, and to determine the activation energy for methane oxidation. First, the
inert nitrogen must be run through the system at a high flow rate. This practice is done to
evacuate the system of unwanted gases that could potentially have remained in the system from
previous reactions. The nitrogen flow rate is then returned to zero, and air and methane are fed
into the system at constant flow rates. The basic layout of the apparatus relevant to this unit
operations experiment can be found in Figure 6 below.
Temperature can be controlled via heaters scattered around the piping in the apparatus.
Once the temperature inside the reactor has reached the desired value, the gas chromatograph is
used to perform an analysis of the stream compositions.
Chapter 2.4.1: Gas Chromatograph
After bypassing or exiting the reactor, the process stream is fed into the gas
chromatograph. This unit measures the composition of each component in the system. The gas
chromatograph utilizes the separation of gases in the stationary phase versus gases in the mobile
stage to differentiate and produce the components of gaseous mixtures.28
The gas that is fed into
the gas chromatograph is fed through an injector port with a carrier gas, generally an inert gas.
Figure 6. Block Diagram of the Relevant Components to the Catalytic Reactor Experiment.
22
There, the different components change phases, starting in the mobile phase (a liquid coated on a
solid within the column) and shifting toward the stationary phase (inert phase). The different
components change phases at different times which aids in separation of the mixture.28
They are
then drawn at separate times to the meter which measures peaks to be analyzed. The areas
under the peaks are proportional to the concentration of each respective component in the
analyzed stream. The use of gas chromatography results in a specific retention time for each
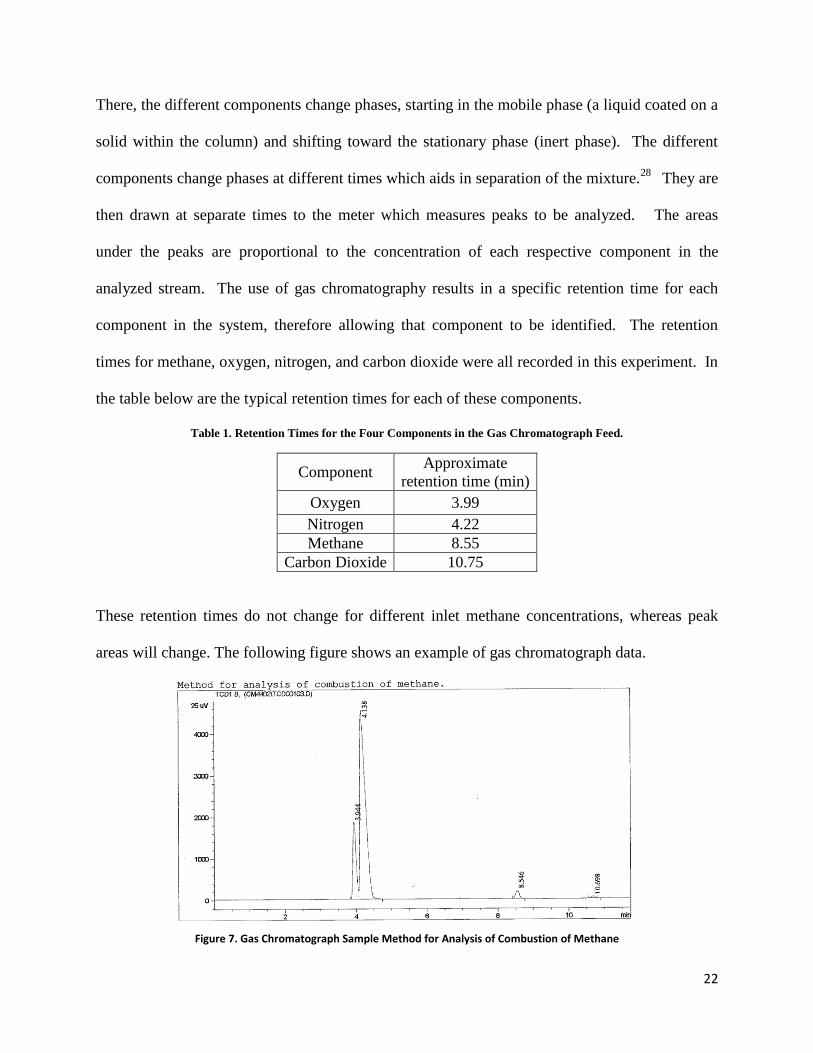
component in the system, therefore allowing that component to be identified. The retention
times for methane, oxygen, nitrogen, and carbon dioxide were all recorded in this experiment. In
the table below are the typical retention times for each of these components.
Table 1. Retention Times for the Four Components in the Gas Chromatograph Feed.
Component Approximate
retention time (min)
Oxygen 3.99
Nitrogen 4.22
Methane 8.55
Carbon Dioxide 10.75
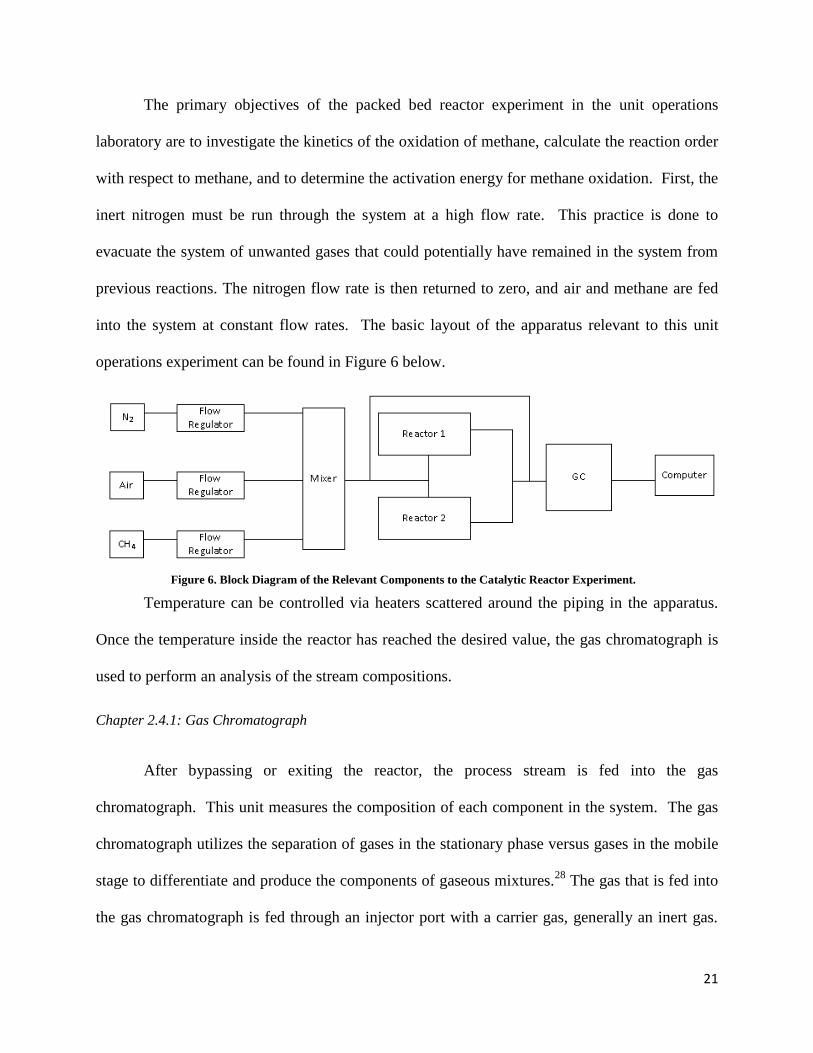
These retention times do not change for different inlet methane concentrations, whereas peak
areas will change. The following figure shows an example of gas chromatograph data.
Figure 7. Gas Chromatograph Sample Method for Analysis of Combustion of Methane
23
Peak areas are proportional to material concentrations in the analyzed stream. From the
compositions of each component after the reaction, along with the same data for an experiment
configured to bypass the reactor, the reaction kinetics can be investigated. Since the output data
for the bypass stream represents what would be considered the reactants in the chemical reaction,
the initial and final compositions are therefore provided. From these values, the rate of the
reaction can be calculated.
Chapter 2.4.2: Issues in the Experiment
The catalytic reactor system in the Goddard Laboratory has two separate reactors
attached together through various possible piping configurations. However, only one of these
reactors was of use for the existing catalytic oxidation of methane experiment. The idle reactor,
along with other piping components, was designed to function in a separate experiment that
could be performed involving ethanol production. Because this reactor is no longer relevant,
many extraneous components to the reactor exist that can be removed to simplify the experiment.
Furthermore, the gas chromatograph, used to measure the reaction rate and conversion for
the methane oxidation experiment, is not efficient. The gas chromatograph took about fifteen
minutes to read the data and produce one data point for the experiment. In order to obtain
sufficient data for the unit operations lab, a team would have to work for more hours than
allotted for experimentation. Additionally, the gas chromatograph was attached to a computer
running old software. The software was not user friendly and was unreliable. In order to mitigate
these existing issues, this project investigated the use of alternative data collection.
24
Chapter 2.4.3: CO2 Meter
A plausible replacement for the gas chromatograph in the reactor system for the
experiment is a carbon dioxide meter. The meters detect concentrations of carbon dioxide in the
flow stream and display it in graphical format. The meters record instantaneously compared to
the gas chromatograph, taking data points every two to fifteen seconds. The meters operate by
simply connecting the outlet piping from the reactor to a port into two CO2 meters arranged in
series.29
The CO2 meters operate using nondispersive infrared (NDIR) technology, the most
common type of sensor used to measure CO2. An infrared lamp directs light through an air-filled
tube towards an infrared light detector. Any gas molecules that are the same size as the
wavelength of the infrared light absorb the infrared light only, while allowing other wavelengths
to pass through. The remaining light hits an optical fiber that absorbs all wavelengths of light,
except that absorbed by CO2. An infrared detector finally reads the amount of light that was not
absorbed by CO2 molecules or optical fiber. The difference between the amount of infrared light
radiated and detected is measured, and is proportional to the number of CO2 molecules in the
tube.29
The reassembly of the system and the addition of the CO2 meters is the premise of this
report.
25
Chapter 3: Methodology
This project was conducted to better improve the general understanding of catalytic
reaction systems for future senior chemical engineering students taking unit operations II at
Worcester Polytechnic Institute. The old physical system for this experiment was cumbersome
and confusing to operate and contained extraneous equipment and broken instrumentation.
Furthermore, the data collection period necessary to complete this experiment was far too long.
The goal of this project was to shorten the data collection period of the catalytic reactor, while
providing a more logical physical system with comparable intellectual challenge to the old
experiment. This purpose was established to both make the system more user-friendly and to
shorten the excessive experimentation period.
The goal of this project was achieved through the execution of three main objectives.
The first of these objectives was to collect extensive data from the catalytic reactor system using
the gas chromatograph already present in the system. It was necessary to use the old method so
that there was information about the system operation before any alterations were made. The
second major objective was to install a reliable instrument that allows more efficient data
collection than the gas chromatograph. This objective prompted the group to seek an alternative
data collection method, and to compare its experimental results to those found using the gas
chromatograph. The third objective was to redesign and reconstruct the reactor system, and to
compare the experimental results to previously gathered results. This was done such that the
system would be simpler to use through the removal of any excessive piping, equipment, and
instrumentation.
26
Chapter 3.1: Operation of the Reactor System
As mentioned above, the first goal of this project was to operate the reactor itself and
record the relevant data. The same data that was typically sought in the unit operation course
were gathered using a gas chromatograph (the methodology for operation is outlined below).
Two configurations for system operation were used: bypass and reaction. Bypass
involved a configuration of valves that allowed the inlet gas stream to flow into the gas
chromatograph without passing through the reactor. Reaction, conversely, involved the
configuration of valves that forced the inlet stream through the catalyst bed of the reactor.
Therefore, the reactor effluent would flow into the gas chromatograph. Utilizing both of these
valve configurations at specified times allowed for the measurement of the initial and final
conditions of the catalytic methane oxidation reaction. The following procedures were repeated
for both methods of operation to ensure consistency.
1. The flow-control meter channel 1 (nitrogen) was set to 30.
2. The main valve and shutoff valves for the two gas cylinders located behind the gas
chromatograph were opened.
3. The pressures for both the methane and the air were set to 40 psi.
4. The main power switch to the computer was turned on.
5. The program used to record measurements from the gas chromatograph was started by
clicking the icon “Instrument 1 Online.”
6. Once started, the “CM4402” Method was selected and loaded. After this loaded, the gas
chromatograph required 15 minutes to stabilize.
7. The valves were switched to the bypass configuration, and flow meter channel 1 was set
to 30 to both clean and neutralize the reactor.
27
8. Air was allowed into the system by opening flow-control meter channel 2, and
maintaining flow specified at 75.0. Nitrogen flow was turned to zero simultaneously.
9. Methane was allowed into the system by opening flow-control channel 4. Each trial of
this experiment was conducted using at least a 20:1 ratio of oxygen to methane to ensure
pseudo-zero reaction kinetics with respect to oxygen.
10. The start button on the computer was pressed. Thus, the gas chromatograph analyzed the
stream and displayed the graphical result on the computer screen after a 15 minute
retention period. This step was repeated until the result from the gas chromatograph
reached steady state.
11. Retention times and peak areas taken from the gas chromatograph were analyzed
graphically to study the reactor effluent concentration and thus the kinetics of the reaction
system.
12. Steps 10 and 11 were repeated at various different inlet methane compositions at a
constant temperature.
13. Steps 10 and 11 were repeated with a constant methane feed composition at various set
reactor temperatures.
The methane settings on the flow controller were chosen to be 6, 8, 10, 13, and 18, which were
calculated to be 1.39%, 1.84%, 2.29%, 2.96%, and 4.05% respectively. All of these methane
inlet compositions were tested at a constant reactor operation temperature, 277K. The methane
flow setting of 6 (or 1.39%) was tested at temperatures which ranged from 227K to 327K.
28
Chapter 3.2: Alternative Data Collection Method
The second major objective in this project was to install an alternative data collection
method to replace the gas chromatograph. Research was conducted to provide insight into what
types of instruments were available, and it was determined that a carbon dioxide meter would be
used for the purposes of this project. It was determined that two carbon dioxide meters would be
installed, one with a 30% CO2 range at a 15 second data collection interval, and the other with a
3% CO2 range at a 2 second data collection interval. The meters were added to the system in
series, allowing them to be run simultaneously and compared to ensure consistent measurements.
The initial plan of action was to design and install a cooling unit so that the temperature
of the stream entering the carbon dioxide meter would be appropriate in regards to the limitations
of the sensors. It was specified by the manufacturer that the inlet stream to the CO2 meter should
not exceed 60⁰C to ensure proper data collection.29
This was a concern due to the relatively high
operating temperature and exothermic nature of the reaction itself. Despite this possibility, the
reactor effluent streams naturally cooled well below the 60⁰C threshold without any cooling
design. Therefore, the sensors were directly attached to the existing system.
The procedure for carbon dioxide concentration measurement in the reactor effluent was
similar to that of the gas chromatograph. This included the bypass and reactor valve
configurations as well, allowing the difference between the inlet and reactor effluent
compositions to be determined. The procedure for operating the system is listed below:
1. The carbon dioxide meter was plugged into the computer via USB, and the program
“DAS” was started.
2. The appropriate device, which appeared on the right of the window for the program DAS,
was selected.
29
3. Measurements for temperature, carbon dioxide levels, and relative humidity were
selected. The program recorded these values every 2 to 15 seconds and displayed a graph
of the aforementioned measurements v. time. Data may be collected at any inlet gas flow
rate using this method.
4. The valves were switched to the bypass configuration, and flow meter channel 1 was set
to 30 to both clean and neutralize the reactor.
5. The main valve and shutoff valves for the two gas cylinders located behind the gas
chromatograph were opened.
6. The pressures for both the methane and air were set to 40 psi.
7. The flow rate for nitrogen (flow meter channel 1) was set back to 0.
8. Air was allowed into the system by opening flow meter channel 2, which was set to a
specified rate.
9. Methane was allowed into the system by opening flow channel 4. Each trial of this
experiment was conducted using a 20:1 ratio of oxygen to methane to ensure pseudo-zero
reaction kinetics with respect to oxygen.
10. The valve configuration was switched from bypass to reaction, and the system was
allowed to reach steady state.
11. When steady state was reached, the valves were switched from the reaction to bypass
configuration.
12. The concentration of methane in the inlet stream was adjusted, and steps 10 and 11 were
completed five times.
13. The reactor operating temperature was increased by a specified amount, and once thermal
steady state was reached, the valve configuration was switched from bypass to reaction.
30
14. Once chemical steady state was reached, the valves were switched from reaction to
bypass.
15. Steps 13 and 14 were repeated four times.
The methane settings on the flow controller were chosen to be 6, 8, 10, 13, and 18, which
were calculated to be 1.39%, 1.84%, 2.29%, 2.96%, and 4.05% respectively. All of these
methane inlet compositions were tested at a constant reactor operation temperature, 277K. The
methane flow setting of 6 (or 1.39%) was tested at temperatures which ranged from 227K to
327K.
Chapter 3.3: Redesign of the Reactor System
The third and final major objective of this project was to analyze and reconstruct the
entire apparatus, including all existing components used in the current system. Because this unit
is used annually as a part of the unit operations II course, it was impossible to begin the
disassembly until the students enrolled in this course were finished with experimentation. This
did, however, provide ample time to research the methane oxidation reaction and an additional
catalyst for use in the reactor. As an additional, unused reactor was connected via piping in the
system existed, it was planned that the idle reactor would contain the alternative catalyst.
The first step towards the completion of this objective involved data collection through
the operation of the system itself. During each trial completed in the kinetics analysis of the
system, the efficacy of each unit in the system was investigated. Once it was determined which
units were pertinent to the process, a plan was developed to remove extraneous components
while piping together the useful ones in an efficient manner.
The piping system was dismantled, but each of the parts that could be reused were set
aside and prepared for reinstallation. This included, but was not limited to, each reactor, carbon
31
dioxide meters, piping, and all valves. Once dismantled, the catalysts in both reactors were
replaced. As previously mentioned, it had been decided to implement an alternative catalyst
into the first reactor and arrange the two in parallel. This would allow for the comparison of the
kinetics of each catalyst and would provide further understanding of the methane oxidation
reaction itself.
Using the plan for the piping, the system was rebuilt. Reactors were connected to the gas
cylinders and to the carbon dioxide meters. The reactors were piped together in parallel,
separated by block valves so that either one could be isolated during experimentation. The pipes
and valves were installed such that the reactor was able to be bypassed during experimentation.
Once the construction of this design had been completed, experimental trials identical to those
conducted on the original system were carried out. These experiments were run to test for
consistency with the original measurements and observations taken from the gas chromatograph.
Unfortunately, the gas chromatograph stopped functioning during the B term lab and was no
longer available for further studies. Therefore, the CO2 meter results obtained after rebuilding the
experiment could not be compared to chromatographic results.
32
Chapter 4: Results
After all experimentation was conducted, the rate of reaction, reaction order, and
activation energy were calculated and tabulated. These numbers were chosen to examine the
carbon dioxide meter readings in comparison to the gas chromatograph readings. The unit
operations II experimental procedure calls for the calculation of all these values. Therefore, to
validate its integrity for the remodel of the experiment, all calculations were compared to
determine the variation in concentration and temperature. A new feature of the experiment was
added as well, involving a comparison between palladium and platinum as the catalyst of choice
for the methane oxidation reaction. Furthermore, the redesign process was completed to help
simplify the process.
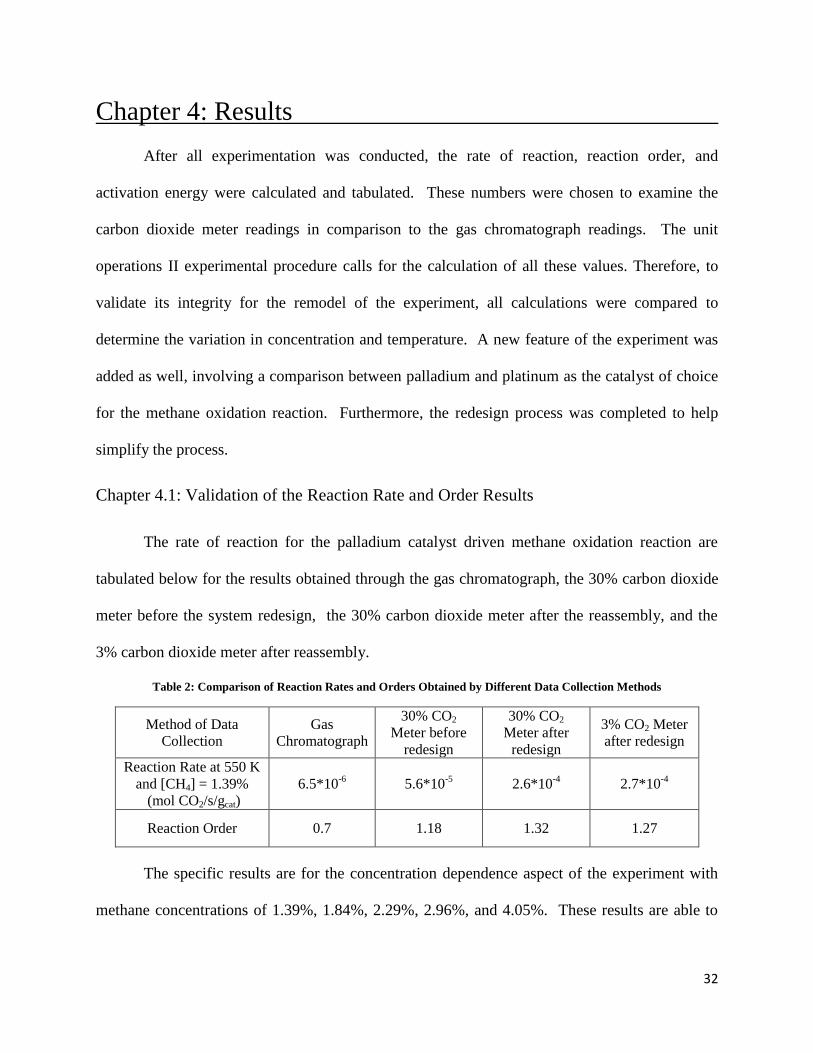
Chapter 4.1: Validation of the Reaction Rate and Order Results
The rate of reaction for the palladium catalyst driven methane oxidation reaction are
tabulated below for the results obtained through the gas chromatograph, the 30% carbon dioxide
meter before the system redesign, the 30% carbon dioxide meter after the reassembly, and the
3% carbon dioxide meter after reassembly.
Table 2: Comparison of Reaction Rates and Orders Obtained by Different Data Collection Methods
Method of Data
Collection
Gas
Chromatograph
30% CO2
Meter before
redesign
30% CO2
Meter after
redesign
3% CO2 Meter
after redesign
Reaction Rate at 550 K
and [CH4] = 1.39%
(mol CO2/s/gcat)
6.5*10-6
5.6*10-5
2.6*10-4
2.7*10-4
Reaction Order 0.7 1.18 1.32 1.27
The specific results are for the concentration dependence aspect of the experiment with
methane concentrations of 1.39%, 1.84%, 2.29%, 2.96%, and 4.05%. These results are able to
33
verify the efficacy of the carbon dioxide meter in obtaining similar results to the gas
chromatograph.
The rates of reaction for the four methods of data collection do not completely agree. The
after redesign rates do not agree with the before redesign rate, which does not verify the accuracy
of the carbon dioxide meter in obtaining similar results to each other before and after reassembly.
The reaction orders also do not agree between the gas chromatograph and the CO2 meters.
However, the reaction orders obtained from the CO2 meters both before and after redesign are in
agreement. The reaction rate and order could be affected by the redesign of the system.
Furthermore, the difference may be due to the adjustment from the gas chromatograph to the
carbon dioxide meter.
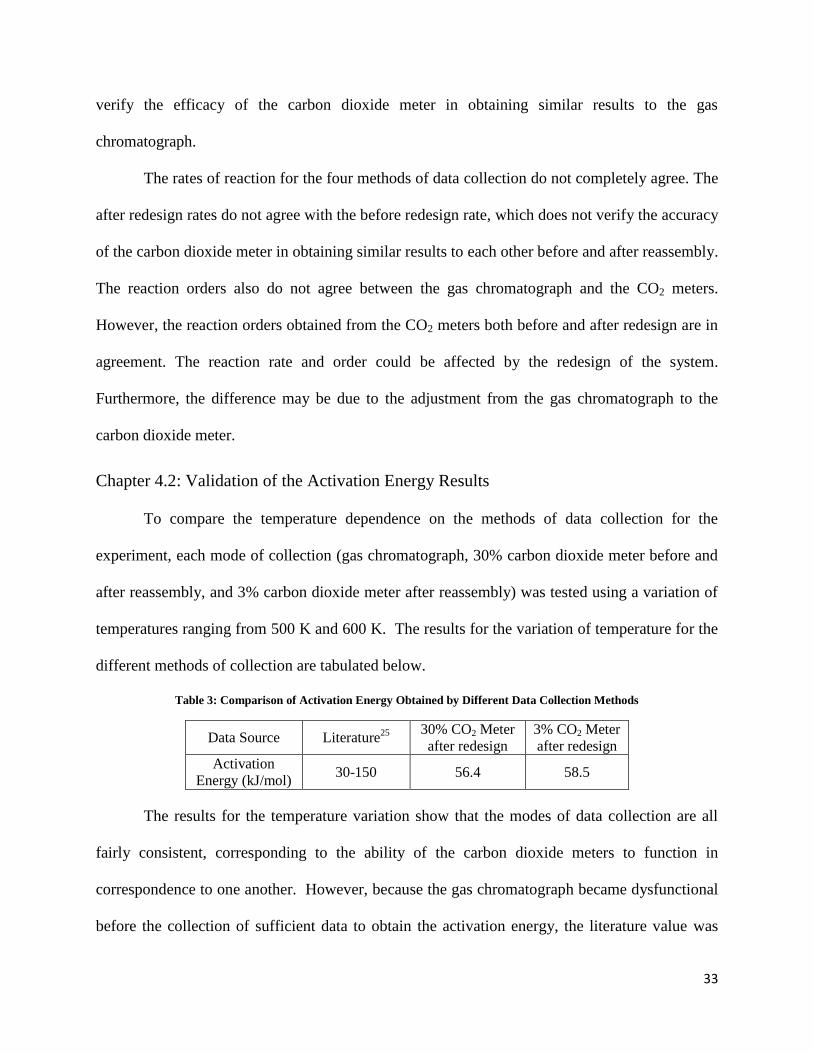
Chapter 4.2: Validation of the Activation Energy Results
To compare the temperature dependence on the methods of data collection for the
experiment, each mode of collection (gas chromatograph, 30% carbon dioxide meter before and
after reassembly, and 3% carbon dioxide meter after reassembly) was tested using a variation of
temperatures ranging from 500 K and 600 K. The results for the variation of temperature for the
different methods of collection are tabulated below.
Table 3: Comparison of Activation Energy Obtained by Different Data Collection Methods
Data Source Literature25 30% CO2 Meter
after redesign
3% CO2 Meter
after redesign
Activation
Energy (kJ/mol) 30-150 56.4 58.5
The results for the temperature variation show that the modes of data collection are all
fairly consistent, corresponding to the ability of the carbon dioxide meters to function in
correspondence to one another. However, because the gas chromatograph became dysfunctional
before the collection of sufficient data to obtain the activation energy, the literature value was
34
chosen as the expected activation energy. Activation energies calculated using the carbon
dioxide meters were within range of the literature value. The literature value was given as a
range because the activation energy can depend upon catalyst pretreatment and packing.
Furthermore, the temperature did not affect the ability of the carbon dioxide meter to read data,
which was a primary concern prior to experimentation.
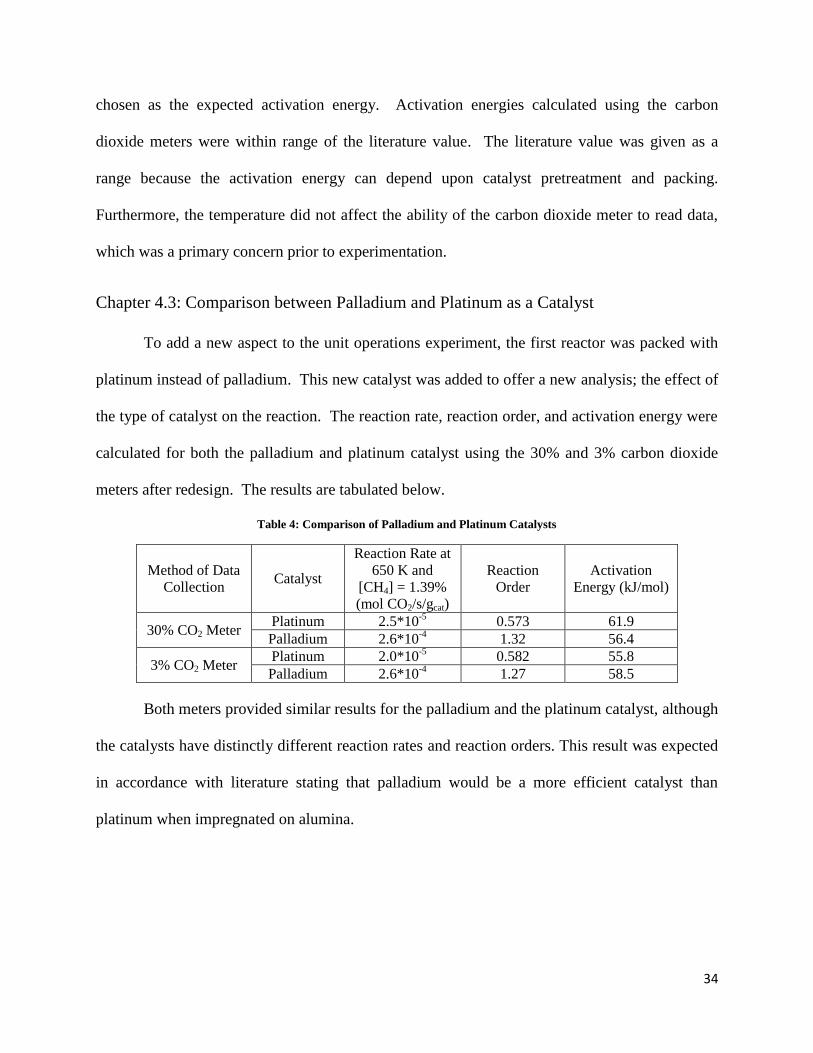
Chapter 4.3: Comparison between Palladium and Platinum as a Catalyst
To add a new aspect to the unit operations experiment, the first reactor was packed with
platinum instead of palladium. This new catalyst was added to offer a new analysis; the effect of
the type of catalyst on the reaction. The reaction rate, reaction order, and activation energy were
calculated for both the palladium and platinum catalyst using the 30% and 3% carbon dioxide
meters after redesign. The results are tabulated below.
Table 4: Comparison of Palladium and Platinum Catalysts
Method of Data
Collection Catalyst
Reaction Rate at
650 K and
[CH4] = 1.39%
(mol CO2/s/gcat)
Reaction
Order
Activation
Energy (kJ/mol)
30% CO2 Meter Platinum 2.5*10
-5 0.573 61.9
Palladium 2.6*10-4
1.32 56.4
3% CO2 Meter Platinum 2.0*10
-5 0.582 55.8
Palladium 2.6*10-4
1.27 58.5
Both meters provided similar results for the palladium and the platinum catalyst, although
the catalysts have distinctly different reaction rates and reaction orders. This result was expected
in accordance with literature stating that palladium would be a more efficient catalyst than
platinum when impregnated on alumina.
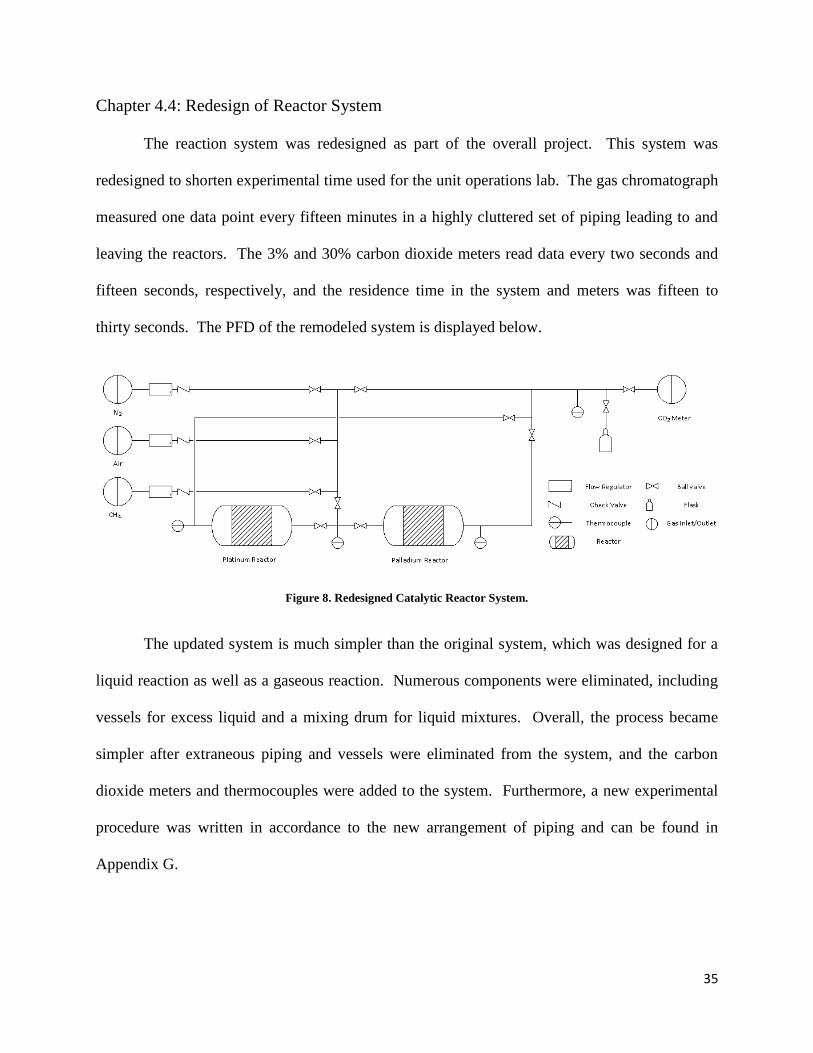
35
Chapter 4.4: Redesign of Reactor System
The reaction system was redesigned as part of the overall project. This system was
redesigned to shorten experimental time used for the unit operations lab. The gas chromatograph
measured one data point every fifteen minutes in a highly cluttered set of piping leading to and
leaving the reactors. The 3% and 30% carbon dioxide meters read data every two seconds and
fifteen seconds, respectively, and the residence time in the system and meters was fifteen to
thirty seconds. The PFD of the remodeled system is displayed below.
Figure 8. Redesigned Catalytic Reactor System.
The updated system is much simpler than the original system, which was designed for a
liquid reaction as well as a gaseous reaction. Numerous components were eliminated, including
vessels for excess liquid and a mixing drum for liquid mixtures. Overall, the process became
simpler after extraneous piping and vessels were eliminated from the system, and the carbon
dioxide meters and thermocouples were added to the system. Furthermore, a new experimental
procedure was written in accordance to the new arrangement of piping and can be found in
Appendix G.
36
Chapter 5: Discussion
The results from the renovated reactors in the Goddard Laboratory at Worcester
Polytechnic Institute were successful. The change from the gas chromatograph to the CO2
meters had been an effective transition and resulted in reaction orders around the 1.0 literature
benchmark, despite the reaction rate disagreement. Furthermore, the activation energies were
also consistent. There are multiple possible explanations for the minor discrepancies between
the gas chromatograph data and the carbon dioxide meter data with respect to the reaction rates
and orders.
Chapter 5.1: The Kinetics of the Reaction
The kinetics that resulted from the reaction for the CO2 meters compared to the gas
chromatograph were different. The gas chromatograph yielded reaction orders of about 0.7
while the CO2 meters measured reaction order readings of roughly 1.3. Both of these reaction
orders were within range of the literature value of roughly 1.0.
The activation energies for the palladium catalyst reactions agreed with the literature data
as well. The activation energy was measured to be 58 kJ/mol compared to the literature range of
30-150 kJ/mol. The literature had such a large range because activation energy depends upon
catalyst pretreatment and method of reaction. The kinetics for the reaction were within range of
the literature data, therefore validating the carbon dioxide meters as effective substitutions for the
gas chromatograph.
Chapter 5.2: Gas Chromatograph v. CO2 Meter Efficiency
During the redesign, the main reason for the implementation of the CO2 meters was to
replace the gas chromatograph because of its sluggish data collection. The gas chromatograph
37
would record a single data point every fifteen minutes, meanwhile the CO2 meters read data
every two or fifteen seconds for the 3% and 30% CO2 meters respectively. This extreme change
in rate helped make the experiment much quicker for the students of the unit operations course to
complete.
However, the data collected and analyzed for the gas chromatograph and the CO2 meters
was significantly different. The reaction order for the gas chromatograph was about 0.7 with a
reaction rate of roughly 6.5x10⁻⁶
mol CO2/s*gcat. Meanwhile, the CO2 meters recorded
reproducible data with a reaction order at roughly 1.3 and a reaction rate of 5.9 x10⁻⁴
mol
CO2/s*gcat for both the 30% and 3% meters. These results did not agree with one another.
However, the previous reports on this subject matter which used the gas chromatograph for
analysis have given reaction orders of around 0.7. Furthermore, old reports that contained data
collected from the gas chromatograph have suggested that it was an inaccurate way to measure
the reaction order as the order ranged from 0.4 to upwards of 2.0. The CO2 meters have created
reproducible results across meters and trials, helping suggest their accuracy with one another and
that they are better for the reaction in general. There are various reasons why the new redesign
did not produce the same results as the gas chromatograph, including the repacking of the
reactors, possible flaws in the CO2 meters, and the changed design of the system in general.
These reasons are discussed below.
Chapter 5.2.1: The Re-packed Reactors
The reaction rates and orders were very different between the gas chromatograph and the
CO2 meters from before and after redesign. The 0.7 reaction order seen in the gas chromatograph
is substantially lower than the 1.27 and 1.32 seen in the CO2 meters. This significant change
could be because the catalyst was re-packed into the reactor, thus eliminating excess carbon
38
deposits and rust that had built up on old catalyst. The accumulations in the old reactor could
have decreased the reaction order significantly. If the rust and carbon deposits coated the
catalyst, there would be less active sites on which the reaction may occur, thus creating a
decrease in reaction rate. This decrease in reaction rate may cause a similar decrease in reaction
order. Therefore, upon re-packing the reactor, which had not been done in several years, the
reaction could become much more effective. The efficacy of the new reaction would lead to the
expectation that the rate of reaction and the reaction order would increase.
Another interpretation of re-packing the reactor is the potential of creating different
pathways through the catalyst than previously designed. The carbon deposits and rust in the old
system could have blocked flow through the reactor, which would significantly affect the amount
of CO2 being formed. Catalysts deactivate over time, and with forced pathways for the methane
to flow through, the palladium could have easily been deactivating faster in those forced
pathways, further limiting the reaction. This would create a concentration gradient of catalyst
and thus significantly affect the amount of CO2 produced. This would help to explain the
difference between the earlier GC results and the later CO2 meter results. However, there are
other factors that could aid in understanding the difference in rate orders.
Chapter 5.2.2: The CO2 Meters
Upon acknowledging the different rate order for the reaction, the CO2 meters were run
against known CO2 concentrations to verify their accuracy. Both the 3% and 30% meters were
run against 2% CO2 in a gaseous mixture. Both meters read the known 2% CO2 as 3% which
does not verify their accuracy, but refutes it. This inaccuracy of the CO2 meter readings can
easily affect the calculated kinetic results. The amount of CO2 was over-read, which could
increase the reaction order by over-projecting how much CO2 was actually produced.
39
Furthermore, the meters did read unusual data when flowing air through the system. If
air itself is run through the system, there should be roughly 400 parts per million CO2 in the
gaseous mixture. The CO2 meters, however, read varying CO2, ranging from negative CO2
concentrations to 500 ppm. This inaccuracy also can affect the accuracy of the reaction order
results in comparison to the previous gas chromatograph results.
Each of the two CO2 meters presented its own series of limitations, hindering the intake
of information during experimentation. The 30% meter did measure the flow of CO2 as a
percentage of total flow, the ambient temperature, and the relativity humidity (%) over the course
of the measuring period. This meter took measurements every 15 seconds, which was its primary
limitation. Unlike the 3% meter, which took readings in 2 second intervals, the graphical data
for the 30% meter appeared much more jagged and noisy. This could have negatively affected
the analysis of the reaction order and effectively caused a discrepancy between calculations
based on the 30% and the 3% meters.
Despite taking measurements every 2 seconds instead of every 15 seconds, ensuring more
accurate measurements and smooth graphical data, the 3% CO2 meter presented its own
limitations as well. First, this instrument, unlike the 30% meter, did not measure ambient
temperature or relative humidity. Due to the given specifications of the device, the
measurements made for the flow of CO2 as a percentage became less accurate at higher
concentrations. If the concentration of CO2 rose between 5% and 10%, the meter was still able to
make measurements, but less accurately. If the concentration exceeded 10% then the
measurement made by the meter would not be valid.
40
Chapter 5.2.2.1: Water Formation on the CO2 Meters
A major issue encountered during the experimentation with the redesigned apparatus was
the observation of liquid water in the tubing near the CO2 meters for some runs. One possible
explanation for the origin of this was is that water from the bubble flask could have entered the
piping and flowed through the CO2 meters and corresponding tubing. The bubble flask had been
moved upward and so the pipe hanging above the water contained in the flask became
submerged. During operation of the reaction, if the valve for the flask and the valve to the
meters were opened, water could have been siphoned up into the process stream and therefore
into the meters. Measurements were distorted, but the circuitry and inner membranes of each
meter were intact.
Another, more plausible reason for the presence of liquid water at the CO2 meters was
from the reaction products. The methane oxidation reaction produces steam. However, if the
steam condenses due to the drop in temperature between the reactor and the meters, then water
will form and, due to its cohesive properties, accumulate in specific areas, mainly the piping
prior to the valve leading to the CO2 meters. This could then cause water to emerge out of the
valve if pressure builds up inside the system, dousing the CO2 meters and further damaging their
accuracy.
Chapter 5.2.2.2: Methods to Alleviate Water Formation
One could observe water in the tubing before and between the meters. To mitigate this
issue, the CO2 meters were disconnected from the rest of the apparatus and air was sent through
the system overnight at a flow rate of 15% of total flow as designated by the electronic flow
meter. Upon experimentation the following day, the wet tubing was replaced and devices meant
to impede the flow of water and water vapor were implemented between the outlet of the
41
apparatus and the inlet of the CO2 meters. This ensured that no new flow would contain any
water and therefore return the meter measurements to normal levels. The CO2 meters showed no
sign of damage from the water, though some residual water remaining in the process stream was
observed.
There are a variety of solutions to the potential recurrence of water entry into the process
stream and CO2 meters. The simplest and most logical solution would be to install a check valve
between the bubble flask and ball valve leading back into the process stream to prevent that
cause of water contamination. This would prevent any backflow and therefore prevent water
from entering the meters stream. In terms of operation, the probability of this issue occurring
again can also be minimized by ensuring that the ball valve leading to the bubble flask is closed
before the valve leading to the CO2 meters is opened. The operator should also check to make
sure that the hanging pipe is not submerged in the water contained in the bubble flask prior to
operating the system.
Avoiding or minimizing condensation of water produced via the reaction will require a
different approach. The manufacturer dictates that the CO2 meters can handle up to 2% water in
the product stream. Despite calculating a water saturation composition of 2.28% at room
temperature (inlet temperature), many experimental runs produced more than 4% water.
Therefore, a significant amount of liquid water likely accumulated in the reactor system. To
mitigate this issue, the reimplementation of the heating tape running at 40⁰C to the reactor
effluent stream is necessary. This temperature was selected to allow an appreciable methane feed
composition range, but was not too hot to interfere with the CO2 meter readings. For reaction
using the palladium catalyst at 550K, the temperature at which the order is calculated, the
maximum methane feed to produce less than the saturation fraction of water is 3.6%. It is safe to
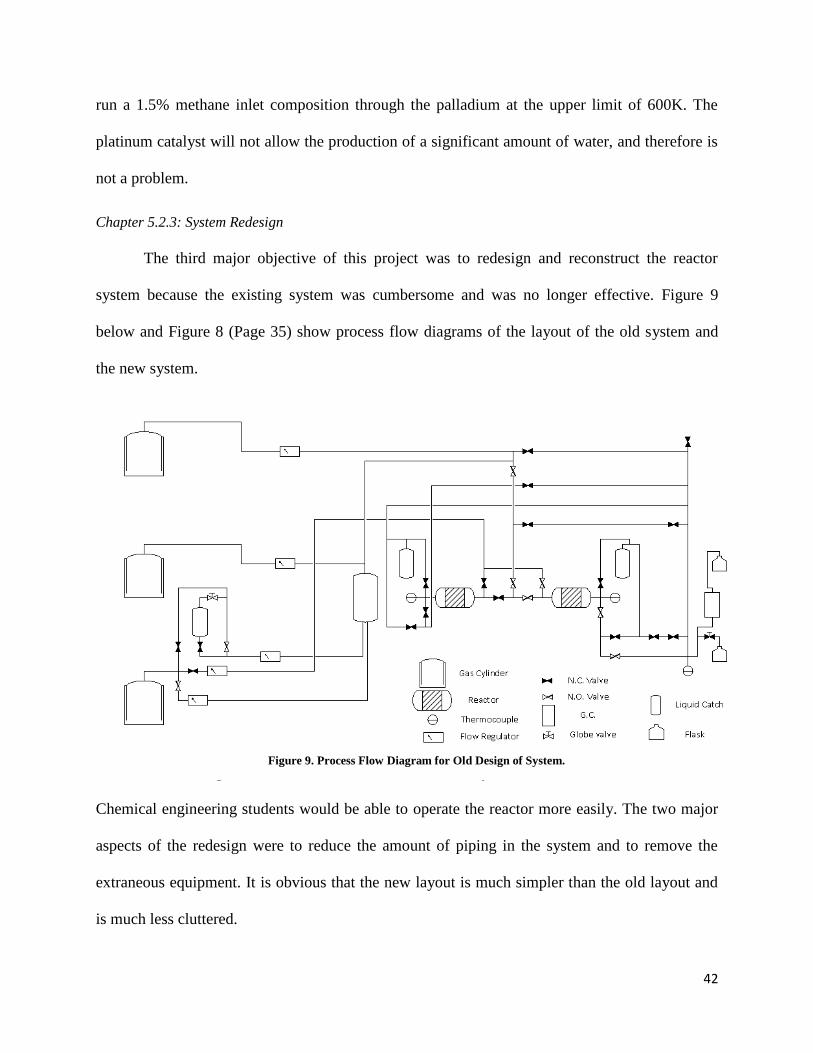
42
run a 1.5% methane inlet composition through the palladium at the upper limit of 600K. The
platinum catalyst will not allow the production of a significant amount of water, and therefore is
not a problem.
Chapter 5.2.3: System Redesign
The third major objective of this project was to redesign and reconstruct the reactor
system because the existing system was cumbersome and was no longer effective. Figure 9
below and Figure 8 (Page 35) show process flow diagrams of the layout of the old system and
the new system.
The redesign and reconstruction of the reactor system were done such that senior
Chemical engineering students would be able to operate the reactor more easily. The two major
aspects of the redesign were to reduce the amount of piping in the system and to remove the
extraneous equipment. It is obvious that the new layout is much simpler than the old layout and
is much less cluttered.
Figure 9. Process Flow Diagram for Old Design of System.
43
The gas chromatograph and the downstream flask were removed from the system and
replaced with CO2 meters. During a unit operations class, the gas chromatograph became
dysfunctional due to an external, unforeseen software issue. Therefore, it was imperative to
install the CO2 meters to allow the laboratory experiment to continue.
The first components that were removed during the system disassembly were the liquid
catches. These components were used in an old version of this unit operations experiment. This
experiment involved the use of liquid feeds into the reactor. The idea at one time was to make
this reactor produce ethanol. However, the old liquid reaction was no longer being used and
therefore became superfluous. The new process undergoes a gaseous catalytic reaction which
renders this equipment obsolete.
Furthermore, sixteen valves were removed from the system. Many of the valves that were
present in the old system were either redundant, broken, or both. Both of the globe valves that
were present in the old system were removed because the flow regulators attached to the system
provide all of the necessary flow control.
Chapter 5.2.4: System Reassembly
The system was entirely disassembled and reassembled according to the process flow
diagram seen in Figure 8. The simpler design makes the system much less cumbersome both in
PFD format and in actuality, as seen below in Figure 10.
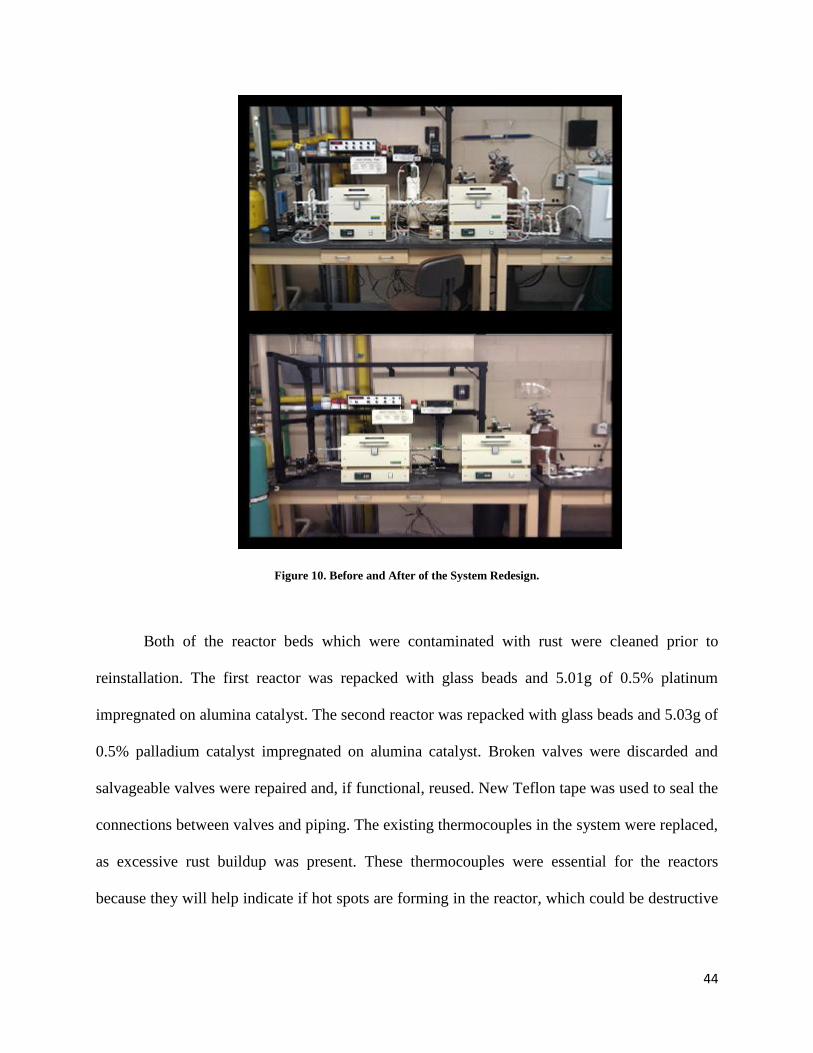
44
Figure 10. Before and After of the System Redesign.
Both of the reactor beds which were contaminated with rust were cleaned prior to
reinstallation. The first reactor was repacked with glass beads and 5.01g of 0.5% platinum
impregnated on alumina catalyst. The second reactor was repacked with glass beads and 5.03g of
0.5% palladium catalyst impregnated on alumina catalyst. Broken valves were discarded and
salvageable valves were repaired and, if functional, reused. New Teflon tape was used to seal the
connections between valves and piping. The existing thermocouples in the system were replaced,
as excessive rust buildup was present. These thermocouples were essential for the reactors
because they will help indicate if hot spots are forming in the reactor, which could be destructive
45
to the experiment and for safety purposes. Finally, each piece of equipment was reattached using
as little piping as possible.
The system operation was affected by the redesign through a reduced residence time for
the process stream. This reduced residence time was a direct result of the reduced piping in the
system and the removal of the unnecessary equipment. At the standard air flow rate for this
experiment (858 mL/min), the residence time was reduced from 90-120s to 15-30s. This
decreased the time necessary for future experimentation periods to be completed. The physical
integrity of the system was improved through the redesign because the potential for leaky valves
was removed. Furthermore, because the extraneous equipment was removed, fewer connections
exist in the system, which means inherently there are now fewer points for gases to enter or
escape the system.
Chapter 5.3: Addition of the Platinum Catalyst
In addition to the analysis of the palladium catalyst, another catalyst was added to the
first reactor in order to add a new element of analysis for the future unit operations students. The
first reactor was re-packed using a platinum catalyst. By adding this catalyst, the experiment
delves further into the study of catalysis with the students being able to compare the platinum
catalyst against the palladium catalyst to determine which is a more favorable catalyst for
methane oxidation.
The results from this project proved that palladium is a more favorable catalyst for
reaction. The palladium reacts on a reaction order of roughly 1.3 while the platinum has a
reaction order of roughly 0.6. This implies that the palladium driven reaction operates faster. A
reason for this substantially higher reaction order can be how the reaction occurs. Palladium
oxidizes to form PdO, which in turn will continue to react with the methane at temperatures
46
below 1055 K. The platinum remains in an un-oxidized, metallic phase at temperatures below
1055 K. This will cause the platinum to be a much less active catalyst in reaction than palladium.
Also, the platinum requires a substantially higher temperature in order to react, roughly 100 K
higher in order to begin conversion of CO2. In order to compare the palladium and platinum at
the same temperature, the reactants were run through both catalysts at the same temperature (623
K). The results showed that palladium had a reaction order of 1.31 at 623 K while platinum had
a reaction order of 0.58. This further proves the validity of the comparison of both catalysts
being effective in establishing palladium as more effective than platinum.
This addition to the experiment was important to the unit operations lab because the other
lab experiments the students conduct do not pertain to catalysis. Therefore, by adding another
catalyst that has much different reaction orders, rates, and activation energy, students will further
learn and comprehend catalysis. The expectation is for students to understand that not every
catalyst functions the same as other catalysts. The result that should be obtained in this instance
is that the platinum catalyst is not nearly as effective in oxidation as the palladium catalyst.
47
Chapter 6: Conclusions and Recommendations
Throughout the data collection and analysis period, it was determined that the results for
the CO2 meters were in agreement with the given reaction. The kinetic analyses of the results
from the CO2 meters yielded similar numbers to those commonly reported in literature.
However, water contamination may have skewed data reported from the CO2 meters which could
be cause for the minor differences, as more than the allowable 2% water content regularly had
been produced via reaction. Furthermore, the CO2 meters data reported were consistent with each
other. The data were reproducible between meters and experimental periods both before and after
the system redesign.
The addition of the platinum catalyst to the first reactor bed added a new dimension to the
study of catalysis for unit operations students at WPI. It was experimentally shown to catalyze
the reaction, but significantly less effectively than the palladium catalyst did. This expected
result gives unit operations students reason to explore the behavior difference in literature.
Although the kinetic analysis for the platinum catalyst did not match literature data, the general
trends between both catalysts studied were similar to literature.
Future studies done on this reaction can explore a variety of aspects where this group did
not have time to explore completely. One such aspect to explore is the effect of water
contamination on the CO2 meter readings. The group was able to obtain a general understanding
of how much water is tolerable in the system. However, due to time constraints, these analyses
could not fully explore the topic. A way to attempt this study would be to run the experiment
with a water condensing stage to remove water from the stream. The data obtained could then be
compared to data that had water still in stream. Another area to explore further is a complete
analysis of the platinum catalyst and how it compares to the palladium catalyst. This study on
48
the platinum did not explore the catalyst entirely, and future studies can easily explore platinum
as a catalyst.
Due to the agreement of the numerical results from the CO2 meter and the literature data,
this project was successful. The amount of time needed to run the catalytic reactor lab was
significantly reduced, allowing for additional analyses to be completed by future students in the
two normally allotted four-hour experiment sessions. The system and experiment redesign were
successful such that the equipment is simpler to use, while providing a comparable intellectual
challenge to the old experiment.
49
Chapter 7: References
1. John N. Armor, A history of industrial catalysis, Catalysis Today, Volume 163, Issue 1,
12 April 2011, Pages 3-9, ISSN 0920-5861, 10.1016/j.cattod.2009.11.019.
2. "Global demand for catalysts to exceed $17 billion in 2014." Hydrocarbon Processing
Apr. 2011. General OneFile. Web. 10 Mar. 2013.
3. Rawlings, James B. Chemical Kinetics in Well-mixed Reactors. Rep. University of
Wisconsin-Madison: Department of Chemical and Biological Engineering, 2011.
Print.
4. Zhang, Jinzhong, Robin Smith, Design and optimisation of batch and semi-batch
reactors, Chemical Engineering Science, Volume 59, Issue 2, January 2004, Pages
459-478, ISSN 0009-2509, 10.1016/j.ces.2003.10.004.
5. Coker, A. Kayode. Modeling of Chemical Kinetics and Reactor Design. Boston, MA:
Gulf Professional Pub., 2001. Print.
6. Modeling Techniques for Batch Reactors. Diss. University of Pretoria, n.d. Pretoria: n.p.,
n.d. Print.
7. Catalano, Sam, Steve Wesorick, and Kelsey Kaplan. "Continuous Stirred-Tank
Reactors." Encyclopedia of Chemical Engineering Equipment. N.p.: n.p., n.d.
Print.
8. Fogler, and Gurmen. Industrial Reactors: Mole Balances. Rep. N.p.: University of
Michigan, 2007. Print.
9. Levine, Ralph. "CSTR Design for Reversible Reactions: Here, a Design Approach for
Continuous Stirred-tank Reactors Is Outlined for Three Cases of Second-order
Reactions.(Engineering Practice)." Chemical Engineering (2009): n. pag. Web.
50
10. Fogler, H. Scott, and M. Nihat Gurmen. Packed Bed Reactors (2000): n. pag. University
of Michigan, Department of Chemical Engineering. Web.
11. Eigenberger, Gerhart. "Fixed-Bed Reactors." Fixed-Bed Reactors 4th ser. 4.B (n.d.): 199-
238. Federal Republic of Germany. Web.
<http://elib.unistuttgart.de/opus/volltexte/2009/4798/pdf/eig16.pdf>.
12. Bartal, Nicholas, Gabriella Serrati, Daniel Szewczyk, and John Waterman. Modeling of a
Catalytic Packed Bed Reactor and Gas Chromatograph Using COMSOL
Multiphysics. Rep. Wocester: Worcester Polytechnic Institute, 2009. Print.
13. Yakhnin, V. Z., and M. Menzinger. "Moving Hot Spots and Resonance in Adiabatic
Packed-bed Reactors."AIChE Journal 44.5 (2004): n. pag. Web.
14. Kimura, Shoichi, and Octave Levenspiel. "Temperature Excursions in Adiabatic Packed
Bed Reactors."Industrial & Engineering Chemistry Process Design and
Development 16.1 (1977): 145-48. Web.
15. Froment, Gilbert F., and K. C. Waugh. Reaction Kinetics and the Development of
Catalytic Processes: Proceedings of the International Symposium, Brugge,
Belgium, April 19-21, 1999. Amsterdam: Elsevier, 1999. Print.
16. Koning, Bert. Heat and Mass Transport in Tubular Packed Bed Reactors at Reacting and
Non-Reacting Conditions. Thesis. University of Twente, 2002. N.p.: Twente UP,
2002. Print.
17. Davis, Mark E. "Reactors Accomplishing Heterogeneous Reactions." Fundamentals of
Chemical Reaction Engineering. Ed. Robert J. Davis. New York: McGraw-Hill
Higher Education, 2003. N. pag. Print.
51
18. Menzinger, M., V. Yakhnin, A. Jaree, P.L. Silveston, R.R. Hudgins, Dynamic responses
of packed bed reactors, Chemical Engineering Science, Volume 59, Issue 19,
October 2004, Pages 4011-4022
19. Riggs, James B., Karim, Nazmul M.. Chemical and Bio-Process Control. Third Edition
Chapter 18. Ferret Publishing
20. Curtis, William, Jr., David Ford, T. J. Mountziaris, and Michael Sarli. Chemical
Engineering 401-402: Senior Laboratory. Rep. Amherst: University of
Massachusetts, n.d. Print.
21. "Methane Emissions." EPA. Environmental Protection Agency, 14 June 2012. Web.
29Mar. 2013. <http://epa.gov/climatechange/ghgemissions/gases/ch4.html>.
22. ara S. scand n, Salvador Ord e , Aurelio ega, ernando . D e , Oxidation of
methane over palladium catalysts: effect of the support, Chemosphere, Volume
58, Issue 1, January 2005, Pages 9-17, ISSN 0045-6535,
10.1016/j.chemosphere.2004.09.012.
23. Ciuparu, Dragos, Maxim R. Lyubovsky, Eric Altman, Lisa D. Pfefferle, and Abhaya
Datye. "Catalytic Combustion Of Methane Over Palladium-Based
Catalysts." Catalysis Reviews 44.4 (2002): 593-649. Print.
24. Chieh, Chung. Bond Lengths and Energies. Tech. Waterloo: University of Waterloo, n.d.
Print.
25. Anderson, R. B., K. C. Stein, J. J. Feenan, and L. J. E. Hofer. "Catalytic Oxidation of
Methane." Industrial & Engineering Chemistry 53.10 (1961): 809-12. Print.
52
26. Maxim yubovsky, isa Pfefferle, Methane combustion over the α-alumina supported Pd
catalyst: Activity of the mixed Pd/PdO state, Applied Catalysis A: General,
Volume 173, Issue 1, 11 October 1998, Pages 107-119.
27. Joo H. Lee, David L. Trimm, Catalytic combustion of methane, Fuel Processing
Technology, Volume 42, Issues 2–3, April 1995, Pages 339-359
28. “How Does Gas Chromatography Work?" Gas Chomatography Theory. N.p., 10 Aug.
2006. Web. 11 Dec. 2012.
<http://www.chem.ucla.edu/~bacher/General/30BL/gc/theory.html>.
29. "How Does an NDIR CO2 Sensor Work?."CO2Meter.com. N.p., 01 May 2013. Web. 7
Apr 2013. <http://www.co2meter.com/blogs/news/6010192-how-does-an-ndir-
co2-sensor-work>.
30. Fogler, H S. Elements of chemical reaction engineering. Upper Saddle River, NJ:
Prentice Hall PTR, 2006. Print.
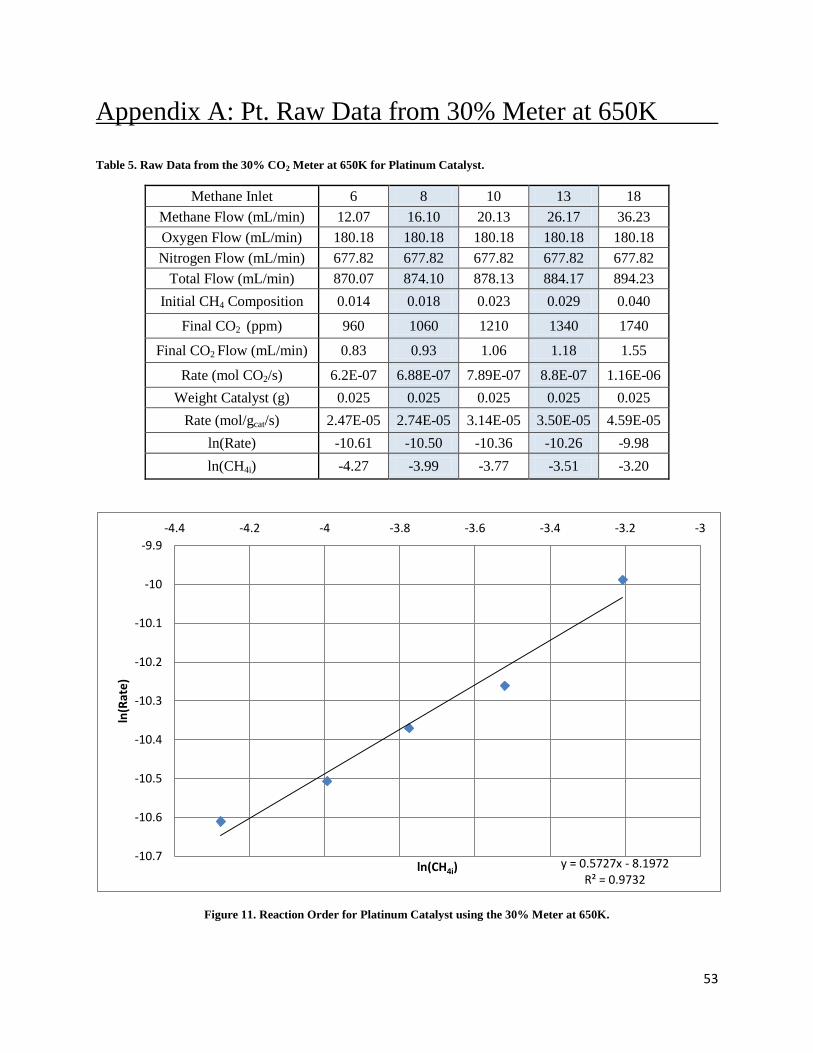
53
Appendix A: Pt. Raw Data from 30% Meter at 650K
Table 5. Raw Data from the 30% CO2 Meter at 650K for Platinum Catalyst.
Methane Inlet 6 8 10 13 18
Methane Flow (mL/min) 12.07 16.10 20.13 26.17 36.23
Oxygen Flow (mL/min) 180.18 180.18 180.18 180.18 180.18
Nitrogen Flow (mL/min) 677.82 677.82 677.82 677.82 677.82
Total Flow (mL/min) 870.07 874.10 878.13 884.17 894.23
Initial CH4 Composition 0.014 0.018 0.023 0.029 0.040
Final CO2 (ppm) 960 1060 1210 1340 1740
Final CO2 Flow (mL/min) 0.83 0.93 1.06 1.18 1.55
Rate (mol CO2/s) 6.2E-07 6.88E-07 7.89E-07 8.8E-07 1.16E-06
Weight Catalyst (g) 0.025 0.025 0.025 0.025 0.025
Rate (mol/gcat/s) 2.47E-05 2.74E-05 3.14E-05 3.50E-05 4.59E-05
ln(Rate) -10.61 -10.50 -10.36 -10.26 -9.98
ln(CH4i) -4.27 -3.99 -3.77 -3.51 -3.20
Figure 11. Reaction Order for Platinum Catalyst using the 30% Meter at 650K.
y = 0.5727x - 8.1972 R² = 0.9732
-10.7
-10.6
-10.5
-10.4
-10.3
-10.2
-10.1
-10
-9.9
-4.4 -4.2 -4 -3.8 -3.6 -3.4 -3.2 -3
ln(R
ate
)
ln(CH4i)
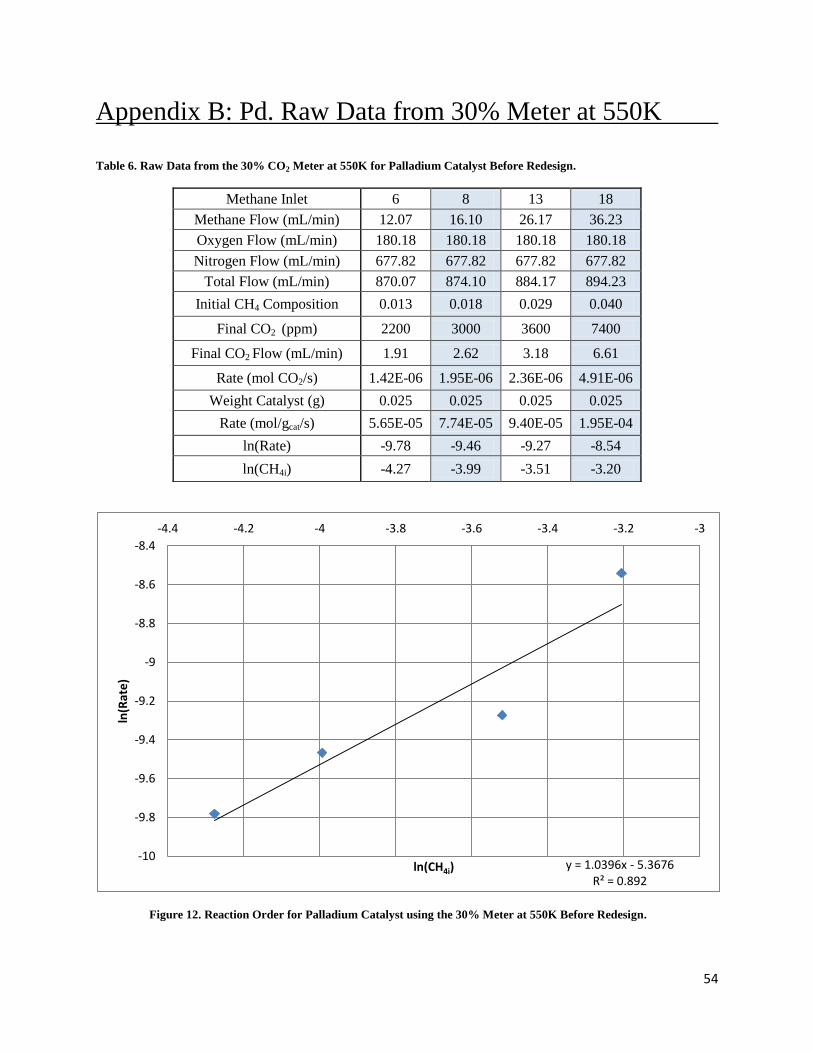
54
y = 1.0396x - 5.3676 R² = 0.892
-10
-9.8
-9.6
-9.4
-9.2
-9
-8.8
-8.6
-8.4
-4.4 -4.2 -4 -3.8 -3.6 -3.4 -3.2 -3
ln(R
ate
)
ln(CH4i)
Appendix B: Pd. Raw Data from 30% Meter at 550K
Table 6. Raw Data from the 30% CO2 Meter at 550K for Palladium Catalyst Before Redesign.
Methane Inlet 6 8 13 18
Methane Flow (mL/min) 12.07 16.10 26.17 36.23
Oxygen Flow (mL/min) 180.18 180.18 180.18 180.18
Nitrogen Flow (mL/min) 677.82 677.82 677.82 677.82
Total Flow (mL/min) 870.07 874.10 884.17 894.23
Initial CH4 Composition 0.013 0.018 0.029 0.040
Final CO2 (ppm) 2200 3000 3600 7400
Final CO2 Flow (mL/min) 1.91 2.62 3.18 6.61
Rate (mol CO2/s) 1.42E-06 1.95E-06 2.36E-06 4.91E-06
Weight Catalyst (g) 0.025 0.025 0.025 0.025
Rate (mol/gcat/s) 5.65E-05 7.74E-05 9.40E-05 1.95E-04
ln(Rate) -9.78 -9.46 -9.27 -8.54
ln(CH4i) -4.27 -3.99 -3.51 -3.20
Figure 12. Reaction Order for Palladium Catalyst using the 30% Meter at 550K Before Redesign.
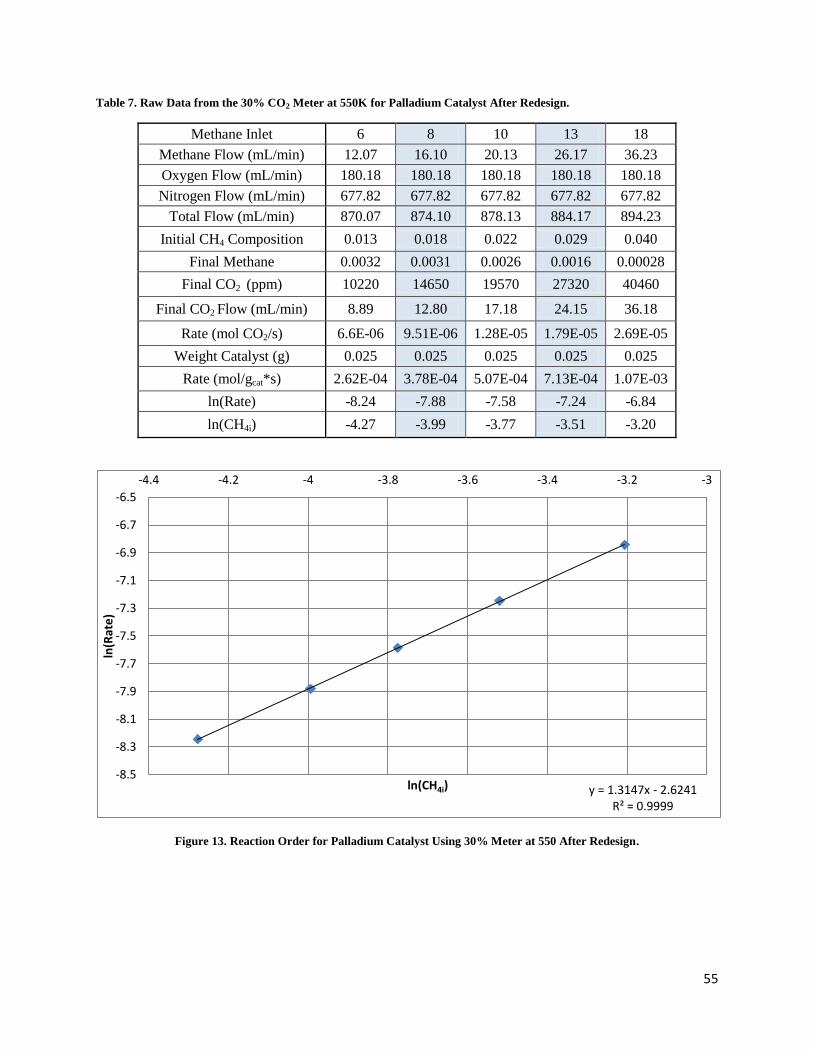
55
Table 7. Raw Data from the 30% CO2 Meter at 550K for Palladium Catalyst After Redesign.
Methane Inlet 6 8 10 13 18
Methane Flow (mL/min) 12.07 16.10 20.13 26.17 36.23
Oxygen Flow (mL/min) 180.18 180.18 180.18 180.18 180.18
Nitrogen Flow (mL/min) 677.82 677.82 677.82 677.82 677.82
Total Flow (mL/min) 870.07 874.10 878.13 884.17 894.23
Initial CH4 Composition 0.013 0.018 0.022 0.029 0.040
Final Methane 0.0032 0.0031 0.0026 0.0016 0.00028
Final CO2 (ppm) 10220 14650 19570 27320 40460
Final CO2 Flow (mL/min) 8.89 12.80 17.18 24.15 36.18
Rate (mol CO2/s) 6.6E-06 9.51E-06 1.28E-05 1.79E-05 2.69E-05
Weight Catalyst (g) 0.025 0.025 0.025 0.025 0.025
Rate (mol/gcat*s) 2.62E-04 3.78E-04 5.07E-04 7.13E-04 1.07E-03
ln(Rate) -8.24 -7.88 -7.58 -7.24 -6.84
ln(CH4i) -4.27 -3.99 -3.77 -3.51 -3.20
Figure 13. Reaction Order for Palladium Catalyst Using 30% Meter at 550 After Redesign.
y = 1.3147x - 2.6241 R² = 0.9999
-8.5
-8.3
-8.1
-7.9
-7.7
-7.5
-7.3
-7.1
-6.9
-6.7
-6.5
-4.4 -4.2 -4 -3.8 -3.6 -3.4 -3.2 -3
ln(R
ate
)
ln(CH4i)
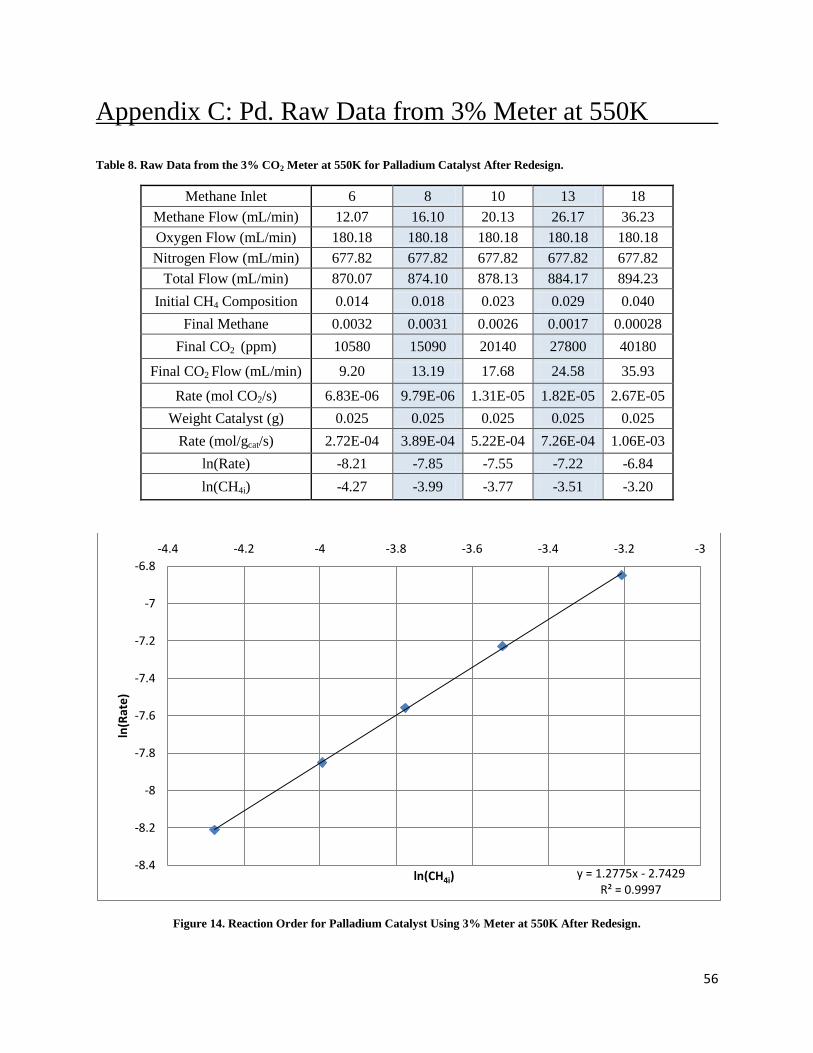
56
Appendix C: Pd. Raw Data from 3% Meter at 550K
Table 8. Raw Data from the 3% CO2 Meter at 550K for Palladium Catalyst After Redesign.
Methane Inlet 6 8 10 13 18
Methane Flow (mL/min) 12.07 16.10 20.13 26.17 36.23
Oxygen Flow (mL/min) 180.18 180.18 180.18 180.18 180.18
Nitrogen Flow (mL/min) 677.82 677.82 677.82 677.82 677.82
Total Flow (mL/min) 870.07 874.10 878.13 884.17 894.23
Initial CH4 Composition 0.014 0.018 0.023 0.029 0.040
Final Methane 0.0032 0.0031 0.0026 0.0017 0.00028
Final CO2 (ppm) 10580 15090 20140 27800 40180
Final CO2 Flow (mL/min) 9.20 13.19 17.68 24.58 35.93
Rate (mol CO2/s) 6.83E-06 9.79E-06 1.31E-05 1.82E-05 2.67E-05
Weight Catalyst (g) 0.025 0.025 0.025 0.025 0.025
Rate (mol/gcat/s) 2.72E-04 3.89E-04 5.22E-04 7.26E-04 1.06E-03
ln(Rate) -8.21 -7.85 -7.55 -7.22 -6.84
ln(CH4i) -4.27 -3.99 -3.77 -3.51 -3.20
Figure 14. Reaction Order for Palladium Catalyst Using 3% Meter at 550K After Redesign.
y = 1.2775x - 2.7429 R² = 0.9997
-8.4
-8.2
-8
-7.8
-7.6
-7.4
-7.2
-7
-6.8
-4.4 -4.2 -4 -3.8 -3.6 -3.4 -3.2 -3
ln(R
ate
)
ln(CH4i)
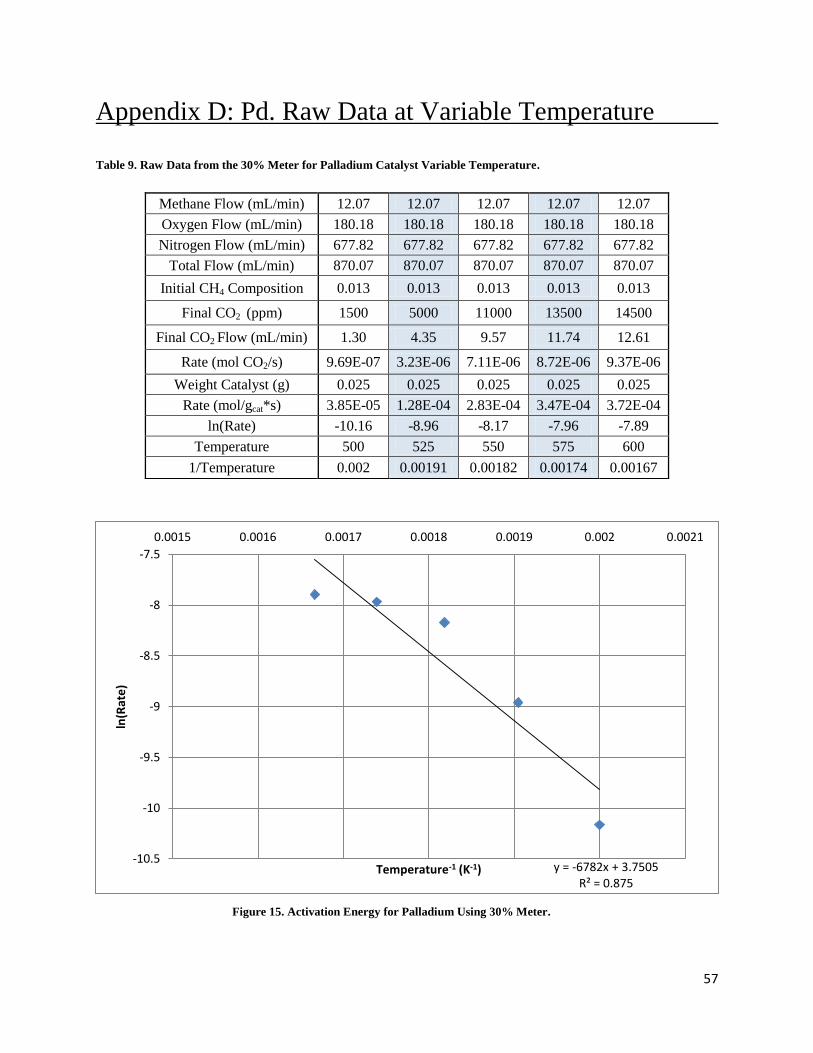
57
y = -6782x + 3.7505 R² = 0.875
-10.5
-10
-9.5
-9
-8.5
-8
-7.5
0.0015 0.0016 0.0017 0.0018 0.0019 0.002 0.0021
ln(R
ate
)
Temperature-1 (K-1)
Appendix D: Pd. Raw Data at Variable Temperature
Table 9. Raw Data from the 30% Meter for Palladium Catalyst Variable Temperature.
Methane Flow (mL/min) 12.07 12.07 12.07 12.07 12.07
Oxygen Flow (mL/min) 180.18 180.18 180.18 180.18 180.18
Nitrogen Flow (mL/min) 677.82 677.82 677.82 677.82 677.82
Total Flow (mL/min) 870.07 870.07 870.07 870.07 870.07
Initial CH4 Composition 0.013 0.013 0.013 0.013 0.013
Final CO2 (ppm) 1500 5000 11000 13500 14500
Final CO2 Flow (mL/min) 1.30 4.35 9.57 11.74 12.61
Rate (mol CO2/s) 9.69E-07 3.23E-06 7.11E-06 8.72E-06 9.37E-06
Weight Catalyst (g) 0.025 0.025 0.025 0.025 0.025
Rate (mol/gcat*s) 3.85E-05 1.28E-04 2.83E-04 3.47E-04 3.72E-04
ln(Rate) -10.16 -8.96 -8.17 -7.96 -7.89
Temperature 500 525 550 575 600
1/Temperature 0.002 0.00191 0.00182 0.00174 0.00167
Figure 15. Activation Energy for Palladium Using 30% Meter.
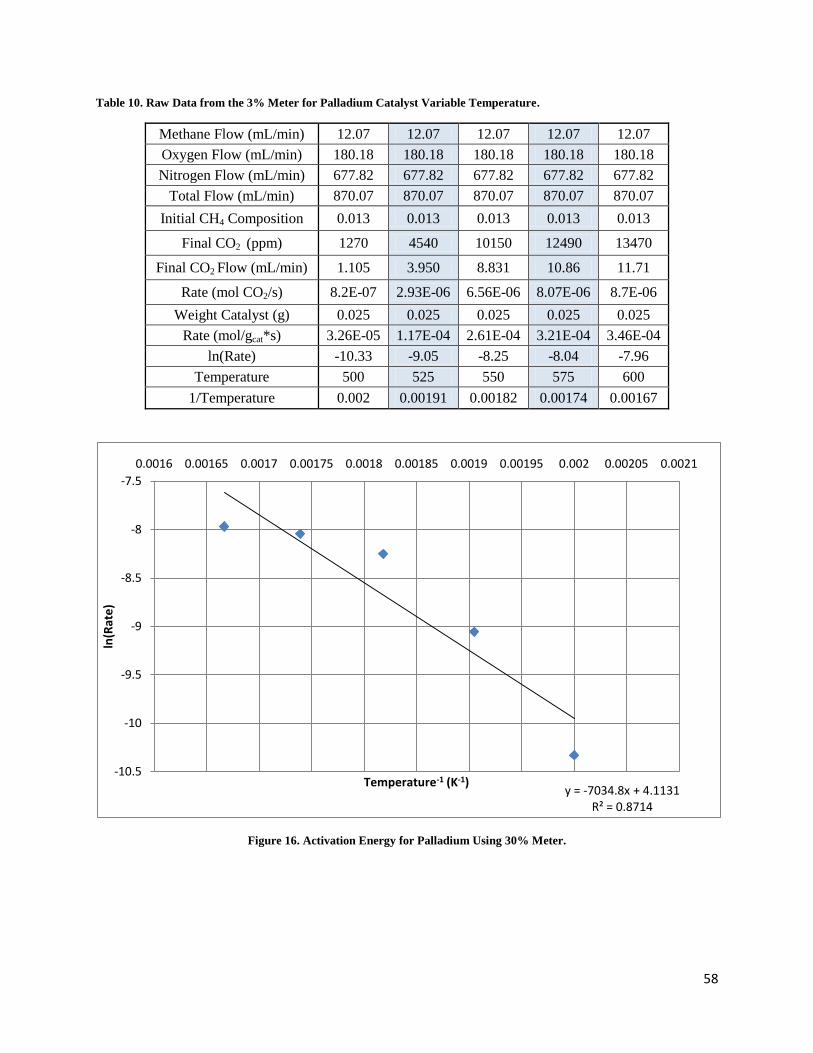
58
Table 10. Raw Data from the 3% Meter for Palladium Catalyst Variable Temperature.
Methane Flow (mL/min) 12.07 12.07 12.07 12.07 12.07
Oxygen Flow (mL/min) 180.18 180.18 180.18 180.18 180.18
Nitrogen Flow (mL/min) 677.82 677.82 677.82 677.82 677.82
Total Flow (mL/min) 870.07 870.07 870.07 870.07 870.07
Initial CH4 Composition 0.013 0.013 0.013 0.013 0.013
Final CO2 (ppm) 1270 4540 10150 12490 13470
Final CO2 Flow (mL/min) 1.105 3.950 8.831 10.86 11.71
Rate (mol CO2/s) 8.2E-07 2.93E-06 6.56E-06 8.07E-06 8.7E-06
Weight Catalyst (g) 0.025 0.025 0.025 0.025 0.025
Rate (mol/gcat*s) 3.26E-05 1.17E-04 2.61E-04 3.21E-04 3.46E-04
ln(Rate) -10.33 -9.05 -8.25 -8.04 -7.96
Temperature 500 525 550 575 600
1/Temperature 0.002 0.00191 0.00182 0.00174 0.00167
Figure 16. Activation Energy for Palladium Using 30% Meter.
y = -7034.8x + 4.1131 R² = 0.8714
-10.5
-10
-9.5
-9
-8.5
-8
-7.5
0.0016 0.00165 0.0017 0.00175 0.0018 0.00185 0.0019 0.00195 0.002 0.00205 0.0021
ln(R
ate
)
Temperature-1 (K-1)
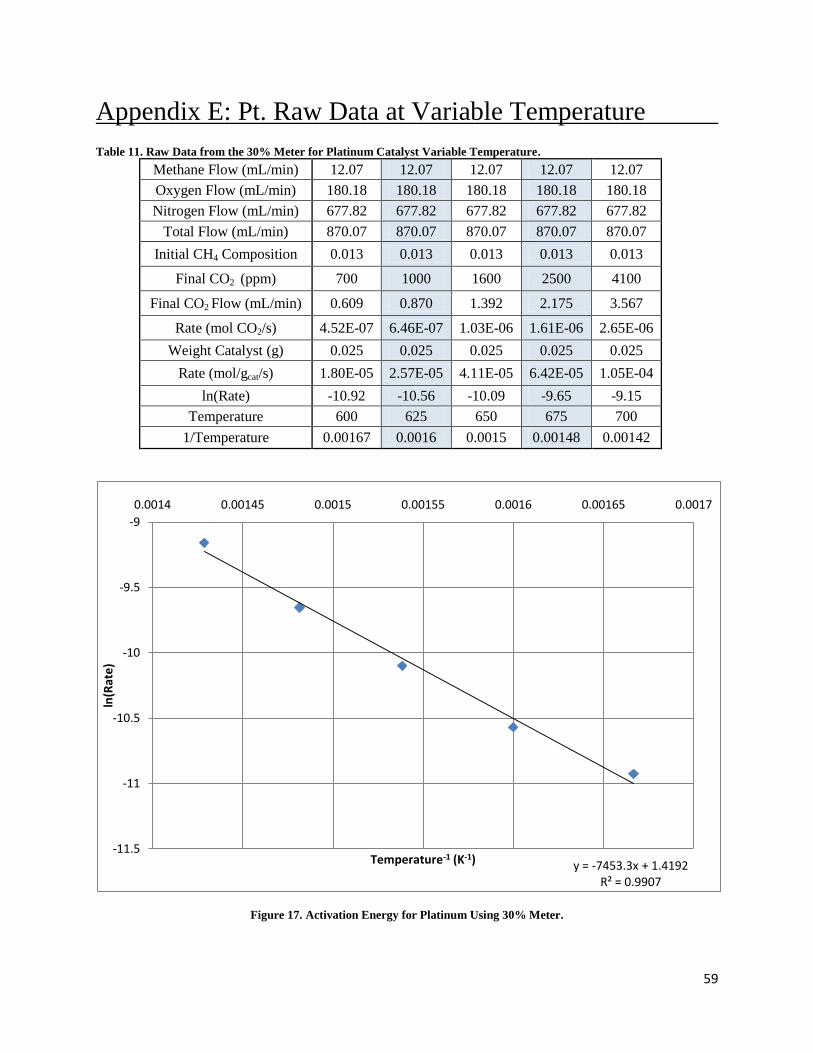
59
Appendix E: Pt. Raw Data at Variable Temperature
Table 11. Raw Data from the 30% Meter for Platinum Catalyst Variable Temperature.
Methane Flow (mL/min) 12.07 12.07 12.07 12.07 12.07
Oxygen Flow (mL/min) 180.18 180.18 180.18 180.18 180.18
Nitrogen Flow (mL/min) 677.82 677.82 677.82 677.82 677.82
Total Flow (mL/min) 870.07 870.07 870.07 870.07 870.07
Initial CH4 Composition 0.013 0.013 0.013 0.013 0.013
Final CO2 (ppm) 700 1000 1600 2500 4100
Final CO2 Flow (mL/min) 0.609 0.870 1.392 2.175 3.567
Rate (mol CO2/s) 4.52E-07 6.46E-07 1.03E-06 1.61E-06 2.65E-06
Weight Catalyst (g) 0.025 0.025 0.025 0.025 0.025
Rate (mol/gcat/s) 1.80E-05 2.57E-05 4.11E-05 6.42E-05 1.05E-04
ln(Rate) -10.92 -10.56 -10.09 -9.65 -9.15
Temperature 600 625 650 675 700
1/Temperature 0.00167 0.0016 0.0015 0.00148 0.00142
Figure 17. Activation Energy for Platinum Using 30% Meter.
y = -7453.3x + 1.4192 R² = 0.9907
-11.5
-11
-10.5
-10
-9.5
-9
0.0014 0.00145 0.0015 0.00155 0.0016 0.00165 0.0017
ln(R
ate
)
Temperature-1 (K-1)
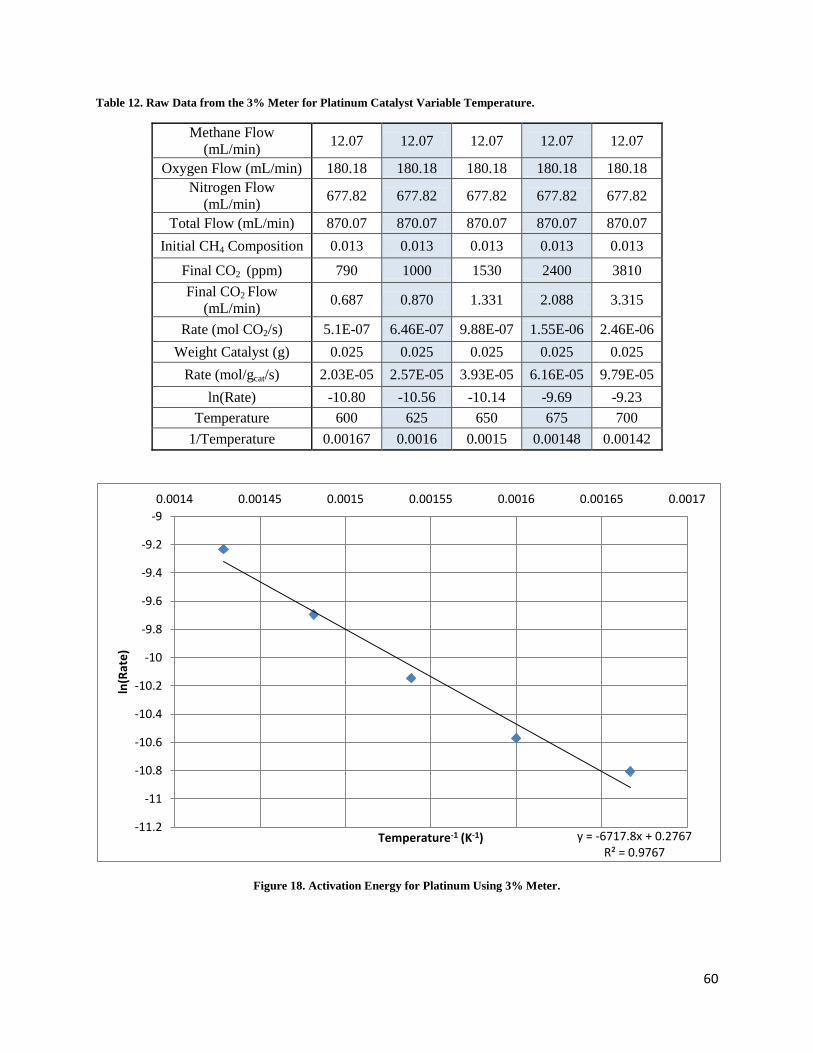
60
Table 12. Raw Data from the 3% Meter for Platinum Catalyst Variable Temperature.
Methane Flow
(mL/min) 12.07 12.07 12.07 12.07 12.07
Oxygen Flow (mL/min) 180.18 180.18 180.18 180.18 180.18
Nitrogen Flow
(mL/min) 677.82 677.82 677.82 677.82 677.82
Total Flow (mL/min) 870.07 870.07 870.07 870.07 870.07
Initial CH4 Composition 0.013 0.013 0.013 0.013 0.013
Final CO2 (ppm) 790 1000 1530 2400 3810
Final CO2 Flow
(mL/min) 0.687 0.870 1.331 2.088 3.315
Rate (mol CO2/s) 5.1E-07 6.46E-07 9.88E-07 1.55E-06 2.46E-06
Weight Catalyst (g) 0.025 0.025 0.025 0.025 0.025
Rate (mol/gcat/s) 2.03E-05 2.57E-05 3.93E-05 6.16E-05 9.79E-05
ln(Rate) -10.80 -10.56 -10.14 -9.69 -9.23
Temperature 600 625 650 675 700
1/Temperature 0.00167 0.0016 0.0015 0.00148 0.00142
Figure 18. Activation Energy for Platinum Using 3% Meter.
y = -6717.8x + 0.2767 R² = 0.9767
-11.2
-11
-10.8
-10.6
-10.4
-10.2
-10
-9.8
-9.6
-9.4
-9.2
-9
0.0014 0.00145 0.0015 0.00155 0.0016 0.00165 0.0017
ln(R
ate
)
Temperature-1 (K-1)
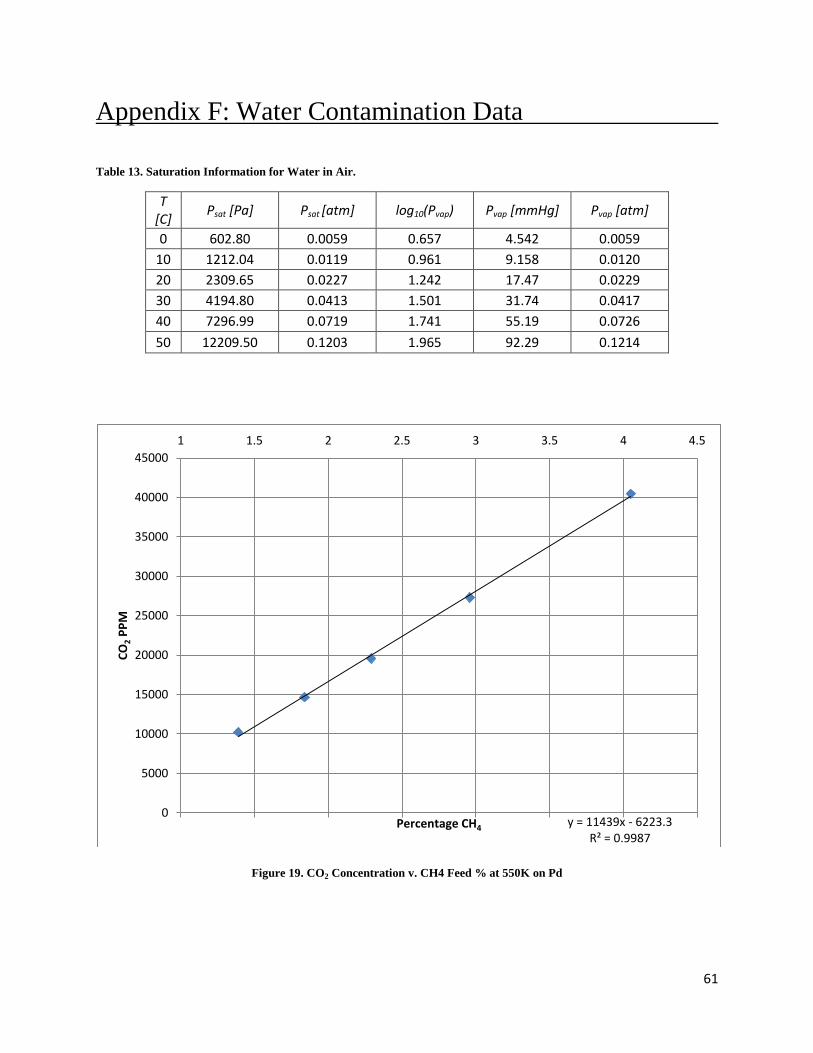
61
Appendix F: Water Contamination Data
Table 13. Saturation Information for Water in Air.
T [C]
Psat [Pa] Psat [atm] log10(Pvap) Pvap [mmHg] Pvap [atm]
0 602.80 0.0059 0.657 4.542 0.0059
10 1212.04 0.0119 0.961 9.158 0.0120
20 2309.65 0.0227 1.242 17.47 0.0229
30 4194.80 0.0413 1.501 31.74 0.0417
40 7296.99 0.0719 1.741 55.19 0.0726
50 12209.50 0.1203 1.965 92.29 0.1214
Figure 19. CO2 Concentration v. CH4 Feed % at 550K on Pd
y = 11439x - 6223.3 R² = 0.9987
0
5000
10000
15000
20000
25000
30000
35000
40000
45000
1 1.5 2 2.5 3 3.5 4 4.5
CO
2 P
PM
Percentage CH4
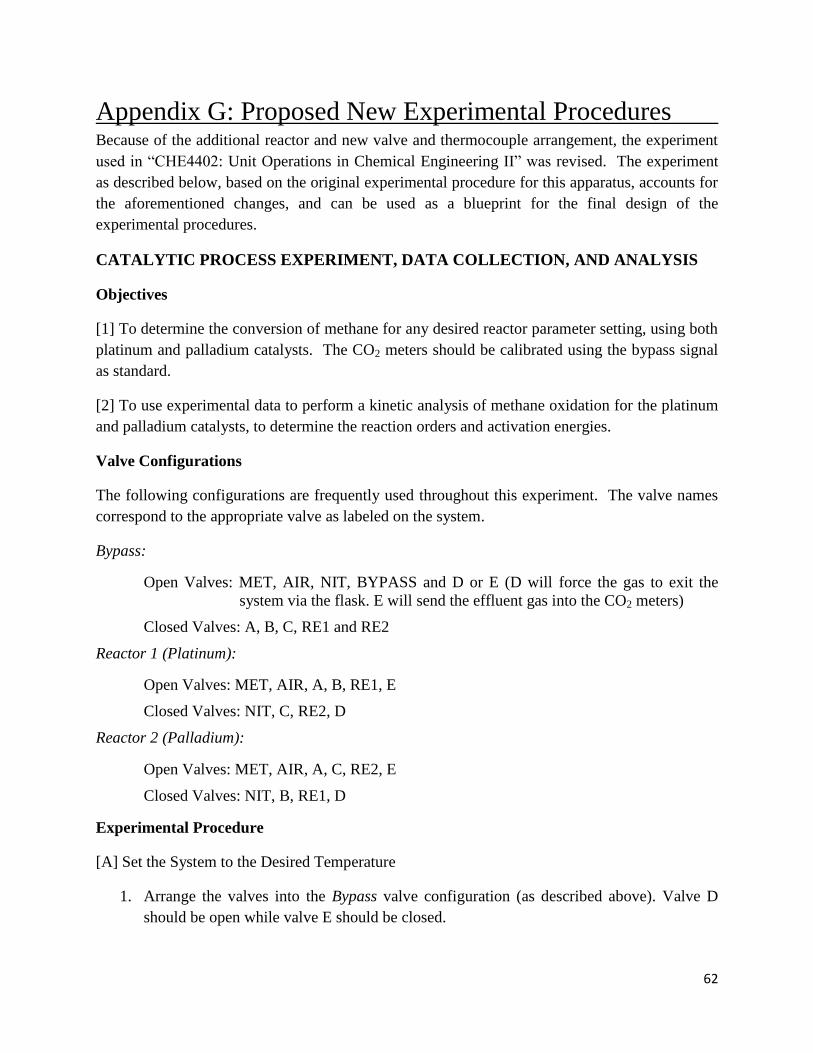
62
Appendix G: Proposed New Experimental Procedures Because of the additional reactor and new valve and thermocouple arrangement, the experiment
used in “CH 4402: Unit Operations in Chemical Engineering II” was revised. The experiment
as described below, based on the original experimental procedure for this apparatus, accounts for
the aforementioned changes, and can be used as a blueprint for the final design of the
experimental procedures.
CATALYTIC PROCESS EXPERIMENT, DATA COLLECTION, AND ANALYSIS
Objectives
[1] To determine the conversion of methane for any desired reactor parameter setting, using both
platinum and palladium catalysts. The CO2 meters should be calibrated using the bypass signal
as standard.
[2] To use experimental data to perform a kinetic analysis of methane oxidation for the platinum
and palladium catalysts, to determine the reaction orders and activation energies.
Valve Configurations
The following configurations are frequently used throughout this experiment. The valve names
correspond to the appropriate valve as labeled on the system.
Bypass:
Open Valves: MET, AIR, NIT, BYPASS and D or E (D will force the gas to exit the
system via the flask. E will send the effluent gas into the CO2 meters)
Closed Valves: A, B, C, RE1 and RE2
Reactor 1 (Platinum):
Open Valves: MET, AIR, A, B, RE1, E
Closed Valves: NIT, C, RE2, D
Reactor 2 (Palladium):
Open Valves: MET, AIR, A, C, RE2, E
Closed Valves: NIT, B, RE1, D
Experimental Procedure
[A] Set the System to the Desired Temperature
1. Arrange the valves into the Bypass valve configuration (as described above). Valve D
should be open while valve E should be closed.
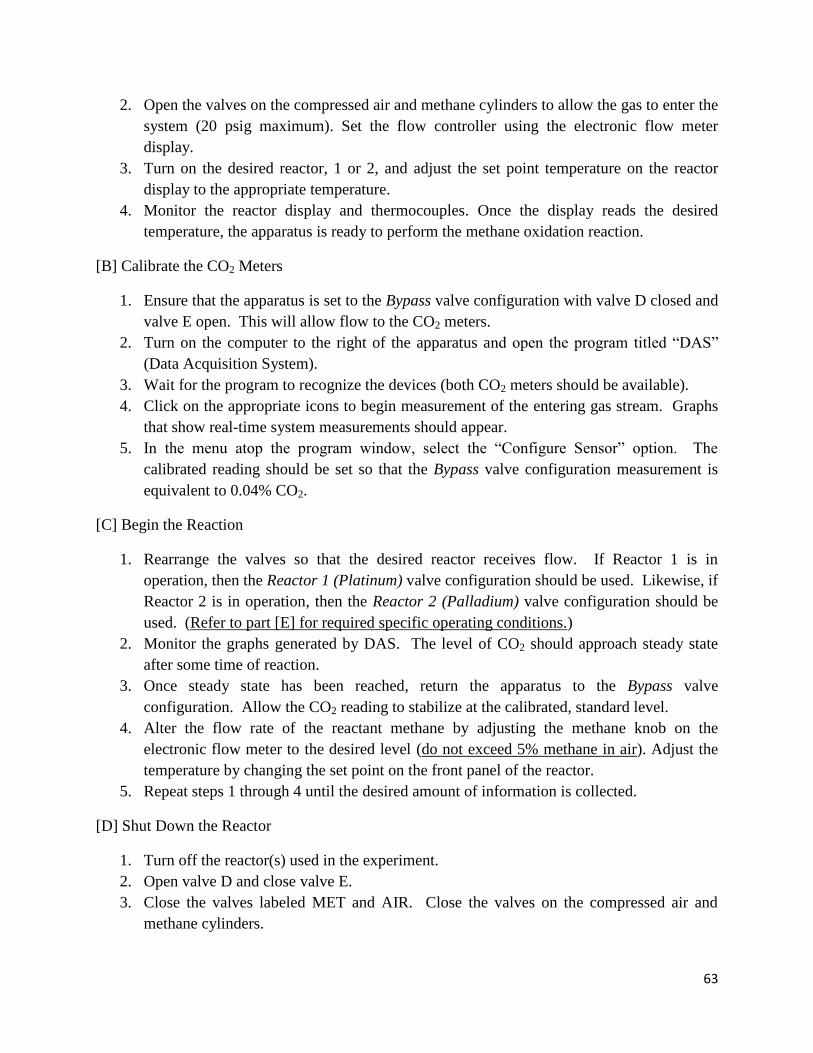
63
2. Open the valves on the compressed air and methane cylinders to allow the gas to enter the
system (20 psig maximum). Set the flow controller using the electronic flow meter
display.
3. Turn on the desired reactor, 1 or 2, and adjust the set point temperature on the reactor
display to the appropriate temperature.
4. Monitor the reactor display and thermocouples. Once the display reads the desired
temperature, the apparatus is ready to perform the methane oxidation reaction.
[B] Calibrate the CO2 Meters
1. Ensure that the apparatus is set to the Bypass valve configuration with valve D closed and
valve E open. This will allow flow to the CO2 meters.
2. Turn on the computer to the right of the apparatus and open the program titled “DAS”
(Data Acquisition System).
3. Wait for the program to recognize the devices (both CO2 meters should be available).
4. Click on the appropriate icons to begin measurement of the entering gas stream. Graphs
that show real-time system measurements should appear.
5. In the menu atop the program window, select the “Configure Sensor” option. The
calibrated reading should be set so that the Bypass valve configuration measurement is
equivalent to 0.04% CO2.
[C] Begin the Reaction
1. Rearrange the valves so that the desired reactor receives flow. If Reactor 1 is in
operation, then the Reactor 1 (Platinum) valve configuration should be used. Likewise, if
Reactor 2 is in operation, then the Reactor 2 (Palladium) valve configuration should be
used. (Refer to part [E] for required specific operating conditions.)
2. Monitor the graphs generated by DAS. The level of CO2 should approach steady state
after some time of reaction.
3. Once steady state has been reached, return the apparatus to the Bypass valve
configuration. Allow the CO2 reading to stabilize at the calibrated, standard level.
4. Alter the flow rate of the reactant methane by adjusting the methane knob on the
electronic flow meter to the desired level (do not exceed 5% methane in air). Adjust the
temperature by changing the set point on the front panel of the reactor.
5. Repeat steps 1 through 4 until the desired amount of information is collected.
[D] Shut Down the Reactor
1. Turn off the reactor(s) used in the experiment.
2. Open valve D and close valve E.
3. Close the valves labeled MET and AIR. Close the valves on the compressed air and
methane cylinders.
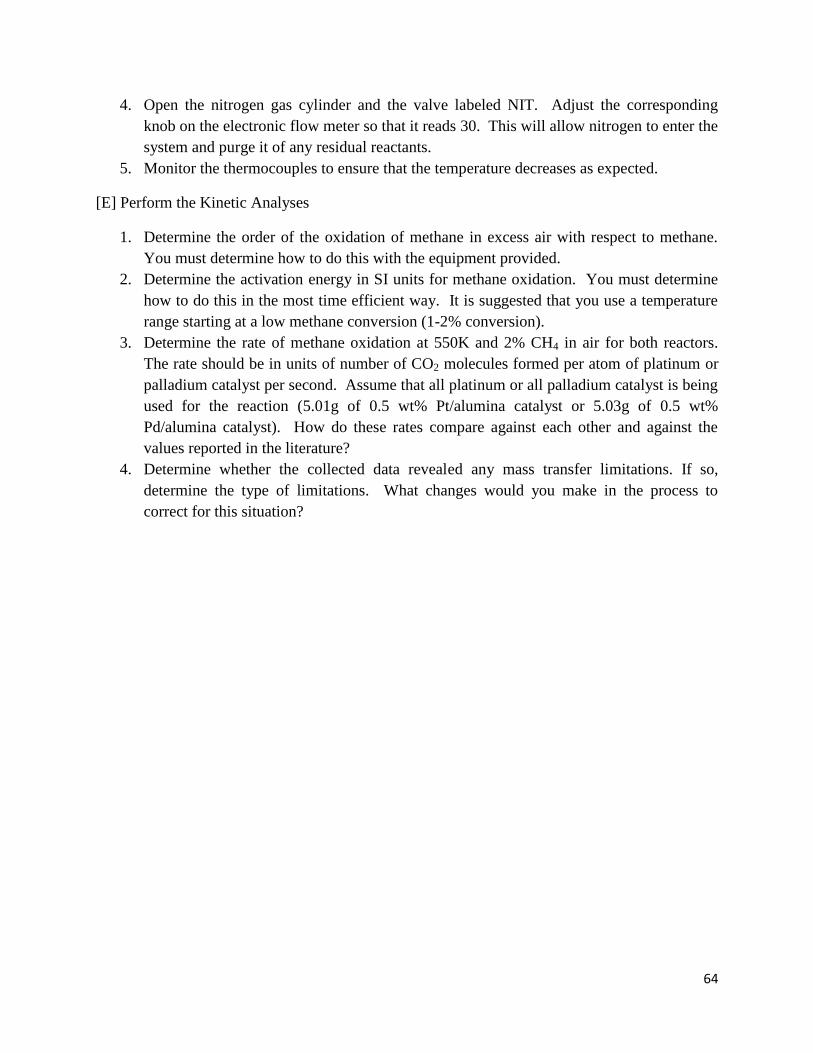
64
4. Open the nitrogen gas cylinder and the valve labeled NIT. Adjust the corresponding
knob on the electronic flow meter so that it reads 30. This will allow nitrogen to enter the
system and purge it of any residual reactants.
5. Monitor the thermocouples to ensure that the temperature decreases as expected.
[E] Perform the Kinetic Analyses
1. Determine the order of the oxidation of methane in excess air with respect to methane.
You must determine how to do this with the equipment provided.
2. Determine the activation energy in SI units for methane oxidation. You must determine
how to do this in the most time efficient way. It is suggested that you use a temperature
range starting at a low methane conversion (1-2% conversion).
3. Determine the rate of methane oxidation at 550K and 2% CH4 in air for both reactors.
The rate should be in units of number of CO2 molecules formed per atom of platinum or
palladium catalyst per second. Assume that all platinum or all palladium catalyst is being
used for the reaction (5.01g of 0.5 wt% Pt/alumina catalyst or 5.03g of 0.5 wt%
Pd/alumina catalyst). How do these rates compare against each other and against the
values reported in the literature?
4. Determine whether the collected data revealed any mass transfer limitations. If so,
determine the type of limitations. What changes would you make in the process to
correct for this situation?
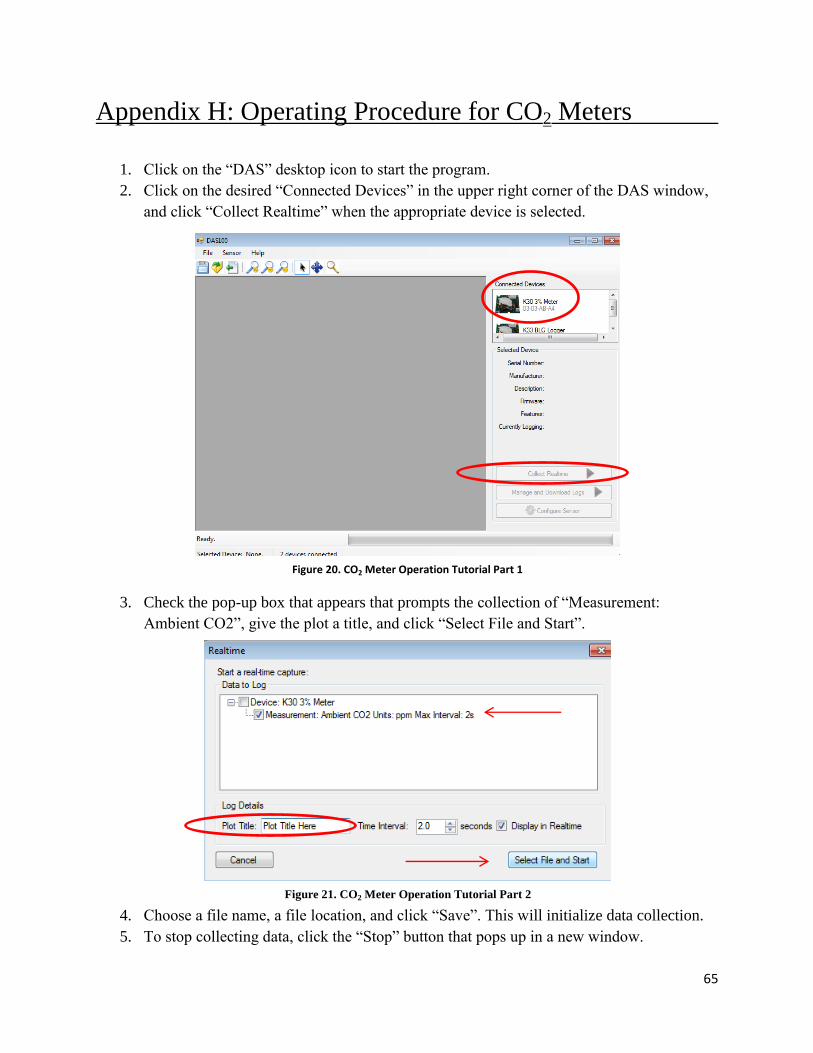
65
Appendix H: Operating Procedure for CO2 Meters
1. Click on the “DAS” desktop icon to start the program.
2. Click on the desired “Connected Devices” in the upper right corner of the DAS window,
and click “Collect Realtime” when the appropriate device is selected.
3. Check the pop-up box that appears that prompts the collection of “Measurement:
Ambient CO2”, give the plot a title, and click “Select ile and Start”.
4. Choose a file name, a file location, and click “Save”. This will initialize data collection.
5. To stop collecting data, click the “Stop” button that pops up in a new window.
Figure 20. CO2 Meter Operation Tutorial Part 1
Figure 21. CO2 Meter Operation Tutorial Part 2
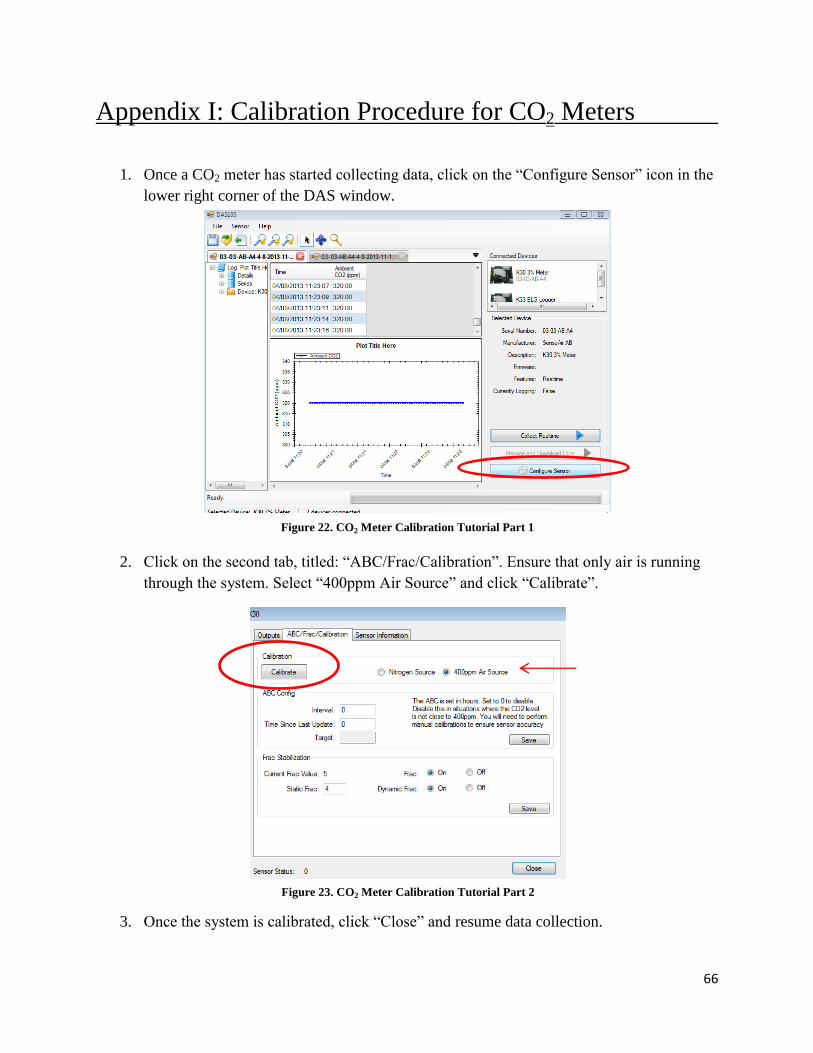
66
Appendix I: Calibration Procedure for CO2 Meters
1. Once a CO2 meter has started collecting data, click on the “Configure Sensor” icon in the
lower right corner of the DAS window.
2. Click on the second tab, titled: “ABC/ rac/Calibration”. nsure that only air is running
through the system. Select “400ppm Air Source” and click “Calibrate”.
3. Once the system is calibrated, click “Close” and resume data collection.
Figure 22. CO2 Meter Calibration Tutorial Part 1
Figure 23. CO2 Meter Calibration Tutorial Part 2