Embed Size (px)
Citation preview

HAL Id: hal-01305689https://hal-mines-paristech.archives-ouvertes.fr/hal-01305689
Submitted on 21 Apr 2016
HAL is a multi-disciplinary open accessarchive for the deposit and dissemination of sci-entific research documents, whether they are pub-lished or not. The documents may come fromteaching and research institutions in France orabroad, or from public or private research centers.
L’archive ouverte pluridisciplinaire HAL, estdestinée au dépôt et à la diffusion de documentsscientifiques de niveau recherche, publiés ou non,émanant des établissements d’enseignement et derecherche français ou étrangers, des laboratoirespublics ou privés.
Water Content of CO 2 rich Mixtures: Measurementsand Modeling using the Cubic-Plus-Association
Equation of StateAntonin Chapoy, Rod Burgass, Alexandre Terrigeol, Christophe Coquelet
To cite this version:Antonin Chapoy, Rod Burgass, Alexandre Terrigeol, Christophe Coquelet. Water Content of CO 2 richMixtures: Measurements and Modeling using the Cubic-Plus-Association Equation of State. Journalof Natural Gas Engineering , John Carroll„ 2016, 1 (13), pp.85-97. �10.7569/JNGE.2015.692505�.�hal-01305689�
1
Water Content of CO2 rich Mixtures: Measurements and
Modeling using the Cubic-Plus-Association Equation of State
Antonin CHAPOY1,3,*
, Rod BURGASS1, Alexandre TERRIGEOL
2 and Christophe
COQUELET3,*
1 Heriot Watt University, Hydrates, Flow Assurance & Phase Equilibria, Institute of
Petroleum Engineering, Edinburgh EH14 4AS, United Kingdom
2 CECA SA, Molecular Sieve business unit, 89, Boulevard National, 92250 La Garenne
Colombes, France
3 MINES ParisTech, PSL research university, CTP-Centre of Thermodynamic of Processes
35, Rue Saint Honoré, 77305 Fontainebleau, France
ABSTRACT
Natural gas is well known as the cleanest fossil fuel. However, it is estimated that more than
40% of the remaining conventional natural gas reserves are deemed to be acidic, i.e.,
containing significant quantities of CO2 and H2S. As the global consumption of natural gas is
expected to steadily grow, the demand will be met by sources such as sour/acid gas fields. In
some specific applications that require cryogenic processes (LNG, NGL recovery), this issue
is commonly addressed upstream of the gas dehydration unit, so that the gas is already sweet
when arriving at the drying section. In the other cases, the effect of the acidic species on the
gas water content is often not properly accounted for, even though an accurate appraisal of the
water content is paramount for the sizing of dehydration units.
In this contribution, the water contents of the ternary system CO2 + CH4 + H2O were
determined for various CO2 to CH4 ratios. New experimental data were obtained using a
Tuneable Diode Laser Spectroscopy (TDLS) setup, with an accuracy of +/- 1%. The Soave-
Redlich-Kwong and the Peng Robinson equations of state combined with the Cubic-Plus
Association were used to estimate water content on CO2 rich gas mixtures.
Key words: Carbon Dioxide; CPA; Equation of state; Methane; Water content; Peng-
Robinson; Soave-Redlich-Kwong.
* Corresponding authors:
E-mail: [email protected]
E-mail: [email protected]

2
1. INTRODUCTION
The consumption of natural gas is expected to steadily grow, and the demand will
increasingly be met by sources such as sour/acid gas fields. This will have an impact on the
whole gas processing chain, and especially on gas dehydration. Accurate assessment of the
influence of acid gases, in particular CO2, on the gas water content, which impacts on the size
of dehydration unit required, is still today incomplete, as publicly available data are scarce.
In the case of a sweet gas, the water content can be calculated by phase equilibria-based
commercial softwares, or estimated using the McKetta and Wehe chart [1]. Water content
assessment is much more challenging when it comes to acid gas. As both pure H2S and CO2
contain more water at saturation than sweet natural gas, their effect on the overall water
content can be very significant.
Several sets of experimental data and charts are available to address the subject. In this regard,
the GPSA Engineering Handbook gives a good overview of the available methods [2].
However and as correctly pointed out by the GPSA, most of these methods apply to a reduced
range of conditions, and/or give discrete information for limited sets of compositions.
Generally speaking, the literature of the past 50 years is poor on the subject. As a
consequence of this, the reliability of the results is very often questionable in terms of
accuracy.
In practice, in most of the cases, the problem mainly concerns CO2, with contents sometimes
up to 30-50%, while the H2S level is generally much lower, and therefore of a very limited
impact compared to CO2. This is the reason why in this article the focus is on the influence of
CO2.
The following “simplified” example illustrates the importance of having a good estimation of
the water content, and its influence on a molecular sieve dehydration unit. In the following
discussion, it is assumed that the gas to be treated has the characteristics listed in Table 1.

3
Under these conditions, if the gas was considered as a sweet gas, and the water content
estimated by the McKetta-Wehe chart, the design of the unit would be based on 690 ppmV
water content (Case 1). Taking into account the influence of CO2, the real water content of the
gas is in fact 770 ppmV, about12% higher (Case 2). The dehydration unit has to meet the
following outlet specifications (Table 2):
Table 2. Dehydration unit specifications
Water content: < 1 ppmV
Pressure drop: < 0.35 bar (end of lifetime)
Lifetime: > 4 years
From this very simplified Process Specification, The impact of the two water contents on the
unit design will be assessed.
Table 3. Dehydration unit design
Case 1
(690 ppmV)
Case 2
(770 ppmV)
# of vessels in adsorption 1 1
Vessel diameter (mm) 2 900 2950
Mole sieve quantity (kg) 11 900 13050
Adsorption time (hrs) 12 12
With an inlet water content of 690 ppmV, a typical design meeting the specification given in
Table 2 would involve 11.9 metric tons of molecular sieve and 12 hours adsorption time
(Table 3). If the design of Case 1 was applied with the water content of Case 2 was, the
additional water content would lead to either one of the following scenario:
Table 1. Gas compositions and
properties
Flow-rate 200 000 Nm3/hr
Pressure 60 Bara
Temperature 25 °C
Composition (mol%):
C1 50 %
CO2 40 %
C2 8 %
C3 2 %

4
- If 12 hours adsorption time and original flow-rate were maintained, the lifetime of
the unit would decrease from 4 years to only 1.5 to 2 years maximum.
- To maintain a 4 years lifetime and 12 hours adsorption time, the flow-rate would
have to be decreased from 200,000 Nm3/hr down to ~180,000 Nm
3/hr.
By taking into account the real water content of the gas, the resulting design to allow for 4
years lifetime at the stated flow-rate would be significantly different. It would involve a
slightly larger vessel diameter, and ~10% more mole sieve (Table 3).
The above example stresses the fact that an incorrect water content assessment can
significantly influence the operation of an existing unit. As mentioned in Terrigeol et al. [4] it
is preferable to use a correlation in order to have a quick indication of the water content of gas
mixtures containing CO2 and CH4.
The aim of this work is to correctly assess the water content in CO2 rich gases, for this
purpose a review of the experimental data will be made. In order to evaluate the
thermodynamic models, new experimental data for water content of binary mixtures of
methane and carbon dioxide were generated.
2. LITERATURE REVIEW
Phase equilibrium data are widely available for the CO2 + CH4, CO2 + H2O and CH4 + H2O
binary systems, however data for the ternary systems to validate the thermodynamic model
are rather limited, in particular water content data are scarce. Sharma [5] and Song and
Kobyashi [6] have measured the water content for the ternary systems. Song and Kobyashi [6]
have measured the water content for a gas mixture composed with 94.69% of CO2 and 5.31%
of CH4. Dhima et al. [7] have measured the solubility of methane and carbon dioxide in water
at 344 K and Quin et al. [8] have measured both liquid and vapour compositions at 324 and
375 K.
5
3. EXPERIMENTAL
3.1 Materials
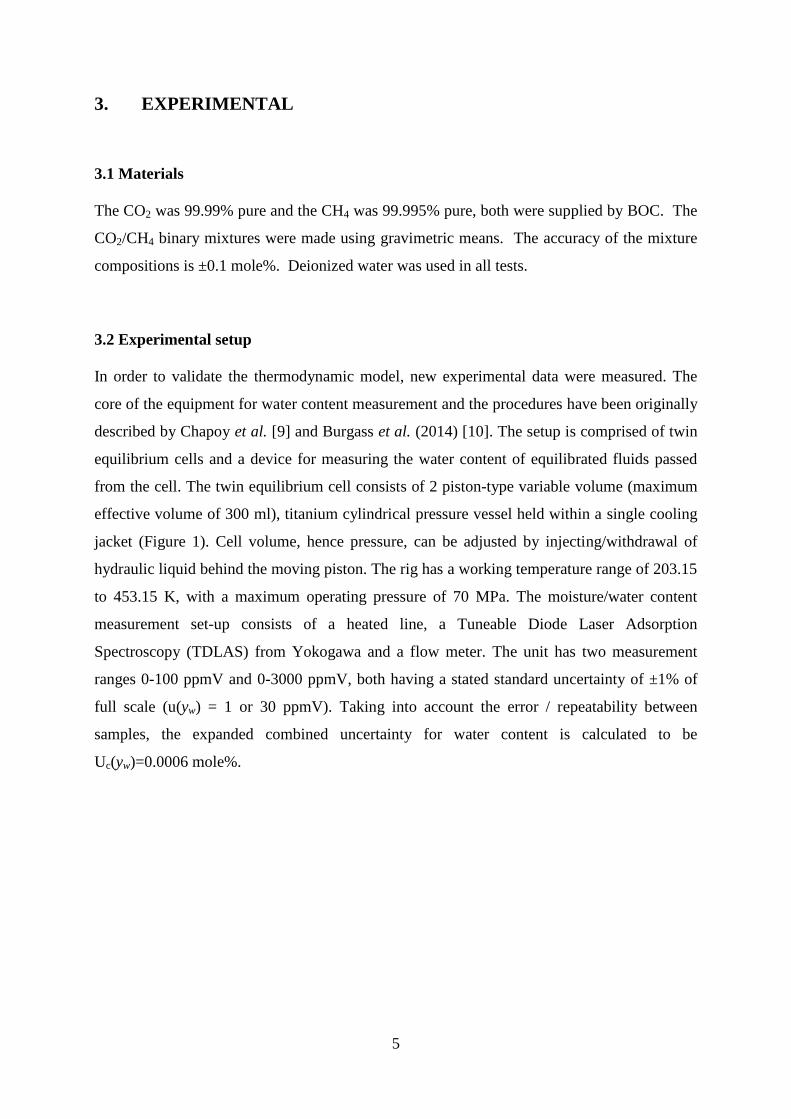
The CO2 was 99.99% pure and the CH4 was 99.995% pure, both were supplied by BOC. The
CO2/CH4 binary mixtures were made using gravimetric means. The accuracy of the mixture
compositions is ±0.1 mole%. Deionized water was used in all tests.
3.2 Experimental setup
In order to validate the thermodynamic model, new experimental data were measured. The
core of the equipment for water content measurement and the procedures have been originally
described by Chapoy et al. [9] and Burgass et al. (2014) [10]. The setup is comprised of twin
equilibrium cells and a device for measuring the water content of equilibrated fluids passed
from the cell. The twin equilibrium cell consists of 2 piston-type variable volume (maximum
effective volume of 300 ml), titanium cylindrical pressure vessel held within a single cooling
jacket (Figure 1). Cell volume, hence pressure, can be adjusted by injecting/withdrawal of
hydraulic liquid behind the moving piston. The rig has a working temperature range of 203.15
to 453.15 K, with a maximum operating pressure of 70 MPa. The moisture/water content
measurement set-up consists of a heated line, a Tuneable Diode Laser Adsorption
Spectroscopy (TDLAS) from Yokogawa and a flow meter. The unit has two measurement
ranges 0-100 ppmV and 0-3000 ppmV, both having a stated standard uncertainty of ±1% of
full scale (u(yw) = 1 or 30 ppmV). Taking into account the error / repeatability between
samples, the expanded combined uncertainty for water content is calculated to be
Uc(yw)=0.0006 mole%.
6
Cooling Fluid out
PRT Pressure
Transducers
Twin Equilibrium Cells
Cooling Fluid in
Piston
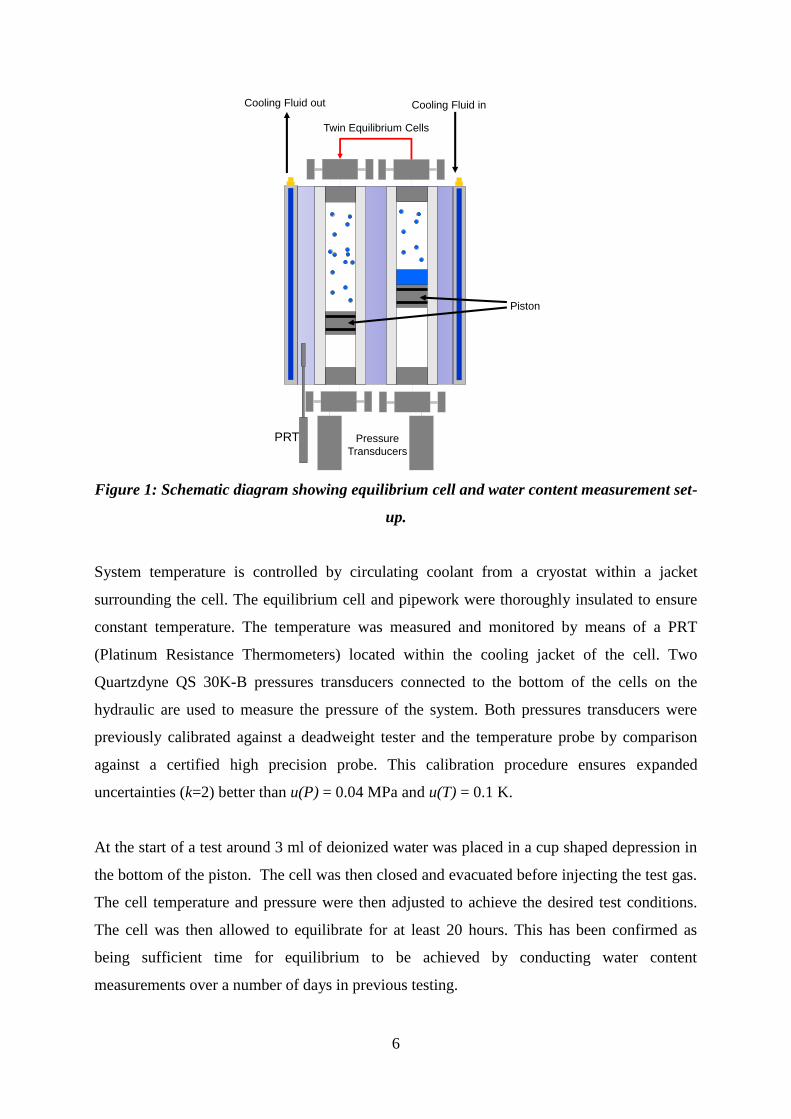
Figure 1: Schematic diagram showing equilibrium cell and water content measurement set-
up.
System temperature is controlled by circulating coolant from a cryostat within a jacket
surrounding the cell. The equilibrium cell and pipework were thoroughly insulated to ensure
constant temperature. The temperature was measured and monitored by means of a PRT
(Platinum Resistance Thermometers) located within the cooling jacket of the cell. Two
Quartzdyne QS 30K-B pressures transducers connected to the bottom of the cells on the
hydraulic are used to measure the pressure of the system. Both pressures transducers were
previously calibrated against a deadweight tester and the temperature probe by comparison
against a certified high precision probe. This calibration procedure ensures expanded
uncertainties (k=2) better than u(P) = 0.04 MPa and u(T) = 0.1 K.
At the start of a test around 3 ml of deionized water was placed in a cup shaped depression in
the bottom of the piston. The cell was then closed and evacuated before injecting the test gas.
The cell temperature and pressure were then adjusted to achieve the desired test conditions.
The cell was then allowed to equilibrate for at least 20 hours. This has been confirmed as
being sufficient time for equilibrium to be achieved by conducting water content
measurements over a number of days in previous testing.

7
3.3 Procedures
Once equilibrium had been achieved the valve at the top of the cell was opened in order to fill
the section of heated line up to the valve prior to the hygrometer at the same time test gas was
introduced into the base of the cell in order to maintain the pressure constant. Following this,
the valve prior (inlet) to the hygrometer was opened sufficiently to achieve a flow rate of
between 0.5 and 1 liter per minute through the hygrometer. The water content reading from
the TDLS analyzer was then monitored until it was stable for at least 10 minutes. This was
then taken as the moisture content of the equilibrated fluid in the cell (i.e., flowing out of the
cell). During sampling the heated line was maintained at a temperature of 433.15 K.
4. THERMODYNAMIC MODELLING – THE PR-CPA
In this work, the models developed by Chapoy et al. [9] and Hajiw et al. used [11-12] have
been used. In summary, the thermodynamic models are based on the uniformity of fugacity of
each component throughout all the phases. The fugacities are calculated using the CPA-EoS
coupled with the original Soave-Redlich and Kwong and the Peng-Robinson EoS [13].
For non-associating compounds, the CPA-EoS reduced to the SRK-EoS or PR EoS. All
parameters for the CPA-SRK can be found in Chapoy et al. [9]. The PR-CPA parameters for
water reported by Hajiw et al. used [11-12] were used in this work. Predictions for the CH4 +
H2O and CO2 + H2O are shown in Figures 2 and 3.
0.1
1
10
0 0.2 0.4 0.6 0.8 1
P/ M
Pa
yw (water content) / mole%
1
10
100
0 10 20 30 40
P/ M
Pa
yw (water content) / mole%
Figure 2. Py, Phase equilibria in the methane + water system at 298.15 K (left) and 423.15 K (right). Black
Lines: Model predictions using the CPA-PR. Grey dashed lines: Model predictions using the CPA-SRK. At

8
298.15 K: () experimental data from [14], () experimental data from [15], () experimental data from
[16]. At about 423 K: () experimental data from [17], () experimental data from [18], () experimental
data from [19].
0
5
10
15
20
25
0 0.001 0.002 0.003 0.004 0.005 0.006 0.007 0.008
P/
MPa
yw (water content) / mole %
0
20
40
60
80
100
120
0 0.05 0.1 0.15 0.2 0.25 0.3
P/
MPa
yw (water content) / mole fraction
Figure 3. Py, Phase equilibria in the carbon dioxide + water system at 298.15 K (left) and
423.15 K (right). Black Lines: Model predictions using the CPA-PR. Grey dashed lines:
Model predictions using the CPA-SRK. Left figure: () experimental data from [20]; ()
[21]; () experimental data from [22]; () experimental data from [23]; () experimental
data from [24]. Right figure :() experimental data from [21]; () experimental data from
[19] ;() experimental data from [25].
The only water content data available for the ternary system are the data presented by Song
and Kobayashi [5]. They have measured the water content in 94.69 mole% CO2 + 5.31 mole
% CH4 system. Their data at 323.15 K are shown in Figure 4 along with the predictions of the
model and literature data for pure CO2 and CH4 at the same temperature.

9
0
5
10
15
20
25
30
0 0.2 0.4 0.6 0.8 1
P/
MPa
yw / mole%
0
5
10
15
20
25
30
0 0.2 0.4 0.6 0.8 1
P/
MPa
yw / mole%
Figure 4. Py, Water content in the CH4, 94.69 mole% CO2 + 5.31 mole % CH4 and CO2 systems at 323.15 K.
Left Figure: Predictions using the CPA-SRK. Right Figure: Predictions using the CPA-PR. Black Lines:
Model predictions for CO2. Dotted black lines: Model predictions CH4. Grey broken lines: Model predictions
for the 94.69 mole% CO2 + 5.31 mole % CH4. ()experimental data [6]; ():experimental data [21] ;():
experimental data [25].
As can be seen in the figure, the models can accurately predict the experimental water content
in the pure fluids with the CPA-SRK superior to the CPA-PR in this case; however the water
content predicted by the model for the ternary is higher than the one experimentally measured
by Song and Kobayashi [6]. It is planned to measure water content for a similar system as the
data for the binary CO2 + water of these authors have been questioned by other researchers [9-
10, 26].
5. RESULTS AND DISCUSSIONS
The new experimental water content measurements for three gas mixtures of CH4 and CO2 at
the different test conditions are shown in Table 4. Low deviations of the new experimental
data set confirm their consistency. Overall the predictions with the CPA-SRK are better than
those made with the CPA-PR (Figure 5). CPA-PR seems to over predict the water content at
these experiment conditions. Looking at the predictions for the binary CO2 and water systems
(Figure 3), it can be seen that higher deviations are generally observed for the CPA-PR,
especially in denser phase.
10
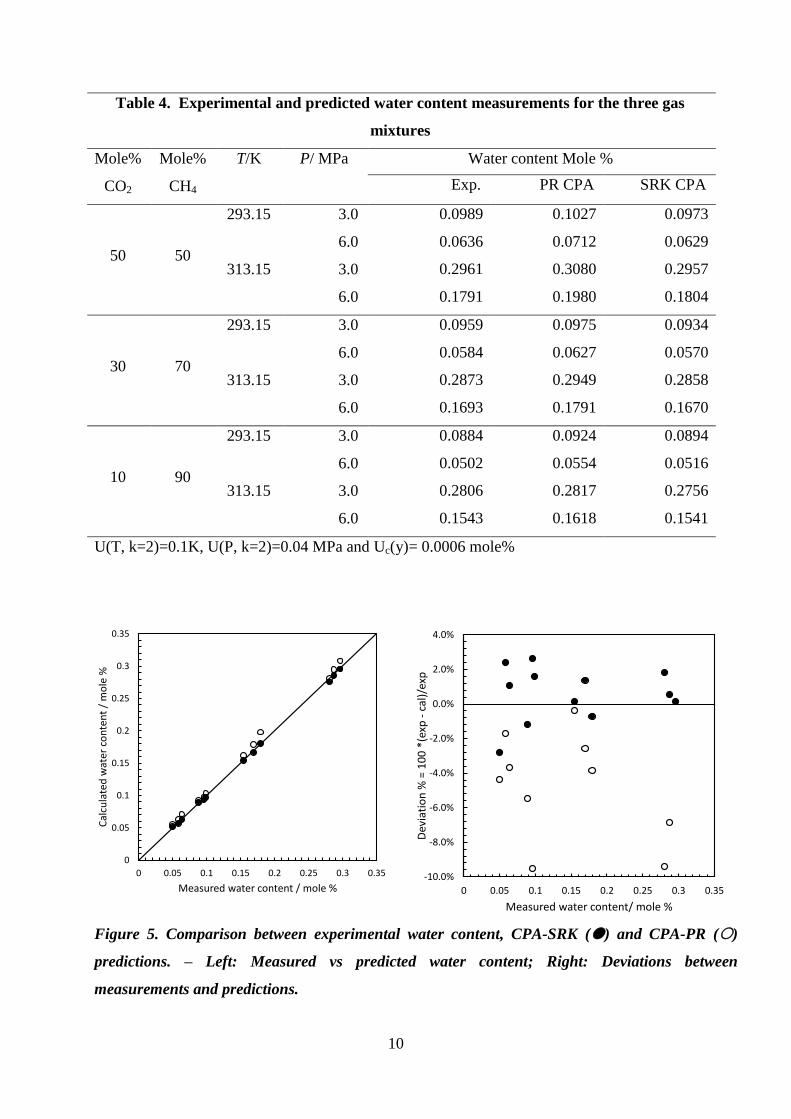
Table 4. Experimental and predicted water content measurements for the three gas
mixtures
Mole%
CO2
Mole%
CH4
T/K P/ MPa Water content Mole %
Exp. PR CPA SRK CPA
50 50
293.15 3.0 0.0989 0.1027 0.0973
6.0 0.0636 0.0712 0.0629
313.15 3.0 0.2961 0.3080 0.2957
6.0 0.1791 0.1980 0.1804
30 70
293.15 3.0 0.0959 0.0975 0.0934
6.0 0.0584 0.0627 0.0570
313.15 3.0 0.2873 0.2949 0.2858
6.0 0.1693 0.1791 0.1670
10 90
293.15 3.0 0.0884 0.0924 0.0894
6.0 0.0502 0.0554 0.0516
313.15 3.0 0.2806 0.2817 0.2756
6.0 0.1543 0.1618 0.1541
U(T, k=2)=0.1K, U(P, k=2)=0.04 MPa and Uc(y)= 0.0006 mole%
0
0.05
0.1
0.15
0.2
0.25
0.3
0.35
0 0.05 0.1 0.15 0.2 0.25 0.3 0.35
Cal
cula
ted
wat
er c
on
ten
t /
mo
le %
Measured water content / mole % -10.0%
-8.0%
-6.0%
-4.0%
-2.0%
0.0%
2.0%
4.0%
0 0.05 0.1 0.15 0.2 0.25 0.3 0.35
Dev
iati
on
% =
10
0 *
(exp
-ca
l)/e
xp
Measured water content/ mole %
Figure 5. Comparison between experimental water content, CPA-SRK () and CPA-PR ()
predictions. – Left: Measured vs predicted water content; Right: Deviations between
measurements and predictions.

11
As can be seen in Figure 5, there is an excellent agreement between the experimental data and
the models.
All the experiments presented herein were in the gas phase. The experimental data follow the
expected trends, i.e.:
- The water content is increasing with temperature at a given pressure (Figures 6-8)
- The water content is decreasing with pressure at a given temperature (Figures 6-8)
- The water content is increasing with the CO2 concentration in the feed gas
(Figures 9-10).
0
0.1
0.2
0.3
0.4
0.5
0.6
283.15 288.15 293.15 298.15 303.15 308.15 313.15 318.15 323.15
y w/
mo
le %
T/ K 0
0.1
0.2
0.3
0.4
0.5
0.6
1 2 3 4 5 6 7 8
y w/
mo
le %
P/ MPa
293.15 K
Figure 6. Predicted (Black lines: CPA-PR; Grey dotted lines: CPA-SRK) and experimental water
content for the 50 mole% CO2 + 50 mole CH4 system – Left: Temperature dependency; Right:
Pressure dependency
0
0.1
0.2
0.3
0.4
0.5
0.6
283.15 288.15 293.15 298.15 303.15 308.15 313.15 318.15 323.15
y w/
mo
le %
T/ K 0
0.1
0.2
0.3
0.4
0.5
0.6
1 2 3 4 5 6 7 8
y w/
mo
le %
P/ MPa
Figure 7. Predicted (Black lines: CPA-PR; Grey dotted lines: CPA-SRK) and experimental water
content for the 30 mole% CO2 + 70 mole CH4 system – Left: Temperature dependency; Right:
Pressure dependency

12
0
0.1
0.2
0.3
0.4
0.5
0.6
283.15 288.15 293.15 298.15 303.15 308.15 313.15 318.15 323.15
y w/
mo
le %
T/ K 0
0.1
0.2
0.3
0.4
0.5
0.6
1 2 3 4 5 6 7 8
y w/
mo
le %
P/ MPa
Figure 8. Predicted (Black lines: CPA-PR; Grey dotted lines: CPA-SRK) and experimental
water content for the 10 mole% CO2 + 90 mole CH4 system – Left: Temperature dependency;
Right: Pressure dependency
0
0.02
0.04
0.06
0.08
0.1
0.12
0.14
0 10 20 30 40 50 60
y w/
mo
le %
zCO2 / mole%
Figure 9: Predicted (Black lines: CPA-PR; Grey dotted lines: CPA-SRK) and experimental
water content at 293.15 K – Effect of CO2 in feed gas

13
0
0.05
0.1
0.15
0.2
0.25
0.3
0.35
0.4
0 20 40 60 80 100
y w/
mo
le %
zCO2 / mole%
Figure 10: Predicted (Black lines: CPA-PR; Grey dotted lines: CPA-SRK) and
experimental water content at 313.15 K – Effect of CO2 in feed gas
CONCLUSION
There is a lack of water content data for multicomponent systems containing carbon dioxide.
New water content of various mixtures composed of CO2 and CH4 were determined at
conditions equivalent to those encountered in industry. Both PR-EoS and SRK-EoS combined
with CPA equations can predict the water content of these mixtures with good accuracy.
There is still a lack of data for these systems at higher pressure, in the liquid or supercritical
regions as well as in the more complex two-phase region. In the future we are planning to fill
these gaps and generate measurements for more complex mixtures including other
hydrocarbons.
Acknowledgements The author would like to thanks Sandy Dunlop administrator of GPA Europe for the
authorization to publish this work originally presented in September 2015 at the GPA Europe
Annual meeting.

14
REFERENCES
[1] J.J. McKetta and A.H. Wehe, Use This Chart for Water Content of Natural Gas,
Petroleum Refiner, 37. 153-154, (1958).
[2] GPSA Engineering Data Book. 13th
Edition, (2012).
[3] A. Terrigeol, Molecular Sieves Contaminants: Effects, Consequences and Mitigation,
GPA Europe Annual meeting, Berlin, (2012).
[4] A. Terrigeol, C. Coquelet and A. Chapoy, Water content Assessment in acid gas, GPA
europe, Annual Conference, Florence, Italy 16th
-18th
September 2015.
[5] S.C. Sharma, Equilibrium Water Content of Gaseous Mixtures, Thesis, The University
of Oklahoma (1969).
[6] K.Y. Song and R. Kobayashi, The Water Content of a CO2-rich Gas Mixture
containing 5.31 mol% Methane along the Three-Phase and Supercritical Conditions, J.
Chem. Eng. Data, 35. 320-322, (1990).
[7] A. Dhima, J.C. de Hemptinne and J. Jose, Solubility of Hydrocarbons and CO2
Mixtures in Water under High Pressure, Ind. Eng. Chem. Res., 38. 3144-3161, (1999).
[8] J. Qin, R.J. Rosenbauer and Z. Duan, Experimental Measurements of Vapor-Liquid
Equilibria of the H2O + CO2 + CH4 Ternary System, J. Chem. Eng. Data, 53. 1246-
1249, (2008).
[9] A. Chapoy, H. Haghighi, R. Burgess and B. Tohidi. On the Phase Behaviour of the
Carbon Dioxide - Water Systems at Low Temperatures: Experimental and Modelling,
J. Chem. Therm., 47, 6-12, (2012).
[10] R. Burgass, A. Chapoy, P. Duchet-Suchaux and B. Tohidi, Experimental water
content measurements of carbon dioxide in equilibrium with hydrates at (223.15 to
263.15) K and (1.0 to 10.0) MPa, J. Chem. Therm., 69. 1-5, (2014).
[11] M. Hajiw, A. Chapoy and C. Coquelet, Hydrocarbons–water phase equilibria
using the CPA equation of state with a group contribution method, Can. J. Chem.
Eng., 93. 432-442, (2015).
[12] M. Hajiw, A. Chapoy, C. Coquelet and G. Lauermann, Prediction of methanol
content in natural gas with the GC-PR-CPA model, J. Nat. Gas Sc. Eng., in press
doi:10.1016/j.jngse.2015.09.021
[13] D. Peng, and D.B. Robinson, New 2-Constant Equation of State. Ind. Eng.
Chem. Fund. 15. 59-64 (1976).

15
[14] M. Rigby and J. M. Prausnitz, Solubility of Water in compressed Nitrogen,
Argon and Methane, J. Phys. Chem. 72, 330-334, (1968).
[15] C. Yokoyama, S. Wakana, G. Kaminishi, and S. Takahashi, Vapor-Liquid
Equilibria in the Methane-Diethylene Glycol-Water System at 298.15 and 323.15 K, J.
Chem. Eng. Data, 33. 330-334, (1988).
[16] A. Chapoy, C. Cocquelet, and D. Richon, Solubility Measurement and
Modeling of Water in the Gas Phase of the Methane/Water Binary System at
Temperatures from 283.15 to 318.15 K and Pressures up to 35 MPa, Fluid Phase
Equilibr. 214. 101-107, (2003).
[17] R. G. Sultanov, V. G. Skripka and A. Y. Namiot Moisture content of methane
at high temperatures methane at high pressures and temperatures (in Russian), Gazov.
Prom. 4. 6-13 (1971).
[18] O. L. Culberson, and J.J. McKetta, Phase Equilibria in Hydrocarbon-Water
Systems III-, The solubility of methane in water at 10000 psia, Jr., Petrol. Trans.
AIME 192, 223-226 (1951).
[19] F. Tabasinejad, R. G.Moore, S. A. Mehta, K. C. Van Fraassen, Y. Barzin, J. A.
Rushing and K. E. Newsham, Water Solubility in Supercritical Methane, Nitrogen,
and Carbon Dioxide: Measurement and Modeling from 422 to 483 K and Pressures
from 3.6 to 134 MPa. Ind. Eng. Chem. Res. 50. 4029–4041, (2011).
[20] R. Wiebe and V.L. Gaddy, Vapor phase composition of the carbon dioxide-
water mixtures at various temperatures and at pressures to 700 atm. J. Am .Chem. Soc.
63. 475-477, (1941).
[21] P.C. Gillespie and G. M. Wilson, Vapor–liquid and liquid–liquid equilibria:
water–methane, water–carbon dioxide, water–hydrogen sulfide, water–n-pentane,
water–methane–n-pentane, Research report RR-48, Gas Processors Association,
Tulsa, (1982).
[22] T. Nakayama, H. Sagara, K. Arai and S. Saito, High pressure liquid-liquid
equilibria for the system of water, ethanol and 1,1-difluoroethane at 323.2 K. Fluid
Phase Equilibria, 38. 109-127, (1987).
[23] M.B. King, A. Mubarak, J.D. Kim and T.R. Bott, The mutual solubilites of
water with supercritical and liquid carbon dioxide. J. Supercrit. Fluids. 5. 296-302
(1992).

16
[24] A. Valtz, A. Chapoy, C. Coquelet, P. Paricaud and D. Richon, D. Vapour -
liquid equilibria in the carbon dioxide – water system, measurement and modelling
from 278.2 to 318.2 K. Fluid Phase Equilibr. 226. 333-344 (2004).
[25] S-X. Hou, G.C. Maitland and J. P. M. Trusler, Measurement and modeling of
the phase behavior of the (carbon dioxide+ water) mixture at temperatures from
298.15 K to 448.15 K. The Journal of Supercritical Fluids. 73. 87-96 (2013).
[26] L. V. Jasperson, J. W. Kang, C. Soo Lee, D. Macklin, P. M. Mathias, R. J.
McDougal, W. G. Rho, and D. VonNiederhausern, Experimental Determination of the
Equilibrium Water Content of CO2 at High Pressure and Low Temperature. J. Chem.
Eng. Data. 60. 2674-2683 (2015).