Embed Size (px)
Citation preview

Water atomization in spray nozzles
Division of Fluid Mechanics

Contents
Introduction
Techniques used in
STAR-CCM+
Case definition
Nozzle description
Results
Conclusions

General facts about
Epsilon
1 500 employees and
10000 independent collaborators
and specialists in different
networks
23 locations
Local development centers
A leading supplier of CFD and
FEM services in the Nordic
countries

Introduction
Why study primary atomization?
• In STAR-CCM+ the pressure
swirl injector present the only
choice for primary break up
analysis. What about other
types of spray nozzles with
non conical shape.
When modeling sprays you need
to have knowledge about droplet
and velocity distribution for the
specific nozzle in order to set
injector properties.

Spray nozzle
The water nozzle 1/4MEG1506
Spray data (droplet size)
Minimum droplet size: 80 µm
Maximum droplet size: 500 µm
Mean droplet size: 123 µm
Spray nozzle volume
Techniques used in STAR-CCM+
Geometry handling through
imported parts for improvìng
productivity
Trimmed mesh
Refinement boxes for resolving
the water fluid
Imported parts for definition of non
regular shapes for reducing the
cell count
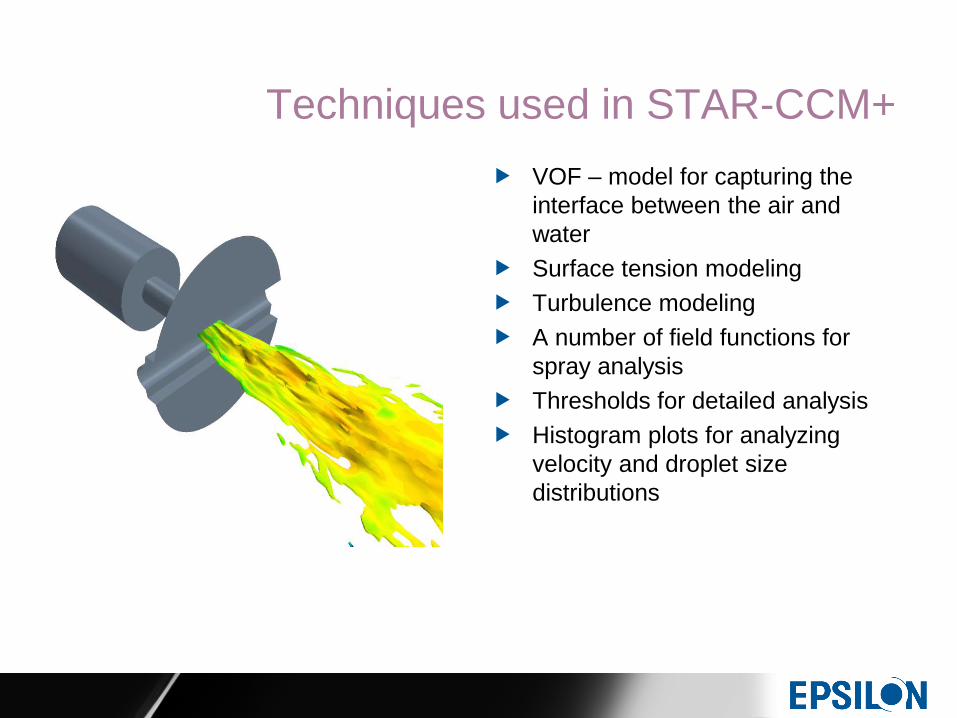
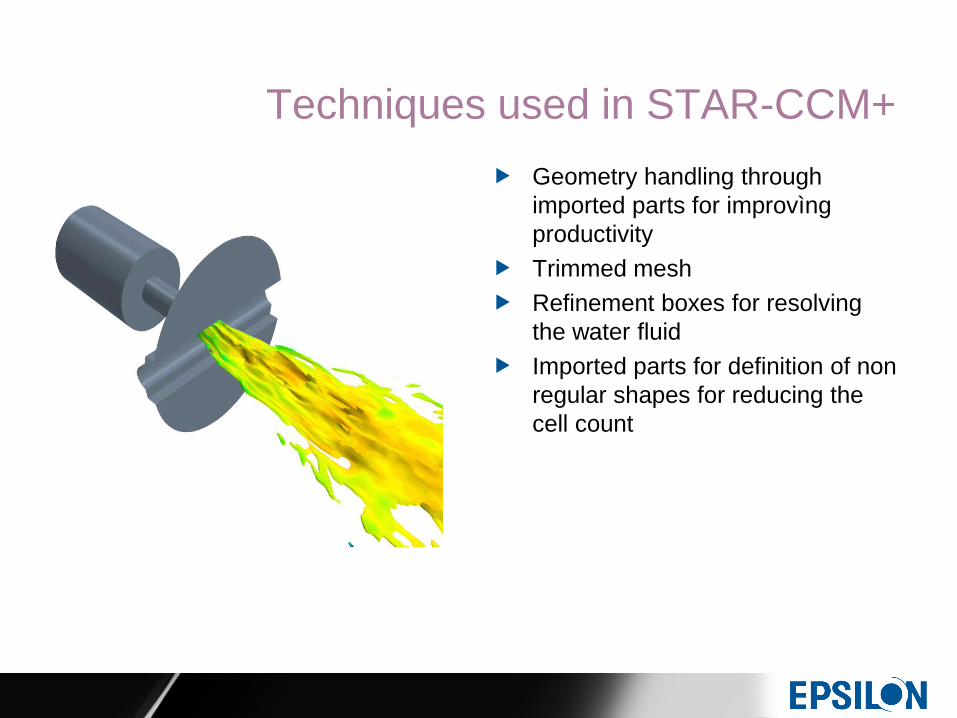
Techniques used in STAR-CCM+
VOF – model for capturing the
interface between the air and
water
Surface tension modeling
Turbulence modeling
A number of field functions for
spray analysis
Thresholds for detailed analysis
Histogram plots for analyzing
velocity and droplet size
distributions

The image to the left shows the
VOF-interface together with
velocity vectors
The velocity vectors are posted
on the threshold for the water
The vectors indicate the
velocity distribution and the
direction of the velocity
Typical results Velocity

The histogram to the left shows
the calculated velocity
distribution obtained from the
VOF-simulation.
The data from the histogram
will be used for implementing
the velocity distribution in the
injector of the Lagrangian
phase.
Typical results Velocity

The images to the left shows
the calculated droplet size in a
the VOF threshold after the
secondary break up.
The droplet size is estimated
by using force balances on
the VOF-interface.
The final droplet diameter is in
the range of 90 – 110
microns.
Typical results Droplet size

The histogram to the left
shows the droplet size
distribution for the threshold
shown on the previous slide.
The mean droplet size
corresponds well to the
experimental value of 123
microns.
The resulting distribution is in
the injector definition of the
Lagrangian phase.
Typical results Droplet size

Conclusions
STAR-CCM+ provides an easy to
use frame work for analyzing the
atomization process.
The usage of thresholds,
histograms and field function
renders the whole process to be
carried out within STAR-CCM+.
The results are in good agreement
with experimental data and show
that this method may be used
when experimental data is not
available.

Room for improvement
Under specific conditions or
demands on resolution of the
VOF-interface an explicit
numerical scheme would be
desired.
Enhance the capability of adding
user coding in STAR-CCM+ to the
level of STAR-CD. This would
improve the capability of adding
custom models into STAR-CCM+
without the need of using JAVA.