Embed Size (px)
Citation preview
Atomization and Sprays,19(9):885–903, 2009
ASSESSMENT OF ATOMIZATION MODELSFOR DIESEL ENGINE SIMULATIONS
S. Som and S. K. AggarwalDepartment of Mechanical and Industrial Engineering, University of Illinois at Chicago,842 West Taylor Street, Chicago, IL 60607-7022 USA
Original Manuscript Submitted: 3/17/2009; Final Draft Received: 9/3/2009
Liquid fuel injection and atomization have a significant influence on the combustion and emission characteristicsof diesel engines. Using x-ray radiography, it is possible to obtain quantitative and time-resolved data inthe primary breakup region close to the injector nozzle. However, most previous studies on model validationshave employed optical measurements that are not applicablein this dense spray region. In the present study,atomization models, based on Kelvin-Helmholtz and Rayleigh-Taylor instabilities, are extensively validated usingx-ray and optical measurements for non-evaporating sprays, as well as detailed measurements for evaporatingsprays. The data include spray penetration, axial velocity, liquid mass distribution, cone angle, Sauter meandiameter, and vapor penetration. Simulations are performed using a computational fluid dynamics (CFD) code“CONVERGE,” which employs an innovative grid generation technique, and state-of-the-art spray models.Postprocessing tools are developed to facilitate a detailed comparison of predictions with x-ray and opticalmeasurements. The effect of rate of injection uncertainties on spray evolution is also quantified. Althoughthe model globally reproduced the experimentally observedtrends and the effects of various parameters onatomization and spray characteristics, it underpredictedspray dispersion, especially for non-evaporating sprays,indicating the need for further model development. In addition, the model could not capture the experimentaltrends in terms of the effects of nozzle orifice geometry on spray development, implying that effects of cavitationand turbulence generated inside the injector need to be included in the model.
INTRODUCTION
Combustion and emission characteristics of dieselengines are known to be significantly influencedby fuel injection and atomization characteristics(Lefebvre, 1989; Wang et al., 2003). The fuelinjection process involves extremely high pressureand high-speed flow through an orifice with adiameter on the order of 100µm. It is alsostrongly influenced by flow dynamics insidethe injector, and is thus highly transient with acharacteristics time scale on the order of 0.01 ms,since the entire injection event lasts 1–2 ms. Theprimary breakup process is not well understood atpresent. It occurs in a highly dense spray region
within a short distance from the nozzle exit,and is characterized by complex two-phaseflow with a wide range of temporal and spatialscales. It is known to be caused by aerodynamicdisturbances induced by Kelvin-Helmholtz (KH)and Rayleigh-Taylor (RT) instabilities (Reitz andDiwakar, 1987; Reitz, 1987; Patterson and Reitz,1998; Beale and Reitz, 1999), but also stronglyinfluenced by cavitation and turbulence from insidethe injector (Arcoumanis and Gavaises, 1998; Huhand Gosman, 1991; Payri et al., 2004; Blessing etal., 2003; Soteriou et al., 2006; Som et al., 2009).Due to the complexity of flows associated with theinjection and atomization processes, it has beenvery challenging to tract these flows theoretically
This work has been supported by the U.S. Department of EnergyOffice of Vehicle Technology under themanagement of Gurpreet Singh. Many useful discussions withAnita Ramirez at UIC, and Doug Longman,Chris Powell, Alan Kastengren, and Essam El-Hannouny at Argonne National Laboratory are greatly appreciated.Correspondence concerning this article should be addressed to S. K. Aggarwal, Department of Mechanical andIndustrial Engineering, University of Illinois at Chicago, 842 West Taylor Street, Chicago, IL 60607-7022 USA;e-mail: [email protected]–5110/09/35.00c© 2009 by Begell House, Inc.
885

886 S. SOM AND S. K. AGGARWAL
or experimentally, and to develop reliable physicalmodels for simulations.
Measurements of these flows inside the injectorand in the optically dense near-nozzle region havebeen extremely difficult due to the complex geome-try and small temporal and spatial scales associatedwith these flows. Optical methods have generallybeen used to characterize the atomization and va-porization processes in diesel engines (Wang et al.,2003; Siebers, 1998; Naber and Siebers, 1996) andvalidate the spray models (Reitz, 1987; Pattersonand Reitz, 1998; Senecal et al., 2003). Such meth-ods have provided valuable information about theglobal spray behavior (spray penetration, cone an-gle, etc.) as well as spray data far downstream fromthe nozzle. However, they have intrinsic limitationsin the near-nozzle region, where the light is scat-tered by the dense spray, causing measurements tobe ineffective until far downstream from the noz-zle. In recent years, new techniques, such as x-rayradiography (Wang, 2005; Yue et al., 2001), phasecontrast imaging (Lee et al., 2005), and ballisticimaging (Linne et al., 2006), have been developed,which are capable of characterizing flows in theinjection and primary breakup region. For instance,the use of x-ray radiography technique to charac-terize the primary breakup region is fairly well es-tablished (Wang, 2005). Since the main interactionbetween the spray and x-rays is absorption, ratherthan scattering, the technique can provide tempo-rally and spatially resolved fuel mass distributionin the near-nozzle region, permitting analysis thatcannot be performed using optical spray data.
Theoretical and computational studies of theseflows have been just as challenging due to thecomplex geometry and multiphysics and multiscalephenomena associated with these flows. Two ba-sic approaches have been pursued for simulatingthese flows. One follows a first-principal approach,whereby the governing equations for the two flu-ids are numerically solved without any approxi-mations. Here, an Eulerian-Eulerian methodology(Blokkeel et al., 2003) using a DNS algorithm(Gorokhovski and Herrmann, 2008) along withsurface tracking, such as volume of fluid (Hirtand Nichols, 1981) and level set (Sussman et al.,1994; Sussman and Puckett, 2000) methods, aregenerally employed. While this approach is capa-
ble of providing details of the breakup processand spray structure in idealized configurations, ithas computational limitations for simulating re-alistic diesel sprays due to the requirements ofresolving the wide spectrum of length and timescales. The second approach follows an Eulerian-Lagrangian methodology (Amsden et al., 1989)whereby the gas-phase equations are solved us-ing RANS (Reynolds-averaged Navier-Stokes) orLES (large eddy simulation) methods, while thedispersed phase is solved using a Lagrangian for-mulation, which tracks individual droplet parcels,along with an appropriate atomization model. Theatomization models used in this approach can beclassified into two categories. The first categoryis based on the KH and RT analysis (Reitz andDiwakar, 1987; Reitz, 1987; Patterson and Reitz,1998), while the second is based on the Tayloranalogy breakup (TAB) concept (O’Rourke andAmsden, 1987; Tanner, 2003). One shortcomingof the Eulerian-Lagrangian approach is that theminimum Eulerian grid size is limited by the ba-sic Lagrangian spray assumption of void fractionwithin a computational grid being close to unity.However, this approach using the KH-RT atom-ization models is well established, and has beenwidely employed for diesel engine simulations forover 20 years, since it is computationally efficientand reproduces the global spray behavior reason-ably well. Moreover, several investigations haveprovided validations for this approach using experi-mental data.
The objective of the present study is to per-form a comprehensive assessment of the atomiza-tion models, based on KH-RT instabilities, underdiesel engine conditions using both optical and x-ray radiography measurements. While the opticaldata has been employed in previous model vali-dation studies (Patterson and Reitz, 1998; Bealeand Reitz, 1999), to the best of our knowledge,detailed x-ray measurements, including rate ofinjection (ROI) profile and liquid mass distribu-tion in the optically dense region near the noz-zle, have not been used in previous investigations.We employ the recent x-ray radiography data fornon-evaporating sprays reported by Ramirez et al.(2008) for a HEUI 315B production injector underdiesel-like ambient density conditions, and evaluate

ASSESSMENT OF ATOMIZATION MODELS FOR DIESEL ENGINE SIMULATIONS 887
the primary breakup model for a range of ambi-ent conditions and injection parameters. The ROIprofile measured using two different techniques(Ramirez et al., 2008) has been employed to exam-ine the effect of boundary conditions. Since evap-orating sprays are more representative of realisticdiesel engine conditions, we also use the extensiveevaporating spray data reported by Siebers (1998)and Naber and Siebers (1996) for further modelvalidation.
Another objective is to examine the effect ofnozzle orifice geometry (i.e., hydrogrinding andconicity) on the atomization and spray behavior.This is motivated by the consideration that atom-ization and spray development are strongly influ-enced by cavitation and turbulence levels from in-side the injector (Arcoumanis and Gavaises, 1998;Huh and Gosman, 1991). Because the KH-RTmodel does not account for these effects, it pro-vides further assessment of the primary breakupmodel. Since there are no experimental data avail-able with respect to cavitation and turbulence lev-els for the HEUI 315B injector nozzle, we stati-cally coupled the injector flow simulations (Somet al. 2010) with the spray simulations in order toprovide boundary conditions for the latter. Finally,the effects of important numerical parameters, i.e.,the grid size and the number of droplet parcelsused to represent spray, on simulations are char-acterized, since some previous studies (Abani etal., 2008a; Abraham, 1997; Iyer and Abraham,1997) have demonstrated that the computed spraycharacteristics are strongly influenced by these pa-rameters.
The paper first provides an overview of the non-evaporating and evaporating spray data used forthe assessment of spray models, followed by adescription of the physical-numerical model. Re-sults concerning the assessment of spray models,particularly the primary breakup (KH) model, arediscussed and analyzed in the next section. Defi-ciencies in the primary breakup model are iden-tified. The effect of the injector nozzle geometryon the spray tip penetration and the effects ofimportant numerical parameters on the predictedspray development are discussed in the followingtwo sections. Conclusions are presented in the lastsection.
NON-EVAPORATING AND EVAPORATINGSPRAY DATA USED FOR MODELASSESSMENT
Both non-evaporating and evaporating spray dataare used for the assessment of spray models. Thenon-evaporating spray data include x-ray radiog-raphy measurements performed at the AdvancedPhoton Source (APS) at Argonne National Labora-tory (ANL) (Ramırez et al., 2008) as well as opti-cal measurements reported by Margot et al. (2008),while the evaporating spray data are from the mea-surements performed at Sandia National Labora-tory (Siebers, 1998; Naber and Siebers, 1996). Testconditions for these three data sets are summarizedin Tables 1–3, respectively.
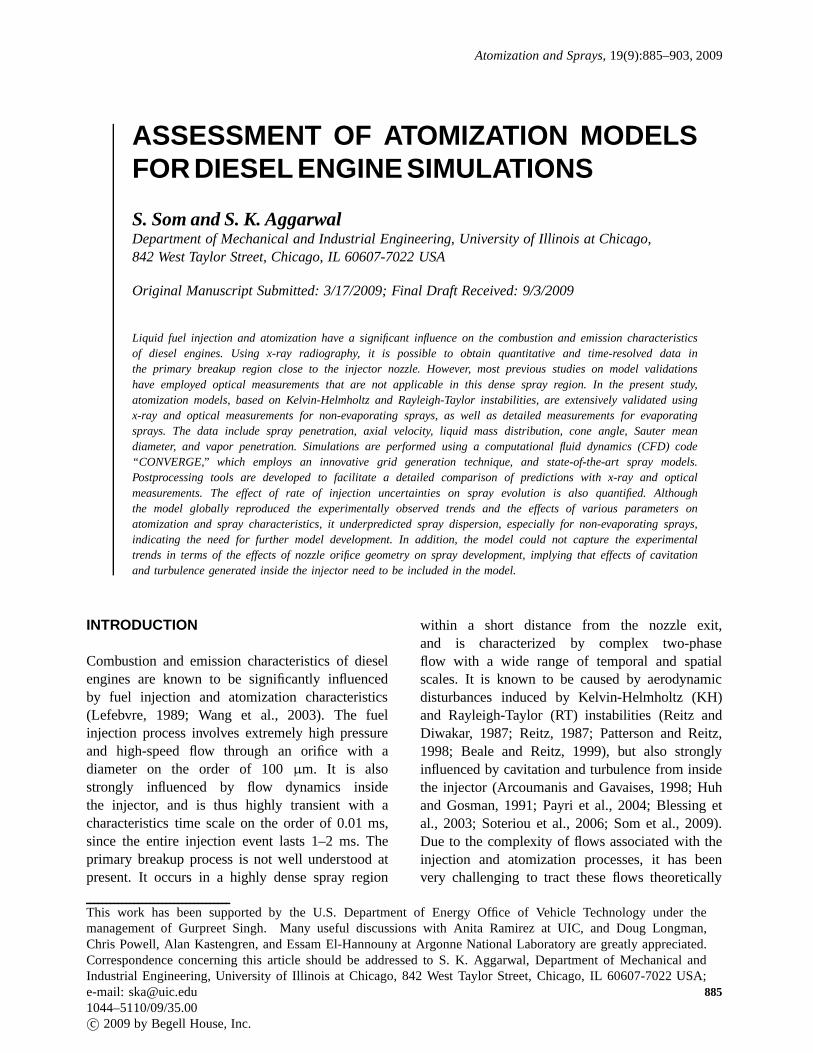
The x-ray radiography technique is capable ofproviding detailed spray structure in the dense re-gion near the nozzle exit with high spatial andtemporal resolution, and is therefore highly suitedfor assessing the primary breakup models. Previ-ous studies (Powell et al., 2001) reported mea-surements using this technique for single-hole re-search nozzles injecting into chamber pressureslower than those typical of diesel engines. How-ever, Ramırez et al. (2008) performed x-ray ra-diography measurements to characterize a singleplume from a full-production multihole nozzle un-der enginelike ambient densities. Their data, whichincluded liquid penetration and mass distributionin the dense spray region, are used for a detailedmodel validation. Rate of Injection (ROI) measure-ments for the HEUI system reported by Ramirezet al. (2008) are for all six orifices. This measuredROI from the Bosch rate meter led to gross un-derprediction of spray penetration (Ramirez et al.,2008); the values were∼50% lower than that mea-sured by the x-ray radiography technique. Hence,the initial ROI from x-ray data was combinedwith the steady-state ROI from the Bosch meterto construct an injection rate for the duration ofinjection. The total mass injected through the sin-gle hole was taken as one-sixth of the total massinjected. The hybrid ROI profile used as an inputfor the numerical model is shown in Fig. 1a. Theregions obtained from the x-ray and rate meter areindicated in the plot. Figure 1b plots the rate ofinjection as measured from x-ray data for differ-

888 S. SOM AND S. K. AGGARWAL
Table 1 Conditions for Non-evaporating Spray Experiments Using X-ray Radiography (Ramırez et al., 2008)
Parameter QuantityInjection system Caterpillar HEUI 315BNumber of orifices 6Orifice diameter [µm] 169 withL/D = 4.412Pressure intensification ratio 6.6Fill gas Nitrogen (N2)
Chamber density [kg/m3] 34.13Fuel Viscor and cerium blendFuel density [kg/m3] 865.4Fuel temperature [C] 40Fuel injection quantity [mm3/stroke] 100Oil rail pressure [MPa] Case 1: 17 Case 2: 21Peak injection pressure [bar] 1100 1350Calculated discharge coefficient Case 1: 0.82 Case 2: 0.81
Table 2 Test Conditions for Non-evaporating Spray Experiments Using Optical Techniques (Margot et al., 2008)
Injection system Common railNumber of orifices 7Orifice diameter 140µmInjection pressure [bar] 800Chamber temperature [K] 298Fuel temperature [K] 363Fill gas Case a: N2 Case b: SF6Chamber density [kg/m3] Case a: 24 Case b: 16.5
Table 3 Test Conditions for Evaporating Spray Experiments Using Optical Techniques (Siebers, 1998; Naber andSiebers, 1996)
Injection system Detroit diesel, common railNumber of orifices 1Orifice diameter 100–500µm L/D = 4.2Injection pressure [bar] 400–1500Fill gas N2, CO2, H2OChamber density [kg/m3] 3.3–60Chamber temperature [K] 700–1300Fuel temperature [K] 375–440Measured discharge coefficient0.78–0.84
ent rail pressures along with the respective linearfits.
As stated earlier, the evaporating spray dataused for model assessment are from the mea-surements of Siebers (1998) and Naber andSiebers (1996), who performed extensive experi-
ments under diesel-like conditions in a constant-volume chamber, and reported liquid length, liq-uid penetration, and vapor penetration for a widerange of injection pressure, orifice diameter, am-bient gas conditions, fuel volatility, and tempera-ture.
ASSESSMENT OF ATOMIZATION MODELS FOR DIESEL ENGINE SIMULATIONS 889
Fig. 1 (a) Hybrid ROI profile for a single orifice used for input in numerical simulation and (b) rate of injection asmeasured from x-ray data for different rail pressures alongwith the respective linear fits
PHYSICAL-NUMERICAL MODEL
The physical-numerical model is based on anEulerian-Lagrangian description of the two-phaseprocesses. The gas-phase flow field is describedusing the Favre-Averaged Navier-Stokes equationsin conjunction with the RNGk − ε turbulencemodel, which includes source terms to account forthe effects of dispersed phase on gas-phase tur-bulence. These equations are solved using a finitevolume solver. Simulations are performed using aCFD code “CONVERGE” (Senecal et al., 2003,2007; Richards et al., 2008), which employs aninnovative modified cut-cell Cartesian method forgrid generation. The grid is generated internallyto the code at run time. For all simulations, thebase grid size was fixed to 4 mm. In order toresolve the flow field near the injector, a fixed gridembedding was employed such that the minimumgrid size was 0.5 mm. Apart from this region, itis rather difficult to determine where a refined gridis desired. Hence, three levels of adaptive mesh re-finement were employed for the velocity field suchthat the minimum grid size was 0.5 mm. It shouldbe noted that this grid size is still about 2.5 timeslarger than the nozzle diameter (169µm). In orderto match the spray chamber geometry, a cylindricalgeometry of 100 mm in diameter and 100 mm inlength was generated for evaporating sprays. Forthe non-evaporating sprays, a cylindrical geome-try of 50 mm in diameter and 200 mm in length
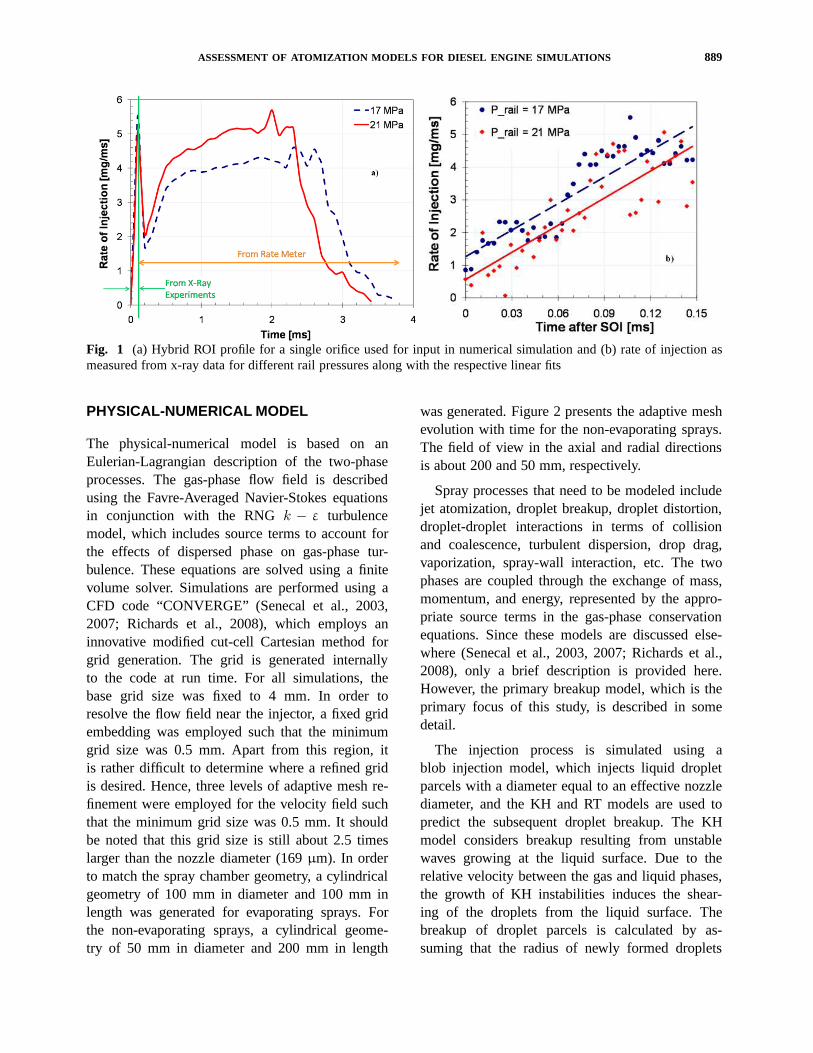
was generated. Figure 2 presents the adaptive meshevolution with time for the non-evaporating sprays.The field of view in the axial and radial directionsis about 200 and 50 mm, respectively.
Spray processes that need to be modeled includejet atomization, droplet breakup, droplet distortion,droplet-droplet interactions in terms of collisionand coalescence, turbulent dispersion, drop drag,vaporization, spray-wall interaction, etc. The twophases are coupled through the exchange of mass,momentum, and energy, represented by the appro-priate source terms in the gas-phase conservationequations. Since these models are discussed else-where (Senecal et al., 2003, 2007; Richards et al.,2008), only a brief description is provided here.However, the primary breakup model, which is theprimary focus of this study, is described in somedetail.
The injection process is simulated using ablob injection model, which injects liquid dropletparcels with a diameter equal to an effective nozzlediameter, and the KH and RT models are used topredict the subsequent droplet breakup. The KHmodel considers breakup resulting from unstablewaves growing at the liquid surface. Due to therelative velocity between the gas and liquid phases,the growth of KH instabilities induces the shear-ing of the droplets from the liquid surface. Thebreakup of droplet parcels is calculated by as-suming that the radius of newly formed droplets
890 S. SOM AND S. K. AGGARWAL
a) 0.5 ms
b) 1.0 ms
c) 2.0 ms
Fig. 2 Grid generated in CONVERGE at different times during the simulation for non-evaporating sprays describedin Table 1. The field of view in the axial and radial direction is about 200 and 50 mm, respectively
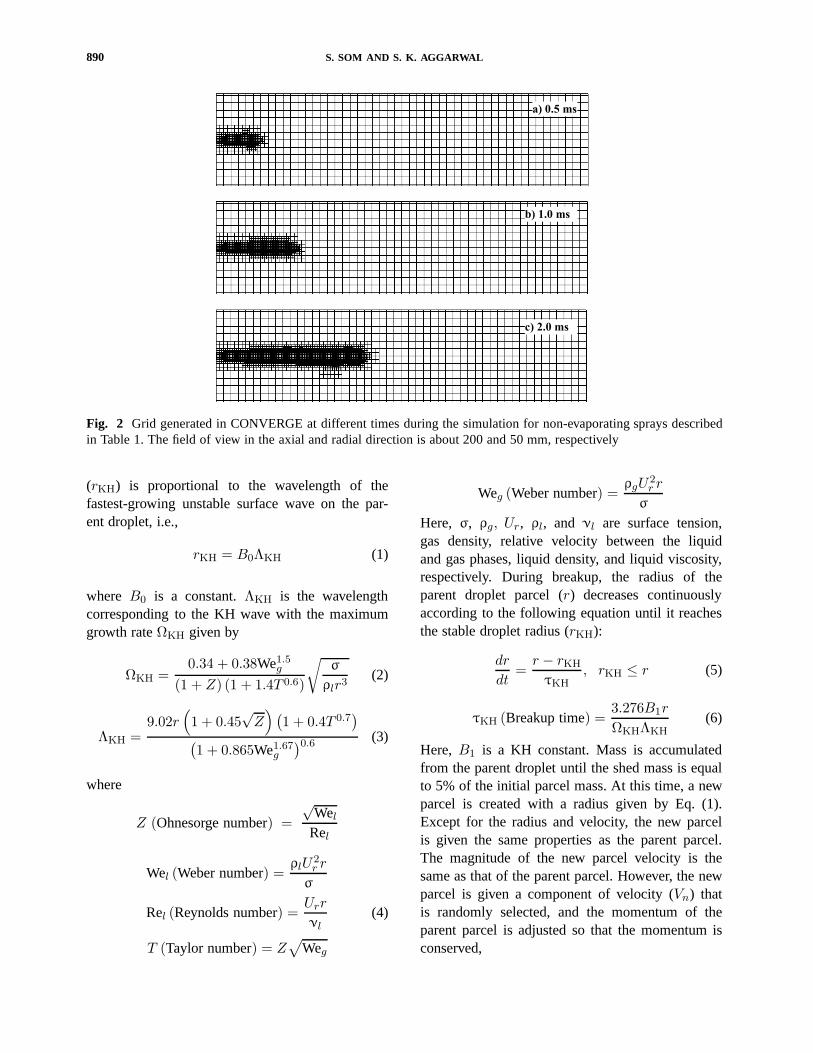
(rKH) is proportional to the wavelength of thefastest-growing unstable surface wave on the par-ent droplet, i.e.,
rKH = B0ΛKH (1)
where B0 is a constant.ΛKH is the wavelengthcorresponding to the KH wave with the maximumgrowth rateΩKH given by
ΩKH =0.34 + 0.38We1.5
g
(1 + Z) (1 + 1.4T 0.6)
√
σ
ρlr3
(2)
ΛKH =9.02r
(
1 + 0.45√
Z)
(
1 + 0.4T 0.7)
(
1 + 0.865We1.67g
)0.6(3)
where
Z (Ohnesorge number) =
√Wel
Rel
Wel (Weber number) =ρlU
2r r
σ
Rel (Reynolds number) =Urr
νl
(4)
T (Taylor number) = Z√
Weg
Weg (Weber number) =ρgU
2r r
σ
Here, σ, ρg, Ur, ρl, and νl are surface tension,gas density, relative velocity between the liquidand gas phases, liquid density, and liquid viscosity,respectively. During breakup, the radius of theparent droplet parcel (r) decreases continuouslyaccording to the following equation until it reachesthe stable droplet radius (rKH):
dr
dt=
r − rKH
τKH
, rKH ≤ r (5)
τKH (Breakup time) =3.276B1r
ΩKHΛKH
(6)
Here, B1 is a KH constant. Mass is accumulatedfrom the parent droplet until the shed mass is equalto 5% of the initial parcel mass. At this time, a newparcel is created with a radius given by Eq. (1).Except for the radius and velocity, the new parcelis given the same properties as the parent parcel.The magnitude of the new parcel velocity is thesame as that of the parent parcel. However, the newparcel is given a component of velocity (Vn) thatis randomly selected, and the momentum of theparent parcel is adjusted so that the momentum isconserved,
ASSESSMENT OF ATOMIZATION MODELS FOR DIESEL ENGINE SIMULATIONS 891
Vn = C1ΩKHΛKH (7)
whereC1 = 0.188, as implemented by several otherresearchers (Beale and Reitz, 1999; Senecal et al.,2007; Richards et al., 2008).
The child droplets undergo secondary breakupdue to the competing effects of the KH and RTmodels. A breakup length (Beale and Reitz, 1999)is employed such that the KH model is employedfor primary breakup in the breakup length region,whereas the KH and RT models compete to breakup the droplet outside the breakup length. Themodel constants used in this study are listed inTable 4. It should be noted that for validation usingx-ray radiography data, only the KH model wasincorporated since the experimental results wereobtained for the near-nozzle region. However, forglobal spray validation under evaporating condi-tions, both the KH and RT models were usedsince further downstream secondary breakup playsa crucial role in spray development (Reitz, 1987;Patterson and Reitz, 1998).
Droplet collisions are based on the NTC (notime counter) algorithm (Schmidt and Rutland,2000). In the O’Rourke collision model (Ams-den et al., 1989), the computation cost scales withthe square of the number of parcels injected (Np),while it scales linearly withNp in the NTC col-lision model. Once collision occurs, the outcomesof the collision are predicted as bouncing stretch-ing, reflexive separation, or coalescence (Post andAbraham, 2002). A single-component droplet evap-oration model (Amsden et al., 1989) based onthe Frossling correlation is used. A dynamic dragmodel is used that postulates that the drag coef-ficient is dependent on the shape of the droplet.An initially spherical droplet distorts significantlywhen the Weber number is large. The shape canvary between a sphere and a disk, for which thedrag coefficient is significantly higher than that fora sphere. This dynamic drop model accounts forthe effects of drop distortion, linearly varying be-tween the drag of a sphere and a disk (Liu et al.,1993). Liquid-gas coupling is performed using thenearest-node approach (Richards et al., 2008). Theeffects of turbulence on droplet dynamics is in-cluded using a standard turbulent dispersion model(Amsden et al., 1989).
RESULTS AND DISCUSSION
Validations for Non-evaporating Sprays
Figure 3a presents the predicted and measured tem-poral evolution of liquid penetration for the twonon-evaporating spray cases listed in Table 1. Asindicated in this table, the two cases correspondto rail pressures of 17 and 21 MPa, or injectionpressures of 112.2 and 138.6 MPa, respectively.The penetration data was available up to 0.2 msfrom the start of injection (SOI). In simulations,the liquid penetration at a particular instant wascalculated by locating the axial position that en-compasses 97% of the total injected mass until thattime. For both rail pressures, there is a slow pen-etration region up to 0.1 ms, followed by a fasterpenetration region up to 0.2 ms, where penetra-tion scales linearly with time, which is consistentwith that observed by Naber and Siebers (1996).There is good agreement between simulations andexperiments for both rail pressures. An importantobservation is that the higher–rail pressure caseshows lower penetration speeds than the lower–railpressure case in both experiments and simulations.While this may appear counterintuitive (Payri etal., 2008), it is important to mention that the ROIin the early transition region was based on x-ray measurements. As discussed by Ramirez et al.(2008), the x-ray data indicated a slower pressurebuildup in the injector for the 21 MPa rail pressurecase compared to that for the 17 MPa case (cf.Fig. 1). Consequently, the 21 MPa rail pressurecase yields a lower injection rate and thus lowerspray penetration in the region close to the nozzle.Thus, an important result here is that in the regionvery close to the nozzle, the upstream conditions,as determined by flow dynamics inside the injector,affect liquid penetration rather than the details ofspray models.
Figure 3b presents the effect of the ROI on spraypenetration for the two rail pressures. While theROI from x-ray data was limited to 0.18 ms afterSOI, the Bosch rate meter provided the ROI dur-ing the entire injection period, i.e., at 3.4 ms and3.7 ms for the 21 MPa and 17 MPa rail pressures,respectively. Using the ROI from the rate meter (cf.Fig. 1) leads to gross underprediction of spray pen-

892 S. SOM AND S. K. AGGARWAL
Table 4 Spray Breakup Model Constants
Model Constant RangeB0 (KH size constant) 0.61B1 (KH time constant) 20: evaporating
40: non-evaporatingCRT (RT size constant) 0.1: evaporating
0.2: non-evaporatingCτ (RT time constant) 1.0Cλ (breakup length constant) 10: evaporating
20: non-evaporating
0
5
10
15
20
25
30
0 0.1 0.2 0.3 0.4 0.5 0.6
Time (ms)
Pe
ne
tra
tio
n (
mm
)
X-ray data (P_rail=21MPa)
Simulations (P_rail=21MPa)
X-ray data (P_rail=17MPa)
Simulations (P_rail=17MPa)
)
a)
0
3
6
9
12
15
0 0.05 0.1 0.15 0.2 0.25
Time (ms)
Pe
ne
tra
tio
n
(mm
)
ANL X-ray data, P_rail=21MPa
Simulations (P_rail=21MPa):X-ray ROI
Simulations (P_rail=21MPa):ROI Meter
ANL X-ray data, P_rail=17MPa
Simulations (P_rail=17MPa):X-ray ROI
Simulations (P_rail=17MPa):ROI Meter
b)
Fig. 3 (a) Predicted and measured temporal evolutionof liquid penetration for non-evaporating sprays at railpressures of 17 and 21 MPa, and back pressure of3 MPa. (b) Effect of ROI on spray penetration for thetwo rail pressures. Simulations conditions are providedin Table 1
etration while that from the x-ray data shows goodagreement. This again reiterates the fact that in theregion close to the nozzle, the upstream conditionsaffect spray penetration rather than the details ofthe spray models. Hence, an accurate determina-tion of the ROI profile is critical for validating thespray models. Since the standard Bosch rate meteris not able to capture the spray dynamics in thisnear-nozzle region and during the initial stages ofspray development, more sophisticated tools, suchas x-ray radiography, are required for determiningthe ROI throughout the duration of injection.
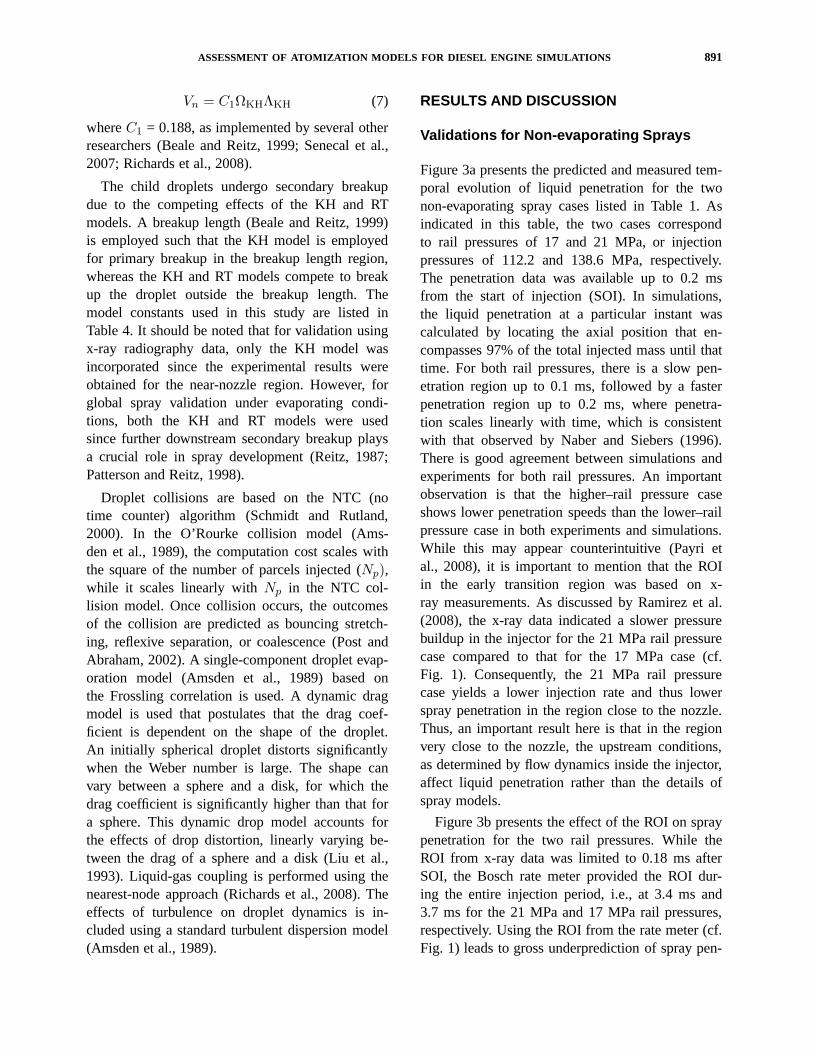
Figure 4 presents a comparison of the predictedand measured projected liquid mass density pro-files in the transverse direction at 1.0 ms after SOIand at different axial locations, 3.28 and 10.8 mm,from the nozzle tip for the two rail pressures. Post-processing tools were developed to obtain resultsthat can be directly compared with the line-of-sight x-ray measurements. All the droplet parcelsat a given time from the three-dimensional spraysimulations were projected to a two-dimensionalplane, and the projected mass density profiles wereconstructed using these parcels. While both themeasured and simulated density profiles exhibitGaussian distribution, there are notable differences.Simulations indicate significantly less dispersioncompared to measurements for both rail pressures(cf. Fig. 4a) and axial locations (cf. Fig. 4b). Thus,the primary breakup model is not able to capturethe measured spray dispersion accurately in thenear-nozzle region. Since the KH breakup modeldoes not account for the effects of cavitation andturbulence from inside the nozzle orifice, it under-predicts spray dispersion, since a fewer number ofchild parcels are produced with this model.
ASSESSMENT OF ATOMIZATION MODELS FOR DIESEL ENGINE SIMULATIONS 893
Time = 1 ms
Axial Position = 3.28 mm
0
20
40
60
80
-1 -0.75 -0.5 -0.25 0 0.25 0.5 0.75 1
Transverse position (mm)
Ma
ss
De
ns
ity
[
g/m
m2]
X-ray data (P_rail=21Mpa)
Simulations (P_rail=21Mpa)
X-ray data (P_rail=17Mpa)
Simulations (P_rail=17Mpa)
Time = 1 ms
P_rail = 21 MPa
0
20
40
60
80
-1.5 -1 -0.5 0 0.5 1 1.5
Transverse position (mm)
Ma
ss
De
ns
ity
[ g/mm2]
X-ray data (x=3.28mm)
Simulations (x=3.28mm)
X-ray data (x=10.08mm)
Simulations (x=10.08mm)
a)
b)
Fig. 4 Comparison of predicted and measured (cf.Table 1) transverse distributions of projected liquidmass density (a) for the two rail pressures and (b) for21 MPa rail pressure at 3.28 and 10.08 mm from thenozzle tip and 1.0 ms after SOI
Figure 5 presents additional comparisons of sim-ulations and x-ray measurements in terms of theprojected transverse mass density profiles at dif-ferent axial locations (Fig. 5a) and different timesafter SOI (Fig. 5b) for 21 MPa rail pressure. Again,while simulations generally capture the measuredspray behavior qualitatively, the overall dispersionis underpredicted.
Integrating the mass distribution (cf. Figs. 4 and5) in the transverse direction yields the transverseintegrated mass (TIM) at a given time and axiallocation (Ramirez et al., 2008). TIM representsliquid mass per unit length in the spray, and itsvariation with axial distance is of fundamental im-
0
20
40
60
80
100
120
140
-1.5 -1.0 -0.5 0.0 0.5 1.0 1.5
Transverse position (mm)
Ma
ss
De
ns
ity
[
g/m
m2]
Data, 0.283mm
Data, 2.483mm
Data, 7.083mm
Simulation, 0.283mm
Simulation, 2.483mm
Simulation, 7.083mm
P_rail = 21 MPa
0.99 ms after SOI
0
20
40
60
80
100
-1.25 -0.75 -0.25 0.25 0.75 1.25
Transverse position (mm)
Mass D
en
sit
y [
g/m
m2]
Data, 0.5ms ASOI
Data, 0.99ms ASOI
Data, 2.0ms ASOI
Simulation, 0.5ms
Simulation, 0.99ms
Simulation, 2.0ms
P_rail = 21 MPa
Axial Position = 2.48mm
a)
b)
Fig. 5 Comparison of predicted and measured (cf.Table 1) transverse distributions of projected massdensity (a) at 0.99 ms after SOI for different axialdistances from nozzle tip and (b) at 2.438 mm from thenozzle tip for different time evolutions, for the 21 MParail pressure case
portance in characterizing the spray development.Figure 6a presents the measured and predicted TIMwith respect to the axial location at 0.99 ms af-ter SOI for the two rail pressures. TIM increasescontinuously with axial position (Ramirez et al.,2009), and the simulations capture this variationvery well. As discussed in Kastengren et al. (2008),the monotonic increase in TIM with axial positionis due to the fact that the spray axial velocity de-creases due to interaction with ambient air. Whilethe spray model underpredicts dispersion, it pro-vides reasonably accurate prediction for the inte-grated liquid mass. The relatively small differencesbetween simulations and measurements may be at-tributed to uncertainties in ROI and deficienciesin the primary breakup model. Figure 6b presents

894 S. SOM AND S. K. AGGARWAL
0
20
40
60
80
100
0 2 4 6 8 10 12 14
Axial Position (mm)
Tra
nsvers
e In
teg
rate
d M
ass(
g/m
m) X-ray Data, 17MPa
Simulations, 17MPa
X-ray Data, 21MPa
Simulations, 21MPa
0.99 ms after SOI
0
0.2
0.4
0.6
0.8
1
0 2 4 6 8 10 12 14
Axial Position (mm)
Sp
ray V
elo
cit
y/ E
xit
Ve
loc
ity
X-ray Data, 17MPa
Simulations, 17MPa
Simulations, 21MPa
0.99 ms after SOI
b)
a)
Fig. 6 Predicted and measured (a) TIM versus axialposition and (b) mass-averaged axial velocity versusaxial position, at 0.99 ms after SOI for the two railpressures
the measured and predicted normalized spray ax-ial velocity with respect to the axial position at0.99 ms after SOI. In simulations, this axial veloc-ity was computed by averaging the axial velocityof various droplet parcels on a mass basis, andnormalizing it by its corresponding value at thenozzle exit. Except for some differences in thenear-nozzle region (x < 3.00 mm), there is fairlygood agreement between predictions and measure-ments. The differences in the near-nozzle regioncan be attributed to different methodologies usedin calculating the spray axial velocity in experi-ments and simulations, and possibly to deficienciesin the primary breakup model. It is also importantto note that both the measurements and simulationsindicate a rather rapid decrease in the spray axialvelocity, especially in the near-nozzle region.
Having performed a detailed assessment of theprimary breakup model using x-ray data, we now
use the optical measurements for non-evaporatingsprays reported by Margot et al. (2008) for furtherassessment of the model. Figure 7a plots the tem-poral variation of the spray penetration and coneangle for both experiments and simulations forcase a in Table 2. While there is generally goodagreement between simulations and measurements,the cone angle is overpredicted. In experiments, thecone angle was defined at 60% of the peak liquidpenetration location. For consistency, the cone an-gle was calculated using the same location in thesimulations. However, an initial guess was neces-sary so that the initial droplet parcels are uniformlydistributed within this guessed cone angle, indi-cating the dependence of spray dispersion on theinitially guessed cone angle.
Figure 7b presents the radial distribution of themeasured and predicted SMD at 40 mm from the
0
10
20
30
40
50
0.0 0.1 0.2 0.3 0.4 0.5 0.6 0.7 0.8
Time (ms)
Pen
etr
ati
on
(m
m)
0
5
10
15
20
25
Sp
ray C
on
e A
ng
le (
°)
Margot et al.
Simulation
0
5
10
15
20
25
30
0.0 0.5 1.0 1.5 2.0 2.5
Radial Distance (mm)
SM
D (
mic
ron
s)
Margot et al.
Simulation
a)
b)
Fig. 7 Measured and predicted (a) liquid penetrationand cone angle versus time for case a and (b) Sautermean diameter versus radial distance at 40 mm frominjector nozzle and 0.6 ms after SOI for case b inTable 3

ASSESSMENT OF ATOMIZATION MODELS FOR DIESEL ENGINE SIMULATIONS 895
nozzle tip and 0.6 ms after SOI for case b inTable 2. In general, the SMD decreases with ra-dial distance, which is expected as the peripheryof spray is influenced to a greater extent by aero-dynamically induced breakup than the core itself.While simulations capture this trend fairly well, theSauter mean diameter (SMD) values are overpre-dicted in the core region, which is again indicativeof a lesser extent of breakup predicted by themodel.
Validations for Evaporating Sprays
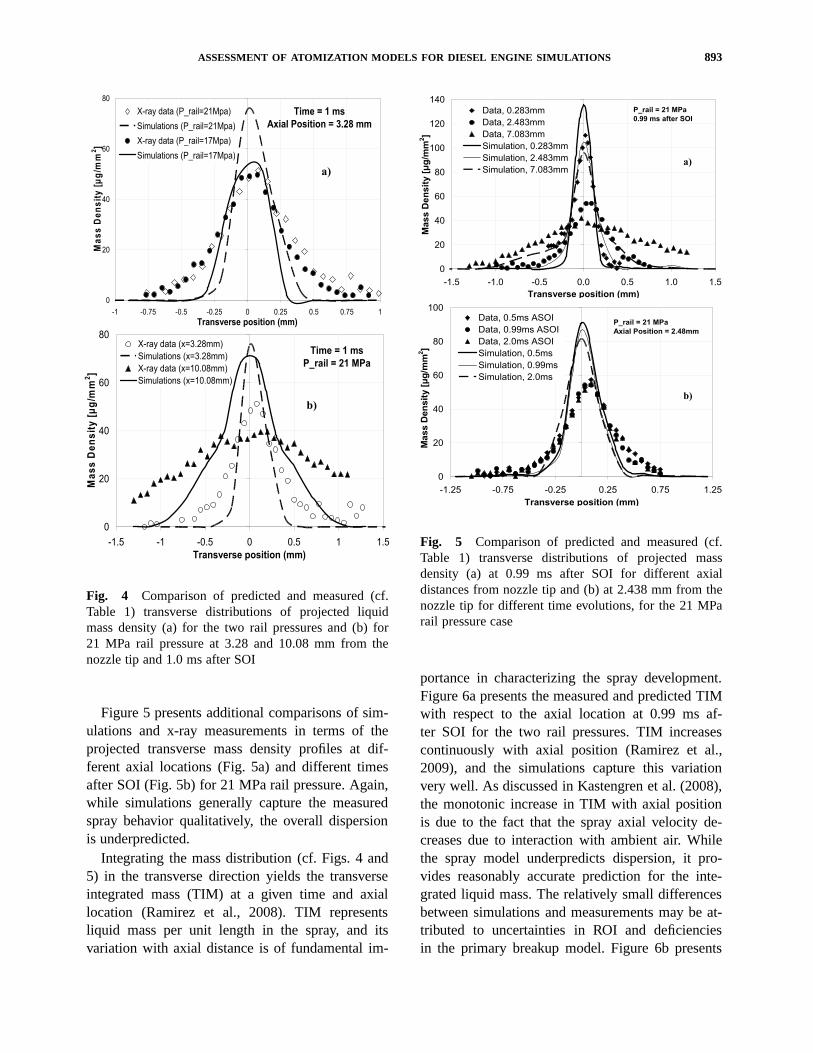
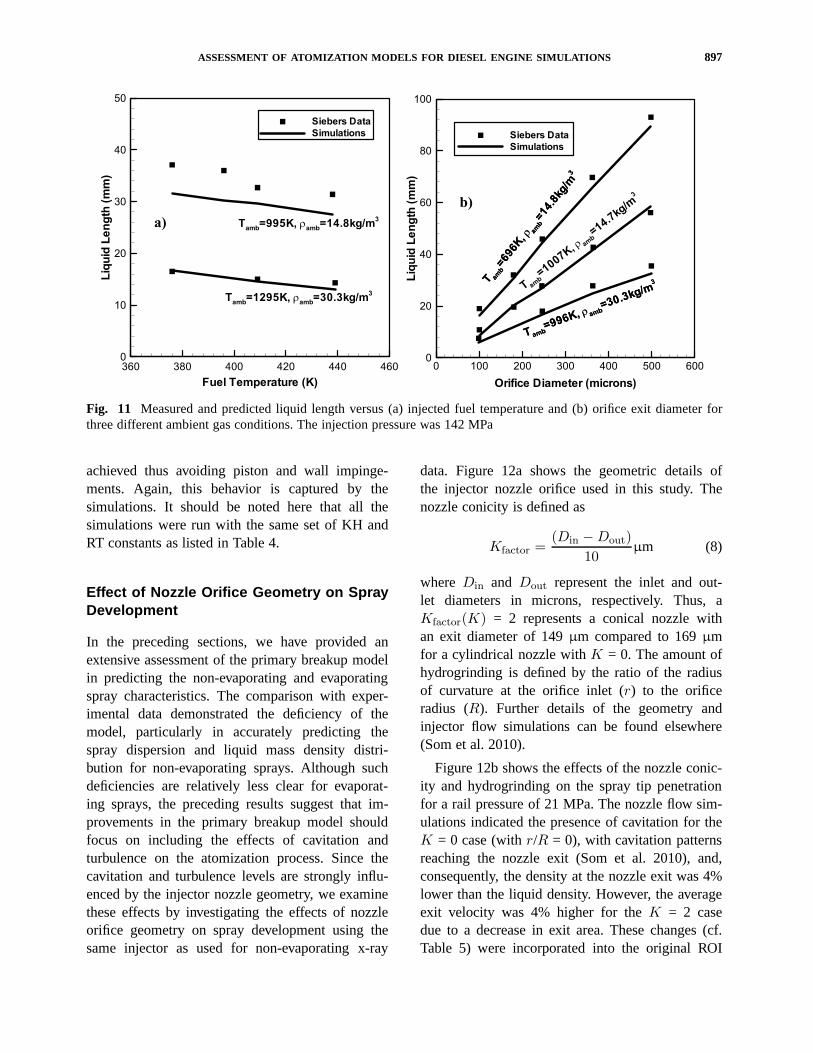
In this section, we present results for the assess-ment of spray models under evaporating conditionstypical of partial-load diesel engine operation. Fig-ure 8 plots the effects of ambient gas density andtemperature on the measured and predicted liq-uid length. The orifice diameter, injection pressure,and fuel temperature were 246µm, 142 MPa, and438 K, respectively, in the experiments (Siebers,1998). Under evaporating conditions, the liquidlength is defined as the maximum liquid pene-tration distance. It represents an important sprayparameter since its overpenetration can result inimpingement on combustion chamber walls andpistons with an associated increase in engine rawemissions, while underpenetration results in poor
air utilization. As expected, with increase in am-bient gas density, the drag on droplet parcelsincreases, and the liquid length consequently de-creases. This trend is well captured by simulations(cf. Fig. 8a). Similarly, an increase in ambienttemperature at a fixed density causes a decreasein liquid length (cf. Fig. 8b). This can be at-tributed to the increased vaporization rate, whichdecreases the overall droplet size, and thus theliquid length. This trend is also reasonably wellcaptured by simulations. However at higher den-sities (ρa = 14.8 and 59 kg/m3), the predictedliquid lengths are relatively insensitive to changesin the ambient gas temperature. The liquid lengthdepends on the overall spray vaporization rate,which is influenced by spray dispersion and dropletsize distribution. As discussed earlier, the spraydispersion is underpredicted by the current breakupmodel. Consequently, improvements in the breakupmodel, by incorporating the effects of cavitationand turbulence, could lead to improved predictionof spray dispersion and droplet size distribution,and thereby of the liquid length.
Figure 9 presents the measured and predictedvapor penetrations as a function of time at fourdifferent ambient gas densities. Vapor penetrationwas defined as the distance between the nozzle tipand the location of the 95% fuel vapor contour
Ambient Gas Density (kg/m3)
LiquidLength(mm)
0 10 20 30 40 50 600
20
40
60
80
100
Siebers Data, Tamb=1000K
Simulations, Tamb=1000K
Siebers Data, Tamb=850K
Simulations, Tamb=850K
a)
Ambient Gas Temperature (K)
LiquidLength(mm)
700 800 900 1000 1100 1200 1300 14000
20
40
60
80
100
Siebers Data
Simulations
amb=3.3kg/m
3
amb=14.8kg/m
3
amb=59kg/m
3
amb=7.6kg/m
3
b)
Fig. 8 Measured and predicted liquid lengths plotted versus (a) ambient gas density for two different ambient gastemperatures, and (b) ambient gas temperature for four different ambient gas densities
896 S. SOM AND S. K. AGGARWAL
Time (ms)
VaporPenetration(mm)
0 0.5 1 1.5 2 2.50
20
40
60
80
100
120
Siebers Data
Simulations
amb=6.8kg/m
3
amb=28
.6kg/m
3
amb=58
.6kg/m
3
amb=13
.9kg/m
3
Fig. 9 Measured and predicted vapor penetrationversus time for three different ambient gas densities.The orifice diameter, injection pressure, ambient tem-perature, and fuel temperature were 246µm, 142 MPa,1000 K, and 438 K, respectively
at the spray tip. For all the four cases, there isgood agreement between measurements and pre-dictions up to 60 mm, and better than that reportedin previous studies (Beale and Reitz, 1999). Forboth measurements and simulations, with increasein ambient density, the vapor penetration at a giventime decreases, which is due to the fact that theliquid length decreases at higher density due tothe increased drag, and also may be due to thefact that the vaporization rate increases at higherdensity (or higher ambient pressure). The minordifferences between measurements and simulationsduring the early part of injection may be attributedto uncertainties with respect to the ROI profile usedin the simulations. Simulations underpredict vaporpenetration at later times, and the discrepancy be-comes more significant at higher ambient density.This may be related to some deficiency in thevaporization model.
Figure 10 presents the computed spray structureat 1 ms after SOI for different orifice pressuredrops (i.e., injection pressures). The vertical linemarks the experimentally observed liquid length.For evaporating sprays, Siebers (1998) observed
27 mm
a) P = 86 MPa
27 mm
b) P = 118 MPa
c) P = 136 MPa
27 mm
27 mm
a) P = 86 MPa
27 mm
b) P = 118 MPa
c) P = 136 MPa
27 mm
Fig. 10 Measured and predicted vapor penetrationversus time for three different ambient gas densities.The orifice diameter, injection pressure, ambient tem-perature, and fuel temperature were 246µm, 142 MPa,1000 K, and 438 K, respectively
that the liquid length is insensitive to changes inthe injection pressure, and, consequently, higher in-jection pressure does not lead to fuel impingementon piston bowls. Simulations predict this trendfairly well, except that the predicted liquid lengthis slightly higher (29 mm) for the orifice pressuredrop of 86 MPa. As noted earlier (cf. Fig. 3b), theROI has a significant impact on the initial spraypenetration and can thus affect the liquid length.It should be noted that the ROI profile was mea-sured for one injection pressure (142 MPa) in theexperimental work (Naber and Siebers, 1996), andwas scaled based on the measured pressure dropfor other injection pressures. This could lead to anoverprediction of liquid length at lower injectionpressures.
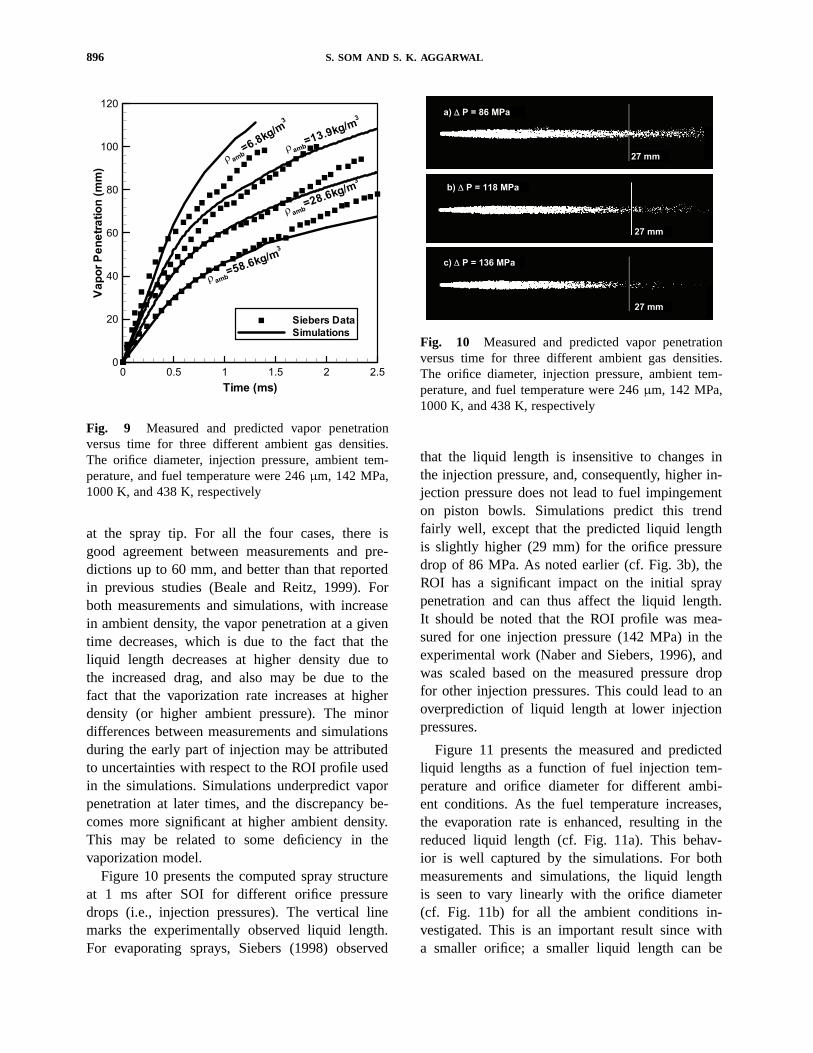
Figure 11 presents the measured and predictedliquid lengths as a function of fuel injection tem-perature and orifice diameter for different ambi-ent conditions. As the fuel temperature increases,the evaporation rate is enhanced, resulting in thereduced liquid length (cf. Fig. 11a). This behav-ior is well captured by the simulations. For bothmeasurements and simulations, the liquid lengthis seen to vary linearly with the orifice diameter(cf. Fig. 11b) for all the ambient conditions in-vestigated. This is an important result since witha smaller orifice; a smaller liquid length can be
ASSESSMENT OF ATOMIZATION MODELS FOR DIESEL ENGINE SIMULATIONS 897
Fuel Temperature (K)
LiquidLength(mm)
360 380 400 420 440 4600
10
20
30
40
50
Siebers Data
Simulations
Tamb=995K,
amb=14.8kg/m
3
Tamb=1295K,
amb=30.3kg/m
3
a)
Orifice Diameter (microns)
LiquidLength(mm)
0 100 200 300 400 500 6000
20
40
60
80
100
Siebers Data
Simulations
T amb=696K, amb=14.8kg/m
3
T amb=1007K, a
mb=14.7kg/m3
T amb=99
6K, amb
=30.3kg/m
3
T amb=99
6K, amb
=30.3kg/m
3T amb=696K, amb=14.8kg/m
3
b)
Fig. 11 Measured and predicted liquid length versus (a) injected fuel temperature and (b) orifice exit diameter forthree different ambient gas conditions. The injection pressure was 142 MPa
achieved thus avoiding piston and wall impinge-ments. Again, this behavior is captured by thesimulations. It should be noted here that all thesimulations were run with the same set of KH andRT constants as listed in Table 4.
Effect of Nozzle Orifice Geometry on SprayDevelopment
In the preceding sections, we have provided anextensive assessment of the primary breakup modelin predicting the non-evaporating and evaporatingspray characteristics. The comparison with exper-imental data demonstrated the deficiency of themodel, particularly in accurately predicting thespray dispersion and liquid mass density distri-bution for non-evaporating sprays. Although suchdeficiencies are relatively less clear for evaporat-ing sprays, the preceding results suggest that im-provements in the primary breakup model shouldfocus on including the effects of cavitation andturbulence on the atomization process. Since thecavitation and turbulence levels are strongly influ-enced by the injector nozzle geometry, we examinethese effects by investigating the effects of nozzleorifice geometry on spray development using thesame injector as used for non-evaporating x-ray
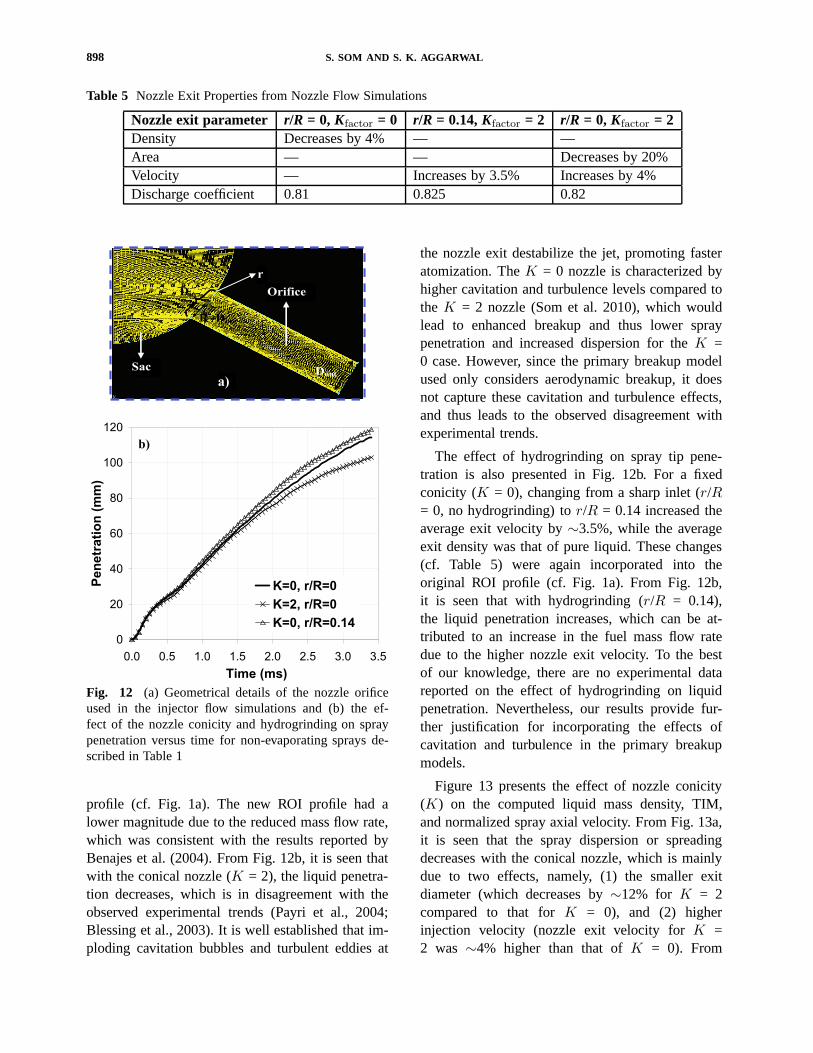
data. Figure 12a shows the geometric details ofthe injector nozzle orifice used in this study. Thenozzle conicity is defined as
Kfactor =(Din − Dout)
10µm (8)
where Din and Dout represent the inlet and out-let diameters in microns, respectively. Thus, aKfactor(K) = 2 represents a conical nozzle withan exit diameter of 149µm compared to 169µmfor a cylindrical nozzle withK = 0. The amount ofhydrogrinding is defined by the ratio of the radiusof curvature at the orifice inlet (r) to the orificeradius (R). Further details of the geometry andinjector flow simulations can be found elsewhere(Som et al. 2010).
Figure 12b shows the effects of the nozzle conic-ity and hydrogrinding on the spray tip penetrationfor a rail pressure of 21 MPa. The nozzle flow sim-ulations indicated the presence of cavitation for theK = 0 case (withr/R = 0), with cavitation patternsreaching the nozzle exit (Som et al. 2010), and,consequently, the density at the nozzle exit was 4%lower than the liquid density. However, the averageexit velocity was 4% higher for theK = 2 casedue to a decrease in exit area. These changes (cf.Table 5) were incorporated into the original ROI
898 S. SOM AND S. K. AGGARWAL
Table 5 Nozzle Exit Properties from Nozzle Flow Simulations
Nozzle exit parameter r/R = 0, Kfactor = 0 r/R = 0.14, Kfactor = 2 r/R = 0, Kfactor = 2Density Decreases by 4% — —Area — — Decreases by 20%Velocity — Increases by 3.5% Increases by 4%Discharge coefficient 0.81 0.825 0.82
Orifice
Sac
r
Din
Dout
R=Din
a)
0
20
40
60
80
100
120
0.0 0.5 1.0 1.5 2.0 2.5 3.0 3.5
Time (ms)
Pe
ne
tra
tio
n (
mm
)
K=0, r/R=0
K=2, r/R=0
K=0, r/R=0.14
b)
Fig. 12 (a) Geometrical details of the nozzle orificeused in the injector flow simulations and (b) the ef-fect of the nozzle conicity and hydrogrinding on spraypenetration versus time for non-evaporating sprays de-scribed in Table 1
profile (cf. Fig. 1a). The new ROI profile had alower magnitude due to the reduced mass flow rate,which was consistent with the results reported byBenajes et al. (2004). From Fig. 12b, it is seen thatwith the conical nozzle (K = 2), the liquid penetra-tion decreases, which is in disagreement with theobserved experimental trends (Payri et al., 2004;Blessing et al., 2003). It is well established that im-ploding cavitation bubbles and turbulent eddies at
the nozzle exit destabilize the jet, promoting fasteratomization. TheK = 0 nozzle is characterized byhigher cavitation and turbulence levels compared tothe K = 2 nozzle (Som et al. 2010), which wouldlead to enhanced breakup and thus lower spraypenetration and increased dispersion for theK =0 case. However, since the primary breakup modelused only considers aerodynamic breakup, it doesnot capture these cavitation and turbulence effects,and thus leads to the observed disagreement withexperimental trends.
The effect of hydrogrinding on spray tip pene-tration is also presented in Fig. 12b. For a fixedconicity (K = 0), changing from a sharp inlet (r/R= 0, no hydrogrinding) tor/R = 0.14 increased theaverage exit velocity by∼3.5%, while the averageexit density was that of pure liquid. These changes(cf. Table 5) were again incorporated into theoriginal ROI profile (cf. Fig. 1a). From Fig. 12b,it is seen that with hydrogrinding (r/R = 0.14),the liquid penetration increases, which can be at-tributed to an increase in the fuel mass flow ratedue to the higher nozzle exit velocity. To the bestof our knowledge, there are no experimental datareported on the effect of hydrogrinding on liquidpenetration. Nevertheless, our results provide fur-ther justification for incorporating the effects ofcavitation and turbulence in the primary breakupmodels.
Figure 13 presents the effect of nozzle conicity(K) on the computed liquid mass density, TIM,and normalized spray axial velocity. From Fig. 13a,it is seen that the spray dispersion or spreadingdecreases with the conical nozzle, which is mainlydue to two effects, namely, (1) the smaller exitdiameter (which decreases by∼12% for K = 2compared to that forK = 0), and (2) higherinjection velocity (nozzle exit velocity forK =2 was ∼4% higher than that ofK = 0). From

ASSESSMENT OF ATOMIZATION MODELS FOR DIESEL ENGINE SIMULATIONS 899
0
15
30
45
60
75
90
-1.5 -1.0 -0.5 0.0 0.5 1.0 1.5
Transverse position (mm)
Ma
ss
De
ns
ity
[
g/m
m2]
K=0, 2.5mm
K=0, 7mm
K=2, 2.5mm
K=2, 7mm
0
0.2
0.4
0.6
0.8
1
0 3 6 9 12 15
Axial Distance (mm)
TIM
(
g/m
m)
0
20
40
60
80
100
K=0
K=2
No
rmali
zed
Sp
ray V
elo
cit
y
a)
b)
Fig. 13 The effect of nozzle conicity on (a) liquidmass density and (b) TIM and normalized axial sprayvelocity at 0.99 ms after SOI for the 21 MPa railpressure case
Fig. 13b, the TIM is lower forK = 2, which isdue to the fact that the mass injected is lower forthe conical nozzle. The normalized spray velocitywas seen to decay at a slower rate forK = 2than K = 0. The conical nozzle is seen to spread(cf. Fig. 13a) less; interaction with the gas wasthus lesser, which resulted in slower momentumexchange. After an axial distance of 8 mm, thedecay in the axial spray velocity is almost similarfor bothKfactor cases.
Effects of Numerical Parameters on SprayBehavior
Grid size has been shown to have a significanteffect on spray predictions using different enginemodeling codes (Abani et al., 2008a; Abraham,1997; Iyer and Abraham, 1997). Here, we examinethe effects of both the Eulerian grid size and the
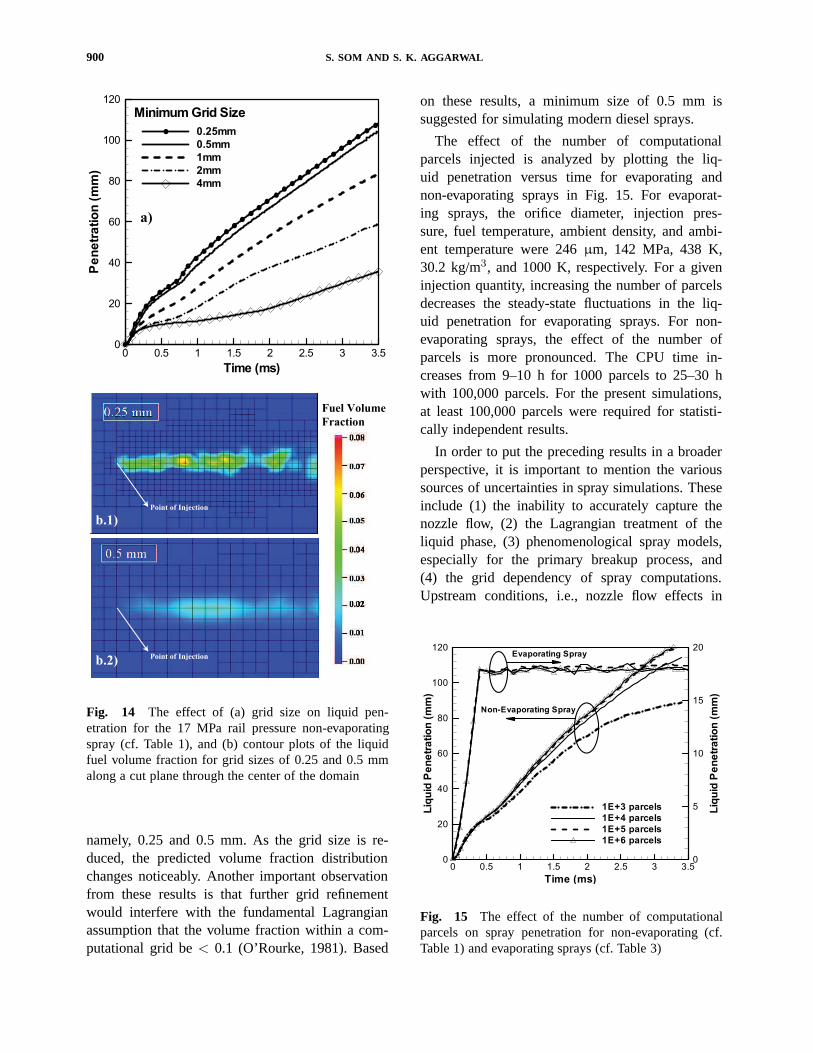
number of Lagrangian parcels on spray predictionsin order to identify an optimum choice of theseparameters. Figure 14a presents the effect of gridsize on the temporal evolution of liquid penetrationfor 17 MPa rail pressure (cf. Table 1). As men-tioned earlier, the CONVERGE software employsan innovative grid-refining technique. Using a fixedbase grid size of 4 mm, refining was performedby specifying different levels of fixed and adaptiveembedding. For example, a minimum grid size of0.5 mm was obtained with three levels of fixedembedding and three levels of adapting embed-ding for the velocity field. Five different minimumgrid sizes were studied, namely, 4 mm (coarsemesh), 2, 1, 0.5, and 0.25 mm (fine mesh). Asindicated in Fig. 14a, the spray simulations arestrongly influenced by the grid size. Penetration isseen to monotonically decrease as the grid size isincreased. This can be explained by the fact thatas the grid size becomes coarser, the gas-phasemomentum is underpredicted since the momentumtransfer from the droplets to the gas-phase residingin a large cell volume is reduced. Thus, newlyinjected droplets experience higher ambient drag(which increases as the relative velocity betweenthe liquid and gas phases increase), resulting inreduced spray penetration (Abani et al., 2008b).However, the predicted liquid penetration appearsto be nearly grid independent for the minimum gridsize of 0.5 mm. The main source of grid depen-dency stems from the inadequate spatial resolutionof the Eulerian phase in the near-nozzle region,characterized by large gradients. For the presentstudy, the orifice diameter is 169µm, and thuseven with a 250µm (0.25 mm) minimum grid size,the gas phase is not adequately resolved. It is alsoimportant to note that the CPU time increased from3–4 h for the coarse grid to 40–45 h for the finegrid on a four-node Linux cluster with 2.8 GHzprocessors.
Figure 14b presents contours of liquid fuel vol-ume fraction across a cut plane through the centerof the domain. The field of view in the axialand radial direction is about 9 and 6.5 mm, re-spectively. The liquid volume fraction was calcu-lated for the computational cell that the cut planewas cutting through as the ratio of liquid fuel tocell volume. Results are shown for the two grids,
900 S. SOM AND S. K. AGGARWAL
Time (ms)
Penetration(mm)
0 0.5 1 1.5 2 2.5 3 3.50
20
40
60
80
100
120
0.25mm
0.5mm
1mm
2mm
4mm
MinimumGrid Size
a)
b.1)
b.2) Point of Injection
Point of Injection
Fuel Volume
Fraction
Fig. 14 The effect of (a) grid size on liquid pen-etration for the 17 MPa rail pressure non-evaporatingspray (cf. Table 1), and (b) contour plots of the liquidfuel volume fraction for grid sizes of 0.25 and 0.5 mmalong a cut plane through the center of the domain
namely, 0.25 and 0.5 mm. As the grid size is re-duced, the predicted volume fraction distributionchanges noticeably. Another important observationfrom these results is that further grid refinementwould interfere with the fundamental Lagrangianassumption that the volume fraction within a com-putational grid be< 0.1 (O’Rourke, 1981). Based
on these results, a minimum size of 0.5 mm issuggested for simulating modern diesel sprays.
The effect of the number of computationalparcels injected is analyzed by plotting the liq-uid penetration versus time for evaporating andnon-evaporating sprays in Fig. 15. For evaporat-ing sprays, the orifice diameter, injection pres-sure, fuel temperature, ambient density, and ambi-ent temperature were 246µm, 142 MPa, 438 K,30.2 kg/m3, and 1000 K, respectively. For a giveninjection quantity, increasing the number of parcelsdecreases the steady-state fluctuations in the liq-uid penetration for evaporating sprays. For non-evaporating sprays, the effect of the number ofparcels is more pronounced. The CPU time in-creases from 9–10 h for 1000 parcels to 25–30 hwith 100,000 parcels. For the present simulations,at least 100,000 parcels were required for statisti-cally independent results.
In order to put the preceding results in a broaderperspective, it is important to mention the varioussources of uncertainties in spray simulations. Theseinclude (1) the inability to accurately capture thenozzle flow, (2) the Lagrangian treatment of theliquid phase, (3) phenomenological spray models,especially for the primary breakup process, and(4) the grid dependency of spray computations.Upstream conditions, i.e., nozzle flow effects in
Time (ms)
LiquidPenetration(mm)
LiquidPenetration(mm)
0 0.5 1 1.5 2 2.5 3 3.50
20
40
60
80
100
120
0
5
10
15
20
1E+3 parcels
1E+4 parcels
1E+5 parcels
1E+6 parcels
Evaporating Spray
Non-Evaporating Spray
Fig. 15 The effect of the number of computationalparcels on spray penetration for non-evaporating (cf.Table 1) and evaporating sprays (cf. Table 3)
ASSESSMENT OF ATOMIZATION MODELS FOR DIESEL ENGINE SIMULATIONS 901
terms of rate of injection, injection velocity, anddischarge coefficient, can all have a significant in-fluence since they are input for simulations. Inaddition, the cavitation and turbulence inside theinjector can have a significant influence on theprimary breakup. While all these issues are impor-tant, the focus of the current study is to identifythe deficiency in the primary breakup model anddemonstrate a need for incorporating the effects ofnozzle flow in spray models.
CONCLUSIONS
We have performed an extensive assessment of at-omization models that are currently used in dieselengine simulations. The assessment uses recent x-ray radiography measurements in the near-nozzleregion for non-evaporating sprays for a HEUI315B production injector, as well as optical mea-surements for both non-evaporating and evaporat-ing sprays under enginelike conditions. Importantobservations are as follows:
1. In the region very close to the nozzle, the liq-uid atomization and spray penetration are morestrongly influenced by the upstream (injectorflow) conditions, rather than the details of thespray models. Here, an accurate ROI profile iscritical for correctly predicting the spray behav-ior and validating the atomization models.
2. Comparison with x-ray data reveals deficienciesin the primary breakup model. While the modelreproduces the global spray behavior, the spraydispersion is significantly underpredicted, as in-dicated by the liquid mass density profiles. Theunderprediction can be attributed to the fewernumber of child parcels generated by the model,which may be due to the absence of cavitationand turbulence effects in the model.
3. For evaporating sprays, discrepancies in the at-omization model are less pronounced since thecomparison is done in the region farther down-stream from the injector, and the role of va-porization and other spray models also becomesimportant there. While the model globally re-produces the experimentally observed effects ofvarious parameters on spray development, the
liquid length and vapor penetration are under-predicted for some conditions.
4. The effect of the injector nozzle geometry onthe liquid penetration is not accurately cap-tured by the model, indicating the need forcoupling the injector flow simulations with theprimary breakup model, and thus incorporatingthe effects of cavitation and turbulence in themodel. In addition, the numerical experimentsindicate that a reasonably accurate prediction ofspray development requires an optimum choiceof numerical parameters, such as the minimumEulerian grid size and the minimum number ofcomputational droplet parcels.
REFERENCES
N. Abani, A. Munnannur, and R. D. Reitz, Reductionof numerical parameter dependencies in dieselspray models,ASME J. Eng. Gas Turbine Power,vol. 130, pp. 1–9, 2008a.
N. Abani, S. Kokjohn, S. W. Park, M. Bergin,A. Munnannur, W. Ning, Y. Sun, and R. D. Reitz,An Improved Spray Model for Reducing Numeri-cal Parameter Dependencies in Diesel Engine CFDSimulations, SAE Paper No. 2008-01-0970, 2008b.
J. Abraham, What is adequate resolution in the nu-merical computations of transient jets, SAE PaperNo. 970051, 1997.
A. A. Amsden, P. J. O’Rourke, and T. D. Butler,KIVA-II: A computer program for chemically re-active flows with sprays, Los Alamos NationalLaboratory Report No. LA-11560-MS, 1989.
C. Arcoumanis and M. Gavaises, Linking nozzle flowwith spray characteristics in a diesel fuel injectionsystem,Atomization and Sprays, vol. 8, pp. 307–347, 1998.
J. C. Beale and R. D. Reitz, Modeling spray atom-ization with the Kelvin-Helmholtz/Rayleigh-Taylorhybrid model,Atomization and Sprays, vol. 9, pp.623–650, 1999.
J. Benajes, J. V. Pastor, R. Payri, and A. H. Plazas,Analysis of the influence of diesel nozzle geom-etry in the injection rate characteristic,ASME J.Fluid Eng., vol. 126, pp. 63–71, 2004.
M. Blessing, G. Konig, C. Kruger, U. Michels, andV. Schwarz, Analysis of flow and cavitation phe-nomena in diesel injection nozzles and its effecton spray and mixture formation, SAE Paper No.2003-01-1358, 2003.

902 S. SOM AND S. K. AGGARWAL
G. Blokkeel, B. Barbeau, and R. Borghi, A 3D Eu-lerian model to improve the primary breakup ofatomizing jet, SAE Paper No. 2003-01-0005, 2003.
M. Gorokhovski and M. Herrmann, Modeling primaryatomization,Annu. Rev. Fluid Mech., vol. 40, pp.343–366, 2008.
C. W. Hirt and B. D. Nichols, Volume of fluid (VOF)methods for the dynamics of free boundaries,J.Comput. Phys., vol. 39, pp. 201–225, 1981.
K. Y. Huh and A. D. Gosman, A phenomenologicalmodel of diesel spray atomization,Proceedingsof the International Conference of Multi-PhaseFlows, Sep. 24–27, Tsukuba, Japan, pp. 515–518,1991.
V. Iyer and J. Abraham, Penetration and dispersionof transient gas jets and sprays,Combust. Sci.Technol., vol. 130, pp. 315–334, 1997.
A. L. Kastengren, C. F. Powell, Y. Wang, K. S. Im,and J. Wang, X-ray radiography measurementsof diesel spray structure at engine like ambientdensity,Proceedings of 21st ILASS Annual Confer-ence, Orlando, May 2008.
W. K. Lee, K. Fezzaa, and J. Wang, Metrology ofsteel micronozzles using x-ray propagation-basedphase-enhanced microimaging,Appl. Phys. Lett.,vol. 87, 084105, 2005.
A. H. Lefebvre, Atomization and Sprays, Taylor andFrancis, New York, 1989.
M. Linne, M. Paciaroni, T. Hall, and T. Parker, Bal-listic Imaging of the Near Field in a DieselSpray. Exp. Fluids, vol. 40, pp. 836–846,2006.
A. B. Liu, D. K. Mather, and R. D. Reitz, Effects ofdrop drag and breakup on fuel sprays, SAE PaperNo. 930072, 1993.
X. Margot, R. Payri, A. Gil, M. Chavez, andA. Pinzello, Combined CFD-phenomenological ap-proach to the analysis of diesel sprays undernon-evaporative conditions, SAE Paper No. 2008-01-0962, 2008.
J. D. Naber and D. L. Siebers, Effects of gas densityand vaporization on penetration and dispersion ofdiesel sprays, SAE Paper No. 960034, 1996.
P. J. O’Rourke and A. A. Amsden, The TAB methodfor numerical calculation of spray droplet breakup,SAE Paper No. 872086, 1987.
P. J. O’Rourke, Collective drop effects on vaporizingliquid sprays, PhD Thesis, Princeton University,1981.
M. A. Patterson and R. D. Reitz, Modeling the effectsof fuel spray characteristics on diesel engine com-bustion and emissions, SAE Paper No. 980131,1998.
F. Payri, V. Bermudez, R. Payri, and F. J. Salvador,The influence of cavitation on the internal flow andthe spray characteristics in diesel injection nozzles,Fuel, vol. 83, pp. 419–431, 2004.
R. Payri, F. J. Salvador, J. Gimeno, and J. Morena,Macroscopic behavior of diesel sprays in the near-nozzle field, SAE Paper No. 2008-01-0929, 2008.
S. L. Post and J. Abraham, Modeling the outcomeof drop-drop collisions in diesel sprays,Int.J. Multiphase Flow, vol. 28, pp. 997–1019,2002.
C. F. Powell, Y. Yue, R. Poola, J. Wang, M. C. Lai,and J. Schaller, X-ray measurements of high pres-sure diesel sprays, SAE Paper No. 2001-01-0531,2001.
A. I. Ramırez, S. Som, S. K. Aggarwal, A. L. Kas-tengren, E. M. El-Hannouny, D. E. Longman, andC. F. Powell, Quantitative x-ray measurements ofhigh-pressure fuel sprays from a production heavyduty diesel injector,Exp. Fluids, vol. 47, pp. 119–134, 2009.
A. I. Ramırez, S. Som, S. K. Aggarwal, A. L. Kas-tengren, E. M. El-Hannouny, D. E. Longman, andC. F. Powell, Quantitative measurement of dieselfuel spray characteristics in the near-nozzle regionof a heavy duty multi-hole injector,Proceedingsof 21st ILASS Annual Conference, Orlando, May2008.
R. D. Reitz and R. Diwakar, Structure of high-pressure diesel sprays,SAE Trans., vol. 96, pp.492–509, 1987.
R. D. Reitz, Modeling atomization processes in highpressure vaporizing sprays,Atomization SprayTechnol., vol. 3, pp. 309–337, 1987.
K. J. Richards, P. K. Senecal, and E. Pomraning,CONVERGETM (Version 1.2) Manual, ConvergentScience Inc, 2008.
D. P. Schmidt and C. J. Rutland, A new droplet col-lision algorithm, J. Comput. Phys., vol. 164, pp.62–80, 2000.
P. K. Senecal, E. Pomraning, K. J. Richards,T. E. Briggs, C. Y. Choi, R. M. McDavid,and M. A. Patterson, Multi-dimensional model-ing of direct-injection diesel spray liquid lengthand flame lift-off length using CFD and paralleldetailed chemistry, SAE Paper No. 2003-01-1043,2003.
P. K. Senecal, K. J. Richards, E. Pomraning, T. Yang,M. Z. Dai, R. M. McDavid, M. A. Patterson,S. Hou, and T. Shethaji, A new parallel cut-cell Cartesian CFD code for rapid grid generationapplied to in-cylinder diesel engine simulations,SAE Paper No. 2007-01-0159, 2007.
ASSESSMENT OF ATOMIZATION MODELS FOR DIESEL ENGINE SIMULATIONS 903
D. L. Siebers, Liquid-phase fuel penetration in dieselsprays, SAE Paper No. 980809, 1998.
S. Som, S. K. Aggarwal, E. M. El-Hannouny, andD. E. Longman,J. Eng. Gas Turbine Power, vol.132, pp. 1–12, 2010.
S. Som, A. I. Ramirez, S. K. Aggarwal, A. L. Kas-tengren, E. M. El-Hannouny, D. E. Longman, andC. F. Powell, Development and validation of a pri-mary breakup model for diesel engine applications,SAE Paper No. 2009-01-0838, 2009.
C. Soteriou, M. Lambert, S. Zuelch, and D. Passerel,The flow characteristics of high efficiency dieselnozzles with enhanced geometry holes,Proceed-ings of THIESEL International Conference onThermo and Fluid Dynamic Processes in DieselEngines, Valencia, Spain, 2006.
M. Sussman and E. G. Puckett, A coupled levelset and volume-of-fluid method for computing3D and axisymmetric incompressible two-phaseflows, J. Comput. Phys., vol. 162, pp. 301–337,
2000.M. Sussman, P. Smereka, and S. Osher, A level set ap-
proach for computing solutions to incompressibletwo-phase flow,J. Comput. Phys., vol. 114, pp.146–159, 1994.
F. X. Tanner, A cascade atomization and drop breakupmodel for the simulation of high-pressure liquidjets, SAE Paper No. 2003-01-1044, 2003.
J. Wang, X-ray vision of fuel sprays,J. SynchrotronRadiat., vol. 12, pp. 197–207, 2005.
T. C. Wang, J. S. Han, X. B. Xie, M. C. Lai,N. A. Henein, E. Schwarz, and W. Bryzik, Para-metric characterization of high-pressure diesel fuelinjection system,J. Eng. Gas Turbine Power, vol.125, pp. 412–426, 2003.
Y. Yue, C. F. Powell, R. Poola, J. Wang, andJ. K. Schaller, Quantitative measurements of dieselfuel spray characteristics in the near-nozzle regionusing x-ray absorption,Atomization and Sprays,vol. 11, pp. 471–490, 2001.