Embed Size (px)
Citation preview

Water and Wastewater Utility Energy IndexProject Overview
Steven Carlson, CDH Energy

Goals and Objectives
• Produce Industry-wide Energy performance metrics for – Water Utilities– Wastewater Utilities
• Useful for Energy Management– How does my utility compare to its peers?– How do my plants compare?– How do changes impact performance over time?– How do metric parameters impact energy use?

Background
• EPA Energy Star metrics – Comparing energy use of buildings
• Parameters– Utility Energy Use– Building Characteristics– Operational Characteristics
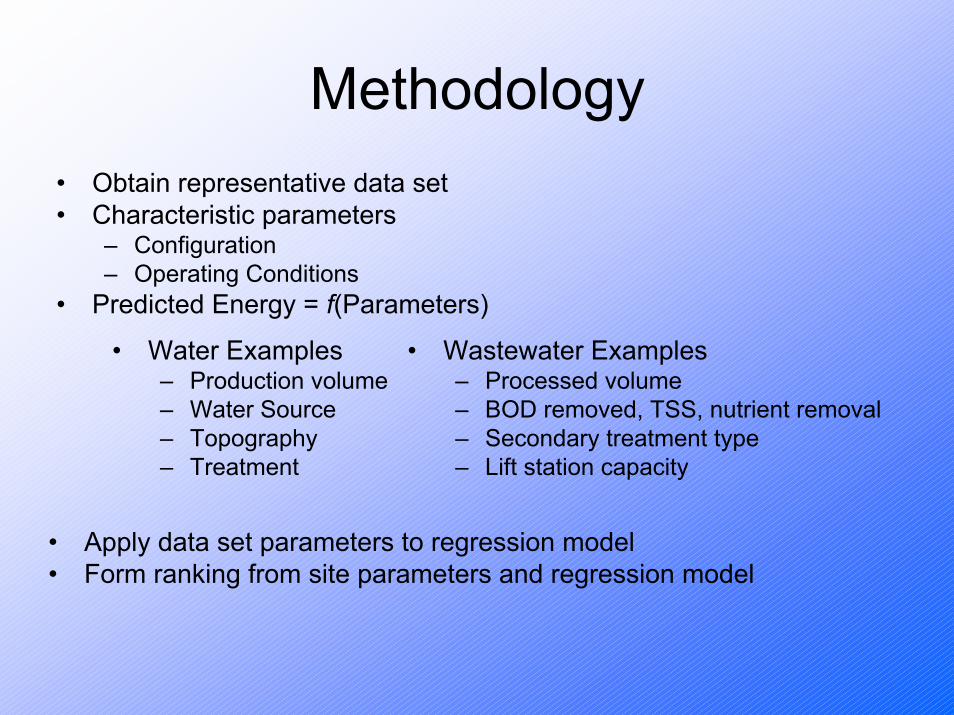
Methodology• Obtain representative data set• Characteristic parameters
– Configuration– Operating Conditions
• Predicted Energy = f(Parameters)
• Water Examples– Production volume– Water Source– Topography– Treatment
• Wastewater Examples– Processed volume– BOD removed, TSS, nutrient removal– Secondary treatment type– Lift station capacity
• Apply data set parameters to regression model• Form ranking from site parameters and regression model
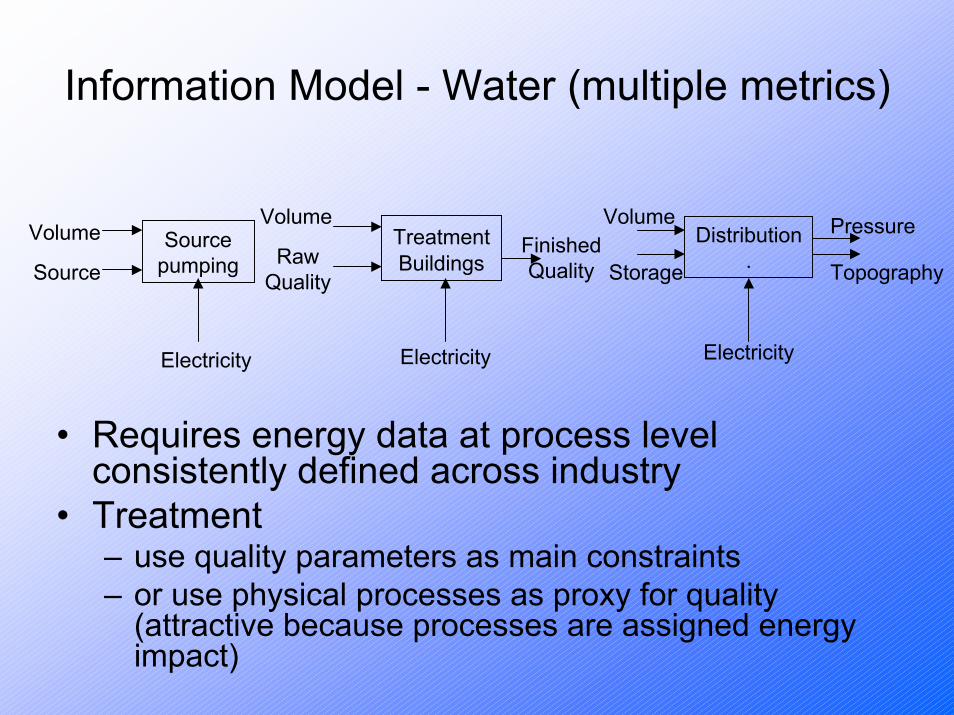
Information Model - Water (multiple metrics)
Source pumping
Volume
Source
Volume PressureFinished Quality
Volume
Electricity
Storage Topography
Distribution .
TreatmentBuildingsRaw
Quality
ElectricityElectricity
• Requires energy data at process level consistently defined across industry
• Treatment– use quality parameters as main constraints– or use physical processes as proxy for quality
(attractive because processes are assigned energy impact)
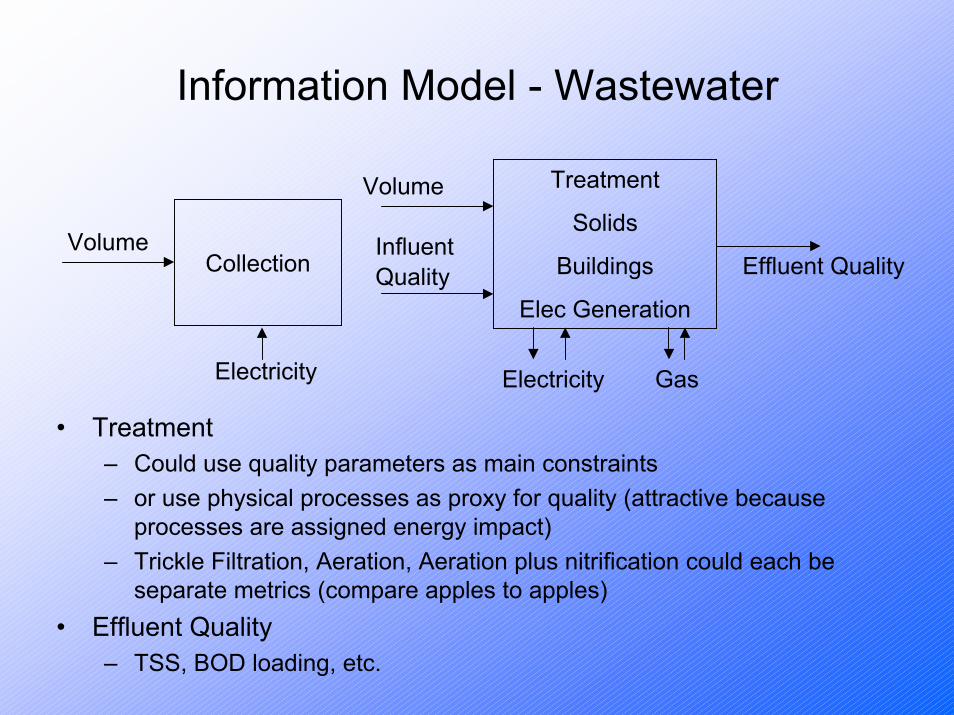
Information Model - Wastewater
Treatment
Solids
Buildings
Elec Generation
Volume
Volume Influent QualityCollection Effluent Quality
Electricity Electricity Gas
• Treatment– Could use quality parameters as main constraints– or use physical processes as proxy for quality (attractive because
processes are assigned energy impact)– Trickle Filtration, Aeration, Aeration plus nitrification could each be
separate metrics (compare apples to apples)• Effluent Quality
– TSS, BOD loading, etc.
Task 1 – Literature Review• Challenge
– to collect data on parameters that impact energy use– Which characteristics?
• Review– Energy Use (kWh/gallons, etc)– Operation (treatment levels, etc)– Characteristics (water source, etc)– Often smaller scopes or little energy info– Other surveys/data sources
• AWWA, AMSA, EPA, WERF• State Permits

Wastewater Existing Data• EPA CWNS
– Rich characteristics, no energy data• EPA Water Discharge Permits (PCS)
– Rich process characteristics, all utilities, no energy data
• AMSA– Characteristics and energy financial data (utility level),
small sample (132)• IOWA
– Characteristics and energy data, sample dominated by small systems (lagoons), 355 total systems, noted 1150 kWh/MG treatment and 420 kWh/MG collection

Wastewater Classification - Size
• 3,200 of 16,255 utilities > 1 MGD • represent 92% of total flow
Number of Treatment Facilities by Flow Range (from CWNS 2000) Treatment Facilities in Operation in 2000
Existing Flow Range (MGD) Number of Facilities Total Existing Flow (MGD) 0.001 to 0.100 6,583 2900.101 to 1.000 6,462 2,3391.001 to 10,000 2,665 8,32810,001 to 100,000 487 12,741100,001 and greater 46 11,201Other 12 ---Total 16,255 34,899

Wastewater Classification –Treatment Level
• Classification Trade-off– Too Coarse – Wide variability– Too Detailed – Few Peers
Number of Treatment Facilities by Level of Treatment (from CWNS 2000) Treatment Facilities in Operation in 2000
Level of Treatment Number of
Facilities Present Design
Capacity (MGD) Number of
People Served Percent of
U.S. Population Less than Secondary 47 1,023 6,426,062 2.3 Secondary 9,156 19,268 88,221,896 32.0 Greater then Secondary 4,892 22,165 100,882,207 36.6 No Discharge 1,938 2,039 12,283,047 4.5 Partial Treatment 222 563 --- --- Total 16,255 45,058 207,813,212 75.4
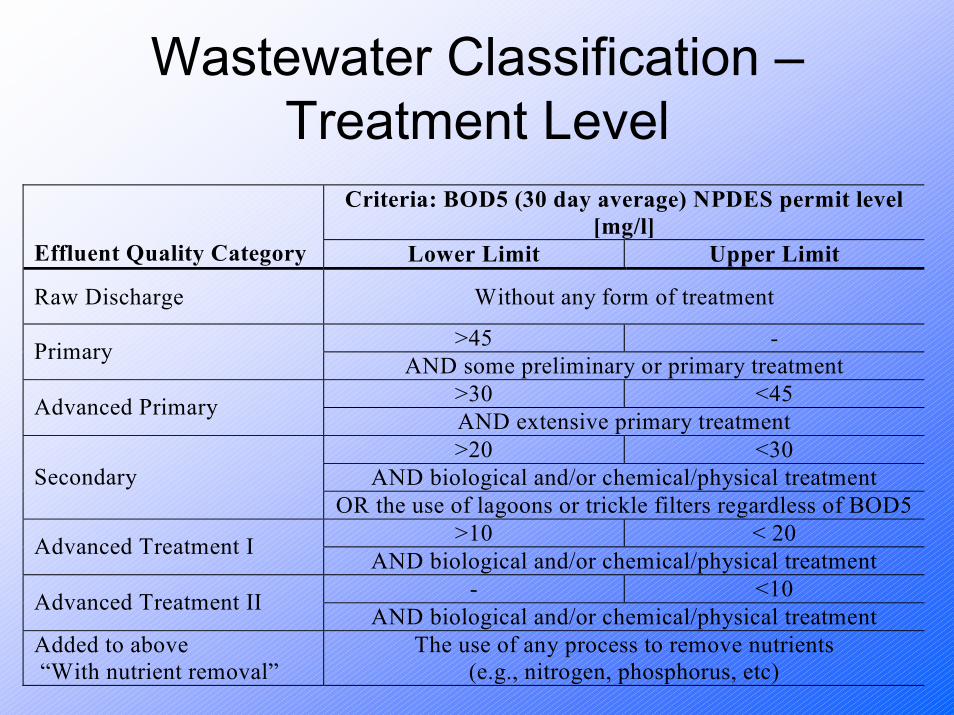
Wastewater Classification –Treatment Level
Criteria: BOD5 (30 day average) NPDES permit level
[mg/l] Effluent Quality Category Lower Limit Upper Limit
Raw Discharge Without any form of treatment
>45 - Primary AND some preliminary or primary treatment >30 <45 Advanced Primary AND extensive primary treatment >20 <30
AND biological and/or chemical/physical treatment Secondary OR the use of lagoons or trickle filters regardless of BOD5
>10 < 20 Advanced Treatment I AND biological and/or chemical/physical treatment - <10 Advanced Treatment II AND biological and/or chemical/physical treatment
Added to above “With nutrient removal”
The use of any process to remove nutrients (e.g., nitrogen, phosphorus, etc)
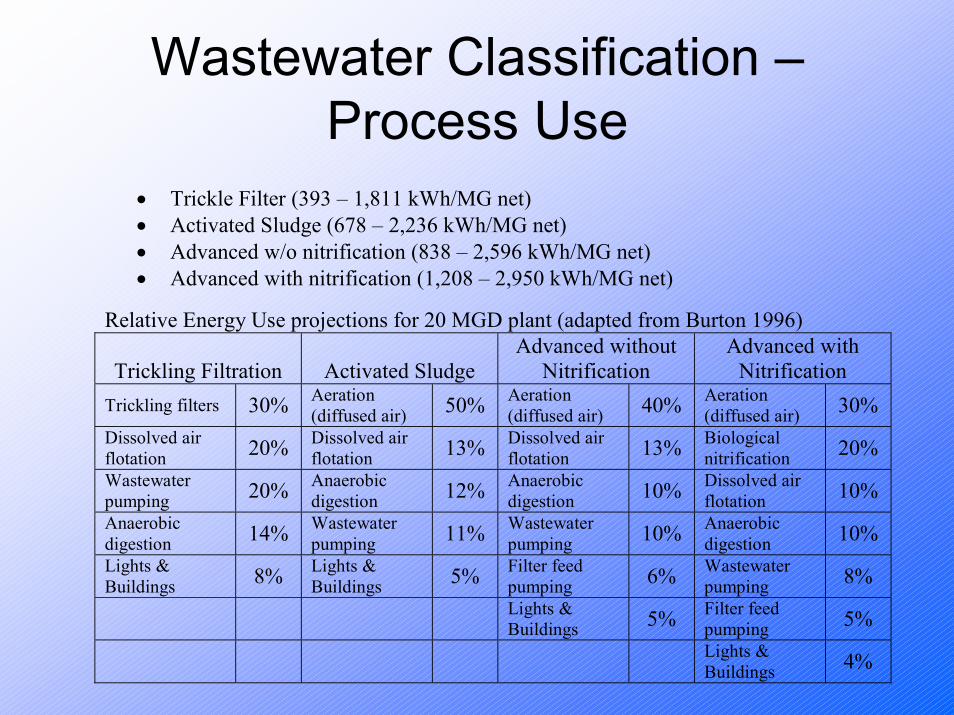
Wastewater Classification –Process Use
• Trickle Filter (393 – 1,811 kWh/MG net) • Activated Sludge (678 – 2,236 kWh/MG net) • Advanced w/o nitrification (838 – 2,596 kWh/MG net) • Advanced with nitrification (1,208 – 2,950 kWh/MG net)
Relative Energy Use projections for 20 MGD plant (adapted from Burton 1996)
Trickling Filtration Activated Sludge Advanced without
Nitrification Advanced with
Nitrification Trickling filters 30% Aeration
(diffused air) 50% Aeration (diffused air) 40% Aeration
(diffused air) 30% Dissolved air flotation 20% Dissolved air
flotation 13% Dissolved air flotation 13% Biological
nitrification 20% Wastewater pumping 20% Anaerobic
digestion 12% Anaerobic digestion 10% Dissolved air
flotation 10% Anaerobic digestion 14% Wastewater
pumping 11% Wastewater pumping 10% Anaerobic
digestion 10% Lights & Buildings 8% Lights &
Buildings 5% Filter feed pumping 6% Wastewater
pumping 8% Lights &
Buildings 5% Filter feed pumping 5%
Lights & Buildings 4%
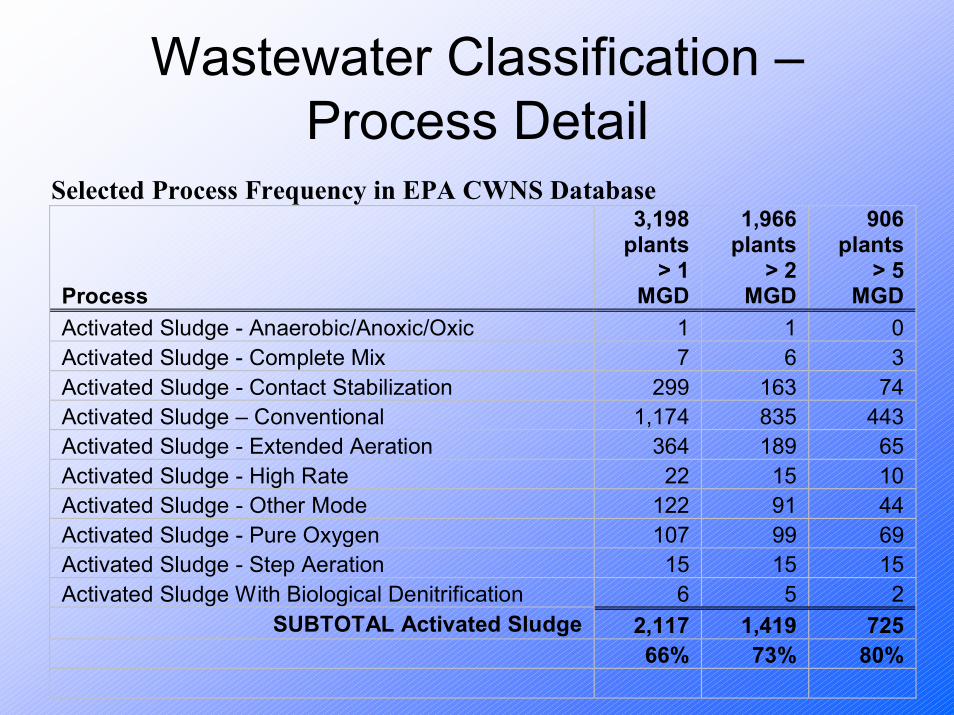
Wastewater Classification –Process Detail
Selected Process Frequency in EPA CWNS Database
Process
3,198 plants
> 1 MGD
1,966 plants
> 2 MGD
906 plants
> 5 MGD
Activated Sludge - Anaerobic/Anoxic/Oxic 1 1 0Activated Sludge - Complete Mix 7 6 3Activated Sludge - Contact Stabilization 299 163 74Activated Sludge – Conventional 1,174 835 443Activated Sludge - Extended Aeration 364 189 65Activated Sludge - High Rate 22 15 10Activated Sludge - Other Mode 122 91 44Activated Sludge - Pure Oxygen 107 99 69Activated Sludge - Step Aeration 15 15 15Activated Sludge With Biological Denitrification 6 5 2
SUBTOTAL Activated Sludge 2,117 1,419 725 66% 73% 80%
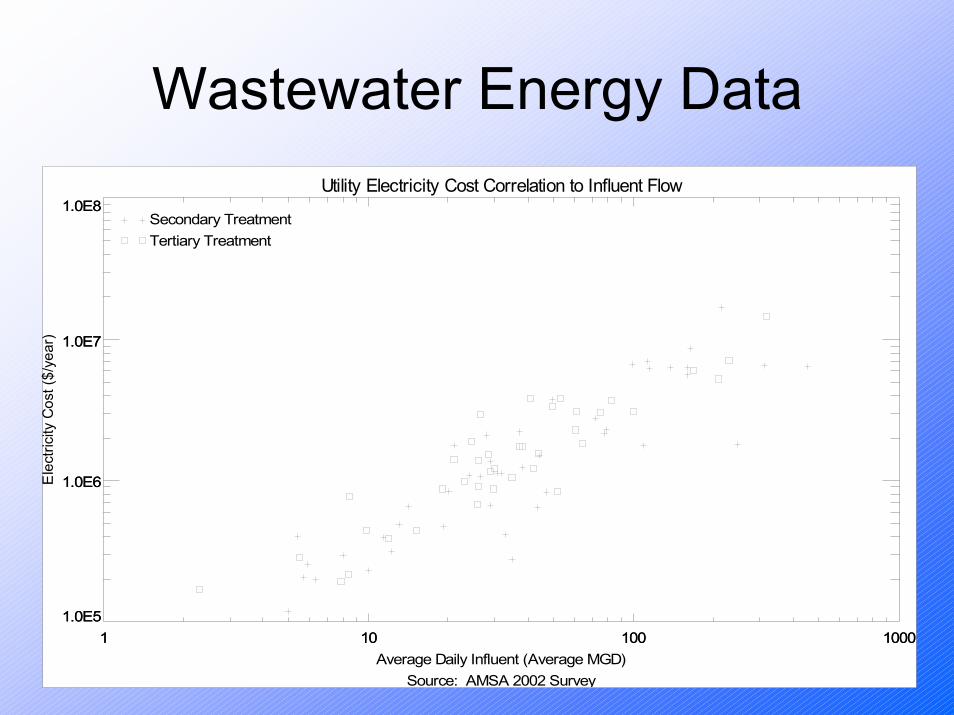
Wastewater Energy DataUtility Electricity Cost Correlation to Influent Flow
Source: AMSA 2002 Survey
1 10 100 1000Average Daily Influent (Average MGD)
1.0E5
1.0E6
1.0E7
1.0E8
Ele
ctric
ity C
ost (
$/ye
ar)
1 10 100 10001.0E5
1.0E6
1.0E7
1.0E8Secondary TreatmentTertiary Treatment
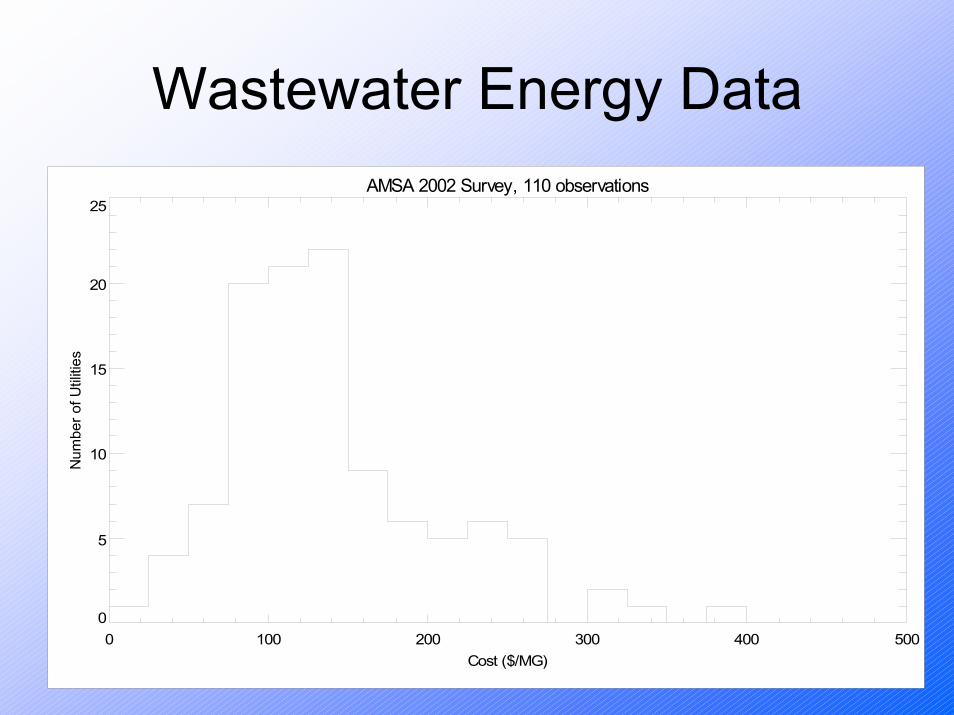
Wastewater Energy DataAMSA 2002 Survey, 110 observations
0 100 200 300 400 500Cost ($/MG)
0
5
10
15
20
25
Num
ber o
f Util
ities
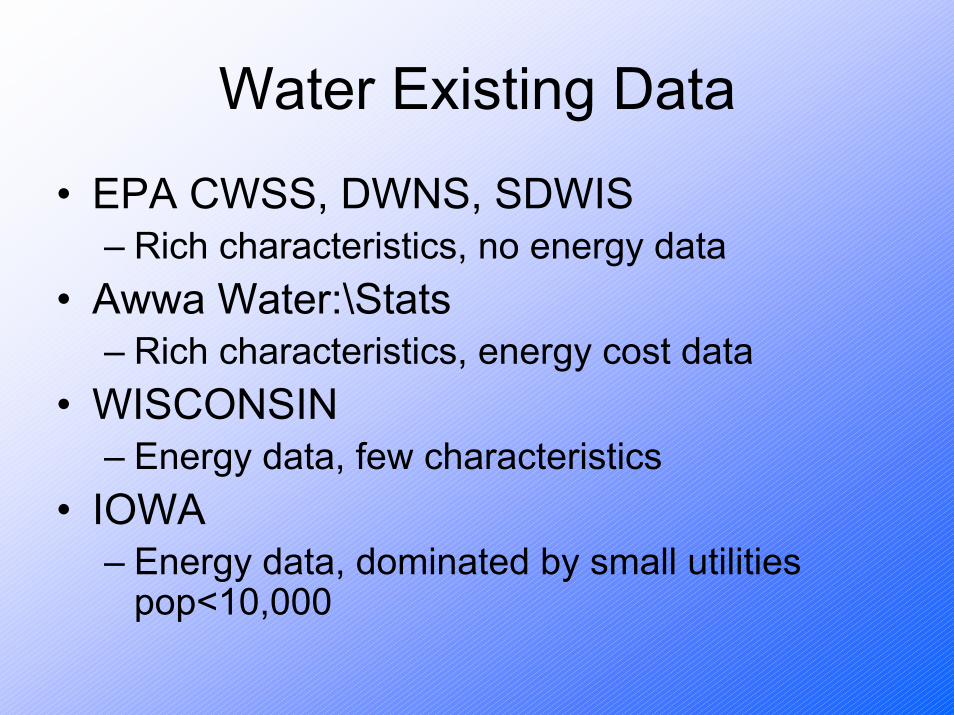
Water Existing Data
• EPA CWSS, DWNS, SDWIS– Rich characteristics, no energy data
• Awwa Water:\Stats– Rich characteristics, energy cost data
• WISCONSIN– Energy data, few characteristics
• IOWA– Energy data, dominated by small utilities
pop<10,000
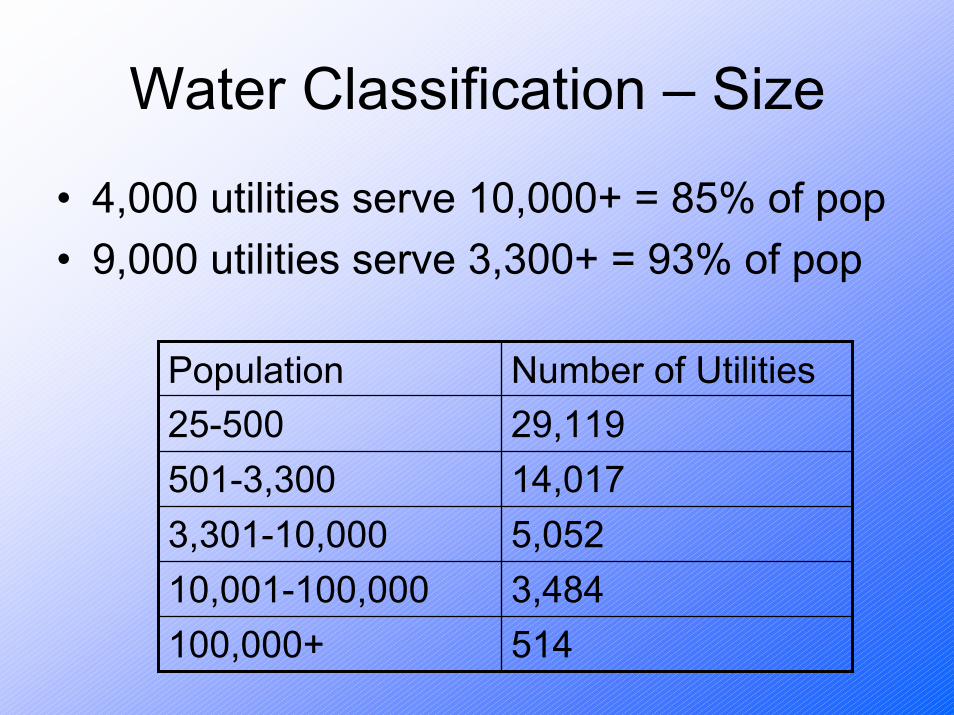
Water Classification – Size
• 4,000 utilities serve 10,000+ = 85% of pop• 9,000 utilities serve 3,300+ = 93% of pop
5143,4845,05214,01729,119Number of Utilities
100,000+10,001-100,0003,301-10,000501-3,30025-500Population

Water Classification –Source/Treatment
Treatment Objectives EPA 2000 Community Water System Survey
Treatment Schemes EPA 2000 Community Water System Survey

Water Classification - Distribution
• Little existing data• Gravity vs pumping• Pressure zones• Total pumping horsepower• Population density• Storage volume• Distribution main length
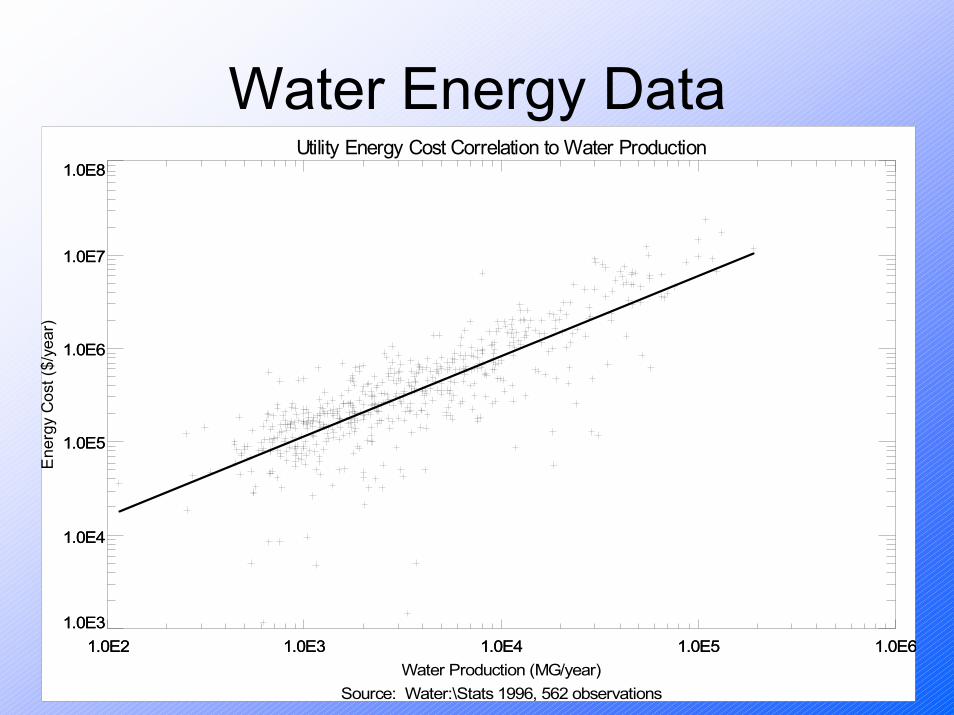
Water Energy DataUtility Energy Cost Correlation to Water Production
Source: Water:\Stats 1996, 562 observations
1.0E2 1.0E3 1.0E4 1.0E5 1.0E6Water Production (MG/year)
1.0E3
1.0E4
1.0E5
1.0E6
1.0E7
1.0E8
Ene
rgy
Cos
t ($/
year
)
1.0E2 1.0E3 1.0E4 1.0E5 1.0E61.0E3
1.0E4
1.0E5
1.0E6
1.0E7
1.0E8

Water Energy DataWater:\Stats 1996, 562 observations
0 100 200 300 400 500 600 700 800 900 1000Cost ($/MG)
0
50
100
150
200
Num
ber o
f Util
ities
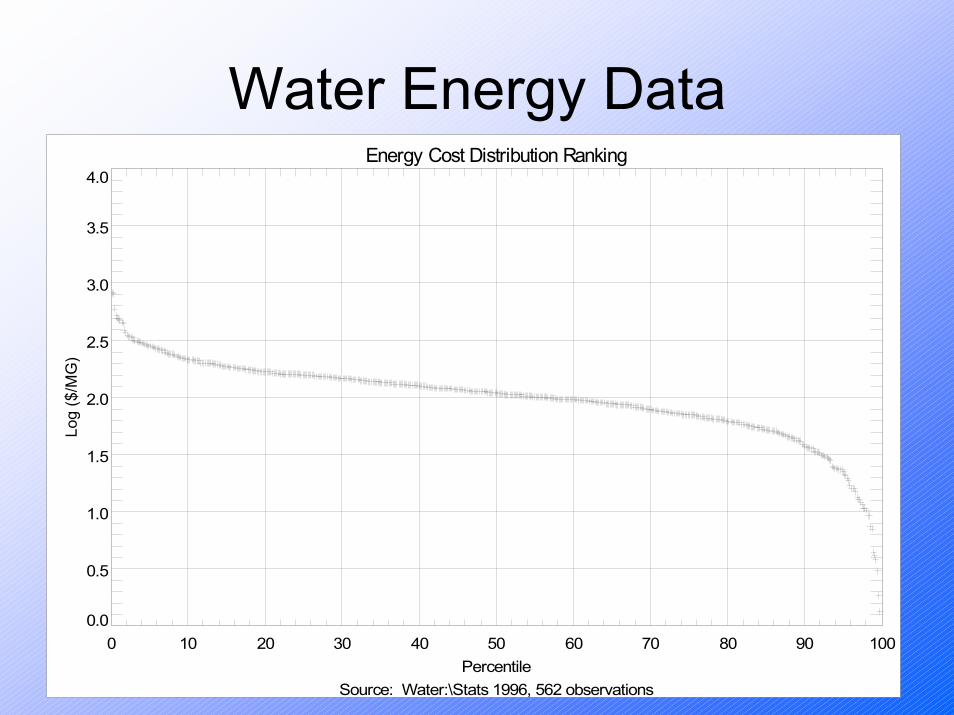
Water Energy DataEnergy Cost Distribution Ranking
Source: Water:\Stats 1996, 562 observations
0 10 20 30 40 50 60 70 80 90 100Percentile
0.0
0.5
1.0
1.5
2.0
2.5
3.0
3.5
4.0
Log
($/M
G)
Task 2 - Assemble Data Sets
• Statistically representative survey of utilities• Leverage Existing Surveys
– Process characteristics– Water quality
• Currently Testing Survey• Planned Spring Implementation
Task 3 – Data Analysis
• Identify parameters that explain energy use variation
• Define ranking distribution from data set• Formulate comparison framework• Late summer/fall
Task 4 /5 Metric Applications• Demonstrate Metric Application
– Types/sources of data needed– Parameters interpretations– Ranking
• Test Metric– Do poor rankings correspond to opportunities?– Do high rankings correspond to “Best Practice”?
• Sites– Participating Utilities– Outliers in Metric Rankings?
Task 6 Metric Roll-Out
• Demonstrate Usefulness to Utilities• Example applications of Metric• Conference Presentation