Embed Size (px)
Citation preview

Water and Energy Savings, and Carbon Emission Reductions From Rain Water
Harvesting, Combined Heat and Power, and Compact Residential Communities
John C. Crittenden, Hyunju Jeong, Zhongming Lu, Jean-Ann James, Director – Brook Byers Institute for Sustainable Systems
Hightower Chair and Georgia Research Alliance (GRA) Eminent Scholar in Sustainable TechnologiesSchool of Civil and Environmental Engineering, Georgia Institute of Technology
Steve French, and Sangwoo SungSchool of Architecture
Bert Bras, and Jennifer FranklandMechanical Engineering
Miroslav M. Begovic, and Insu KimSchool of Electrical and Computer Engineering
email: [email protected]://sustainable.gatech.edu/

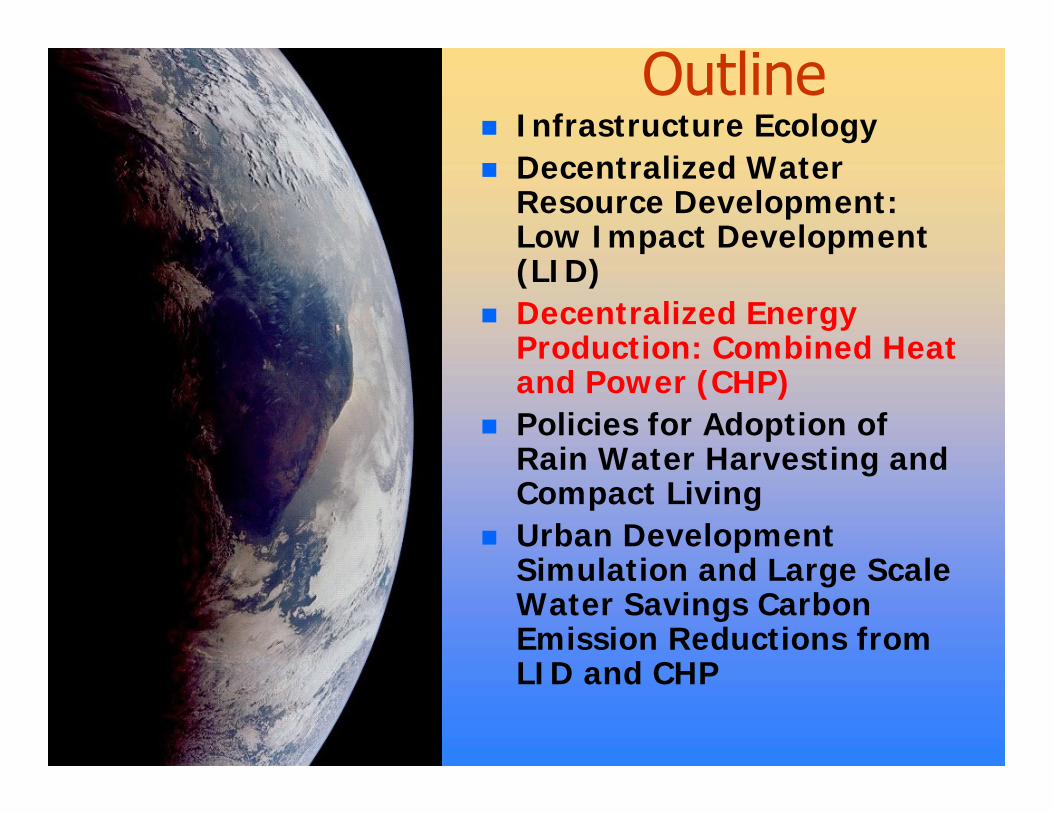
Outline Infrastructure Ecology Decentralized Water
Resource Development: Low Impact Development (LID)
Decentralized Energy Production: Combined Heat and Power (CHP)
Policies for Adoption of Rain Water Harvesting and Compact Living
Urban Development Simulation and Large Scale Water Savings Carbon Emission Reductions from LID and CHP

Interdependence of Different Infrastructure Components

Energy for Water in the U.S.
6
Water Treatment* kWh/MGal
Surface Water Treatment 220
Groundwater Treatment 620
Brackish Groundwater Treatment 3,900‐9,700
Seawater Desalination 9,700‐16,500
Wastewater Treatment kWh/MGal
Trickling Filter 950
Activated Sludge 1,300
Advanced Treatment without Nitrification
1,500
Advanced Treatment with Nitrification 1,900
Average Energy requirement for different water and wastewater treatment technologies2
*Includes collection but does not include distribution
About 4% of the total electricity consumption in the US is for the water and wastewater sector1
Of the total energy required for water treatment, 80% is required for conveyance and distribution
1 EPRI, Water & Sustainability, Volume 4, 20022 Stillwell, A S, et al. Energy‐Water Nexus in Texas, 2009

Water for Energy in US (gal/kW-hr)
0.38 0.49 0.440.32
0.600.47
12.40
55.10 64.8547.42
18.00
4.42
2.33
0.43
7.85
1.65 2.00
0.10
1.00
10.00
100.00
WesternInterconnect
EasternInterconnect
TexasInterconnect
Arizona Georgia US Aggregate
Thermoelectric Hydro Weighted Average
Gal
/kW
h

Water for Transportation in US
Life Cycle consumptive water use by different transportation fuel alternatives
(Source: Harto, C; et al., Life cycle water use of low‐carbon transport fuels, Energy Policy, 2010)

Transportation Alternatives:Plug-In Hybrid Electric vehicles (PHEVs) (Source: PNNL, 2007)
73% of the U.S. light duty vehicle fleet (cars, pickup trucks, SUVs, and vans) can be supported by existing electric power infrastructure
43% if only charging vehicles between 6pm-6am
This is equivalent to 52% of the nation’s oil usage (we import 50% of our oil)
27% of total greenhouse gas emissions can be reduced even if we use coal fired power plants
Key driver: overall improvement in efficiency of electricity generation compared to the conversion process from crude oil to gasoline to the combustion in the vehicle
Utility cost (life-cycle) can be reduced between 7%~26%.
The equivalent price of gasoline for EV is $1.07, assuming average economy is 25 mpg.
9

Water for Mobility Network: Metro Atlanta, 2010 and 2030 Conditions
Source: Jeffrey Yen (2011) A system model for assessing water consumption across transportation modes in urban mobility networks, Masters thesis

Outline Infrastructure Ecology Decentralized Water
Resource Development: Low Impact Development (LID)
Decentralized Energy Production: Combined Heat and Power (CHP)
Policies for Adoption of Rain Water Harvesting and Compact Living
Urban Development Simulation and Large Scale Water Savings Carbon Emission Reductions from LID and CHP
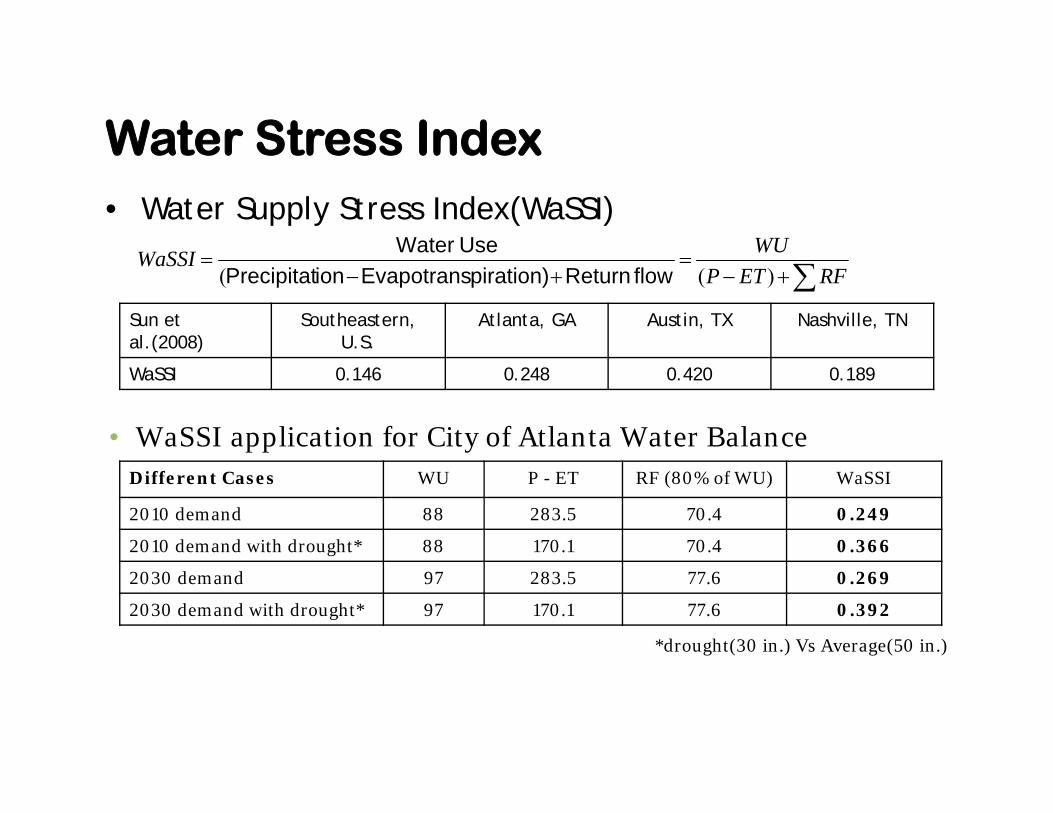
Water Stress Index• Water Supply Stress Index(WaSSI)
RFETPWUWaSSI
)(( flow Returnpiration)EvapotransionPrecipitatUse Water
Different Cases WU P - ET RF (80% of WU) WaSSI
2010 demand 88 283.5 70.4 0.249
2010 demand with drought* 88 170.1 70.4 0.366
2030 demand 97 283.5 77.6 0.269
2030 demand with drought* 97 170.1 77.6 0.392
• WaSSI application for City of Atlanta Water Balance
*drought(30 in.) Vs Average(50 in.)
Sun et al.(2008)
Southeastern, U.S.
Atlanta, GA Austin, TX Nashville, TN
WaSSI 0.146 0.248 0.420 0.189

Decentralized Water Production – Low Impact Development - LID Best Management Practices(BMPs)
• Bioretention • Cistern • Constructed
Wetland • Dry Pond • Grassed Swale • Green Roof • Infiltration Basin • Infiltration Trench • Porous Pavement • Rain Barrel • Sand Filter • Vegetated Filterstrip • Wet Pond
Sand filter near garages, NYC
Rain Barrel and Green Roof, Atlanta (Southface)
Vegetated Swale, Vancouver(Crown Street)

Case Study: Storm water treatment for Vancouver
• It was estimated that there was a $4 billion expense to separate stormwater systems from wastewater. However, when they opted for LID technique implementation there was an estimated $400 million income from increased property value and associated tax revenue.
• The new concept was aptly titled “From Pipe Dreams to Healthy Streams: A Vision for the Still Creek Watershed“

Interdependency between Water Infrastructure and Socio-Economic Environment
Source: Philadelphia Water Department (2009) Philadelphia combined sewer overflow long term control plant update, supplemental document volume 2; Triple bottom line analysis
Philadelphia case– LID (low impact development) options instead of
storage tunnel for CSO (combined sewer overflow) control in watershed areas;
– Total net benefit over the 40-year projection : 2.2 billion (LID for 25 % runoff), 4.5 billion (LID for 100 % runoff), 2009 USD.

ATL Case Study: Implemented LID Technologies
Grasspaver surface for parking Vegetated medians and sidewalksXeriscaping
Street surface runoff harvesting w/ rain garden + underground tank
Rooftop or building top harvestingW/ aboveground cistern
Green space runoff harvesting w/ underground tank
For single family residential zones, - Rooftop harvesting only because harvesting potential >> water demand for irrigation, toilet flushing, and laundry

Flood Risk ControlFor extreme rainfall events (Atlanta)
Return period Rainfall intensity, in./24hr
1‐yr 3.36
2‐yr 4.08
5‐yr 4.8
10‐yr 5.52
25‐yr 6.48
50‐yr 7.2
100‐yr 7.92
Rain gardens occupying 11 %(R‐1) ~ 16% (RG‐6) of community size control 100 % of stormwater runoff generated in extreme rainfall events up to 8 in.

Water Flowrates with Rainwater Harvesting individual water use (91 gal/capitaday) in 2‐story apartment (RG‐1) Implemented LID technologies ‐ rainwater harvesting, grass pavement, rain
gardens, and xeriscaping Outdoor irrigation (gal/capitaday ): 12 1 Stormwater runoff (kgal/capitayr) : 16 0

Water Flowrates with Reclamation Option
Unit: gal/(capitaday)
individual water use (91 kgal/capitaday) in 2‐story apartment (RG‐1)

Water Demand and Decentralized Water Supply
Zoning Code Single family residential communities Multi‐family residential communities
Zoning code R‐1 R‐2 R‐3 R‐4 R‐5 RG‐1 RG‐2 RG‐3 RG‐4 RG‐5 RG‐6
Population (10 acre) 16 31 72 138 169 147 316 632 1,352 2,904 5,808
0%
20%
40%
60%
80%
100%
120%
140%
160%
180%
200%
0
20
40
60
80
100
120
140
160
180
200
1 1.5 2 2.5 3 3.5 4
Satisfaction, % of total dem
and
106gal/y
r
log (Population), per 10 acresTotal water demand% water demand for irrigation, toilet flushing, and laundry (overlapped with purple line)% satisfaction by rainwater harvesting% satisfaction by reclamation% satisfaction by rainwater harvesting + reclamation
Single‐family residential zones (w/ rooftop harvesting only)
Multi‐family residential zones(w/ 3 harvesting options)

Energy Use for Decentralized Options
Energy use for water, wastewater, rainwater harvesting, and reclaimed water
Water (the City of Atlanta)
Wastewater (the City of Atlanta)
Harvested rainwaterw/ Carbon block filter and UV
disinfection + Pumping (3 story apartment)
Reclaimed waterw/ Submerged membrane
bioreactor + Pumping (3 story apartment)
kWh/kgal 2a 3.2a 0.1b + 0.25 3c + 0.25Note aGeorgia Power; bAmerican Water; cOrtiz et al. (2006)
Energy use for water supply and wastewater treatment
w/o any option0.44
kWh/capitaday
w/ rainwater harvesting
0.34kWh/capitaday
w/ reclamation0.32
kWh/capitaday
Vs. Vs.
For individual water use (91 kgal/capitaday) in 2‐story apartment (RG‐1)
Outline Infrastructure Ecology Decentralized Water
Resource Development: Low Impact Development (LID)
Decentralized Energy Production: Combined Heat and Power (CHP)
Policies for Adoption of Rain Water Harvesting and Compact Living
Urban Development Simulation and Large Scale Water Savings Carbon Emission Reductions from LID and CHP

Diagram of CHP System Analyzed – Winter Mode– Air Cooled!! No Water Needed
Natural Gas Compressor
Microturbine(w/generator in set)
Heat Recovery Unit
Absorption Chiller
Chilled Water Coil
Heating Coil
Electricity fed to building
Domestic Hot Water
Chilled Air
Hot Air
Hot exhaust gasT = 500–600º F
Microturbine w/ onboard gas compressor
Low pressurenatural gas
Exhaust air(to atmosphere)
Hot waterT = 150-180º F
Hot water
Hot water
Chilled waterReturn water
Return water
Return waterT = 135–165º F
Electrical Transformer
480 V 3-phase electrical output
Pipe loss coefficient = 0.9
Pipe loss coefficient = 0.9
Pipe loss coefficient = 0.9η = 0.75
η = 0.75
Resources for System Configuration:– Petrov, A. Y., et al. (2005). "Dynamic Performance of a 30‐kW
Microturbine‐Based CHP System." ASHRAE Transactions 111(1): 802‐809.– Chamra, L. (2008). Micro Cooling, Heating, and Power (Micro‐CHP) and
Bio‐Fuel Center, Mississippi State University, Mississippi State University.– Rocha, M. S., et al. (2012). "Performance Tests of Two Small
Trigeneration Pilot Plants." Applied Thermal Engineering 41(0): 84‐91.– (2003). Environmental Technology Verification Report: Ingersoll‐Rand
Energy Systems IR PowerWorks 70 kW Microturbine System. D. A. Kirchgessner, Greenhouse Gas Technology Center: Southern Research Institute.
– (2003). Environmental Technology Verification Report: Combined Heat and Power at a Commercial Supermarket‐ Capstone 60 kW MicroturbineCHP System. D. A. Kirchgessner, Greenhouse Gas Technology Center: Southern Research Institute.
Legend:
= End use products
= System components
Efficiency = 23%
Efficiency = 68%
Efficiency = 68%

Diagram of CHP System Analyzed – Summer Mode– Air Cooled!! No Water Needed
Natural Gas Compressor
Microturbine(w/generator in set)
Heat Recovery Unit
Absorption Chiller
Chilled Water Coil
Heating Coil
Electricity fed to building
Domestic Hot Water
Chilled Air
Hot Air
Hot exhaust gasT = 500–600º F
Microturbine w/ onboard gas compressor
Low pressurenatural gas
Exhaust air(to atmosphere)
Hot waterT = 150-180º F
Hot water
Hot water
Chilled waterReturn water
Return water
Return waterT = 135–165º F
Electrical Transformer
480 V 3-phase electrical output
Pipe loss coefficient = 0.9
Pipe loss coefficient = 0.9
Pipe loss coefficient = 0.9η = 0.75
η = 0.75
Resources for System Configuration:– Petrov, A. Y., et al. (2005). "Dynamic Performance of a 30‐kW
Microturbine‐Based CHP System." ASHRAE Transactions 111(1): 802‐809.– Chamra, L. (2008). Micro Cooling, Heating, and Power (Micro‐CHP) and
Bio‐Fuel Center, Mississippi State University, Mississippi State University.– Rocha, M. S., et al. (2012). "Performance Tests of Two Small
Trigeneration Pilot Plants." Applied Thermal Engineering 41(0): 84‐91.– (2003). Environmental Technology Verification Report: Ingersoll‐Rand
Energy Systems IR PowerWorks 70 kW Microturbine System. D. A. Kirchgessner, Greenhouse Gas Technology Center: Southern Research Institute.
– (2003). Environmental Technology Verification Report: Combined Heat and Power at a Commercial Supermarket‐ Capstone 60 kW MicroturbineCHP System. D. A. Kirchgessner, Greenhouse Gas Technology Center: Southern Research Institute.
Legend:
= End use products
= System components
Efficiency = 23%
Efficiency = 68%
Efficiency = 51%

Decentralized Energy Production-Perkins + Will, Atlanta Office
• LEED Platinum Building:– Microturbines are used to for heating and cooling using Adsorption
Chillers– Radiant heating floors system– Microturbines also supply 40% of the total electricity
Adsorption Chiller65 kW Microturbine Perkins+Will Office Building
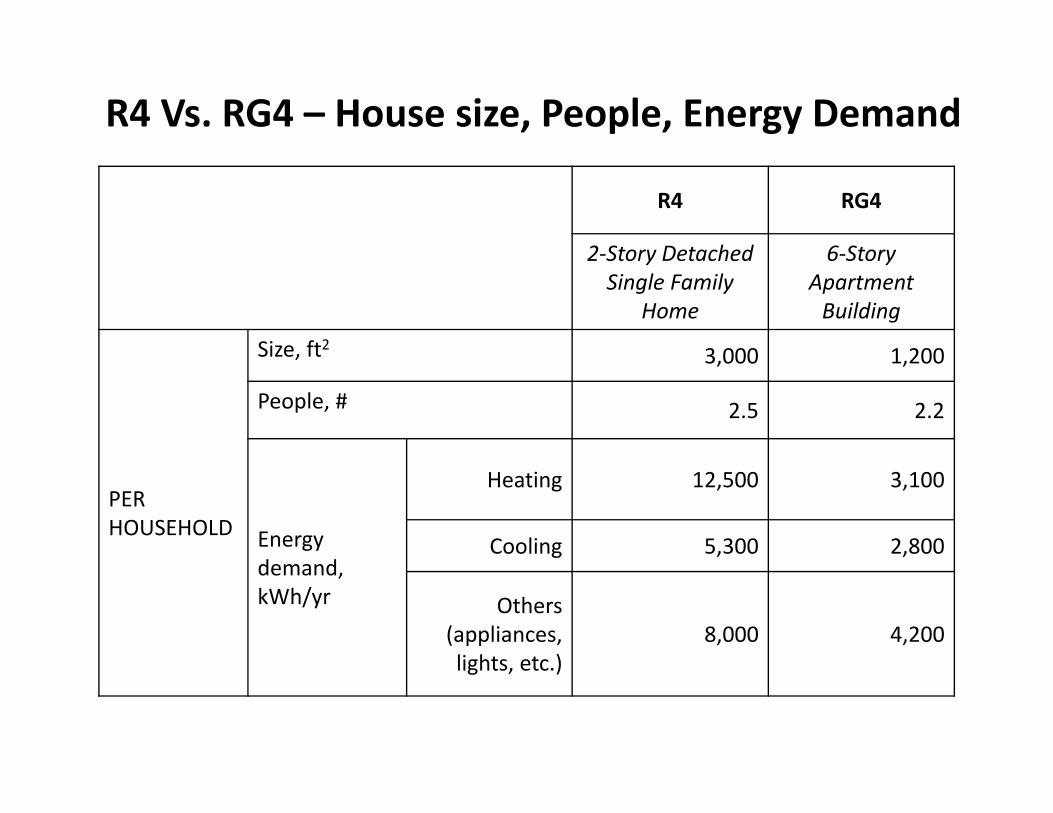
R4 Vs. RG4 – House size, People, Energy Demand
R4 RG4
2‐Story Detached Single Family
Home
6‐Story Apartment Building
PER HOUSEHOLD
Size, ft2 3,000 1,200
People, # 2.5 2.2
Energy demand,kWh/yr
Heating 12,500 3,100
Cooling 5,300 2,800
Others(appliances, lights, etc.)
8,000 4,200

Summary of building energy requirements met by CHP
30kW MT
Electricity: 477MWh (54%)
Thermal: 452.5 MWh (123%)
60kW MT
Electricity: 778 MWh (66%)
Thermal: 900 MWh (140%)
Georgia Power
Electricity: 218MWh (46%)
Electricity: 260MWh (34%)
RG4: 2 6‐story apartment buildings
R4: 12 Single Family homes
Thermal load includes heating and cooling demand
437600 Gal985300 Gal Water for energy savings

Environmental Impacts ‐ Emissions for CHP Scenarios vs Centralized Energy
• Analysis for 30 kW MT (R4: 12 single family homes)
Annual Emissions Analysis
CHP System
Displaced Electricity Production
Displaced Thermal
ProductionEmissions/Fuel
Reduction Percent Reduction
NOx (tons/year) 0.09 0.23 0.06 0.21 70%
SO2 (tons/year) 0.00 1.07 0.00 1.07 100%
CO2 (tons/year) 233 324 74 165 41%
CH4 (tons/year) 0.004 0.005 0.001 0.002 27%
N2O (tons/year) 0.000 0.005 0.000 0.005 91%
Total GHGs (CO2e tons/year) 233 325 74 166 42%
Carbon (metric tons/year) 58 80 18 41 41%
Fuel Consumption (MMBtu/year) 3,980 3,349 1,259 629 14%

Environmental Impacts – Emissions for CHP Scenarios vs Centralized Energy
• Analysis for 60 kW MT (RG4: 2 X 6 story apartments)
Annual Emissions Analysis
CHP System
Displaced Electricity Production
Displaced Thermal
ProductionEmissions/Fuel
Reduction Percent Reduction
NOx (tons/year) 0.18 0.42 0.17 0.41 70%
SO2 (tons/year) 0.00 1.91 0.00 1.91 100%
CO2 (tons/year) 465 579 202 316 40%
CH4 (tons/year) 0.009 0.008 0.004 0.003 28%
N2O (tons/year) 0.001 0.009 0.000 0.008 91%
Total GHGs (CO2e tons/year) 466 582 202 319 41%
Carbon (metric tons/year) 115 143 50 78 40%
Fuel Consumption (MMBtu/year) 7,960 5,994 3,457 1,491 16%

NO‐PV 40% PV

42
Intermittency of PV Generation• We estimate the generation of PV systems with a 1.4 MW
capacity dispersed throughout the 19 sites in Georgia• Then, we scale PV output to produce a capacity of 10 % of
38.7 GW peak.
42
Date June/24/2010σ of incremental changes in W 59,790,960
Peak(GW) 2.71PV Output(GWh/day) 19.36
Variation in PV output caused from transient clouds
44
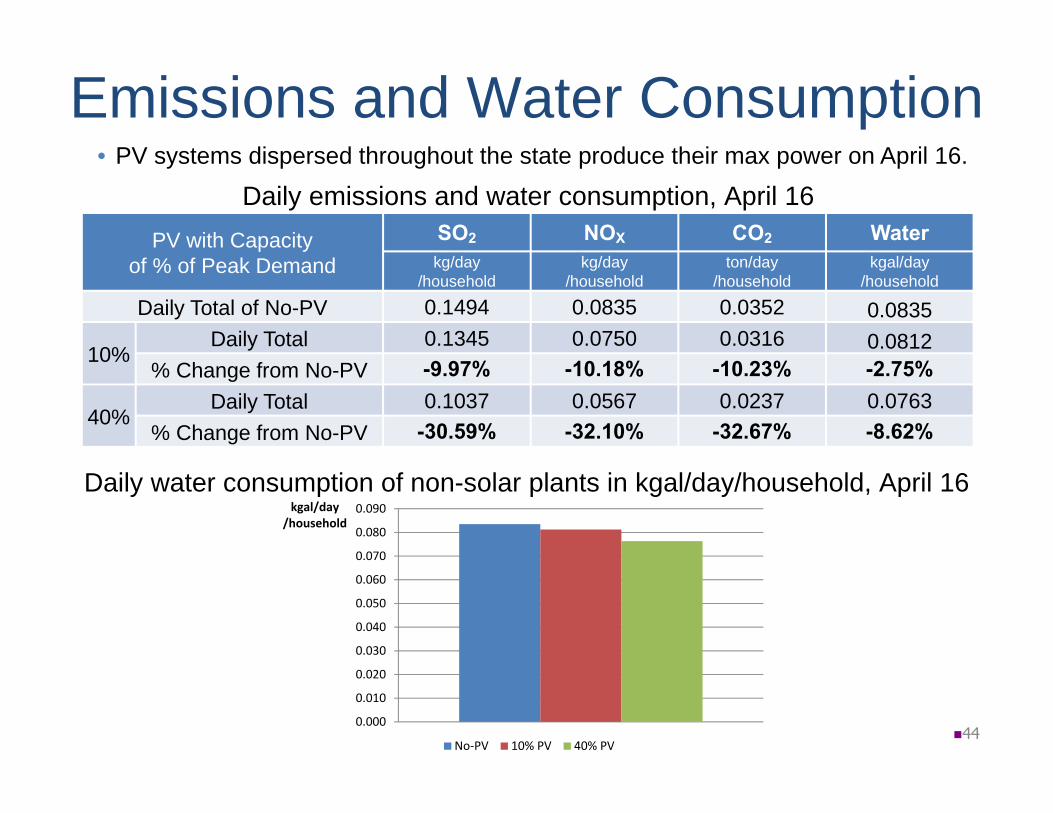
Emissions and Water Consumption
PV with Capacityof % of Peak Demand
SO2 NOX CO2 Waterkg/day
/householdkg/day
/householdton/day
/householdkgal/day
/household
Daily Total of No-PV 0.1494 0.0835 0.0352 0.0835
10%Daily Total 0.1345 0.0750 0.0316 0.0812
% Change from No-PV -9.97% -10.18% -10.23% -2.75%
40%Daily Total 0.1037 0.0567 0.0237 0.0763
% Change from No-PV -30.59% -32.10% -32.67% -8.62%
Daily emissions and water consumption, April 16
Daily water consumption of non-solar plants in kgal/day/household, April 16
0.000
0.010
0.020
0.030
0.040
0.050
0.060
0.070
0.080
0.090kgal/day/household
No‐PV 10% PV 40% PV
• PV systems dispersed throughout the state produce their max power on April 16.

Energy for Transportation: Atlanta
45
0
1
2
3
4
5
6
7
8Co
nv.
Gas
olin
e
Dies
el
CNG
E-85
FFV
(Co
rn)
SI G
asol
ine
HEV
Dies
el H
EV
SI P
HEV
Dies
el P
HEV EV
Dies
el B
us
MAR
TA C
lean
Die
sel B
us
MAR
TA C
NG
Bus
MAR
TA R
ail
Ene
rgy
Use
Pe
r Pa
sse
nge
r D
ista
nce
(M
J/p
ers
on-k
m)
-100
0
100
200
300
400
500
Conv
. G
asol
ine
Dies
el
E85
FFV
(Cor
n)
CNG
SI G
asol
ine
HEV
Dies
el H
EV
SI P
HEV
Dies
el P
HEV EV
Dies
el B
us
MAR
TA C
lean
Die
sel B
us
MAR
TA C
NG
Bus
MAR
TA H
eavy
Rai
l
CO
2 O
utp
ut
Per
Pass
en
ger
Dis
tan
ce
(g/p
ers
on-k
m)
PTW CO2 Output Per Passenger DistanceWTP CO2 Output Per Passenger Distance
Preliminary Energy & CO2 Results, Atlanta (Base Case) Courtesy: Bras, B; GT
• Poor environmental performance of electric vehicles, all sizes, due to coal fired power plants
– Georgia Power’s Plant Bowen emits about 0.9kg CO2/kWh• MARTA rail & bus performance bad due to low ridership

Plug-in Hybrid Electric Vehicles (PHEVs) andVehicle-to-Grid (V2G) power
Credit: Kempton and Tomić, 2005
PHEVs can send power back to the grid when parked, and function as distributed storage for intermittent energy from renewable sources
US demand-supply balances during maximum demand with various V2G ratios in 2045
30% V2G penetration could reduce ~100 GW or about ⅓ of the total peak demand of ~300 GW in US by 2045
Source: Modelling Load Shifting Using Electric Vehicles in a Smart Grid Environment – © OECD/IEA 2010

False Creek Neighborhood Energy UtilityVancouver, BC: City of Vancouver
Sewage heat recovery supplies 70% of annual energy demand and reduces ghg 50%
Credit: Ellen Dunham-Jones

RENEWABLE RESOURCES AND TECHNOLOGIES
Only currently commercial technologies were modeled (no EGS, ocean, floating wind) with incremental and evolutionary improvements RE characteristics including location, technical resource potential, and grid output characteristics were considered
Biopower ~100GW• Stand-alone• Cofired with coal
Hydropower ~200GW• Run-of-River
Solar CSP ~37,000 GW• Trough• Tower
With thermal storage
Solar PV ~80,000 GW(rooftop PV ~700 GW)• Residential• Commercial• Utility Scale
Geothermal ~36 GW• Hydrothermal
Wind ~10,000GW• Onshore• Offshore fixed-bottom
Source: NREL. 2012. “Renewable Electricity Futures Study”. http://www.nrel.gov/analysis/re_futures/.

HIGH RENEWABLE REDUCES EMISSIONSAND WATER USE
80% renewable electricity in 2050 could lead to: • ~ 80% reduction in GHG emissions (combustion-only and full life-
cycle) • ~ 50% reduction in electric sector water use (withdrawals and
consumption) Source: NREL. 2012. “Renewable Electricity Futures Study”. http://www.nrel.gov/analysis/re_futures/.

Outline Infrastructure Ecology Decentralized Water
Resource Development: Low Impact Development (LID)
Decentralized Energy Production:mCombinedHeat and Power (CHP)
Policies for Adoption of Rain Water Harvesting and Compact Living
Urban Development Simulation and Large Scale Water Savings Carbon Emission Reductions from LID and CHP

Housing Market House inventory:
apartment, single-family Infrastructure service Stormwater management(1st yr)Transportation improvement (5th
yr)
Prospective homebuyers Social-economic attributes Preference Evaluate candidate houses Decide the biding house Determine willingness to pay
Homeowners Property valueLiving community Green space Transportation accessibility
DevelopersAsking price New house investment decision Consider LID options if impact fee exists
Apartment vs. Single-family Transaction price Estate sale
Government• Collect property tax• Distribute property tax for infrastructure improvement
Bid price Asking Price
New houses
Impact fee ?
Infrastructure improvement
Agent-based Housing Marking Simulation

Community Design
10 acre-size residential communityHousing% 13.8%
Infrastructure% 22.9%Public space% 63.3%Dwelling unit 270Population 675
Population density (Person/acre) 67.5
10 acre-size residential communityHousing% 73.5%
Infrastructure% 23.6%Public space% 2.9%Dwelling unit 44Population 110
Population density ( Person/acre) 11
Single‐family community
Apartment
House/Building Street Open Space Private Yard Front and
back yard

Impact FeeConstruction cost ($ per unit) profiles related to stormwater infrastructure
SF: single‐family houseAP: apartment homeLID: rainwater harvesting system with distributed storage tanks
oImpact fee as a non‐compliance penalty:o$13,000 per unit for single‐family houseo$1,500 per unit for apartment home
$0
$5,000
$10,000
$15,000
$20,000
$25,000
SF_LID AP_LID
Developer pay the costin private space
Government pays thecost in public space
Government pays allmoney
The increased cost of the developer using LID (e.g., permeable pavement, rain cistern/barrel, roadside swales) as compared to impermeable pavement, curbs and gutters for community construction.
The cost of government using LID for both types of communities was higher if the developer does not accept the LID techniques then the cost sharing between them.
Developers will use LID based on profit maximization expectation.

Modeling Scope
Urban areas
9 sq mile
Study Area: 9 sq mile greenfield land for residential development.Commercial development is ignored assuming no spatial effect in house location within the 9 sq mile area. Living utility in the area is associated with housing characters, neighborhood quality and accessibility. Housing characters are about house size and lot size; neighborhood quality is about the landscape design of open space adjunct to community; accessibility is about the transportation connectivity to other areas. Annual 1,000 perspective homebuyers visit the area for housing purchase.
Residential District
10 acre size community
oImpact fee for LID non‐compliance penalty:o$13,000 per unit for single‐family houseo$1,500 per unit for apartment home

Land Use Pattern Between Business As Usual (BAU) and More Sustainable Development (MSD)
: Single Family Homes : Apartment Homes
The total area for new development: 9 sq mi
More Sustainable Development
Business As Usual
Time: Year
Hou
seho
ld Num
ber
Hou
seho
ld Num
ber
0
5000
10000
15000
20000
25000
0 5 10 15 20 25 30
Total households
Households living in single‐family housesHouseholds living inapartments
0
5000
10000
15000
20000
25000
0 5 10 15 20 25 30
Scenarios Totalhouseholds
% of households living in apartment
BAU 23,630 35.0%
MSD 24,475 58.0%

Dynamics of House Price
Comparison with hedonic analysis as model validation P1: Price in the 1st year;P5: Price in the 5th yearP30: Price in the 30th
Simulated startingprice Estimated price
Single‐family house $347,699 $336,270 *
Apartment home $149,525 $144,262 **
* National Association of Home Builders (NAHB), House Price Estimator** NAHB, Apartment Rent Estimator
2) Percentage of house price increase up to the 5th year due to the increase of green space falls into (2.7%, 15%) in the literatures.
1)
$320,000
$330,000
$340,000
$350,000
$360,000
$370,000
$380,000
$390,000
$400,000
0 5 10 15 20 25 30
Time: YearBAU MSD
Single-family House
$120,000
$130,000
$140,000
$150,000
$160,000
$170,000
$180,000
$190,000
$200,000
0 5 10 15 20 25 30Time: Year
BAU MSD
Apartment Home

Property Tax Revenues• BAU versus MSD• Accumulation of property tax revenues for 30 years
– Surplus at time t = property tax revenues at time t – new construction cost for stormwater management at time t + Surplus at time t-1
– Property tax revenues at time t = house value at time t * 0.4 * 0.01 * number of households
‐$100
‐$50
$0
$50
$100
$150
$200
$250
$300
$350
1 2 3 4 5 6 7 8 9 10 11 12 13 14 15 16 17 18 19 20 21 22 23 24 25 26 27 28 29 30
Millions
Time: Year
BAU
MSD
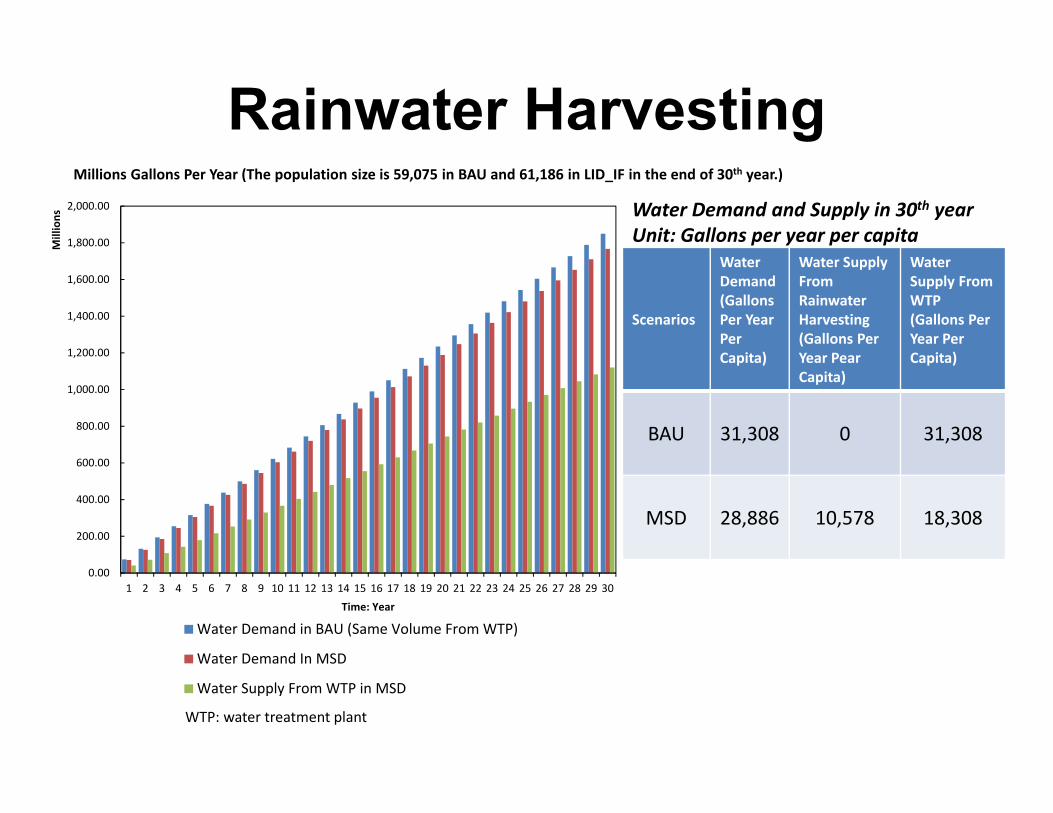
Rainwater Harvesting
0.00
200.00
400.00
600.00
800.00
1,000.00
1,200.00
1,400.00
1,600.00
1,800.00
2,000.00
1 2 3 4 5 6 7 8 9 10 11 12 13 14 15 16 17 18 19 20 21 22 23 24 25 26 27 28 29 30
Millions
Time: Year
Water Demand in BAU (Same Volume From WTP)
Water Demand In MSD
Water Supply From WTP in MSD
Millions Gallons Per Year (The population size is 59,075 in BAU and 61,186 in LID_IF in the end of 30th year.)
WTP: water treatment plant
Scenarios
Water Demand (GallonsPer Year Per Capita)
Water Supply From Rainwater Harvesting (Gallons Per Year Pear Capita)
Water Supply From WTP (Gallons Per Year Per Capita)
BAU 31,308 0 31,308
MSD 28,886 10,578 18,308
Water Demand and Supply in 30th yearUnit: Gallons per year per capita

Outline Infrastructure Ecology Decentralized Water
Resource Development: Low Impact Development (LID)
Decentralized Energy Production:mCombinedHeat and Power (CHP)
Policies for Adoption of Rain Water Harvesting and Compact Living
Urban Development Simulation and Large Scale Water Savings Carbon Emission Reductions from LID and CHP

RESIN Meeting Sept. 24, 2009
SPATIAL DATABASES FOR URBAN MODELING ‐ 1
The SMARTRAQ project
Supports research on land
use impact on transportation
and air quality
1.3 million parcels in the 13
metropolitan Atlanta non‐
attainment counties

RESIN Meeting Sept. 24, 2009
SMARTRAQ DATA AND ATTRIBUTES Address Road Type City Zip Code Owner Occupied Commercial/Residential Zoning Sale Price Sale Date Tax Value Assessed Value Improvement Value Land Value Year Built No. of Stories Bedrooms Parking Acreage
Land Use Type Number of Units X,Y Coordinate
Estimated Sq Feet Total Sq Feet

Business As UsualYear 2030
More Sustainable Development Year 2030
Existing Land Use Base Year 2005
Growth Scenarios in Atlanta
Courtesy: French, S; GT

2030 DevelopmentSummary Table (# of Households)
Scenarios Single Family (R4) Apartment (RG4)
2030 (Additional)BAU 613652 191700
MSD 501313 304812
2005 (Current) 1170283 12728

59,500
30,600
26,900
22,900
11,80010,200
0
10000
20000
30000
40000
50000
60000
70000
Base Year BAU MSD
2005 2030
GWh
Energy from Grid
Energy from Grid w/ CHP
Projected additional residential energy demand from grid
62% reduction
62% reduction
BAU= Business As Usual MSD= More Sustainable Development
# of Households: Single Family: 1170283Apartments: 12728
Single Family: 613652Apartments: 191700
Single Family: 501313Apartments: 304812
61% reduction

268
104
137
55
121
47
0
50
100
150
200
250
300
grid grid + CHP grid grid + CHP grid grid + CHP
Base year BAU MSD
2005 2030
MGD (1
06gallo
n pe
r day)
Water for additional residential energy projections
61% reduction 62% reduction
61% reduction

Domestic Water Projection(with low flow fixture + rooftop rainwater harvesting + Reclamation)
507
800729 707
102163
108 1080
100
200
300
400
500
600
700
800
900
2005 2030 2030(w/ low flow
fixture)
2030(w/ low flowfixture +rooftoprainwaterharvesting)
2005 2030 2030(w/ low flow
fixture)
2030(w/ low flowfixture +rooftoprainwaterharvesting)
Base year BAU MSD Base year BAU MSD
Water withdrawal Water consumption
MGD (106
gallon pe
r day)
57 %
11.6 %8.8 %
60 % 34 %
Water Withdrawal Water Consumption
32865%
52065%
45663%
44363%
Reclamation

Potential GHG reductions in 2030• The reduction is based on the electricity produced by CHP replacing that from the
centralized power plant.• Base year case assumes that all existing homes are retrofitted to facilitate a CHP system. • For MSD implementation the CO2e Savings is 0.307 gT
623
173143
374
104 86
0
100
200
300
400
500
600
700
Base year BAU MSD
2005 2030
Million Tons of C
O2e
w/o CHP
w/ CHP
~ 40% Reduction in all cases

Summary• Urban Systems Are All
Connected and More Efficiency Can be Achieved by Looking at Their Interactions
• Decentralized Energy and Combined Heat and Power Can Save Energy and Water
• Decentralized Water / Low Impact Development Can Save Water, Energy and Money
• Land Use/ Planning Is Vital in Reducing the Impact Of Urban Systems and Examining Their Interactions
• Agent Based Models May Be Useful to Examine the Adoption Rate of Policy Instruments