Embed Size (px)
Citation preview

L/O/G/O
1
Waste to Energy Status
in Indonesia
Fadjar Goembira
Andalas University, INDONESIA

Where is Indonesia?

…the archipelago
Around
17,000
islands
1/8 world perimeter
Around
260
million
people
Highest peak
4,884m above
sea level
Go Green – DJEBTKE
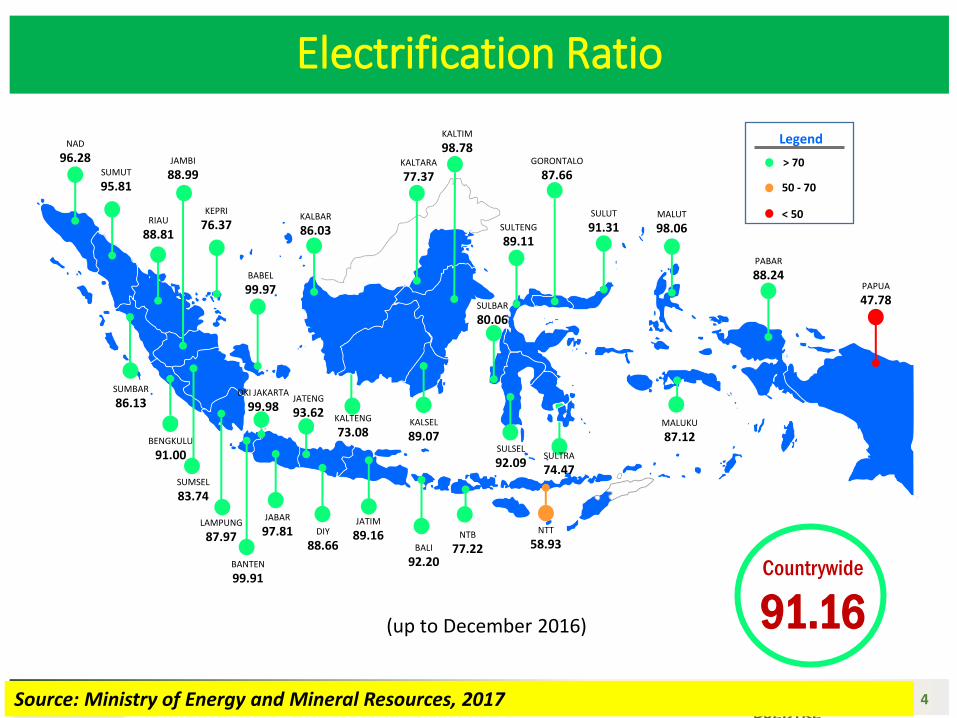
Electrification Ratio
> 70
50 - 70
< 50
Countrywide
91.16
Legend NAD
96.28 SUMUT
95.81
RIAU
88.81
JAMBI
88.99
BABEL
99.97
KEPRI
76.37
BENGKULU
91.00
LAMPUNG
87.97
SUMBAR
86.13
SUMSEL
83.74
BANTEN
99.91
JABAR
97.81 DIY
88.66
DKI JAKARTA
99.98 JATENG
93.62
BALI
92.20
JATIM
89.16
KALBAR
86.03
NTB
77.22
NTT
58.93
PAPUA
47.78
PABAR
88.24
MALUKU
87.12
MALUT
98.06
SULTRA
74.47
SULSEL
92.09
KALSEL
89.07
KALTENG
73.08
KALTARA
77.37
KALTIM
98.78
SULBAR
80.06
GORONTALO
87.66
SULTENG
89.11
SULUT
91.31
(up to December 2016)
4 Source: Ministry of Energy and Mineral Resources, 2017

www.themegallery.com
Solid waste generation Projection of solid waste generation
65.0966.00
66.9267.86
68.81
63
64
65
66
67
68
69
70
2015 2016 2017 2018 2019
Solid
Wsa
te (
mill
ion
to
n)
Year
Source: Ministry of Environment and Forestry, 2017
Type of solid waste
(2016)
Food waste40%
Yard waste17%
Paper waste10%
Plastic waste16%
Metal waste4%
Fabric waste3%
Rubber waste2%
Glass waste2%
Other waste6%
Source of solid waste (2016)
Household 36%
Office9%
Traditional market
24%
Shopping center
14%
Public area12%
Other 5%

www.themegallery.com
Handling of solid waste
Unhandled waste25%
Handled waste75%
Recycled waste, 11%
Landfilled, 64%
Unhandled waste33%
Handled waste67%
Recycled waste, 11%
Landfilled, 56%
Unhandled waste41%
Handled waste59%
Recycled waste, 9%
Landfilled, 50%
Source: Ministry of Environment and Forestry, 2017
17 big (between 500 thousand
and 1 million population) cities
157 medium and small (less
than 500 thousand population)
cities
14 metropolitan (more than 1
million population) cities
Nationally,
67% solid
waste is
handled

www.themegallery.com
7
Source: Ministry of Civil Works, 2016
www.themegallery.com
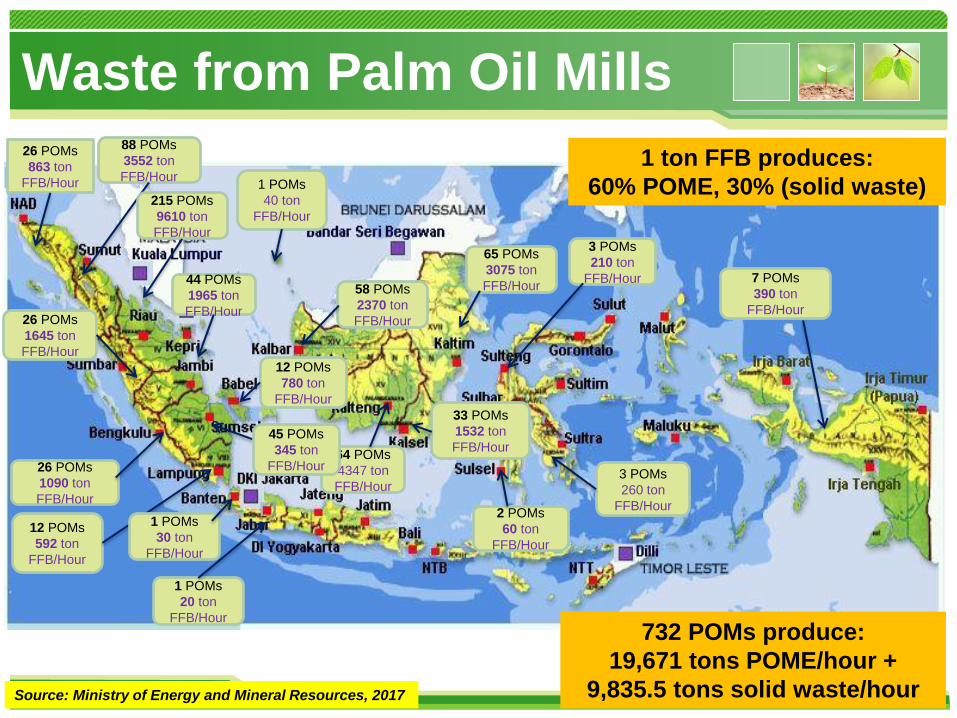
Waste from Palm Oil Mills
8
26 POMs
863 ton
FFB/Hour
88 POMs
3552 ton
FFB/Hour
26 POMs
1645 ton
FFB/Hour
215 POMs
9610 ton
FFB/Hour
1 POMs
40 ton
FFB/Hour
44 POMs
1965 ton
FFB/Hour
26 POMs
1090 ton
FFB/Hour
12 POMs
592 ton
FFB/Hour
1 POMs
30 ton
FFB/Hour
1 POMs
20 ton
FFB/Hour
58 POMs
2370 ton
FFB/Hour
64 POMs
4347 ton
FFB/Hour
33 POMs
1532 ton
FFB/Hour
65 POMs
3075 ton
FFB/Hour
3 POMs
210 ton
FFB/Hour
3 POMs
260 ton
FFB/Hour 2 POMs
60 ton
FFB/Hour
7 POMs
390 ton
FFB/Hour
12 POMs
780 ton
FFB/Hour
45 POMs
345 ton
FFB/Hour
732 POMs produce:
19,671 tons POME/hour +
9,835.5 tons solid waste/hour Source: Ministry of Energy and Mineral Resources, 2017
1 ton FFB produces:
60% POME, 30% (solid waste)

www.themegallery.com
9
Source: Ministry of Energy and Mineral Resources, 2017

www.themegallery.com
Bioenergy power plant
5.5 GW
Main Policy for Renewable Energy
• Energy conservation, which also aimed
to reduce green house gas emission
(29% reduction in 2030 from BAU, 41%
with international supports)
• Energy diversification, i.e. 23% New
and Renewable Energy (NRE) share on
national energy mixed by 2025
10
23%
25%30%
22% NRE
Oil
Gas
Coal
~ 400 MTOE
Source: Ministry of Energy and Mineral Resources, 2017

LAW NO. 30 year 2007 on Energy
GOVERNMENT REGULATION NO. 79 year 2014 on National Energy Policy
PRESIDENTIAL INSTRUCTION NO. 1 year 2006 on
Provision and Utilization, of Biofuel as Other Fuel
MINISTERIAL OF ENERGY AND MINERAL RESOURCES REGULATION NO. 32 year 2008
on Supply, Utilization, & Trading of Biofuel as Other Fuel
Prioritize the supply and utilization of renewable
energy, one of which is bioenergy.
Biofuel is targeted to contribute 10% to the national energy mix
by 2025.
Instructions related to the Minister, Governor and Mayor to
take action in order to accelerate the provision and
utilization of biofuel;
1. Prioritize the supply and utilization of biofuel,
2. Mandatory biofuel utilization framework in various sectors,
3. Regulate the type, standard and quality of biofuel,
4. Set the pricing policy,
5. Regulate biofuel business and trade activities. MINISTERIAL OF ENERGY AND MINERAL RESOURCES
REGULATION NO. 25 year 2013, No. 20 year 2014 & NO. 12 year 2015
an amendment to Regulation of MEMR No. 32 of 2008.
MINISTERIAL OF ENERGY AND MINERAL RESOURCES REGULATION No. 50 year 2017
Accelerate the mandatory utilization of biofuel
Feed-in Tariff for electricity generated from NRE
MINISTERIAL OF ENERGY AND MINERAL RESOURCES REGULATION No. 26 year 2016
CPO Fund to ensure the sustainability of Palm Oil and
Biodiesel Industry
POLICIES AND REGULATIONS (1)
Source: Ministry of Energy and Mineral Resources, 2017

1. LAW NO. 30 YEAR 2007 concerning on Energy
• Priority supply and use of renewable energy, one of them is bioenergy
2. LAW NO. 18 YEAR 2008 concerning on Waste Management
• Management of MSW to improve people’s health, environment quality, and waste as a resource
3. LAW NO. 32 Year 2009 concerning on Environmental Protection and Management
• Protection and environmental management is a systematic and integrated efforts are being made to preserve the environment and prevent pollution and / or damage to the environment.
3. GOVERNMENT REGULATION NO 79 YEAR 2014 concerning on National Energy Policy
• Optimize the utilization of biofuel • Increase NRE contribution in the total energy mix up to 23% by 2025 and 31% by 2050 • Energy leasticity less that 1 by 2025
4. GOVERNMENT REGULATION NO 27 Year 2012 Concerning Environmental Permits
• Regulating permits for Environmental Impact Assesment, Environmental Management Effort and Environmental Monitoring Effort (UKL/UPL), & Statement of Environmental Management (SPPL)
5. Other Regulations
12 Source: Ministry of Energy and Mineral Resources, 2017
POLICIES AND REGULATIONS (2)
www.themegallery.com
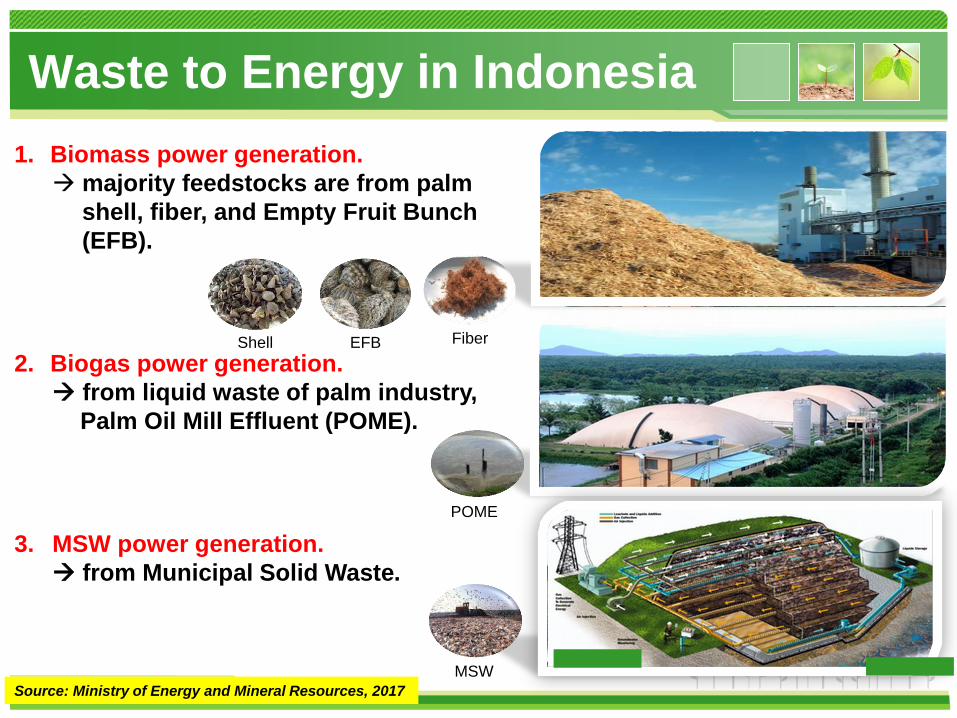
Waste to Energy in Indonesia
1. Biomass power generation.
majority feedstocks are from palm
shell, fiber, and Empty Fruit Bunch
(EFB).
2. Biogas power generation.
from liquid waste of palm industry,
Palm Oil Mill Effluent (POME).
3. MSW power generation.
from Municipal Solid Waste.
Shell Fiber EFB
POME
MSW
Source: Ministry of Energy and Mineral Resources, 2017

www.themegallery.com
NoPotential
(MWe)Unit Sumatera Kalimantan
Jawa-Bali-
Madura
Nusa
Tenggara Sulawesi Maluku Papua Total
1 Palm oil MWe8,812 3,384 60 - 323 - 75 12,654
2 Sugar cane MWe399 - 854 - 42 - - 1,295
3 Rubber MWe1,918 862 - - - - - 2,781
4 Coconut MWe53 10 37 7 38 19 14 177
5 Rice husk MWe2,255 642 5,353 405 1,111 22 20 9,808
6 Corn MWe408 30 954 85 251 4 1 1,733
7 Cassava MWe110 7 120 18 12 2 1 271
8 Wood MWe1.212 44 14 19 21 4 21 1,335
9 Cow dung MWe96 16 296 53 65 5 4 535
10 MSW MWe326 66 1.527 48 74 11 14 2,066
Total potential MWe 15,588 5,062 9,215 636 1,937 67 151 32,654
Biomass Potential for Electricity
14
Source: Ministry of Energy and Mineral Resources, 2017

www.themegallery.com
Development of Waste to Energy
15
0
20
40
60
80
100
120
140
160
180
200
20062010
20112012
20132014
20152016
2017
1734
56 68 70 81.2
113.2131
186
ON-GRID installed capacity of Electric Power Plants from
biomass, biogas and municipal solid waste in 2016 are 186MW:
• Solid Palm Oil Waste: 123.8 MW
• Liquid Palm Oil Waste/POME: 9.6 MW
• MSW: 16 MW
• Other biomass: 34 MW
Source: Ministry of Energy and Mineral Resources, 2017
OFF GRID = 1,645 MW
Total ON + OFF Grid= 1,831 MW
Target (2025): 5.5 GW

www.themegallery.com 16
No. Company COD Type MW
1 PT Growth S. 1 2006 EP 9.0
2 PT Listrindo K. 2006 IPP 5.0
3 PT Indah Kiat 2006 EP 3.0
4 PT Belitung E. 2010 IPP 7.0
5 PT Growth S. 2 2010 EP 10.0
6 PT Growth Asia 2011 EP 10.0
7 PT Navigat O. 2011 IPP 12.0
8 PT Navigat O. 2012 IPP 2.0
9 PT Growth Asia 2012 EP 10.0
10 PT Navigat O. 2013 IPP 2.0
11 PT Austindo ANE 2014 IPP 1.2
12 PT Rimba P. 2014 EP 10.0
13 PT Victorindo 2015 EP 3.0
14 PT Harkat S. 2015 EP 10.0
15 PT Sumber O. 2015 IPP 1.6
16 PT Meskom A. S. 2015 EP 10.0
No. Company COD Type MW
17 Maju Aneka S. 2015 EP 1.0
18 Sukajadi Sawit 2015 EP 2.4
19 Mutiara Bunda 2015 EP 2.0
20 Sampurna 2015 EP 2.0
21 PT Riau P. E. 2016 EP 15.0
22 PTPN III 2016 EP 1.8
23 Sringo-ringo 2016 EP 1.0
24 Listrindo K. 2017 IPP 5.0
25 Tanjung Batu 2017 IPP 1.0
26 PT Riau P. E. 2017 EP 10.0
27 Rimba Palma 2 2017 EP 10.0
28 PT Harkat S. 2 2017 EP 20.0
29 PT Gunung P. L. 2017 EP 1.2
30 PT Inhil S. K. 2017 EP 5.0
31 PT United K. 2017 EP 0.8
32 PTPN X 2017 EP 2.0
Total 186.0 Source: Ministry of Energy and Mineral Resources, 2017

Plant Oil
Crops
Sun
Biodiesel
Production
Open
CO2
Cycle Combustion
CO2
Released
Closed
CO2
Cycle
Cooking
Extraction
Fossil Fuel
Refining
Waste Cooking Oil Jatropha curcas,
Cerbera manghas,
Terminalia cattapa
etc
VS
IMPROVEMENT IS NEEDED… BIODIESEL POLICY B20 (NOW); B30 (2020)

L/O/G/O
www.themegallery.com
Thank you very much for your kind attention…