Embed Size (px)
Citation preview
Waste Data Overview
June 2011
Waste Data Overview
May 2011 2
Contents
FIGURES AND TABLES ......................................................................................... 3
A: INTRODUCTION: .......................................................................................... 4
B: TOTAL WASTE GENERATION & MANAGEMENT: .................................... 6
B1: UK ................................................................................................................... 6
B2: England .......................................................................................................... 7
C: THE WASTE SECTORS: ............................................................................ 10
C1: Construction & demolition ............................................................................. 10
C2: Commercial & industrial ................................................................................ 12
C3: Local authority waste: ................................................................................... 15
C3.1 UK and international comparisons ............................................................................. 15
C3.2 England ...................................................................................................................... 17
C3.3 Household waste ........................................................................................................ 20
C4: Other waste: ................................................................................................. 24
C4.1 Packaging waste ........................................................................................................ 24
C4.2 Food waste .................................................................................................................... 25
C4.3 Hazardous waste ........................................................................................................... 26
D: GREENHOUSE GAS EMISSIONS FROM WASTE MANAGEMENT ......... 28
E: ANNEX ........................................................................................................ 29
1: Current EU & voluntary waste targets ........................................................... 29
F: GLOSSARY OF ACRONYMS ..................................................................... 31
Waste Data Overview
May 2011 3
Figures and Tables
Figure 1 Total UK waste generation, by sector, 2004 to 2008 ........................................ 6
Figure 2 Total UK waste management, by method, 2004 to 2008 .................................. 7
Figure 3 Total waste generation in England, by sector, 2004 to 2008 ............................ 8
Figure 4 Total waste generation in England, by waste type, 2008 .................................. 8
Figure 5 Construction & demolition waste management, England, 1999 to 2008 .................................................................................................. 10
Figure 6 A process flow diagram to track waste flows arising from the C&D sector .............................................................................................. 11
Figure 7 Total C&I waste by sector, waste type and management method, England, 2009 ................................................................................. 13
Figure 8 Municipal waste generation and management in the European Union, 2009 ................................................................................... 16
Figure 9 Management of LACW by GO region, England, 2009/10 ............................... 18
Figure 10 LACW composition, England 2006/07 .......................................................... 18
Figure 11 Fly tipping incidents by size, England 2007/08, 2008/09 & 2009/10 ......................................................................................................... 19
Figure 12 Green and dry recycling rates of household waste, England 1997/98 to 2009/10.......................................................................... 22
Figure 13 Local authority recycling rates, England, 2009 ............................................. 22
Figure 14 Household final consumption expenditure and waste arising, UK, 1990 to 2007 .............................................................................. 23
Figure 15 Frequency of personal recycling behaviours, England, 2009 .............................................................................................................. 24
Figure 16 Packaging recovery & total packaging in the UK waste stream, 1998 to 2009 ..................................................................................... 25
Figure 17 Weight of food & drink waste generated in the UK, split by disposal route ................................................................................................ 26
Figure 18 Treatment of hazardous waste, England & Wales, 2000 to 2009 .............................................................................................................. 27
Figure 19 Hazardous waste production in the European Union, 2008 .......................... 27
Table 1 C&I waste by region, England, 2002/3 & 2009 ................................................ 12
Table 2 C&I waste by broad business sector, England, 2009........................................14 14
Table 3 C&I waste by company size, as a percentage of total C&I waste, England, 2009 .................................................................................... 14
Tables 4 & 5 Household & LACW summary statistics, England, 1995/96 to 2008/09 ........................................................................................ 17
Waste Data Overview
May 2011 4
A: Introduction:
Waste generation in the UK can be divided into three main sectors; construction and demolition, commercial and industrial, and local authority collected waste. This document provides an overview of waste and recycling data in all three sectors. It summarises waste and recycling statistics on total waste arisings, international comparisons, materials including food, packaging and hazardous waste, and greenhouse gas emissions from waste management. It presents the latest figures and data sources in all three areas, in line with the Government’s Waste Policy Review published in June 2011.
This overview is not designed to be fully comprehensive of all the data available, but instead to give an up to date summary of the best available information at the time of publication.
Summary of key statistics presented in the overview:
Total waste figures
Waste production in the UK is gradually declining and reached 288.6mt in 2008, with the largest contribution coming from the construction and demolition sector. Of this total, 45 per cent was recovered while 48 per cent was deposited onto or into the land.
Similar to the UK, waste production in England is declining and reached 228.0mt of waste in 2008. Construction and demolition remains the largest contributing sector. In 2008, 43 per cent of England’s waste was disposed of into or onto the land, and 46 per cent was recovered.
Construction & demolition waste
In total, 86.9mt of construction and demolition waste was generated in England in 2008, of which 62 per cent was recycled or recovered and 26 per cent was sent to landfill.
Commercial & industrial waste
Commercial and industrial waste generation in England declined to 47.9mt in 2009. Of this total, 52 per cent was recycled or reused and 24 per cent sent to landfill.
Local authority collected waste
The UK generated a total 32.5mt of local authority collected waste in 2009, of which 49 per cent was landfilled and 42 per cent had some value recovered.
England generated 26.5mt of local authority collected waste in 2009/10, 23.7mt of which derived directly from households. Of this total, 39 per cent of local authority collected waste was sent for recycling and 47 per cent was landfilled.
Since 2002/03, total waste generated per household has declined to 1036kg per year. Of this total, almost 40 per cent was recycled, composted or reused. Green recycling in particular has increased, and compost now comprises the largest component of recycled household waste, replacing paper and card.
Waste Data Overview
May 2011 5
Other waste types
Packaging waste rose between 2001 and 2009 to 10.8mt. At the same time, total recovery and recycling has increased to 67 per cent of all packaging waste in 2009.
An estimated 8.3mt of food and drink waste is produced in the UK each year, of which 65 per cent is avoidable.
The production of hazardous waste in England and Wales decreased by 31 per cent since 2007, totalling 4.41mt in 2009
Greenhouse gas emissions from waste
Greenhouse gas emissions from the waste sector have been declining since 1990, totalling 17.9Mt CO2e in 2009.
For further information visit the Waste and Recycling pages on the Defra website. Alternatively, the National Statistics release calendar lists recent statistical publications.
For other queries or to provide feedback, contact:
Alternatively, write or telephone:
Environment Statistics Service (ESS)
Department for Environment, Food and Rural Affairs
Zone 6F Ergon House
Horseferry Road
London
SW1P 2AL
Tel: 08459 33 55 77
Waste Data Overview
May 2011 6
B: Total waste generation & management:
B1: UK
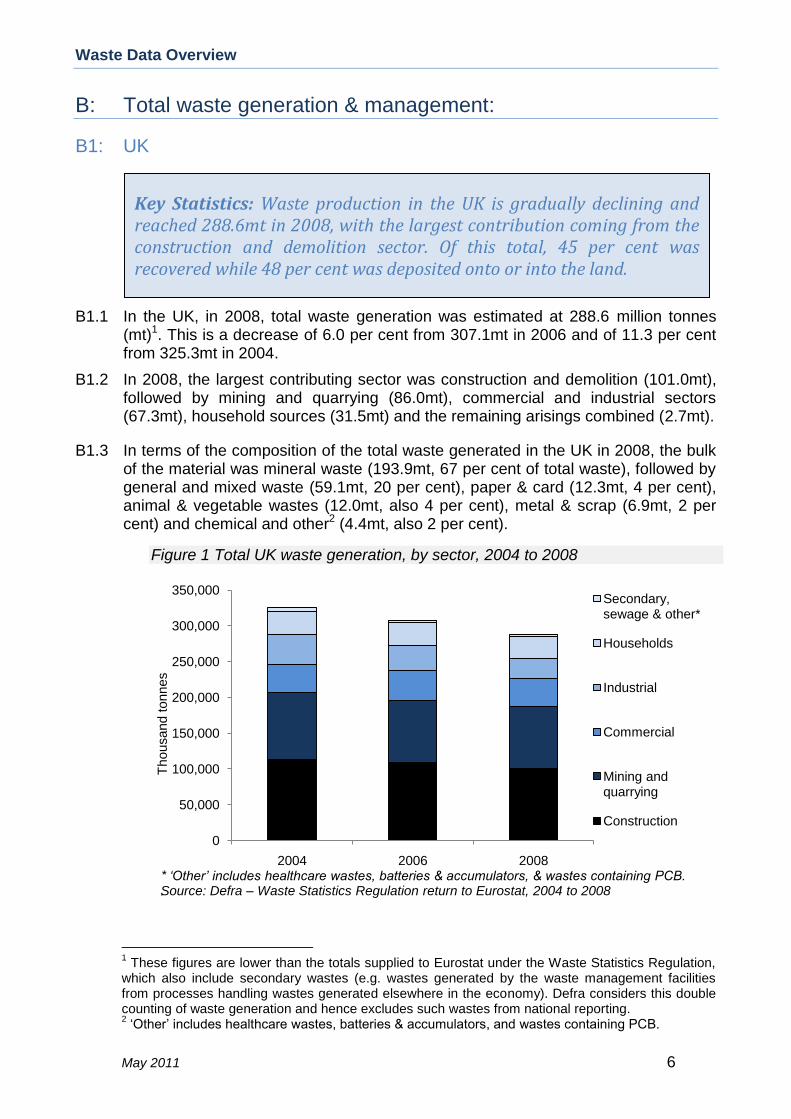
B1.1 In the UK, in 2008, total waste generation was estimated at 288.6 million tonnes (mt)1. This is a decrease of 6.0 per cent from 307.1mt in 2006 and of 11.3 per cent from 325.3mt in 2004.
B1.2 In 2008, the largest contributing sector was construction and demolition (101.0mt), followed by mining and quarrying (86.0mt), commercial and industrial sectors (67.3mt), household sources (31.5mt) and the remaining arisings combined (2.7mt).
B1.3 In terms of the composition of the total waste generated in the UK in 2008, the bulk of the material was mineral waste (193.9mt, 67 per cent of total waste), followed by general and mixed waste (59.1mt, 20 per cent), paper & card (12.3mt, 4 per cent), animal & vegetable wastes (12.0mt, also 4 per cent), metal & scrap (6.9mt, 2 per cent) and chemical and other2 (4.4mt, also 2 per cent).
1 These figures are lower than the totals supplied to Eurostat under the Waste Statistics Regulation,
which also include secondary wastes (e.g. wastes generated by the waste management facilities from processes handling wastes generated elsewhere in the economy). Defra considers this double counting of waste generation and hence excludes such wastes from national reporting. 2 ‘Other’ includes healthcare wastes, batteries & accumulators, and wastes containing PCB.
Figure 1 Total UK waste generation, by sector, 2004 to 2008
0
50,000
100,000
150,000
200,000
250,000
300,000
350,000
2004 2006 2008
Thousand tonnes
Secondary, sewage & other*
Households
Industrial
Commercial
Mining and quarrying
Construction
Source: Defra – Waste Statistics Regulation return to Eurostat, 2004 to 2008* ‘Other’ includes healthcare wastes, batteries & accumulators, & wastes containing PCB..
Key Statistics: Waste production in the UK is gradually declining and reached 288.6mt in 2008, with the largest contribution coming from the construction and demolition sector. Of this total, 45 per cent was recovered while 48 per cent was deposited onto or into the land.
Waste Data Overview
May 2011 7
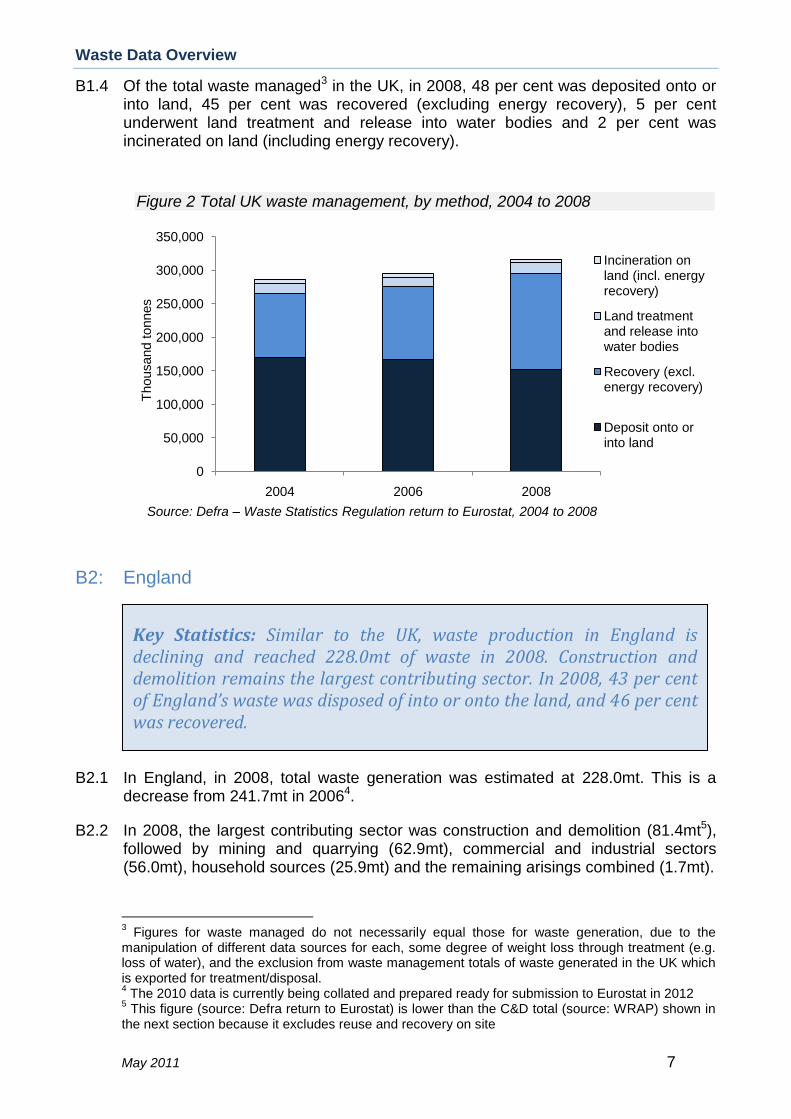
B1.4 Of the total waste managed3 in the UK, in 2008, 48 per cent was deposited onto or into land, 45 per cent was recovered (excluding energy recovery), 5 per cent underwent land treatment and release into water bodies and 2 per cent was incinerated on land (including energy recovery).
B2: England
B2.1 In England, in 2008, total waste generation was estimated at 228.0mt. This is a decrease from 241.7mt in 20064.
B2.2 In 2008, the largest contributing sector was construction and demolition (81.4mt5), followed by mining and quarrying (62.9mt), commercial and industrial sectors (56.0mt), household sources (25.9mt) and the remaining arisings combined (1.7mt).
3 Figures for waste managed do not necessarily equal those for waste generation, due to the
manipulation of different data sources for each, some degree of weight loss through treatment (e.g. loss of water), and the exclusion from waste management totals of waste generated in the UK which is exported for treatment/disposal. 4 The 2010 data is currently being collated and prepared ready for submission to Eurostat in 2012
5 This figure (source: Defra return to Eurostat) is lower than the C&D total (source: WRAP) shown in
the next section because it excludes reuse and recovery on site
Key Statistics: Similar to the UK, waste production in England is declining and reached 228.0mt of waste in 2008. Construction and demolition remains the largest contributing sector. In 2008, 43 per cent of England’s waste was disposed of into or onto the land, and 46 per cent was recovered.
Figure 2 Total UK waste management, by method, 2004 to 2008
0
50,000
100,000
150,000
200,000
250,000
300,000
350,000
2004 2006 2008
Thousand tonnes
Incineration on land (incl. energy recovery)
Land treatment and release into water bodies
Recovery (excl. energy recovery)
Deposit onto or into land
Source: Defra – Waste Statistics Regulation return to Eurostat, 2004 to 2008
Waste Data Overview
May 2011 8
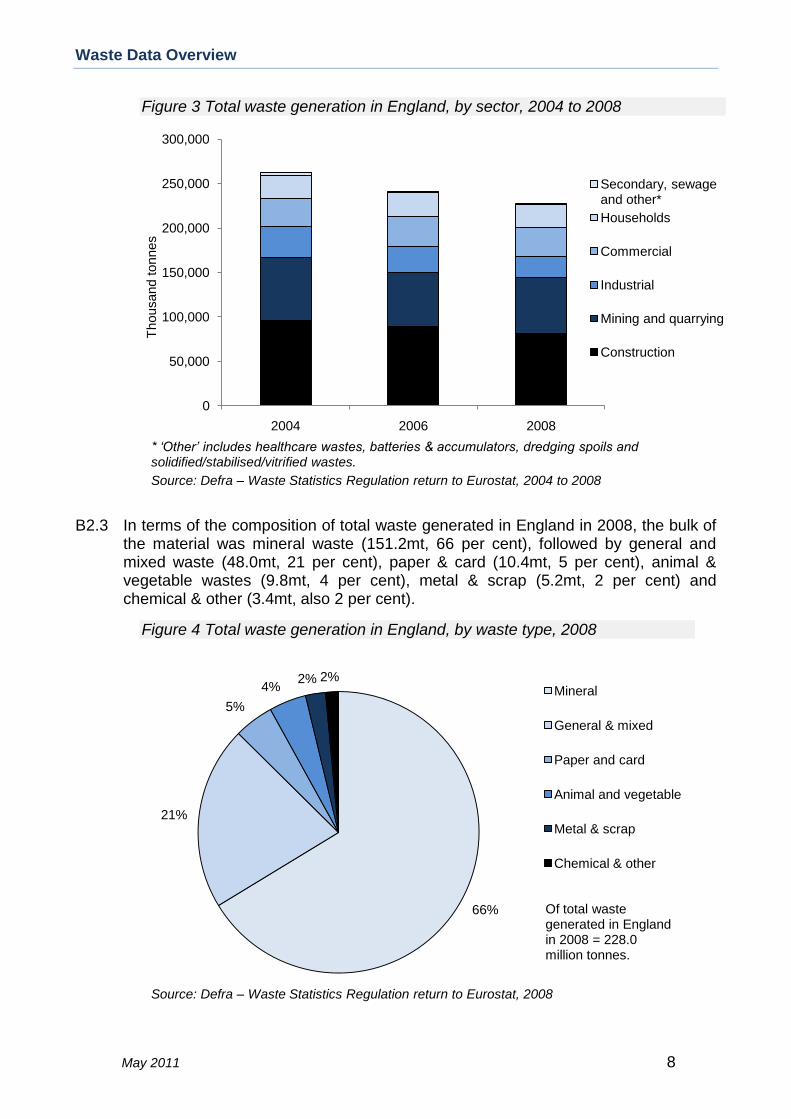
B2.3 In terms of the composition of total waste generated in England in 2008, the bulk of the material was mineral waste (151.2mt, 66 per cent), followed by general and mixed waste (48.0mt, 21 per cent), paper & card (10.4mt, 5 per cent), animal & vegetable wastes (9.8mt, 4 per cent), metal & scrap (5.2mt, 2 per cent) and chemical & other (3.4mt, also 2 per cent).
Figure 4 Total waste generation in England, by waste type, 2008
66%
21%
5%
4%2% 2%
Mineral
General & mixed
Paper and card
Animal and vegetable
Metal & scrap
Chemical & other
Source: Defra – Waste Statistics Regulation return to Eurostat, 2008
Of total wastegenerated in England in 2008 = 228.0 million tonnes.
Figure 3 Total waste generation in England, by sector, 2004 to 2008
0
50,000
100,000
150,000
200,000
250,000
300,000
2004 2006 2008
Thousand tonnes
Secondary, sewage and other*
Households
Commercial
Industrial
Mining and quarrying
Construction
Source: Defra – Waste Statistics Regulation return to Eurostat, 2004 to 2008
* ‘Other’ includes healthcare wastes, batteries & accumulators, dredging spoils and solidified/stabilised/vitrified wastes.
Waste Data Overview
May 2011 9
B2.4 Of the total waste managed in England, in 2008, 43 per cent was deposited onto or into land, 46 per cent was recovered (excluding energy recovery).
B2.5 In 2009, data demonstrate a 45 per cent fall in the volume of waste disposed of in landfill since 2000. This equated to a total of 44.0mt of waste being sent to landfill in 20096.
6 European Union and voluntary waste targets are outlined in Annex 1.
Did you know? In England and Wales, there were 497 operational permitted landfills at the end of 2009, which contain 614 million cubic metres of available landfill capacity. This equates to less than eight years of landfill life left at non-hazardous waste sites
Waste Data Overview
May 2011 10
C: The waste sectors:
C1: Construction & demolition7
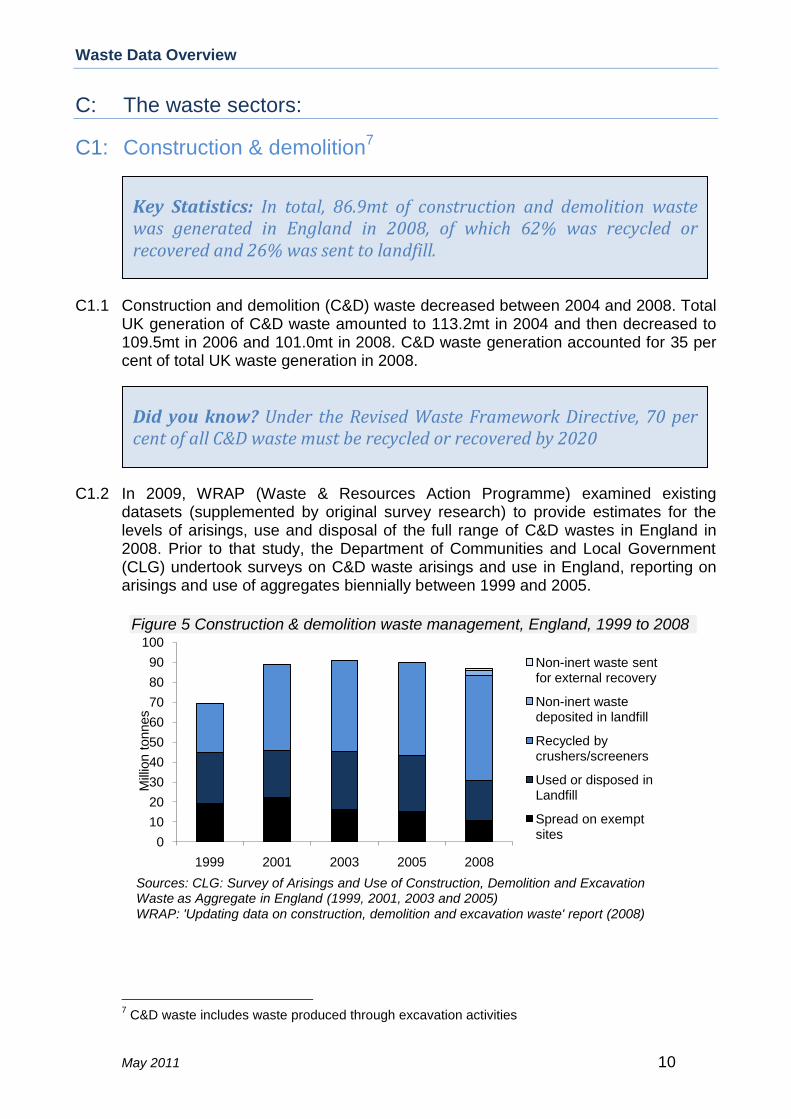
C1.1 Construction and demolition (C&D) waste decreased between 2004 and 2008. Total UK generation of C&D waste amounted to 113.2mt in 2004 and then decreased to 109.5mt in 2006 and 101.0mt in 2008. C&D waste generation accounted for 35 per cent of total UK waste generation in 2008.
C1.2 In 2009, WRAP (Waste & Resources Action Programme) examined existing datasets (supplemented by original survey research) to provide estimates for the levels of arisings, use and disposal of the full range of C&D wastes in England in 2008. Prior to that study, the Department of Communities and Local Government (CLG) undertook surveys on C&D waste arisings and use in England, reporting on arisings and use of aggregates biennially between 1999 and 2005.
7 C&D waste includes waste produced through excavation activities
Figure 5 Construction & demolition waste management, England, 1999 to 2008
0
10
20
30
40
50
60
70
80
90
100
1999 2001 2003 2005 2008
Mill
ion t
onnes
Non-inert waste sent for external recovery
Non-inert waste deposited in landfill
Recycled by crushers/screeners
Used or disposed in Landfill
Spread on exempt sites
Sources: CLG: Survey of Arisings and Use of Construction, Demolition and Excavation Waste as Aggregate in England (1999, 2001, 2003 and 2005)
WRAP: 'Updating data on construction, demolition and excavation waste' report (2008)
Did you know? Under the Revised Waste Framework Directive, 70 per cent of all C&D waste must be recycled or recovered by 2020
Key Statistics: In total, 86.9mt of construction and demolition waste was generated in England in 2008, of which 62% was recycled or recovered and 26% was sent to landfill.
Waste Data Overview
May 2011 11
C1.3 According to WRAP’s 2009 study, C&D waste generated in England remained stable at about 90mt from 2001 to 2008. In 2008, total C&D waste for England was estimated by WRAP at 86.9mt8, of which 53.6mt (62%) was recycled or recovered (both on and off site), 11.0mt (13%) was spread on exempt sites, and the remaining 22.4mt (26%) was sent to landfill (including backfilling at quarries and landfill engineering).
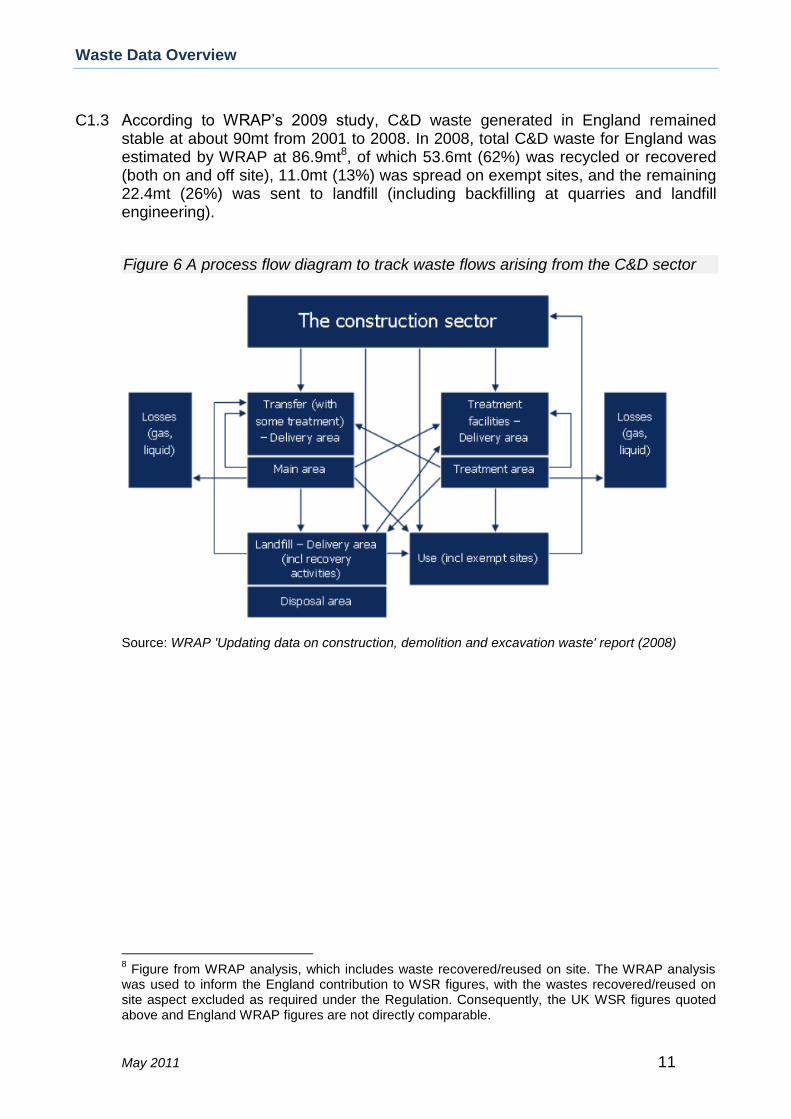
Figure 6 A process flow diagram to track waste flows arising from the C&D sector
Source: WRAP 'Updating data on construction, demolition and excavation waste' report (2008)
8 Figure from WRAP analysis, which includes waste recovered/reused on site. The WRAP analysis
was used to inform the England contribution to WSR figures, with the wastes recovered/reused on site aspect excluded as required under the Regulation. Consequently, the UK WSR figures quoted above and England WRAP figures are not directly comparable.
Waste Data Overview
May 2011 12
C2: Commercial & industrial9
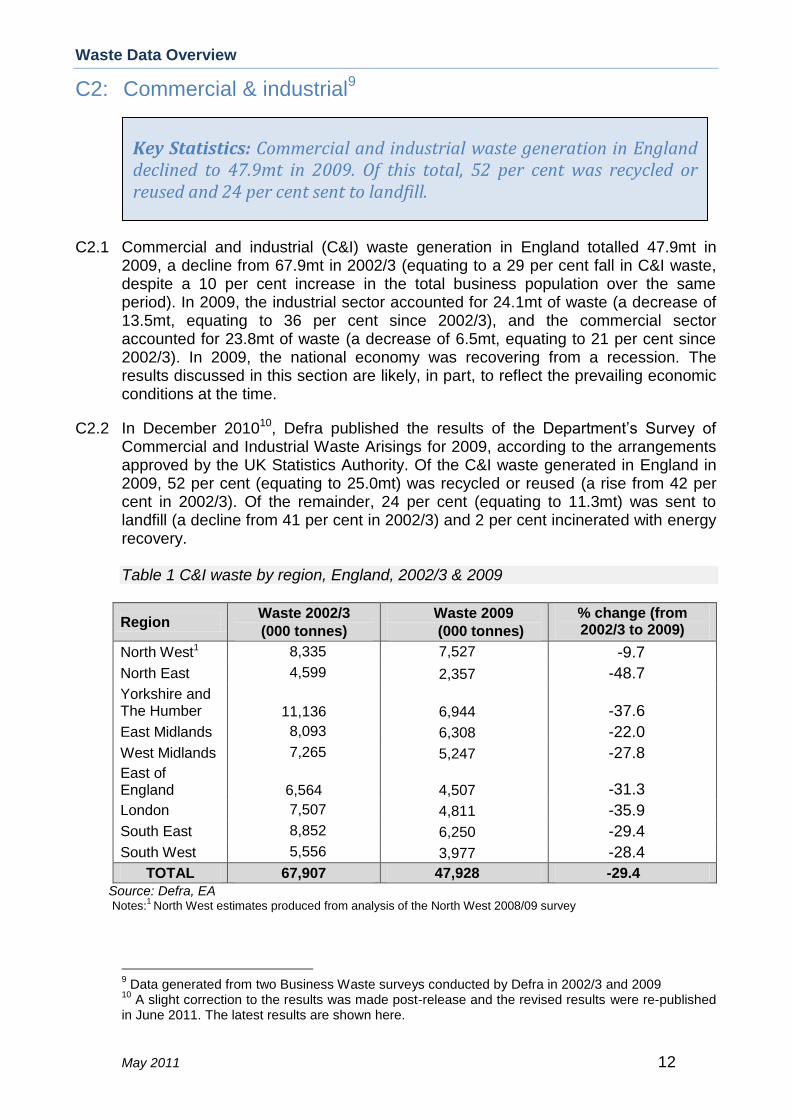
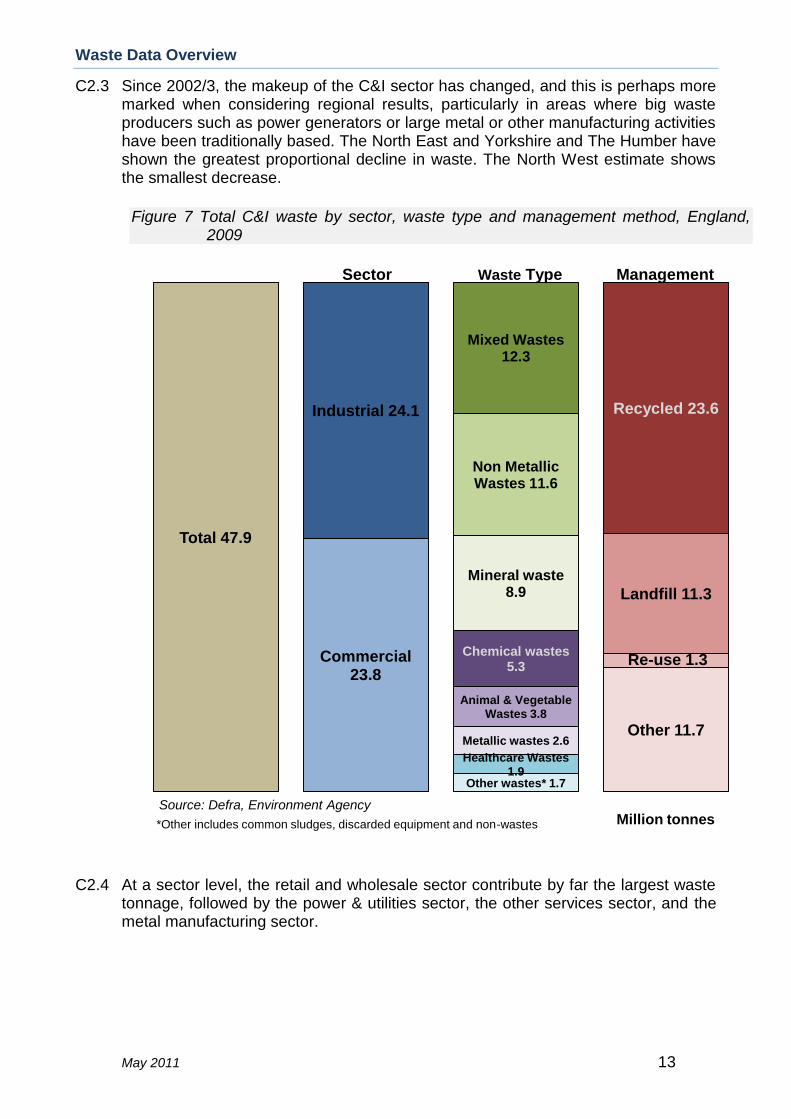
C2.1 Commercial and industrial (C&I) waste generation in England totalled 47.9mt in 2009, a decline from 67.9mt in 2002/3 (equating to a 29 per cent fall in C&I waste, despite a 10 per cent increase in the total business population over the same period). In 2009, the industrial sector accounted for 24.1mt of waste (a decrease of 13.5mt, equating to 36 per cent since 2002/3), and the commercial sector accounted for 23.8mt of waste (a decrease of 6.5mt, equating to 21 per cent since 2002/3). In 2009, the national economy was recovering from a recession. The results discussed in this section are likely, in part, to reflect the prevailing economic conditions at the time.
C2.2 In December 201010, Defra published the results of the Department’s Survey of Commercial and Industrial Waste Arisings for 2009, according to the arrangements approved by the UK Statistics Authority. Of the C&I waste generated in England in 2009, 52 per cent (equating to 25.0mt) was recycled or reused (a rise from 42 per cent in 2002/3). Of the remainder, 24 per cent (equating to 11.3mt) was sent to landfill (a decline from 41 per cent in 2002/3) and 2 per cent incinerated with energy recovery.
Table 1 C&I waste by region, England, 2002/3 & 2009
Region Waste 2002/3
(000 tonnes)
Waste 2009
(000 tonnes)
% change (from 2002/3 to 2009)
North West1 8,335 7,527 -9.7
North East 4,599 2,357 -48.7
Yorkshire and The Humber
11,136 6,944 -37.6
East Midlands 8,093 6,308 -22.0
West Midlands 7,265 5,247 -27.8
East of England 6,564 4,507 -31.3
London 7,507 4,811 -35.9
South East 8,852 6,250 -29.4
South West 5,556 3,977 -28.4
TOTAL 67,907 47,928 -29.4
Source: Defra, EA Notes:
1 North West estimates produced from analysis of the North West 2008/09 survey
9 Data generated from two Business Waste surveys conducted by Defra in 2002/3 and 2009
10 A slight correction to the results was made post-release and the revised results were re-published
in June 2011. The latest results are shown here.
Key Statistics: Commercial and industrial waste generation in England declined to 47.9mt in 2009. Of this total, 52 per cent was recycled or reused and 24 per cent sent to landfill.
Waste Data Overview
May 2011 13
C2.3 Since 2002/3, the makeup of the C&I sector has changed, and this is perhaps more marked when considering regional results, particularly in areas where big waste producers such as power generators or large metal or other manufacturing activities have been traditionally based. The North East and Yorkshire and The Humber have shown the greatest proportional decline in waste. The North West estimate shows the smallest decrease.
C2.4 At a sector level, the retail and wholesale sector contribute by far the largest waste
tonnage, followed by the power & utilities sector, the other services sector, and the metal manufacturing sector.
Figure 7 Total C&I waste by sector, waste type and management method, England, 2009
Total 47.9
Commercial 23.8
Industrial 24.1
Other wastes* 1.7
Healthcare Wastes 1.9
Metallic wastes 2.6
Animal & Vegetable Wastes 3.8
Chemical wastes 5.3
Mineral waste 8.9
Non Metallic Wastes 11.6
Mixed Wastes 12.3
Other 11.7
Re-use 1.3
Landfill 11.3
Recycled 23.6
Source: Defra, Environment Agency
Sector Waste Type Management
Million tonnes*Other includes common sludges, discarded equipment and non-wastes
Waste Data Overview
May 2011 14
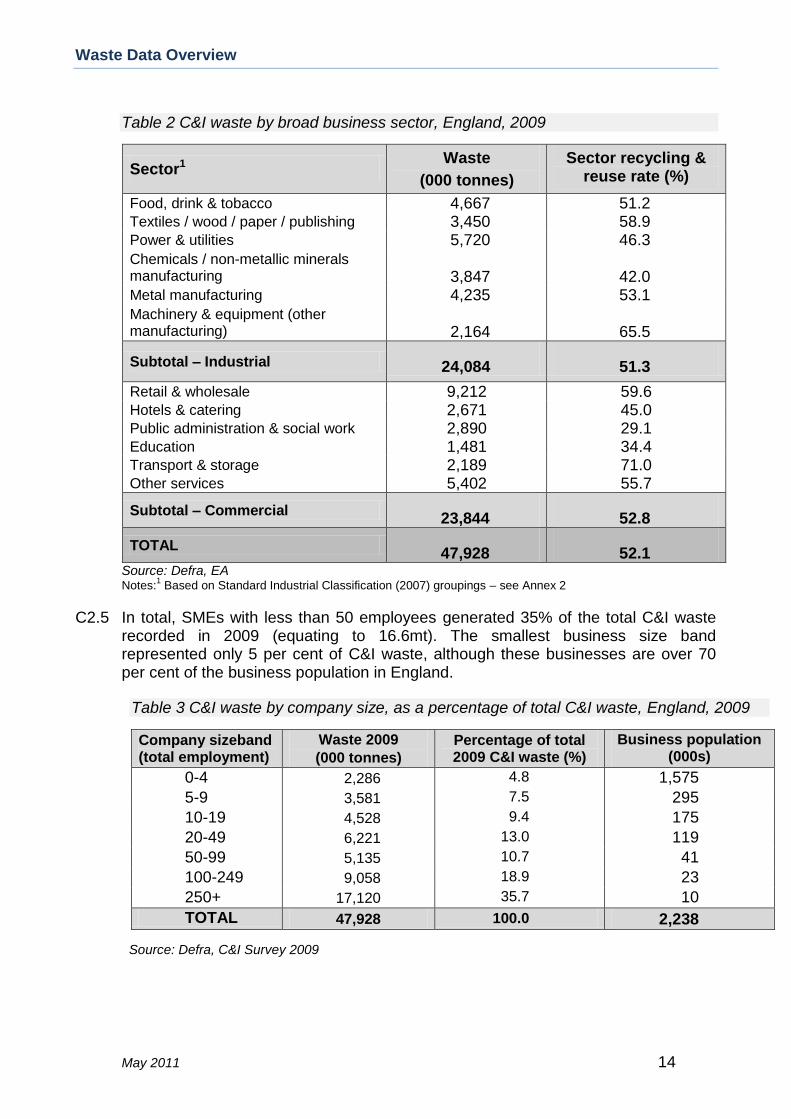
Table 2 C&I waste by broad business sector, England, 2009
Sector1 Waste
(000 tonnes)
Sector recycling & reuse rate (%)
Food, drink & tobacco 4,667 51.2 Textiles / wood / paper / publishing 3,450 58.9 Power & utilities 5,720 46.3
Chemicals / non-metallic minerals manufacturing
3,847
42.0
Metal manufacturing 4,235 53.1
Machinery & equipment (other manufacturing)
2,164
65.5
Subtotal – Industrial 24,084 51.3
Retail & wholesale 9,212 59.6 Hotels & catering 2,671 45.0 Public administration & social work 2,890 29.1 Education 1,481 34.4 Transport & storage 2,189 71.0 Other services 5,402 55.7
Subtotal – Commercial 23,844 52.8
TOTAL 47,928 52.1
Source: Defra, EA Notes:
1 Based on Standard Industrial Classification (2007) groupings – see Annex 2
C2.5 In total, SMEs with less than 50 employees generated 35% of the total C&I waste recorded in 2009 (equating to 16.6mt). The smallest business size band represented only 5 per cent of C&I waste, although these businesses are over 70 per cent of the business population in England.
Source: Defra, C&I Survey 2009
Table 3 C&I waste by company size, as a percentage of total C&I waste, England, 2009
Company sizeband (total employment)
Waste 2009
(000 tonnes)
Percentage of total 2009 C&I waste (%)
Business population (000s)
0-4 2,286 4.8 1,575
5-9 3,581 7.5 295
10-19 4,528 9.4 175
20-49 6,221 13.0 119
50-99 5,135 10.7 41
100-249 9,058 18.9 23
250+ 17,120 35.7 10
TOTAL 47,928 100.0 2,238
Waste Data Overview
May 2011 15
C3: Local authority waste:
The remaining waste is frequently defined according to three main categories that overlap in their definition:
- Municipal waste, as described in the Landfill Directive, includes both household waste and that from other sources which is similar in nature and composition. This will include a significant proportion of waste generated by businesses and not collected by Local Authorities.
- Local Authority Collected Waste (LACW), comprises all waste collected by local authorities. That is household waste and business waste where collected by the local authority. It also includes non municipal fractions collected by the local authority such as construction and demolition waste.
- Household waste comprises the total waste generated directly from households and collected by local authorities.
This section will look at these three categories of waste and draw out key trends in order to make comparisons at international, national and regional levels.
C3.1 UK and international comparisons
C3.1.1 In total, 32.5mt of LACW was generated in the UK in 2009 (this was a 2.5 per cent decline since the previous year), of which 49 per cent was landfilled. Of the remaining waste, 50 per cent (16.2mt of waste) had some value recovered by recycling, composting, reuse or energy recovery.
C3.1.2 In terms of UK regional data, the East of England was found to have the highest recycling, composting and reuse rate at 45.7 per cent while London had the lowest recycling, composting and reuse rate at 27.4 per cent. The region in the UK with the lowest proportion of LACW being sent to landfill is the West Midlands (28.5 per cent) while Northern Ireland has the highest at 66.1 per cent.
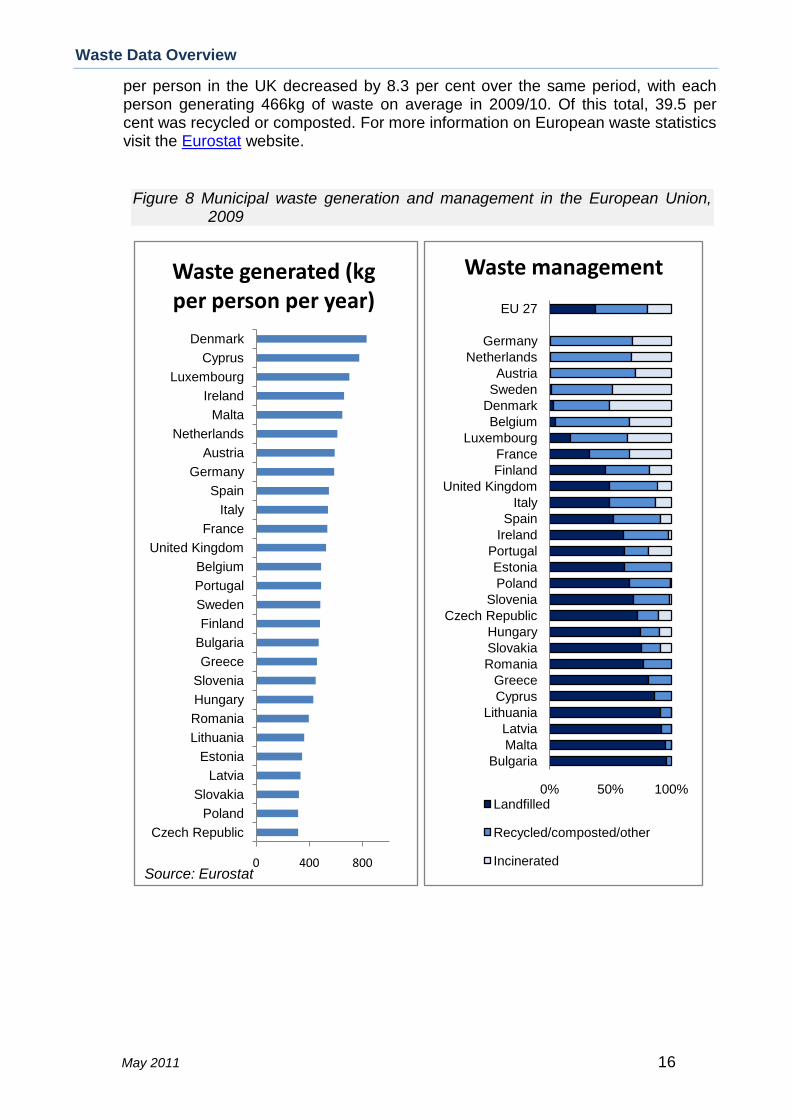
C3.1.3 The amount of municipal waste generated in the UK, in 2009, was equivalent to 526 kg per person, 3 per cent higher than the EU27 average of 512 kg per person. The gap between the UK and the EU27 average has been closing year on year since 2004 when the UK figure was 18 per cent higher than the EU27 average.
C3.1.4 In 2009, a total of 49 per cent of all UK generated municipal waste was landfilled, compared to the EU27 average of 37 per cent, whilst 38 per cent of UK municipal waste was recycled, compared to the EU27 average of 41 per cent.
C3.1.5 The UK demonstrated a 38 per cent reduction in non recycled household waste per person between 2000/01 and 2009/10. Moreover, total household waste generated
Key Statistics: The UK generated a total 32.5mt of LACW in 2009, of which 49 per cent was landfilled and 50 per cent had some value recovered.
Waste Data Overview
May 2011 16
per person in the UK decreased by 8.3 per cent over the same period, with each person generating 466kg of waste on average in 2009/10. Of this total, 39.5 per cent was recycled or composted. For more information on European waste statistics visit the Eurostat website.
Figure 8 Municipal waste generation and management in the European Union, 2009
0 400 800
Czech Republic
Poland
Slovakia
Latvia
Estonia
Lithuania
Romania
Hungary
Slovenia
Greece
Bulgaria
Finland
Sweden
Portugal
Belgium
United Kingdom
France
Italy
Spain
Germany
Austria
Netherlands
Malta
Ireland
Luxembourg
Cyprus
Denmark
Waste generated (kg per person per year)
Source: Eurostat
0% 50% 100%
Bulgaria
Malta
Latvia
Lithuania
Cyprus
Greece
Romania
Slovakia
Hungary
Czech Republic
Slovenia
Poland
Estonia
Portugal
Ireland
Spain
Italy
United Kingdom
Finland
France
Luxembourg
Belgium
Denmark
Sweden
Austria
Netherlands
Germany
EU 27
Waste management
Landfilled
Recycled/composted/other
Incinerated
Waste Data Overview
May 2011 17
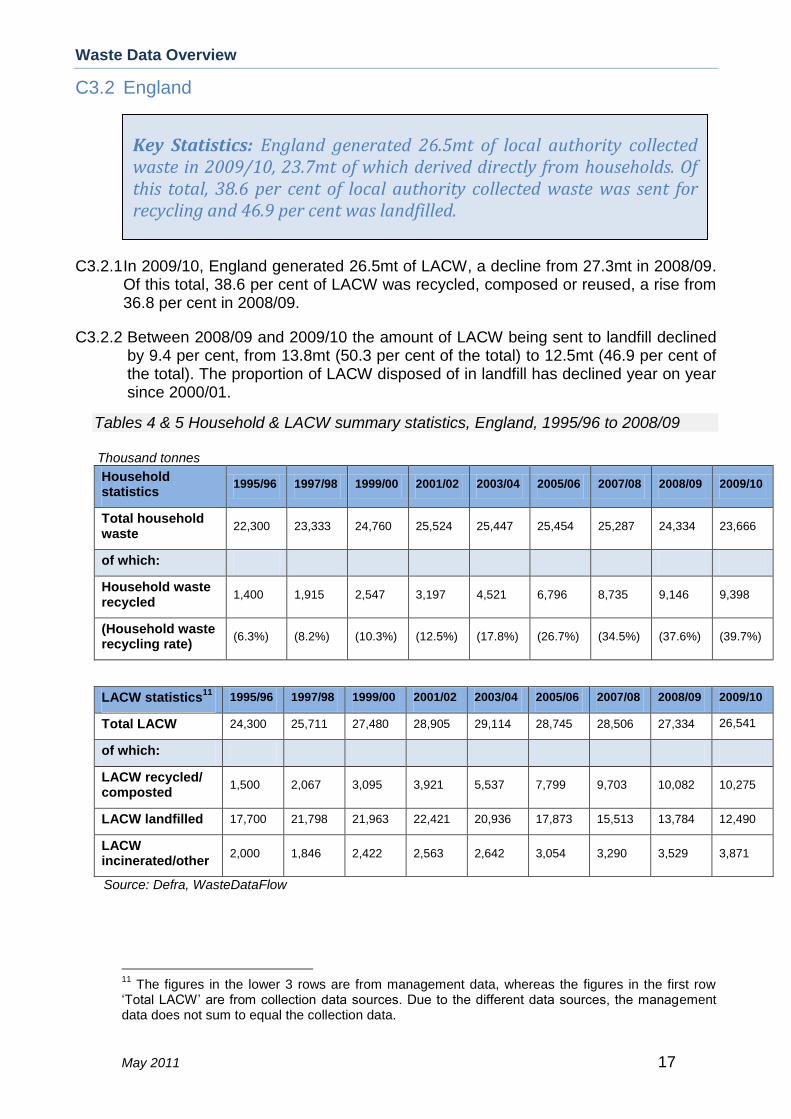
C3.2 England
C3.2.1 In 2009/10, England generated 26.5mt of LACW, a decline from 27.3mt in 2008/09. Of this total, 38.6 per cent of LACW was recycled, composed or reused, a rise from 36.8 per cent in 2008/09.
C3.2.2 Between 2008/09 and 2009/10 the amount of LACW being sent to landfill declined by 9.4 per cent, from 13.8mt (50.3 per cent of the total) to 12.5mt (46.9 per cent of the total). The proportion of LACW disposed of in landfill has declined year on year since 2000/01.
Tables 4 & 5 Household & LACW summary statistics, England, 1995/96 to 2008/09
Thousand tonnes
Household statistics
1995/96 1997/98 1999/00 2001/02 2003/04 2005/06 2007/08 2008/09 2009/10
Total household waste
22,300 23,333 24,760 25,524 25,447 25,454 25,287 24,334 23,666
of which:
Household waste recycled
1,400 1,915 2,547 3,197 4,521 6,796 8,735 9,146 9,398
(Household waste recycling rate)
(6.3%) (8.2%) (10.3%) (12.5%) (17.8%) (26.7%) (34.5%) (37.6%) (39.7%)
LACW statistics11
1995/96 1997/98 1999/00 2001/02 2003/04 2005/06 2007/08 2008/09 2009/10
Total LACW 24,300 25,711 27,480 28,905 29,114 28,745 28,506 27,334 26,541
of which:
LACW recycled/ composted
1,500 2,067 3,095 3,921 5,537 7,799 9,703 10,082 10,275
LACW landfilled 17,700 21,798 21,963 22,421 20,936 17,873 15,513 13,784 12,490
LACW incinerated/other
2,000 1,846 2,422 2,563 2,642 3,054 3,290 3,529 3,871
Source: Defra, WasteDataFlow
11
The figures in the lower 3 rows are from management data, whereas the figures in the first row ‘Total LACW’ are from collection data sources. Due to the different data sources, the management data does not sum to equal the collection data.
Key Statistics: England generated 26.5mt of local authority collected waste in 2009/10, 23.7mt of which derived directly from households. Of this total, 38.6 per cent of local authority collected waste was sent for recycling and 46.9 per cent was landfilled.
Waste Data Overview
May 2011 18
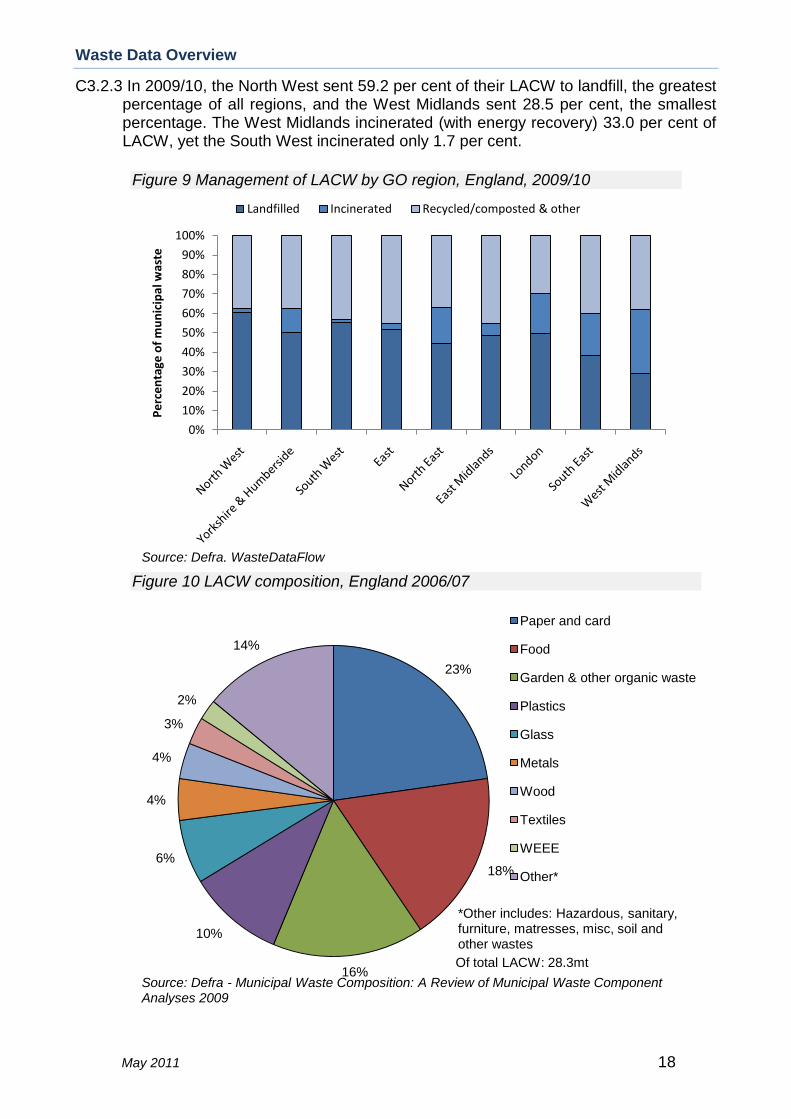
C3.2.3 In 2009/10, the North West sent 59.2 per cent of their LACW to landfill, the greatest percentage of all regions, and the West Midlands sent 28.5 per cent, the smallest percentage. The West Midlands incinerated (with energy recovery) 33.0 per cent of LACW, yet the South West incinerated only 1.7 per cent.
Figure 10 LACW composition, England 2006/07
23%
18%
16%
10%
6%
4%
4%
3%
2%
14%
Paper and card
Food
Garden & other organic waste
Plastics
Glass
Metals
Wood
Textiles
WEEE
Other*
Source: Defra - Municipal Waste Composition: A Review of Municipal Waste Component Analyses 2009
*Other includes: Hazardous, sanitary, furniture, matresses, misc, soil and other wastes
Of total LACW: 28.3mt
Figure 9 Management of LACW by GO region, England, 2009/10
0%
10%
20%
30%
40%
50%
60%
70%
80%
90%
100%
Pe
rce
nta
ge o
f m
un
icip
al w
aste
Landfilled Incinerated Recycled/composted & other
Source: Defra, WasteDataFlow
Waste Data Overview
May 2011 19
C3.2.4 In 2006/0712, the major components of LACW in England were paper and card (23 per cent), food waste (18 per cent), garden and other organic waste (16 per cent) and plastics (10 per cent), which together formed 66 per cent of all LACW.
C3.2.5 In total, 65 per cent of local authorities (equating 211 authorities) are now collecting five or more recyclables at kerbside, and 99 per cent collect at least two. Moreover, 50 local authorities now provide a food waste collection service.
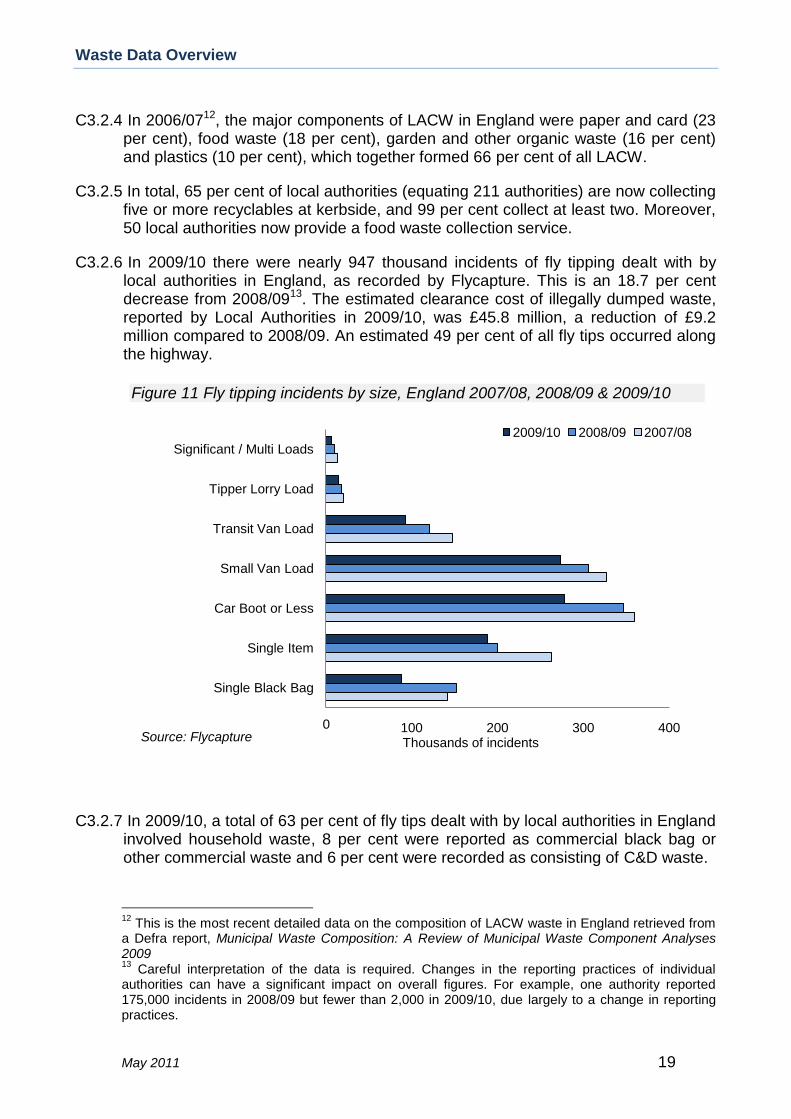
C3.2.6 In 2009/10 there were nearly 947 thousand incidents of fly tipping dealt with by local authorities in England, as recorded by Flycapture. This is an 18.7 per cent decrease from 2008/0913. The estimated clearance cost of illegally dumped waste, reported by Local Authorities in 2009/10, was £45.8 million, a reduction of £9.2 million compared to 2008/09. An estimated 49 per cent of all fly tips occurred along the highway.
C3.2.7 In 2009/10, a total of 63 per cent of fly tips dealt with by local authorities in England involved household waste, 8 per cent were reported as commercial black bag or other commercial waste and 6 per cent were recorded as consisting of C&D waste.
12
This is the most recent detailed data on the composition of LACW waste in England retrieved from a Defra report, Municipal Waste Composition: A Review of Municipal Waste Component Analyses 2009 13
Careful interpretation of the data is required. Changes in the reporting practices of individual authorities can have a significant impact on overall figures. For example, one authority reported 175,000 incidents in 2008/09 but fewer than 2,000 in 2009/10, due largely to a change in reporting practices.
Figure 11 Fly tipping incidents by size, England 2007/08, 2008/09 & 2009/10
- 100 200 300 400
Single Black Bag
Single Item
Car Boot or Less
Small Van Load
Transit Van Load
Tipper Lorry Load
Significant / Multi Loads
Thousands of incidents
2009/10 2008/09 2007/08
Source: Flycapture0
Waste Data Overview
May 2011 20
C3.2.8 The most common size of fly-tips in England in 2009/10 occurred within the car boot or less category (29.3 per cent) followed by small van load (28.9 per cent) and single item (19.8 per cent).
C3.2.9 Local authorities in England carried out 2,457 prosecutions against fly tipping in 2009/10, of which 97 per cent resulted in a successful outcome. Authorities also issued 116,554 warning letters, 37,191 statutory notices, 25,874 fixed penalty notices, and 2,067 formal cautions in response to fly-tipping incidents in 2009/10. Further fly tipping data can be found on the Defra website.
C3.2.10 The Environment Agency (EA) also reported 1047 illegal waste dumping incidents in England in 2009/10 according to Flycapture, an increase from 676 incidents in 2008/09. This reflects the greater support that the EA has given to some local authorities in tackling small-scale fly tipping in areas of high waste crime. The increase in small scale fly tipping incidents has resulted in a decrease in the average fine.
C3.2.11 The EA took 165 prosecutions forward in relation to illegal waste activities, resulting in over £500,000 in fines. Average fine per prosecution was £5,022, where a fine was the outcome.
C3.2.12 The number of serious organised waste crime incidents dealt with by the EA fell slightly from 165 in 2008/09 to 154 incidents in 2009/10.
C3.3 Household waste
C3.3.1 In 2009/10, household waste accounted for 89.0 per cent of England’s LACW. England generated 23.7mt of household waste in 2009/10 (a 2.7 per cent reduction from 2008/09), of which 39.7 per cent (equating to 9.4mt) was sent for recycling, composting or reuse (an increase from 37.6 per cent in 2008/09). This can be compared with 2000/01 data which demonstrated 23mt of household waste being generated annually, and only 11.2 per cent (equating to 2.9mt) being recycled, composted or reused. Moreover, there has been a change in the composition of recycled waste over time, shifting from paper and card as the largest component in 2000/01 (followed by compost and glass), to compost as the largest component in 2009/10 (followed by co-mingled14, and then paper and card).
14 Co-mingled waste is the collection of a number of recyclable materials in the same box or bin, for example paper, glass and plastics, and has become more widespread in recent years.
Key Statistics: Since 2002/03, total waste generated per household has declined to 1036kg per year. Of this total, almost 40 per cent was recycled, composted or reused. Green recycling in particular has increased, and compost now comprises the largest component of recycled household waste, replacing paper and card.
Waste Data Overview
May 2011 21
C3.3.2 Total household waste per household increased from 1033kg per household per year in 1991/92 to a peak at 1202kg per household per year in 2002/03. Total household waste per household has since declined to 1124kg per household per year in 2007/08, 1072kg per household per year in 2008/09, and 1036kg per household per year in 2009/10. Of this total, 411kg was recycled, composted or reused in 2009/10, while 625kg was not.
C3.3.3 In 2009/10 a total of 457kg of household waste was generated per person per year. Of this total, 181kg was recycled (equating to 39.7 per cent of the total compared with 37.6 per cent in 2008/09) and 275kg not recycled per person per year. This is an increase in recycling from 11kg per person per year in 1991/92.
C3.3.4 Green recycling (composting) has increased from 1.6 per cent in 1997/98 to 15.7 per cent in 2009/10, whilst recycling of other materials (dry recycling) has increased from 6.6 per cent to 24.0 per cent in the same period.
C3.3.5 The regional recycling rates in England in 2009/10 was highest in the East of England at 46.1 per cent, and lowest in London at 31.8 per cent. This is an increase from 2000/01 when the highest regional recycling rate was 16.4 per cent in the South East and the lowest was 4.1 per cent in the North East.
C3.3.6 In 2009/10, of the 358 local authorities in England, 39 had a recycling rate higher than 50 per cent, 122 had a recycling rate between 40 and 50 percent, 136 between 30 and 40 per cent, and 61 had a rate of 30 per cent or lower.
Did you know? Under the Revised Waste Framework Directive, 50 per cent of waste from households must be recycled by 2020
Waste Data Overview
May 2011 22
Figure 12 Green and dry recycling rates of household waste, England 1997/98 to 2009/10
Source: Defra, WasteDataFlow
Figure 13 Local authority recycling rates, England, 2009
Waste Data Overview
May 2011 23
C3.3.7 In 2009/10, the local authorities with the highest recycling rates were Staffordshire Moorlands District Council (West Midlands) with 61.4 per cent, South Oxfordshire District Council (South East) with 61.4 per cent and Rochford District Council (Eastern) with 61.2 per cent. For more information on municipal and household waste visit the Defra website.
C3.3.8 Household final consumption expenditure (HHFCE) is a measure of traditional consumer spending. This incorporates the purchase of all goods and services but does not include the purchase of dwellings or expenditure on valuables, considered part of capital formation, or business expenditure. Below, HHFCE is calculated as an index from the 1990 base period. In the UK, between 1991 and 2007, the HHFCE index increased 63 per cent. Waste not recycled, also calculated as an index, broadly increased between 1990 and 2001 before declining to 2007. The total waste arising index increased 27 per cent between 1990 and 2002 and has since fluctuated around this level between 2002 and 2007.
C3.3.9 As recorded in the 2009 Defra ‘Public Attitudes and Behaviours Towards the Environment – tracker survey’, 91 per cent of respondents said that they were recycling items rather than throwing them away. A total of 56 per cent said that they ‘always’ did this and 30 per cent said that they did this ‘very’ or ‘quite’ often. For further information, see the 2009 ‘Public attitudes and behaviours towards the environment – tracker survey’.
Figure 14 Household final consumption expenditure and waste arising, UK, 1990 to 2007
80
90
100
110
120
130
140
150
160
170
1990
1991
1992
1993
1994
1995
1996
1997
1998
1999
2000
2001
2002
2003
2004
2005
2006
2007
Index (
1990=
100)
Final consumption expenditure
Total waste arising
Waste not recycled
Source: ONS, Defra
Waste Data Overview
May 2011 24
Source: Defra – Public Attitudes and Behaviours Towards the Environment – tracker survey 2009
C4: Other waste:
C4.1 Packaging waste
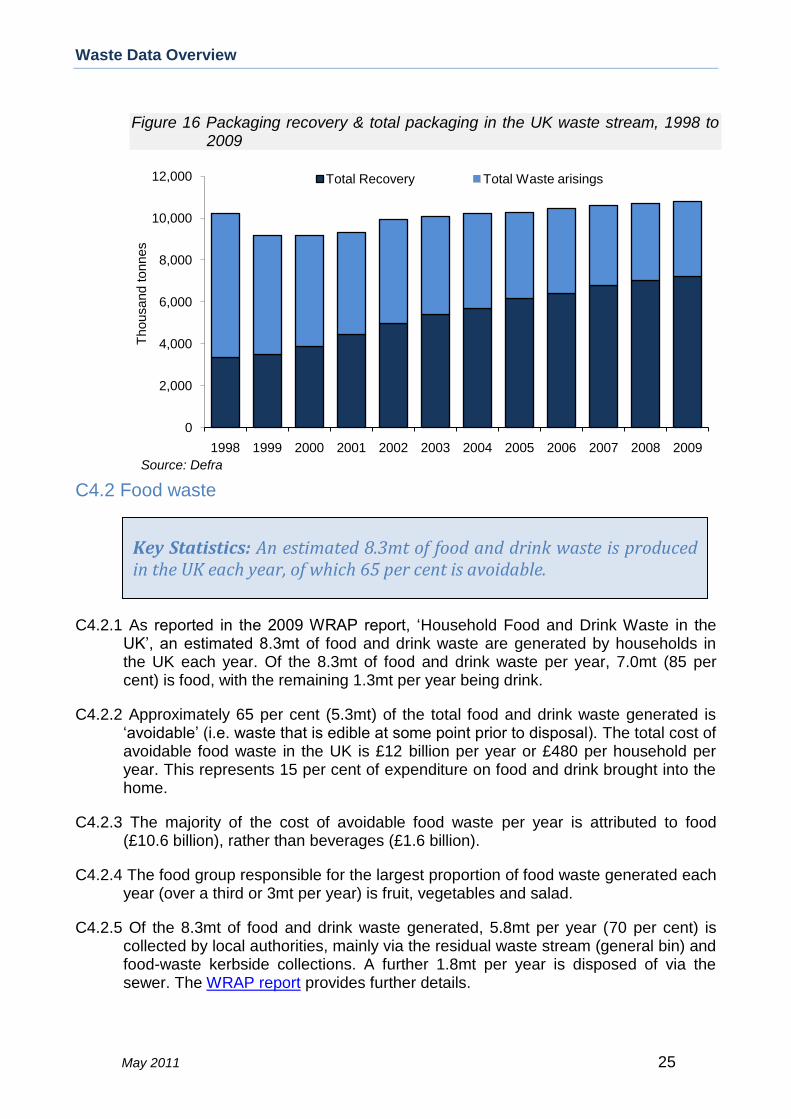
C4.1.1 Total packaging waste in the UK waste stream was 10.2mt in 1998 before it decreased to 9.2mt in 1999. The total then increased steadily between 2001 and 2009, from 9.3mt in 2001 to 10.8mt in 2009.
C4.1.2 Around half of packaging waste is derived from C&I waste and half from household waste. Total recovery and recycling of packaging in the UK has more than doubled from 3.3mt in 1998, 33 per cent of all packaging waste, to 7.2mt in 2009, 67 per cent of all packaging waste. Despite this, only 24 per cent of the UK’s plastic packaging is currently recycled.
Key Statistics: Packaging waste rose between 2001 and 2009 to 10.8mt. At the same time, total recovery and recycling has increased to 67 per cent of all packaging waste in 2009.
Figure 15 Frequency of personal recycling behaviours, England, 2009
Waste Data Overview
May 2011 25
C4.2 Food waste
C4.2.1 As reported in the 2009 WRAP report, ‘Household Food and Drink Waste in the UK’, an estimated 8.3mt of food and drink waste are generated by households in the UK each year. Of the 8.3mt of food and drink waste per year, 7.0mt (85 per cent) is food, with the remaining 1.3mt per year being drink.
C4.2.2 Approximately 65 per cent (5.3mt) of the total food and drink waste generated is ‘avoidable’ (i.e. waste that is edible at some point prior to disposal). The total cost of avoidable food waste in the UK is £12 billion per year or £480 per household per year. This represents 15 per cent of expenditure on food and drink brought into the home.
C4.2.3 The majority of the cost of avoidable food waste per year is attributed to food (£10.6 billion), rather than beverages (£1.6 billion).
C4.2.4 The food group responsible for the largest proportion of food waste generated each year (over a third or 3mt per year) is fruit, vegetables and salad.
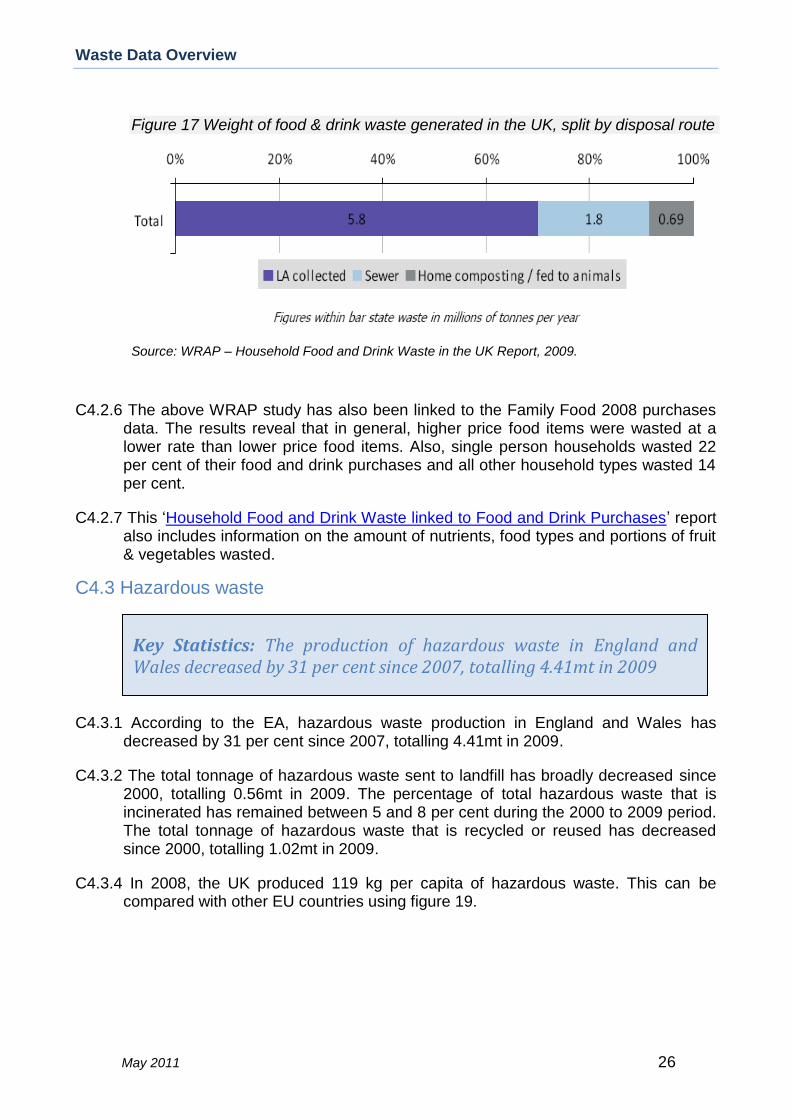
C4.2.5 Of the 8.3mt of food and drink waste generated, 5.8mt per year (70 per cent) is collected by local authorities, mainly via the residual waste stream (general bin) and food-waste kerbside collections. A further 1.8mt per year is disposed of via the sewer. The WRAP report provides further details.
Key Statistics: An estimated 8.3mt of food and drink waste is produced in the UK each year, of which 65 per cent is avoidable.
Figure 16 Packaging recovery & total packaging in the UK waste stream, 1998 to 2009
0
2,000
4,000
6,000
8,000
10,000
12,000
1998 1999 2000 2001 2002 2003 2004 2005 2006 2007 2008 2009
Thousand tonnes
Total Recovery Total Waste arisings
Source: Defra
Waste Data Overview
May 2011 26
C4.2.6 The above WRAP study has also been linked to the Family Food 2008 purchases data. The results reveal that in general, higher price food items were wasted at a lower rate than lower price food items. Also, single person households wasted 22 per cent of their food and drink purchases and all other household types wasted 14 per cent.
C4.2.7 This ‘Household Food and Drink Waste linked to Food and Drink Purchases’ report also includes information on the amount of nutrients, food types and portions of fruit & vegetables wasted.
C4.3 Hazardous waste
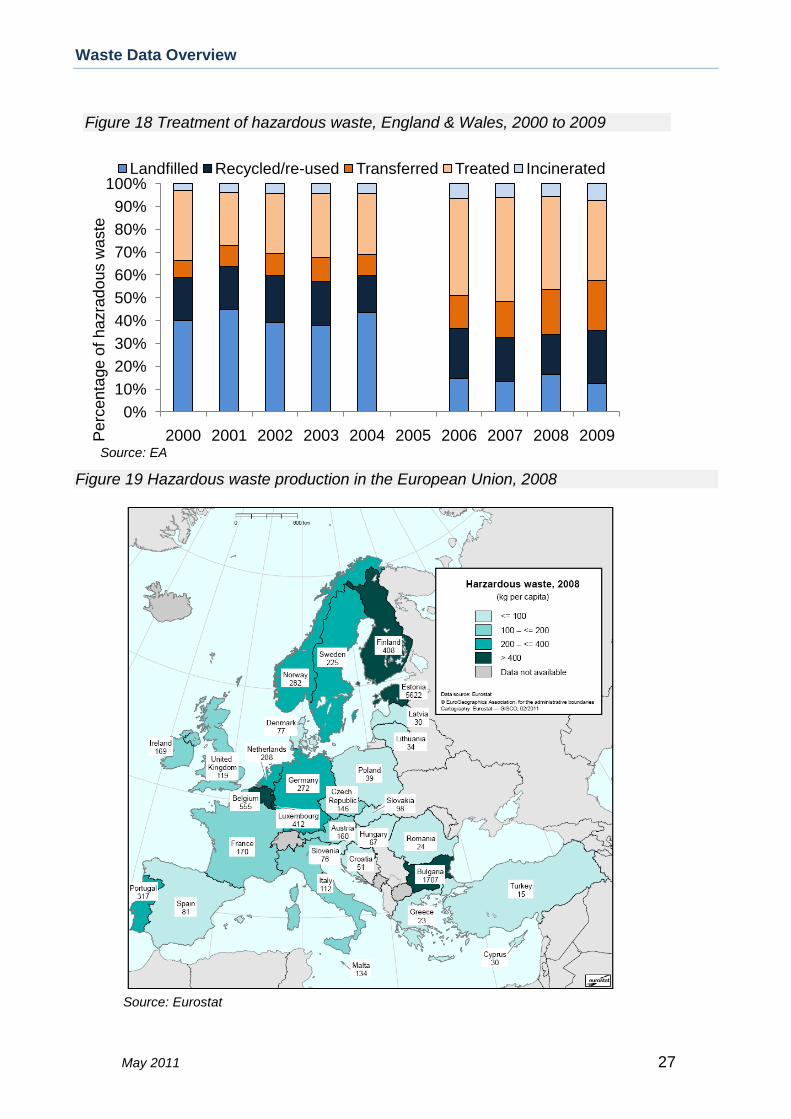
C4.3.1 According to the EA, hazardous waste production in England and Wales has decreased by 31 per cent since 2007, totalling 4.41mt in 2009.
C4.3.2 The total tonnage of hazardous waste sent to landfill has broadly decreased since 2000, totalling 0.56mt in 2009. The percentage of total hazardous waste that is incinerated has remained between 5 and 8 per cent during the 2000 to 2009 period. The total tonnage of hazardous waste that is recycled or reused has decreased since 2000, totalling 1.02mt in 2009.
C4.3.4 In 2008, the UK produced 119 kg per capita of hazardous waste. This can be compared with other EU countries using figure 19.
Key Statistics: The production of hazardous waste in England and Wales decreased by 31 per cent since 2007, totalling 4.41mt in 2009
Figure 17 Weight of food & drink waste generated in the UK, split by disposal route
Source: WRAP – Household Food and Drink Waste in the UK Report, 2009.
Waste Data Overview
May 2011 27
Figure 19 Hazardous waste production in the European Union, 2008
Source: Eurostat
Figure 18 Treatment of hazardous waste, England & Wales, 2000 to 2009
0%
10%
20%
30%
40%
50%
60%
70%
80%
90%
100%
2000 2001 2002 2003 2004 2005 2006 2007 2008 2009Pe
rcen
tage
of
ha
zra
do
us w
aste
Landfilled Recycled/re-used Transferred Treated Incinerated
Source: EA
Waste Data Overview
May 2011 28
D: Greenhouse gas emissions from waste management
D1 According to DECC, the waste sector is estimated to have accounted for 3.2 per cent of all direct UK emissions in 2009. This figure includes emissions from waste sent to landfill, incineration without energy recovery, and waste water handling.
D2 Greenhouse gas (GHG) emissions from the waste management sector in the UK decreased by 69.7 per cent from 1990 to 2009, from 59.0mt CO2e in 1990 to 17.9mt15 CO2e in 2009. Further data on UK emissions of GHGs can be found on the DECC website.
D3 WRAP estimates that avoidable food waste accounts for greenhouse gas emissions of 20mt16 CO2e per year. This equates to approximately 3% of the UK’s domestic greenhouse gas emissions. Further information can be found on the WRAP website.
15
This figure is generated from a DECC model based upon the Greenhouse Gas Inventory and includes emissions from waste sent to landfill, incineration without energy recovery, and waste water handling 16
This figure is based upon WRAP’s estimations of total waste produced (whether sent to landfill, composted or recycled) from the entire food chain including agriculture, food manufacture, packaging, distribution and transport, storage and preparation
Key Statistics: Greenhouse gas emissions from the waste sector have been declining since 1990, totalling 17.9mt CO2e in 2009.
Waste Data Overview
May 2011 29
E: Annex
1: Current EU & voluntary waste targets
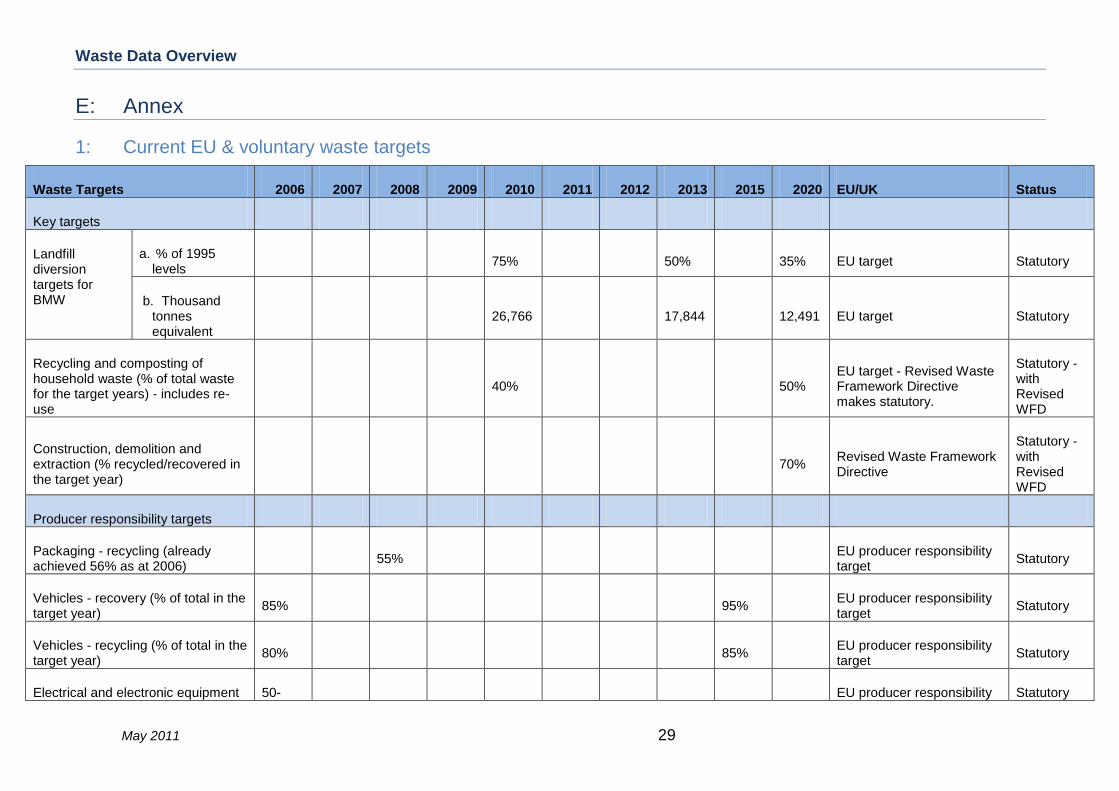
Waste Targets 2006 2007 2008 2009 2010 2011 2012 2013 2015 2020 EU/UK Status
Key targets
Landfill diversion targets for BMW
a. % of 1995 levels
75%
50%
35% EU target Statutory
b. Thousand tonnes equivalent
26,766
17,844
12,491 EU target Statutory
Recycling and composting of household waste (% of total waste for the target years) - includes re-use
40%
50% EU target - Revised Waste Framework Directive makes statutory.
Statutory - with Revised WFD
Construction, demolition and extraction (% recycled/recovered in the target year)
70% Revised Waste Framework Directive
Statutory - with Revised WFD
Producer responsibility targets
Packaging - recycling (already achieved 56% as at 2006)
55% EU producer responsibility target
Statutory
Vehicles - recovery (% of total in the target year)
85% 95% EU producer responsibility target
Statutory
Vehicles - recycling (% of total in the target year)
80% 85% EU producer responsibility target
Statutory
Electrical and electronic equipment 50- EU producer responsibility Statutory
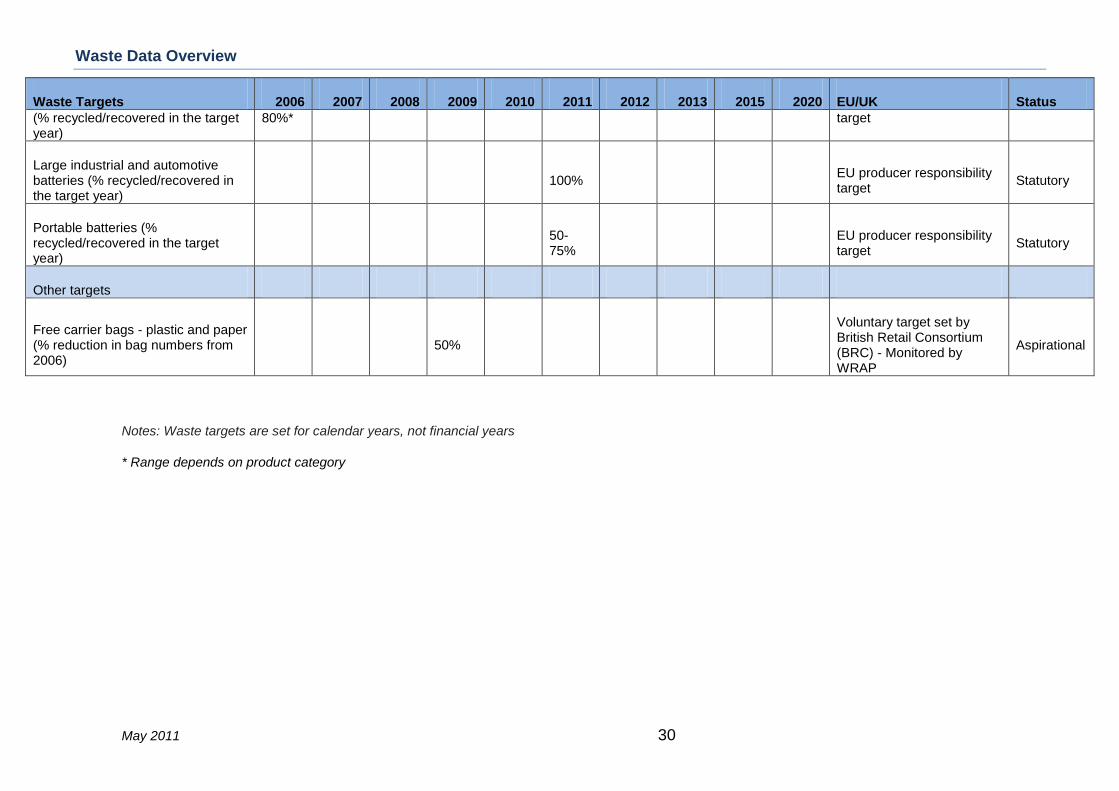
Waste Data Overview
May 2011 30
Waste Targets 2006 2007 2008 2009 2010 2011 2012 2013 2015 2020 EU/UK Status
(% recycled/recovered in the target year)
80%* target
Large industrial and automotive batteries (% recycled/recovered in the target year)
100% EU producer responsibility target
Statutory
Portable batteries (% recycled/recovered in the target year)
50-75%
EU producer responsibility target
Statutory
Other targets
Free carrier bags - plastic and paper (% reduction in bag numbers from 2006)
50%
Voluntary target set by British Retail Consortium (BRC) - Monitored by WRAP
Aspirational
Notes: Waste targets are set for calendar years, not financial years
* Range depends on product category
Waste Data Overview
May 2011 31
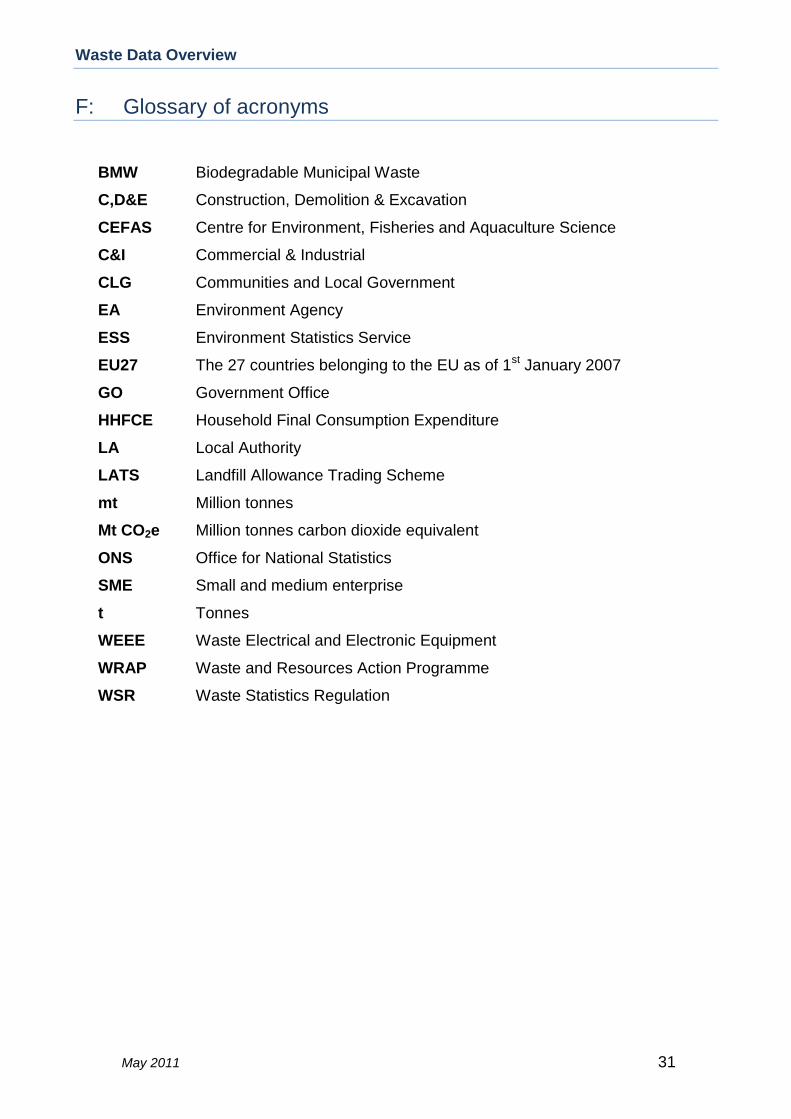
F: Glossary of acronyms
BMW Biodegradable Municipal Waste
C,D&E Construction, Demolition & Excavation
CEFAS Centre for Environment, Fisheries and Aquaculture Science
C&I Commercial & Industrial
CLG Communities and Local Government
EA Environment Agency
ESS Environment Statistics Service
EU27 The 27 countries belonging to the EU as of 1st January 2007
GO Government Office
HHFCE Household Final Consumption Expenditure
LA Local Authority
LATS Landfill Allowance Trading Scheme
mt Million tonnes
Mt CO2e Million tonnes carbon dioxide equivalent
ONS Office for National Statistics
SME Small and medium enterprise
t Tonnes
WEEE Waste Electrical and Electronic Equipment
WRAP Waste and Resources Action Programme
WSR Waste Statistics Regulation