Embed Size (px)
Citation preview
SEPTEMBER 2016
WASHINGTON HEALTH BENEFIT EXCHANGE
HEALTH COVERAGEENROLLMENT REPORT
HEALTH COVERAGEENROLLMENT REPORT
WAhealthplanfinder.org
Publication Date: November 16, 2016
Table of contents
Total Enrollees .............................................................................................................................. 1 September Enrollees September QHP Enrollees Subsidized/Non-Subsidized by MonthDistribution of QHP Enrollees .................................................................................................... 2 By Metal Level By Percent of Federal Poverty Level (FPL) Enrollees by FPL/Metal LevelDisenrollment ............................................................................................................................... 3 2016 Disenrollment Disenrollment by Metal Level Disenrollment by FPL/Metal LevelEnrollees by Month ..................................................................................................................... 4 QHP Enrollees Washington Apple Health Enrollees Dental EnrolleesEnrollees by County .................................................................................................................... 5 QHP by County Washington Apple Health by CountyQHP Enrollees Data ..................................................................................................................... 6 Age Under 19 Gender U.S. Citizenship Race/Ethnicity Hispanic IndicatorLanguage Data ............................................................................................................................ 7 Limited English Proficient Applicants Spanish Languages Top Language Requests By Washington Healthplanfinder ApplicantsLanguage Data ............................................................................................................................ 8 Customer Service Top Language Requests Through Telephonic Interpretation ServicesWashington Apple Health Data ................................................................................................. 9 Age Under 19 Race/Ethnicity Medicaid Plan Selection Washington Apple Health Enrollees by FPL Additional Data .......................................................................................................................... 10 March 2016 QHP Enrollees by Carriers SEP (Special Enrollment Perioid) ChurnAdditional Data .......................................................................................................................... 11 Assisted Enrollees Families Premiums and Finanical Assistance - March 2016SHOP Enrollment ....................................................................................................................... 12 SHOP Employer by County Employer by Metal Level Employees and Dependents by Metal Level
Washington Health Benefit ExchangeEnrollment Report
September 2016
The 2016 Washington Health Benefit Exchange Enrollment Report in an excel spreadsheet with additional data is also available online at:http://www.wahbexchange.org/about-the-exchange/reports-data/enrollment-reports-data/
Qualified Health Plans (QHP) data:Author: WAHBE/Seema Gupta, Data Source: Washington Healthplanfinder as of September 30, 2016
Washington Apple Health - MAGI/CHIP data:Author: HCA/BIS/Thuy Ha; Data Source: ProviderOne ODS Data Warehouse as of October 18, 2016
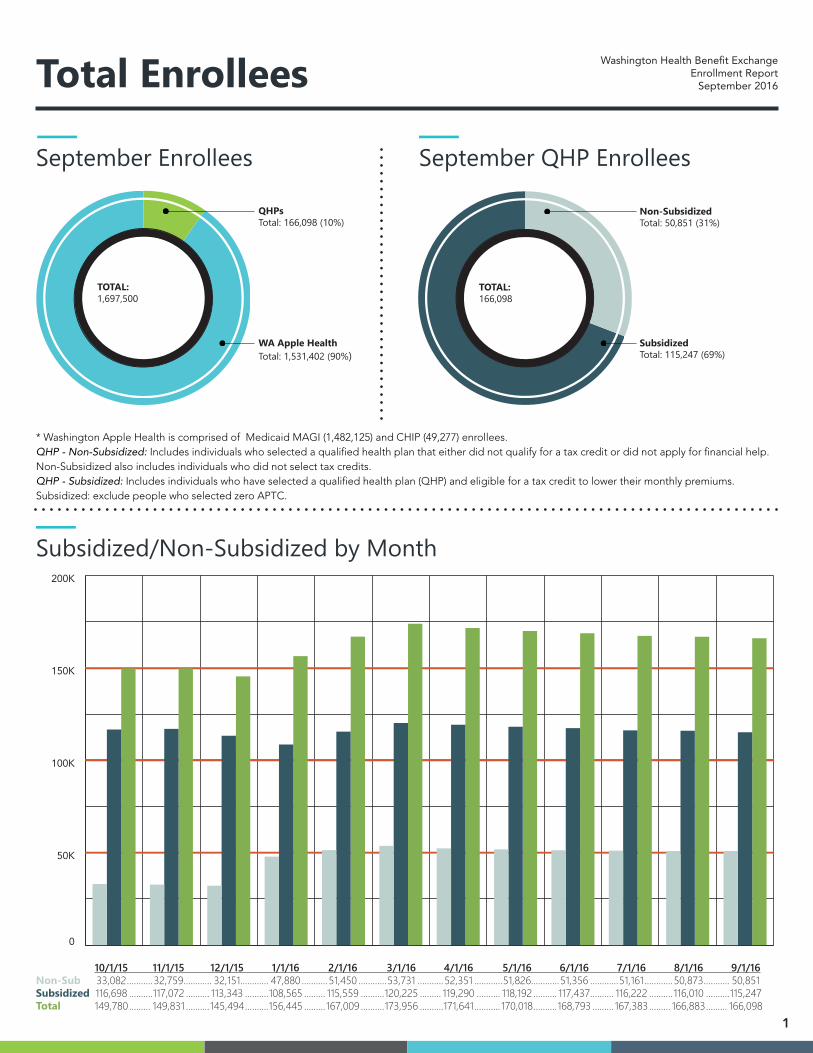
TOTAL:
QHPsTotal: 166,098 (10%)
1,697,500
WA Apple HealthTotal: 1,531,402 (90%)
Total Enrollees
Subsidized/Non-Subsidized by Month
September Enrollees September QHP Enrollees
* Washington Apple Health is comprised of Medicaid MAGI (1,482,125) and CHIP (49,277) enrollees. QHP - Non-Subsidized: Includes individuals who selected a qualified health plan that either did not qualify for a tax credit or did not apply for financial help. Non-Subsidized also includes individuals who did not select tax credits.QHP - Subsidized: Includes individuals who have selected a qualified health plan (QHP) and eligible for a tax credit to lower their monthly premiums. Subsidized: exclude people who selected zero APTC.
Washington Health Benefit ExchangeEnrollment Report
September 2016
1
Non-SubSubsidizedTotal
0
50K
100K
150K
200K
10/1/15 11/1/15 12/1/15 1/1/16 2/1/16 3/1/16 4/1/16 5/1/16 6/1/16 7/1/16 8/1/16 9/1/16 33,082 ...........32,759 ............ 32,151............ 47,880 ...........51,450 ............53,731 ...........52,351 ............51,826............51,356 ............51,161 ............50,873 ........... 50,851 116,698 ..........117,072 .......... 113,343 ..........108,565 ......... 115,559 ..........120,225 ......... 119,290 .......... 118,192 .......... 117,437.......... 116,222 ..........116,010 ..........115,247 149,780 ......... 149,831 ..........145,494 ..........156,445 .........167,009 ..........173,956 ..........171,641 ........... 170,018 ..........168,793 ......... 167,383 ......... 166,883 ......... 166,098
TOTAL:
Non-SubsidizedTotal: 50,851 (31%)
SubsidizedTotal: 115,247 (69%)
166,098
TOTAL:
SilverTotal: 96,017 (58%)
BronzeTotal: 54,880 (33%)
CatastrophicTotal: 1,253 (1%)
166,098
GoldTotal: 13,948 (8%)
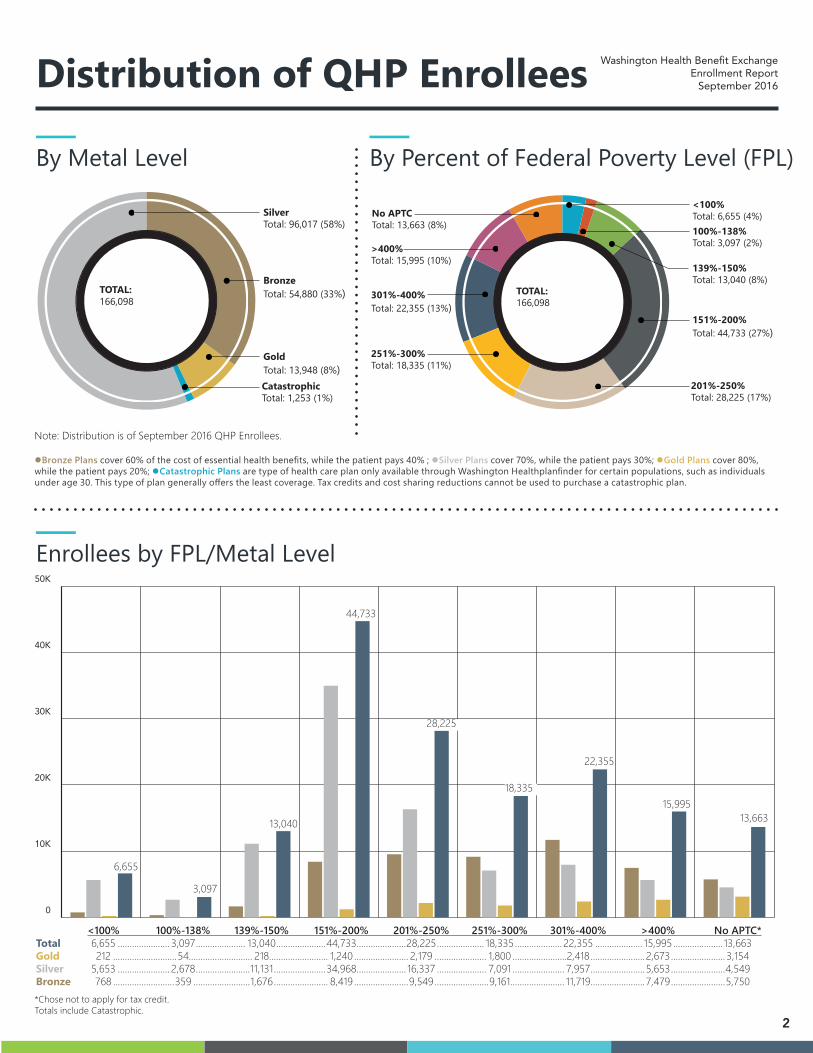
Distribution of QHP Enrollees
By Metal Level
Note: Distribution is of September 2016 QHP Enrollees. lBronze Plans cover 60% of the cost of essential health benefits, while the patient pays 40% ; lSilver Plans cover 70%, while the patient pays 30%; lGold Plans cover 80%, while the patient pays 20%; lCatastrophic Plans are type of health care plan only available through Washington Healthplanfinder for certain populations, such as individuals under age 30. This type of plan generally offers the least coverage. Tax credits and cost sharing reductions cannot be used to purchase a catastrophic plan.
0
10K
20K
30K
40K
50K
By Percent of Federal Poverty Level (FPL)
Enrollees by FPL/Metal Level
2
<100% 100%-138% 139%-150% 151%-200% 201%-250% 251%-300% 301%-400% >400% No APTC* 6,655 ...................... 3,097 ..................... 13,040 .....................44,733 .....................28,225 .................... 18,335 .................... 22,355 .................... 15,995 ..................... 13,663 212 ...........................54........................... 218......................... 1,240 ....................... 2,179 ...................... 1,800 .......................2,418 .......................2,673 ....................... 3,154 5,653 ...................... 2,678 .......................11,131 ......................34,968 ..................... 16,337 ..................... 7,091 ...................... 7,957 .......................5,653 .......................4,549 768 ..........................359 ........................1,676 ....................... 8,419 .......................9,549 .......................9,161....................... 11,719 .......................7,479 .......................5,750
TOTAL:
<100%Total: 6,655 (4%)
139%-150%Total: 13,040 (8%)
151%-200%Total: 44,733 (27%)
201%-250%Total: 28,225 (17%)
No APTCTotal: 13,663 (8%)
>400%Total: 15,995 (10%)
301%-400%Total: 22,355 (13%)
251%-300%Total: 18,335 (11%)
166,098
100%-138%Total: 3,097 (2%)
Total GoldSilverBronze
Washington Health Benefit ExchangeEnrollment Report
September 2016
6,655
3,097
13,040
44,733
28,225
18,335
22,355
15,99513,663
*Chose not to apply for tax credit. Totals include Catastrophic.
TOTAL:
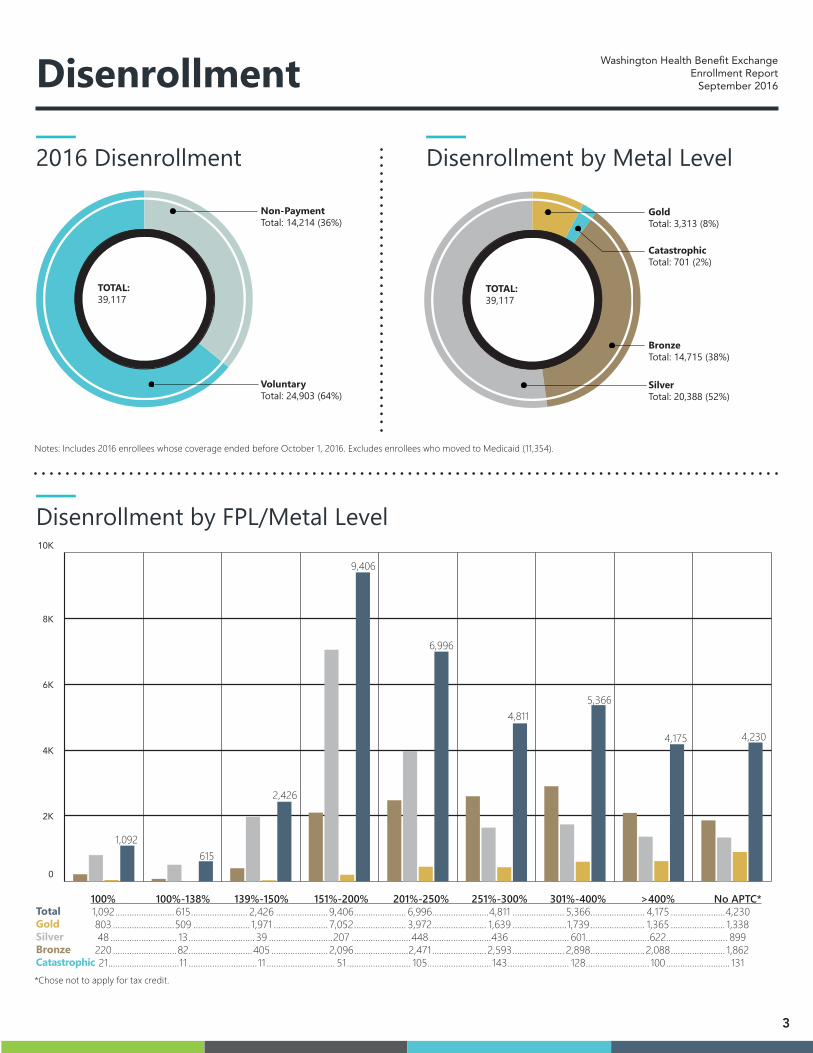
Non-PaymentTotal: 14,214 (36%)
39,117
Voluntary Total: 24,903 (64%)
Disenrollment
2016 Disenrollment Disenrollment by Metal Level
Washington Health Benefit ExchangeEnrollment Report
September 2016
3
TOTAL:
Gold Total: 3,313 (8%)
BronzeTotal: 14,715 (38%)
39,117
SilverTotal: 20,388 (52%)
CatastrophicTotal: 701 (2%)
Disenrollment by FPL/Metal Level
0
2K
4K
6K
8K
10K
100% 100%-138% 139%-150% 151%-200% 201%-250% 251%-300% 301%-400% >400% No APTC* 1,092 ......................... 615 ........................ 2,426 ...................... 9,406 ...................... 6,996 ........................4,811 ...................... 5,366 ....................... 4,175 .......................4,230 803 ..........................509 ........................ 1,971 ....................... 7,052 ...................... 3,972 ....................... 1,639 .......................1,739 ....................... 1,365 ....................... 1,338 48 ............................ 13 ............................ 39 ...........................207 .........................448 ..........................436 ......................... 601 ...........................622.......................... 899 220 ...........................82...........................405 ........................ 2,096 .......................2,471 .......................2,593 ...................... 2,898 .......................2,088 ....................... 1,862 21 ..............................11 .............................11 ............................. 51 ........................... 105 ........................... 143 .......................... 128 ........................... 100 ........................... 131
Total Gold SilverBronzeCatastrophic
1,092615
2,426
9,406
6,996
4,8115,366
4,175 4,230
*Chose not to apply for tax credit.
Notes: Includes 2016 enrollees whose coverage ended before October 1, 2016. Excludes enrollees who moved to Medicaid (11,354).
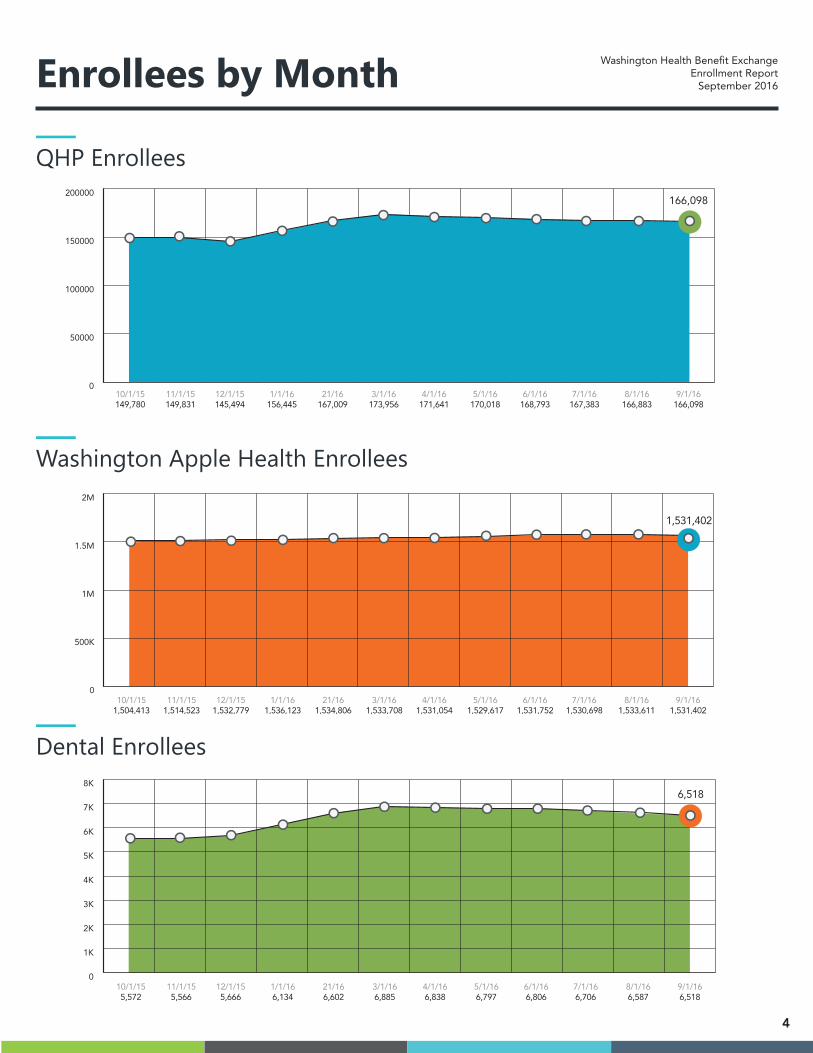
Enrollees by Month Washington Health Benefit ExchangeEnrollment Report
September 2016
QHP Enrollees
0
50000
100000
150000
200000
10/1/15 11/1/15 12/1/15 1/1/16 21/16 3/1/16 4/1/16 5/1/16 6/1/16 7/1/16 8/1/16 9/1/16 149,780 149,831 145,494 156,445 167,009 173,956 171,641 170,018 168,793 167,383 166,883 166,098
166,098
Washington Apple Health Enrollees
0
500K
1M
1.5M
2M
1,531,402
10/1/15 11/1/15 12/1/15 1/1/16 21/16 3/1/16 4/1/16 5/1/16 6/1/16 7/1/16 8/1/16 9/1/16 1,504,413 1,514,523 1,532,779 1,536,123 1,534,806 1,533,708 1,531,054 1,529,617 1,531,752 1,530,698 1,533,611 1,531,402
Dental Enrollees
0
1K
2K
3K
4K
5K
6K
7K
8K
10/1/15 11/1/15 12/1/15 1/1/16 21/16 3/1/16 4/1/16 5/1/16 6/1/16 7/1/16 8/1/16 9/1/16 5,572 5,566 5,666 6,134 6,602 6,885 6,838 6,797 6,806 6,706 6,587 6,518
6,518
4
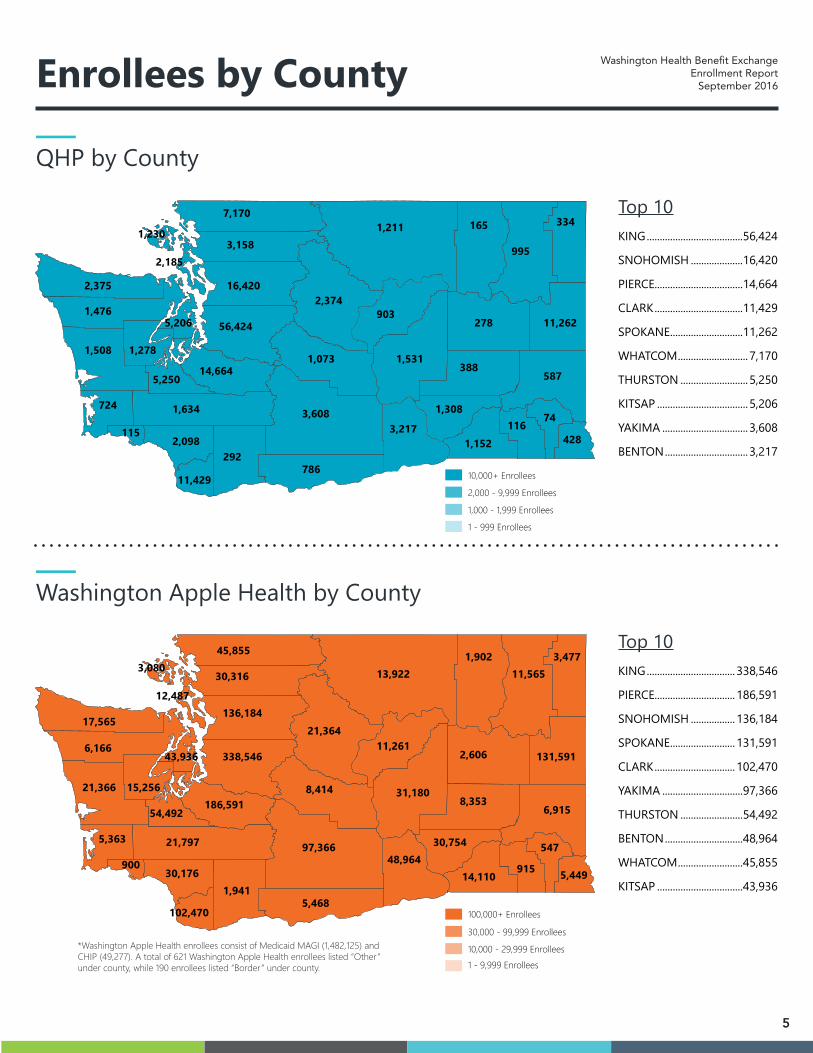
Enrollees by County
Washington Apple Health by County
QHP by County
11,429
14,664
786
3,608
7,170
3,158
16,420
56,424
5,250
1,634
292
3,217
1,308
1,152116
74
428
1,211
2,374
1,073
165
995
334
903
1,531
278 11,262
388587
2,375
1,476
1,508 1,278
1152,098
724
1,230
2,185
5,206
KING .....................................56,424
SNOHOMISH ....................16,420
PIERCE..................................14,664
CLARK ..................................11,429
SPOKANE ............................11,262
WHATCOM ........................... 7,170
THURSTON .......................... 5,250
KITSAP ...................................5,206
YAKIMA ................................. 3,608
BENTON ................................ 3,217
Top 10
96,3164,990
KING .................................. 338,546
PIERCE............................... 186,591
SNOHOMISH ................. 136,184
SPOKANE ......................... 131,591
CLARK ............................... 102,470
YAKIMA ...............................97,366
THURSTON ........................54,492
BENTON ..............................48,964
WHATCOM .........................45,855
KITSAP .................................43,936
Top 10
Washington Health Benefit ExchangeEnrollment Report
September 2016
*Washington Apple Health enrollees consist of Medicaid MAGI (1,482,125) and CHIP (49,277). A total of 621 Washington Apple Health enrollees listed “Other” under county, while 190 enrollees listed “Border” under county.
5
10,000+ Enrollees
2,000 - 9,999 Enrollees
1,000 - 1,999 Enrollees
1 - 999 Enrollees
100,000+ Enrollees
30,000 - 99,999 Enrollees
10,000 - 29,999 Enrollees1 - 9,999 Enrollees
102,470
186,591
5,468
97,366
45,855
30,316
136,184
338,546
54,492
21,797
1,941
48,96430,754
14,110915
547
5,449
13,922
21,364
8,414
1,90211,565
3,477
11,261
31,180
2,606 131,591
8,3536,915
17,565
6,166
21,366 15,256
90030,176
5,363
3,080
12,487
43,936
TOTAL:
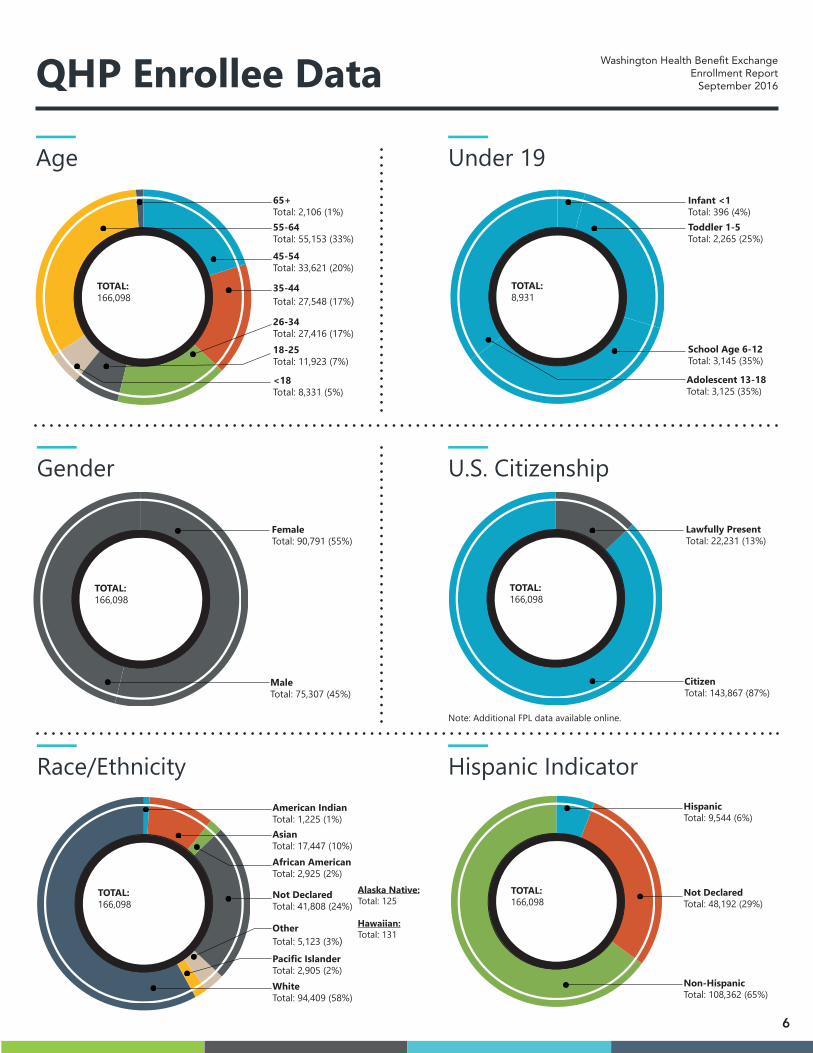
Toddler 1-5Total: 2,265 (25%)
Adolescent 13-18Total: 3,125 (35%)
8,931
Infant <1Total: 396 (4%)
School Age 6-12Total: 3,145 (35%)
TOTAL:
FemaleTotal: 90,791 (55%)
MaleTotal: 75,307 (45%)
166,098
QHP Enrollee Data Washington Health Benefit ExchangeEnrollment Report
September 2016
Age Under 19
Gender
Race/Ethnicity
U.S. Citizenship
6
TOTAL: 35-44Total: 27,548 (17%)
55-64Total: 55,153 (33%)
45-54Total: 33,621 (20%)
26-34Total: 27,416 (17%)
<18Total: 8,331 (5%)
166,098
65+Total: 2,106 (1%)
18-25Total: 11,923 (7%)
TOTAL:
Lawfully Present Total: 22,231 (13%)
CitizenTotal: 143,867 (87%)
166,098
Note: Additional FPL data available online.
TOTAL: Not DeclaredTotal: 41,808 (24%)
AsianTotal: 17,447 (10%)African AmericanTotal: 2,925 (2%)
OtherTotal: 5,123 (3%)
WhiteTotal: 94,409 (58%)
166,098
American IndianTotal: 1,225 (1%)
Pacific IslanderTotal: 2,905 (2%)
Alaska Native:Total: 125
Hawaiian:Total: 131
Hispanic Indicator
TOTAL: Not DeclaredTotal: 48,192 (29%)
Non-HispanicTotal: 108,362 (65%)
166,098
HispanicTotal: 9,544 (6%)

0
1K
2K
3K
4K
5K
6K
7K
8K
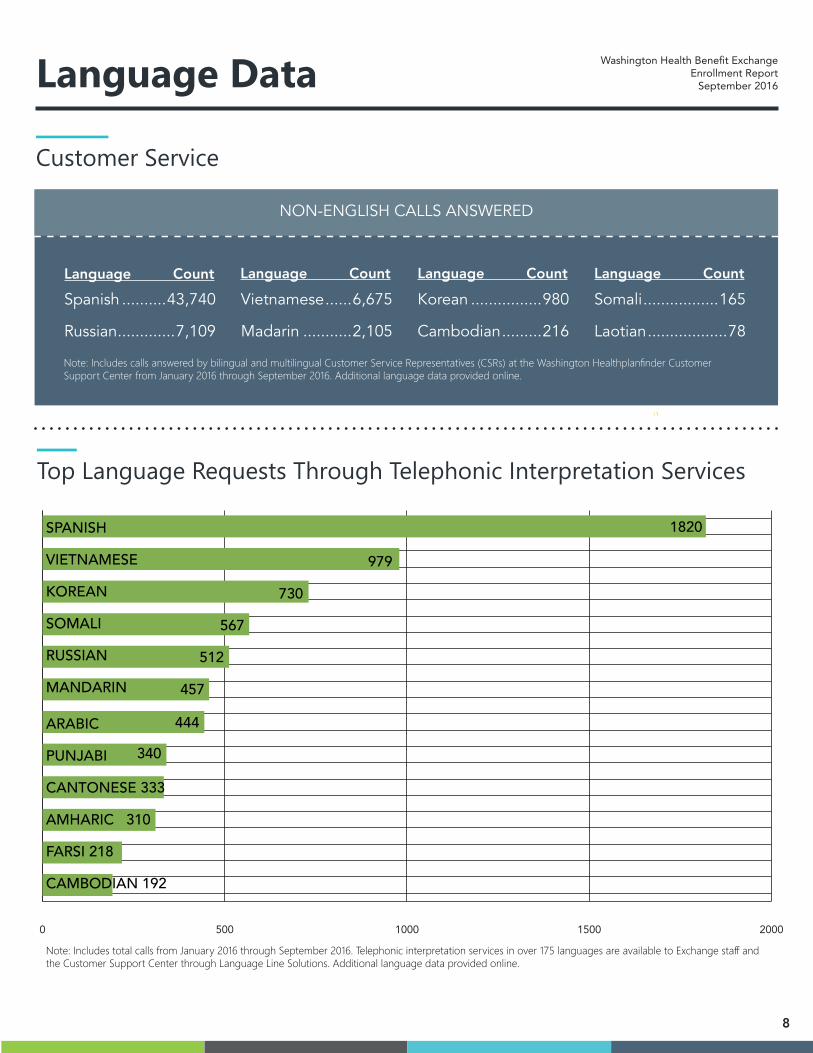
Language Data Washington Health Benefit ExchangeEnrollment Report
September 2016
Top Language Requests By Washington Healthplanfinder Applicants
7
Limited English Proficient Applicants Spanish Language
TOTAL: 106,840
QHPsTotal: 9,036 (8%)
WA Apple HealthTotal: 97,804 (92%)
Vietnamese Chinese Russian Korean Arabic Somali 1,551 ......... 1,514 1,714 ............ 1,650 547 ............... 507 533 ................477 30 ..................31 9 ................... 7 4,529 ..........4,586 3,147 ............ 3,067 3,604 ............3,722 1,486 ............. 1,496 1,207............. 1,311 1,059 ............ 1,032 6,080 ........ 6,100 4,861 ............ 4,717 4,151 .............4,229 2,019 ............. 1,973 1,237.............1,342 1,068 ............ 1,039
QHPWAHTotal
*WAH: Washington Apple Health
Note: Excludes Spanish, the top language requested (see above). Includes applicants as of September 2016 who indicated in Washington Healthplanfinder they do not speak and/or read English and requested an interpreter or translation.
Spanish Language Requests By Washington Healthplanfinder
Applicants
Interpreter QHP ............2,967 (4%)WAH .......68,364 (96%)TOTAL ..............71,331
TranslationQHP ............3,049 (4%)WAH .......71,013 (96%)TOTAL ..............74,062
Interpreter
QHP
Washington Apple Health
QHP
Washington Apple Health
Translation
Note: Includes applicants as of September 2016 who indicated in Washington Healthplanfinder they do not speak and/or read English.
Language Data Washington Health Benefit ExchangeEnrollment Report
September 2016
Top Language Requests Through Telephonic Interpretation Services
Customer Service
8
Spanish ..........43,740
Russian .............7,109
Vietnamese ......6,675
Madarin ...........2,105
Korean ................980
Cambodian .........216
Somali .................165
Laotian ..................78
NON-ENGLISH CALLS ANSWERED
Language Count
Note: Includes calls answered by bilingual and multilingual Customer Service Representatives (CSRs) at the Washington Healthplanfinder Customer Support Center from January 2016 through September 2016. Additional language data provided online.
0 500 1000 1500 2000
SPANISH
VIETNAMESE
KOREAN
SOMALI
RUSSIAN
MANDARIN
ARABIC
PUNJABI
CANTONESE 333
AMHARIC 310
FARSI 218
CAMBODIAN 192
1820
979
730
567
512
457
444
340
Note: Includes total calls from January 2016 through September 2016. Telephonic interpretation services in over 175 languages are available to Exchange staff and the Customer Support Center through Language Line Solutions. Additional language data provided online.
Language Count Language Count Language Count
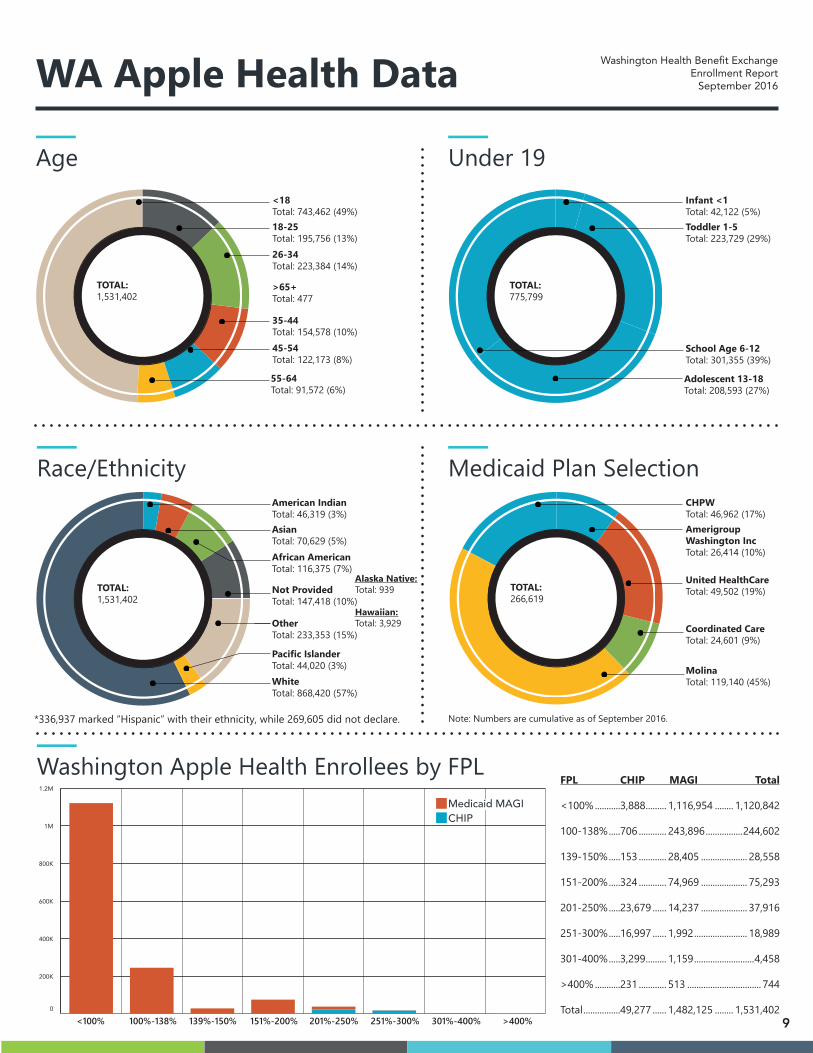
TOTAL: >65+Total: 477
18-25Total: 195,756 (13%)26-34Total: 223,384 (14%)
35-44Total: 154,578 (10%)
55-64Total: 91,572 (6%)
1,531,402
<18Total: 743,462 (49%)
45-54Total: 122,173 (8%)
WA Apple Health Data Washington Health Benefit ExchangeEnrollment Report
September 2016
9
Age Under 19
Race/Ethnicity Medicaid Plan Selection
TOTAL:
Coordinated CareTotal: 24,601 (9%)
Amerigroup Washington IncTotal: 26,414 (10%)
United HealthCareTotal: 49,502 (19%)
266,619
CHPWTotal: 46,962 (17%)
MolinaTotal: 119,140 (45%)
TOTAL:
Toddler 1-5Total: 223,729 (29%)
Adolescent 13-18Total: 208,593 (27%)
775,799
Infant <1Total: 42,122 (5%)
School Age 6-12Total: 301,355 (39%)
Alaska Native:Total: 939
Hawaiian:Total: 3,929
Washington Apple Health Enrollees by FPL
TOTAL: Not ProvidedTotal: 147,418 (10%)
AsianTotal: 70,629 (5%)African AmericanTotal: 116,375 (7%)
OtherTotal: 233,353 (15%)
WhiteTotal: 868,420 (57%)
1,531,402
American IndianTotal: 46,319 (3%)
Pacific IslanderTotal: 44,020 (3%)
0
200K
400K
600K
800K
1M
1.2MFPL CHIP MAGI Total <100% ...........3,888 ......... 1,116,954 ........ 1,120,842 100-138% .....706 ............ 243,896 ................244,602 139-150% .....153 ............ 28,405 .................... 28,558 151-200% .....324 ............ 74,969 .................... 75,293 201-250% .....23,679 ...... 14,237 .................... 37,916 251-300% .....16,997 ...... 1,992 ....................... 18,989 301-400% .....3,299 ......... 1,159 ..........................4,458 >400% ...........231 ............ 513 ................................ 744 Total ................49,277 ...... 1,482,125 ........ 1,531,402
<100% 100%-138% 139%-150% 151%-200% 201%-250% 251%-300% 301%-400% >400%
Note: Numbers are cumulative as of September 2016.*336,937 marked “Hispanic” with their ethnicity, while 269,605 did not declare.
Medicaid MAGI CHIP
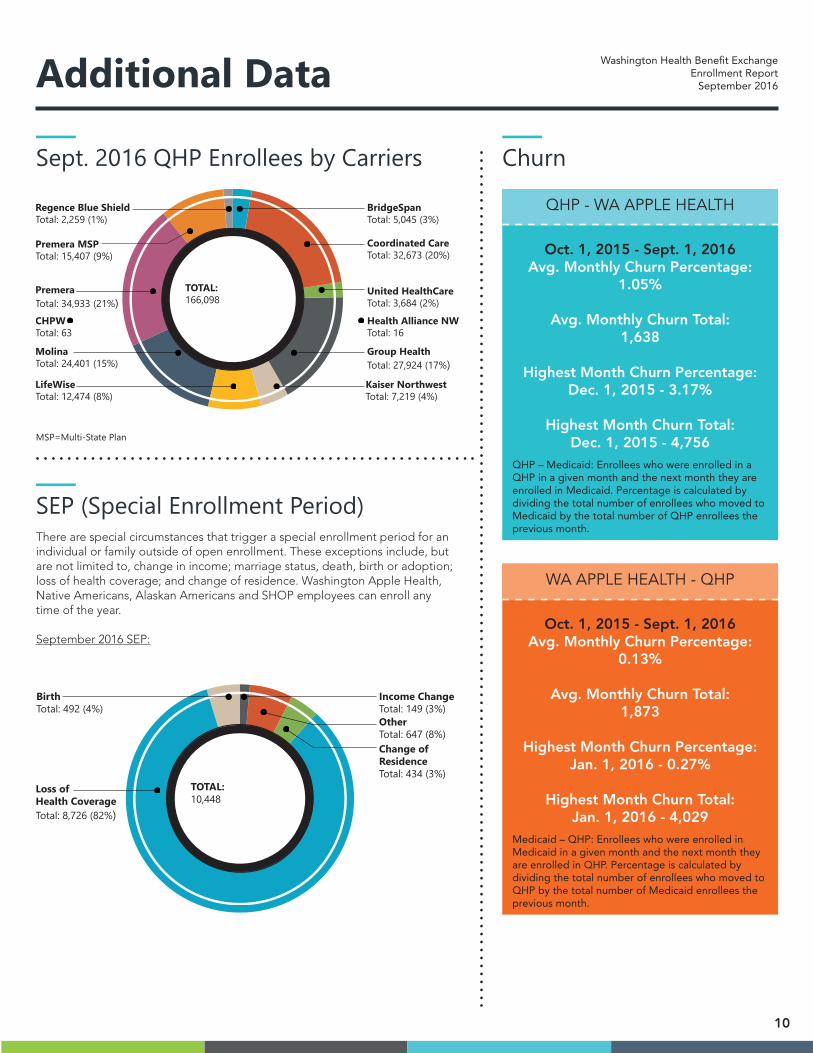
Additional Data Washington Health Benefit ExchangeEnrollment Report
September 2016
10
Sept. 2016 QHP Enrollees by Carriers
Health Alliance NWTotal: 16
TOTAL: United HealthCareTotal: 3,684 (2%)
BridgeSpanTotal: 5,045 (3%)
Coordinated CareTotal: 32,673 (20%)
Group HealthTotal: 27,924 (17%)Kaiser NorthwestTotal: 7,219 (4%)
LifeWiseTotal: 12,474 (8%)
Regence Blue ShieldTotal: 2,259 (1%)
Premera MSPTotal: 15,407 (9%)
PremeraTotal: 34,933 (21%)
MolinaTotal: 24,401 (15%)
166,098
CHPWTotal: 63
Churn
QHP - WA APPLE HEALTH
Oct. 1, 2015 - Sept. 1, 2016 Avg. Monthly Churn Percentage:
1.05%
Avg. Monthly Churn Total:1,638
Highest Month Churn Percentage: Dec. 1, 2015 - 3.17%
Highest Month Churn Total: Dec. 1, 2015 - 4,756
QHP – Medicaid: Enrollees who were enrolled in a QHP in a given month and the next month they are enrolled in Medicaid. Percentage is calculated by dividing the total number of enrollees who moved to Medicaid by the total number of QHP enrollees the previous month.
WA APPLE HEALTH - QHP
Oct. 1, 2015 - Sept. 1, 2016 Avg. Monthly Churn Percentage:
0.13%
Avg. Monthly Churn Total:1,873
Highest Month Churn Percentage: Jan. 1, 2016 - 0.27%
Highest Month Churn Total: Jan. 1, 2016 - 4,029
Medicaid – QHP: Enrollees who were enrolled in Medicaid in a given month and the next month they are enrolled in QHP. Percentage is calculated by dividing the total number of enrollees who moved to QHP by the total number of Medicaid enrollees the previous month.
SEP (Special Enrollment Period)
TOTAL:
Income ChangeTotal: 149 (3%)OtherTotal: 647 (8%)
BirthTotal: 492 (4%)
Loss of Health CoverageTotal: 8,726 (82%)
10,448
Change ofResidenceTotal: 434 (3%)
There are special circumstances that trigger a special enrollment period for an individual or family outside of open enrollment. These exceptions include, but are not limited to, change in income; marriage status, death, birth or adoption; loss of health coverage; and change of residence. Washington Apple Health, Native Americans, Alaskan Americans and SHOP employees can enroll any time of the year.
September 2016 SEP:
MSP=Multi-State Plan

Additional Data Washington Health Benefit ExchangeEnrollment Report
September 2016
Assisted Enrollees Families
Families Enrolled Total: 120,385
Mixed Families Total: 22,021 (18%)
In the month of September 2016
QHP
Mixed families are the total families enrolled both in QHP and WA Apple Health in September 2016.
Premiums and Financial Assistance - September 2016
*Only eligible with Silver plan enrollmentFA - Financial AssistanceAPTC - Advanced Premium Tax Credits
Total QHP premiums Total: $61,625,712
APTC Total Total: $27,132,208
Premiums andTax Credits
Without FA Total: $372.65/month
With FA Total: $208.58/month
Average monthly premium per person
CSR for Sept. 2016 Total: $5,403,183
Enrollees receiving CSR Total: 70,477
Cost-sharingreductions (CSR)*
All 2016 Assisted WA Apple
Health Enrollees
Broker Total: 21,378 (1%)
Navigator Total: 184,038 (12%)
All 2016 Assisted QHP
Enrollees
Broker Total: 31,629 (14%)
Navigator Total: 14,332 (6%)
11
Total 2016 QHP Enrollees: 223,235 Total 2016 WAH Enrollees: 1,531,402
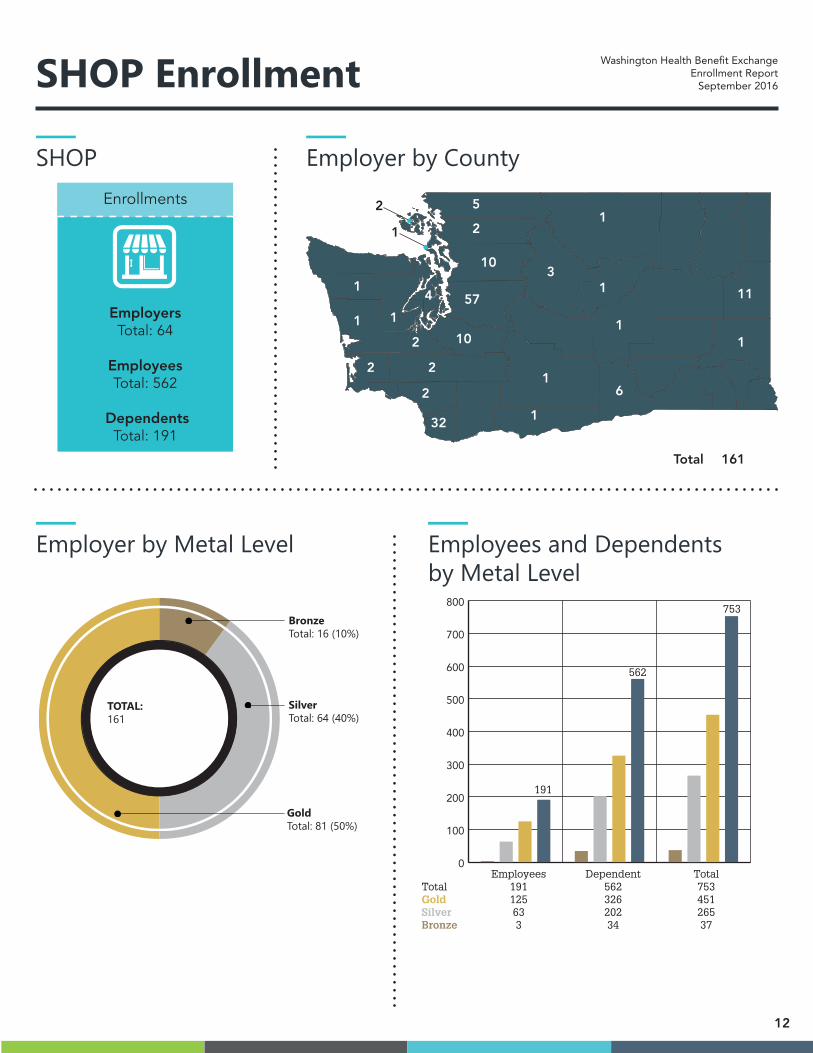
SHOP Enrollment Washington Health Benefit ExchangeEnrollment Report
September 2016
12
Employer by Metal Level
SHOP
Total 161
1
5
2
11
10
2
2
10
2 2
4 571
6
3
32
2
1
1
Enrollments
EmployersTotal: 64
EmployeesTotal: 562
Dependents Total: 191
Employer by County
Employees and Dependents by Metal Level
0
100
200
300
400
500
600
700
800
Employees Dependent TotalTotal 191 562 753 Gold 125 326 451Silver 63 202 265Bronze 3 34 37
1
1
1
1
TOTAL:
BronzeTotal: 16 (10%)
SilverTotal: 64 (40%)
GoldTotal: 81 (50%)
161
191
562
753
1
1