Embed Size (px)
Citation preview
Washington Health Benefit Exchange
Board Budget BriefingAugust 10, 2016
Carole Holland, CFO Danielle Cruver, AD Budget & Grants
Budget Framework
▪ Improve customer experience
▪ Achieve operational efficiencies
▪ Support core functions
▪ Grow enrollment
▪ Be sustainable
2
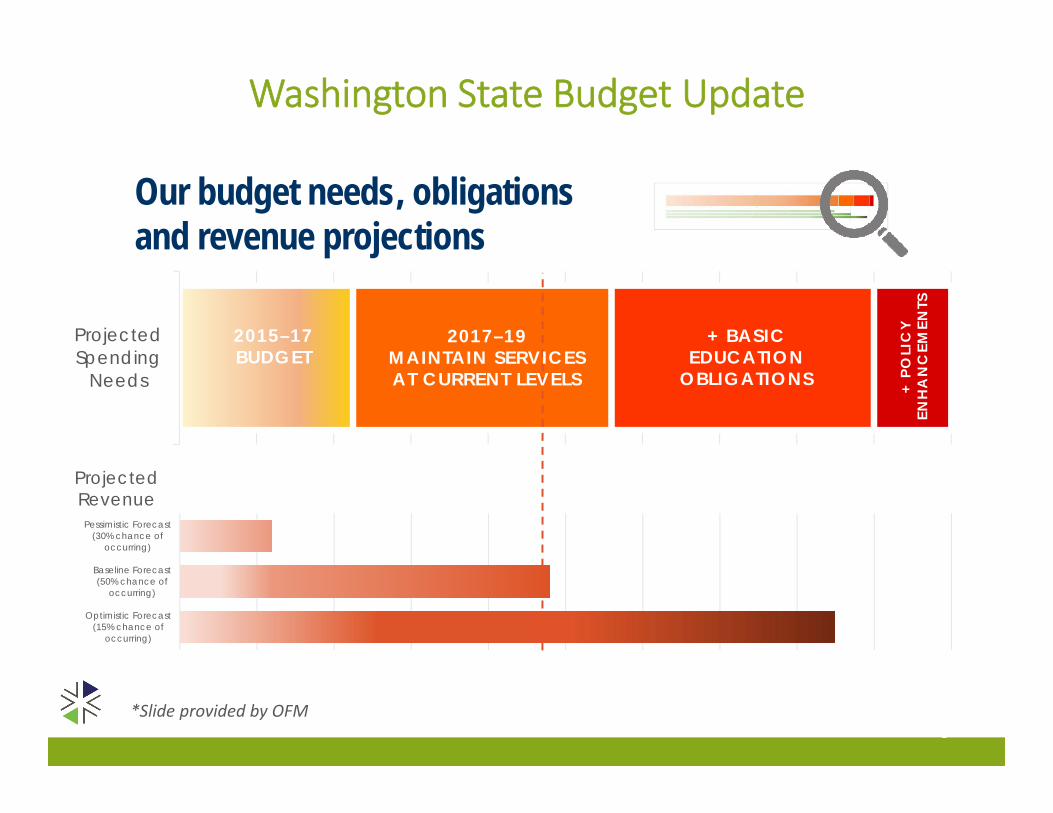
Our budget needs, obligations and revenue projections
Optimistic Forecast(15% chance of
occurring)
Baseline Forecast(50% chance of
occurring)
Pessimistic Forecast(30% chance of
occurring)
ProjectedSpending
Needs
+ BASIC EDUCATION
OBLIGATIONS + PO
LIC
Y
ENH
AN
CEM
ENTS
2015–17 BUDGET
Projected Revenue
2017–19MAINTAIN SERVICES AT CURRENT LEVELS
3*Slide provided by OFM
Washington State Budget Update
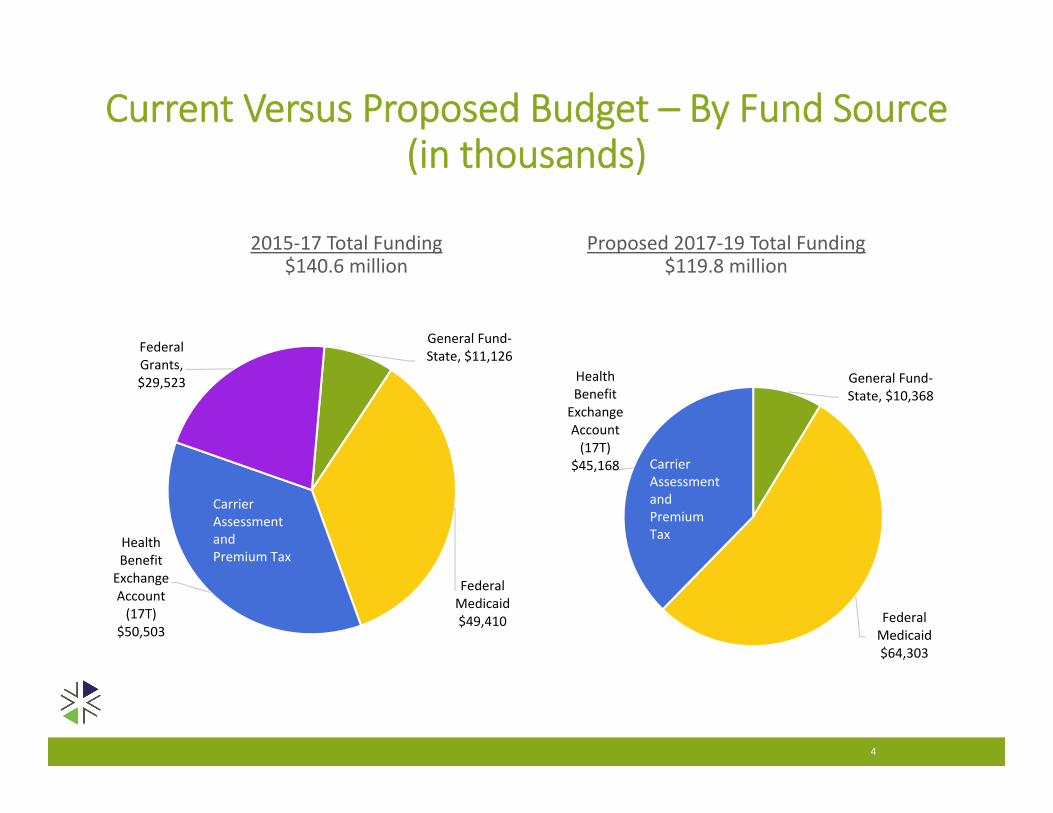
Current Versus Proposed Budget – By Fund Source (in thousands)
2015‐17 Total Funding$140.6 million
Proposed 2017‐19 Total Funding$119.8 million
4
General Fund‐State, $11,126
Federal Medicaid $49,410
Health Benefit Exchange Account (17T)
$50,503
Federal Grants, $29,523
Carrier Assessment and Premium Tax
General Fund‐State, $10,368
Federal Medicaid $64,303
Health Benefit Exchange Account (17T)
$45,168 Carrier Assessment and Premium Tax
HBE Budget Reflects Efforts to Reduce Costs▪ Since July 2015, total FTEs have been reduced from 144 to 128 and total staff
(including contractors) were reduced from 251 to 140 (a 44% reduction)
▪ Use of contractors, including those working on IT releases and the implementation of the new financial system has been greatly decreased (107 in July 2015 to 24 in June 2016)
▪ Deloitte contract renegotiated and will save around $1 million per year in maintenance and operations costs and an 8% reduction in the cost of development hours with no inflationary increases for the period of the 42 month contract
▪ Total call center costs have been reduced from $16.2 million in 2014 to $11.4 million in 2017
▪ Savings in software contracts has allowed the Exchange to cover the costs of periodic updates
▪ Carrier assessment rates were not increased in calendar year 2017 and none of the carrier assessment is expected to be used for Medicaid match
5
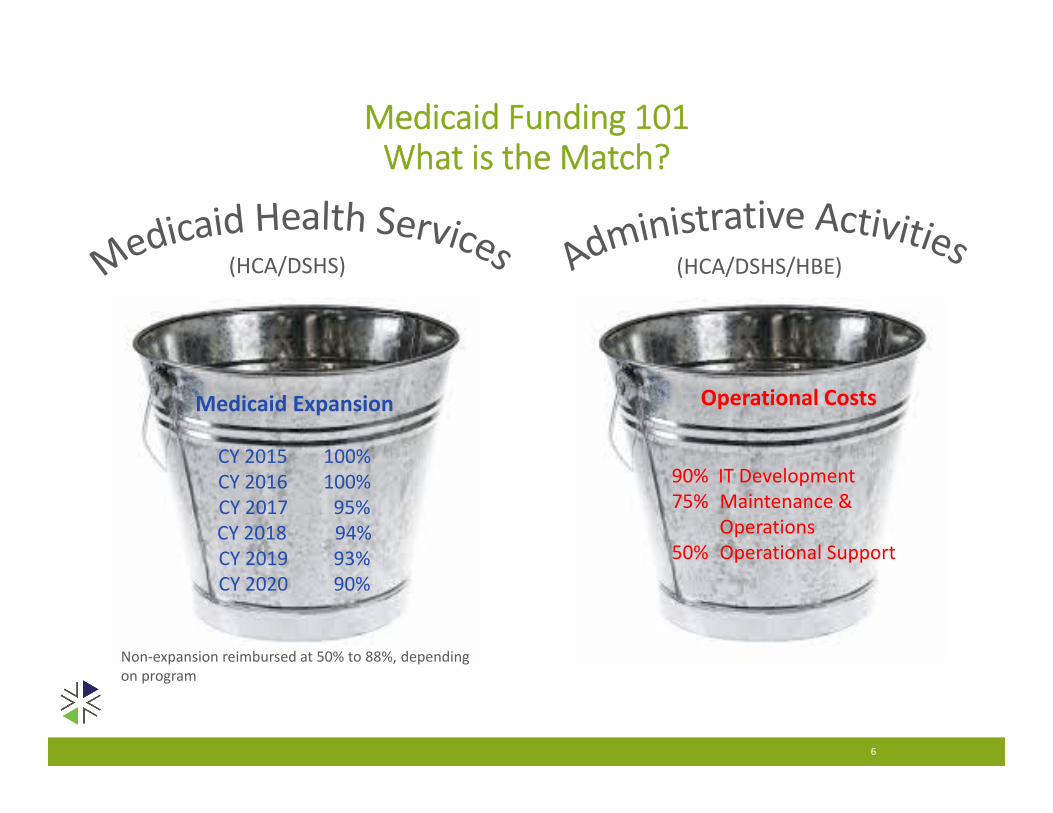
Medicaid Funding 101What is the Match?
6
Medicaid Expansion
CY 2015 100%CY 2016 100%CY 2017 95%CY 2018 94%CY 2019 93%CY 2020 90%
Operational Costs
90% IT Development 75% Maintenance &
Operations 50% Operational Support
Non‐expansion reimbursed at 50% to 88%, depending on program
(HCA/DSHS) (HCA/DSHS/HBE)
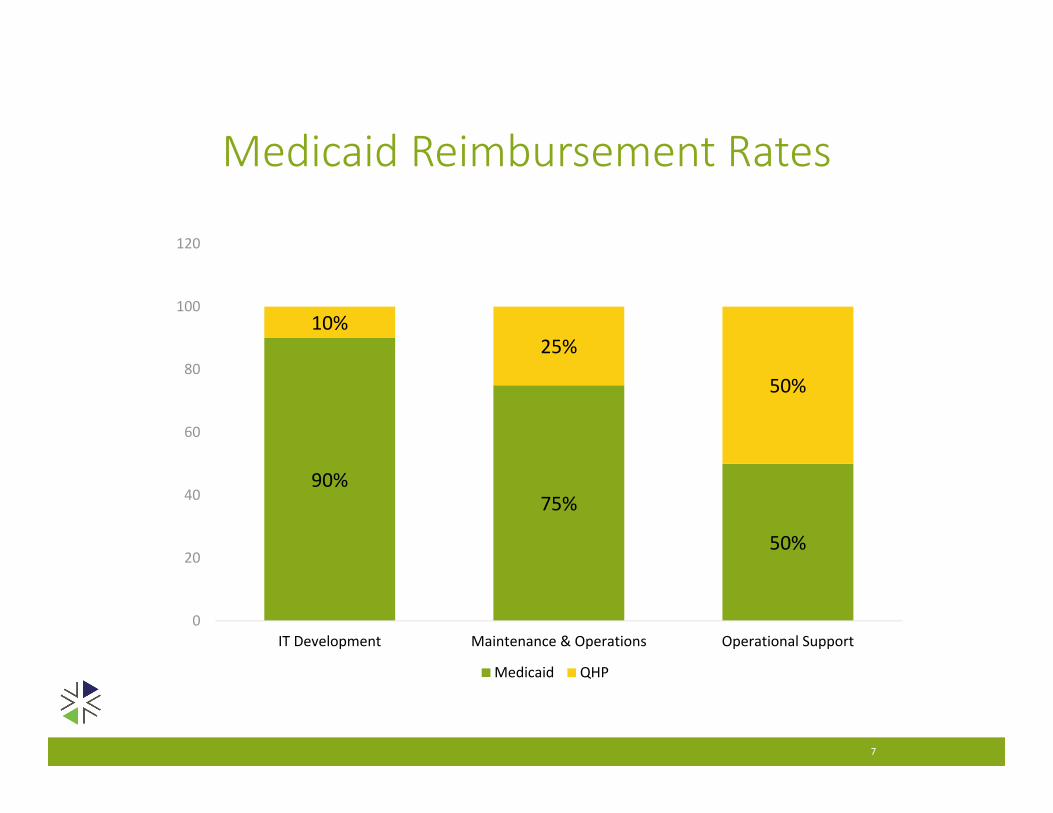
Medicaid Reimbursement Rates
90%75%
50%
10%25%
50%
0
20
40
60
80
100
120
IT Development Maintenance & Operations Operational Support
Medicaid QHP
7
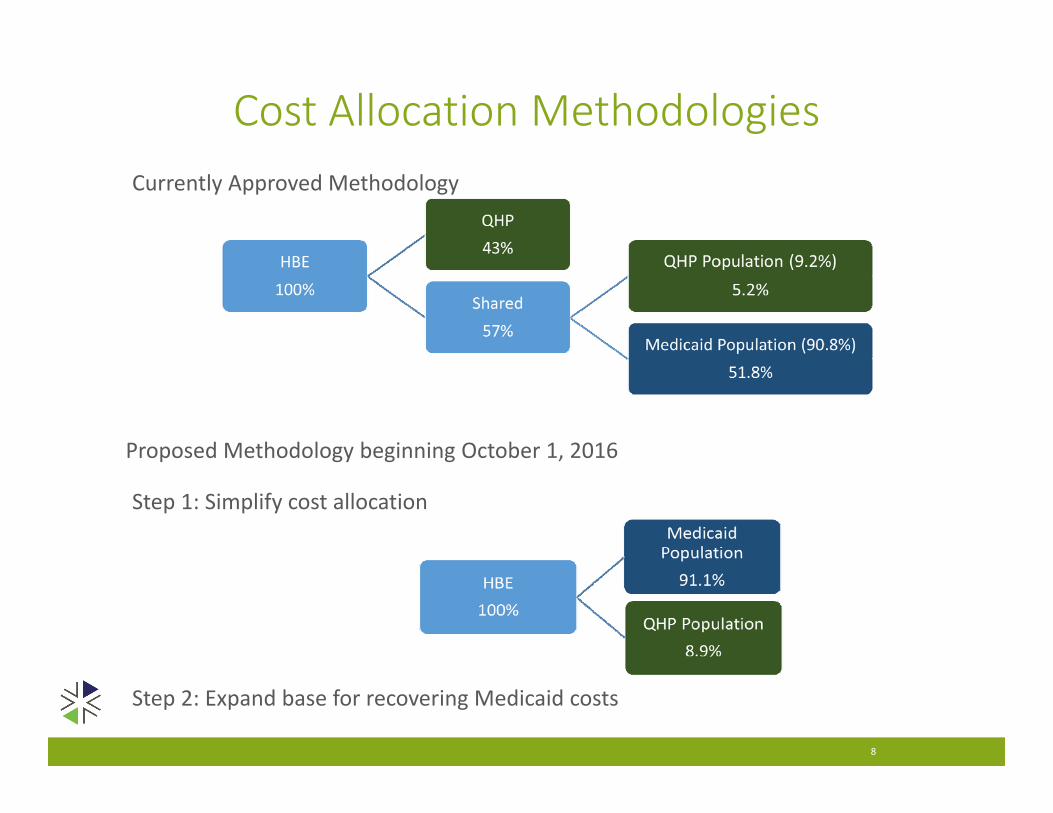
Cost Allocation Methodologies
8
Currently Approved Methodology
Proposed Methodology beginning October 1, 2016
Step 2: Expand base for recovering Medicaid costs
Step 1: Simplify cost allocation
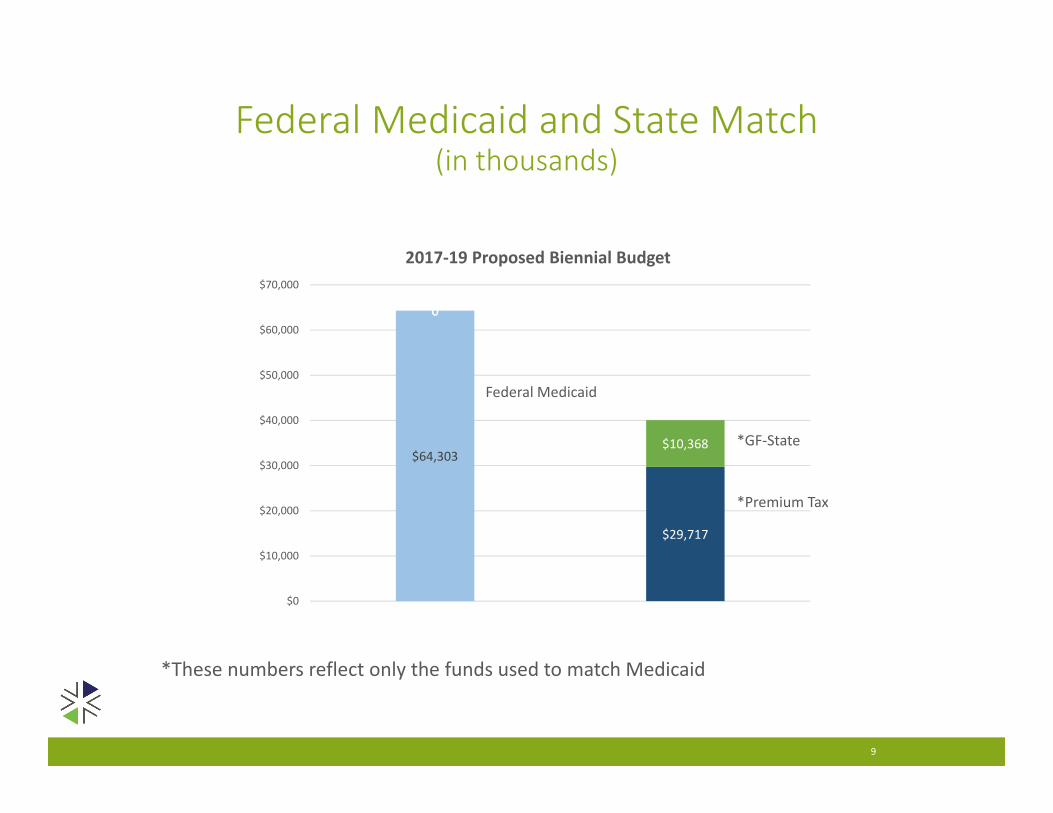
Federal Medicaid and State Match(in thousands)
9
$64,303
0
$29,717
0
$10,368
$0
$10,000
$20,000
$30,000
$40,000
$50,000
$60,000
$70,000
2017‐19 Proposed Biennial Budget
*GF‐State
*Premium Tax
Federal Medicaid
*These numbers reflect only the funds used to match Medicaid
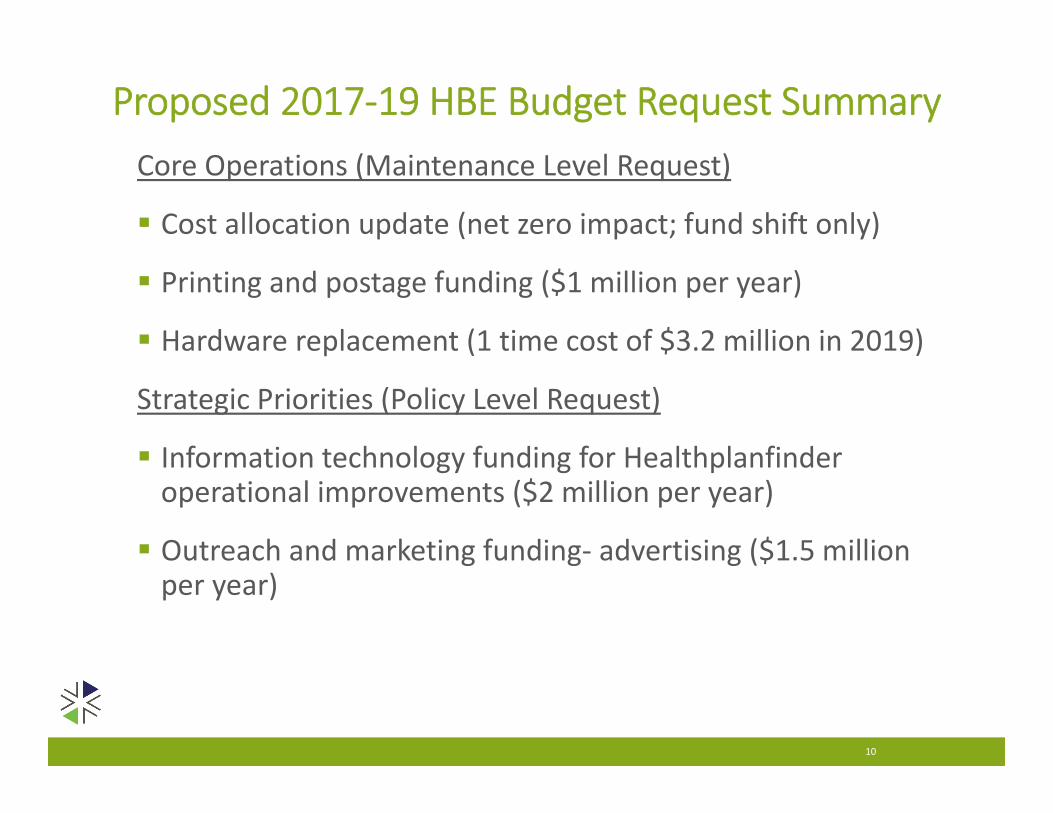
Proposed 2017‐19 HBE Budget Request SummaryCore Operations (Maintenance Level Request)
Cost allocation update (net zero impact; fund shift only)
Printing and postage funding ($1 million per year)
Hardware replacement (1 time cost of $3.2 million in 2019)
Strategic Priorities (Policy Level Request)
Information technology funding for Healthplanfinder operational improvements ($2 million per year)
Outreach and marketing funding‐ advertising ($1.5 million per year)
10
Proposed 2017 HBE Supplemental Request
Core Operations (Maintenance Level Request)
Cost allocation update (net zero impact; fund shift only)
Printing and postage funding ($1 million per year)
11

Next Steps
2017‐19 Board Budget Process May Discussed concepts with Board
June Board strategic planning
July Board review of decision packages (DP)
August Board votes on budget Transmit budget request to HCA for submittal to OFM
September‐ December Board engagement with key stakeholders
13
What This Budget Achieves Requests appropriation authority to spend revenues currently projected
Does not request new General Fund‐state $
Maximizes federal Medicaid dollars
Keeps carrier assessment stable (same rate for 16,17,18 and 19)
Funds minimum essential services only
Makes targeted investments that improve customer experience and ensures continued operational efficiencies
14
HBE Budget Message
Key goal of this budget is to be sustainable Exchange has taken aggressive efforts to reduce costs Continued IT funding for improved customer experience and operating efficiencies necessary for sustainability Keeps carrier assessment stable and does not use assessment for Medicaid match However, need current General Fund‐ State $ to avoid using carrier assessment as Medicaid match Need proviso that allow for a working cash operating reserve to address revenue fluctuations and cash flow
15
Requested Board Action
Motion to submit HBE budget for 2017‐19
Motion to submit HBE budget for 2017 supplemental
16
Appendix
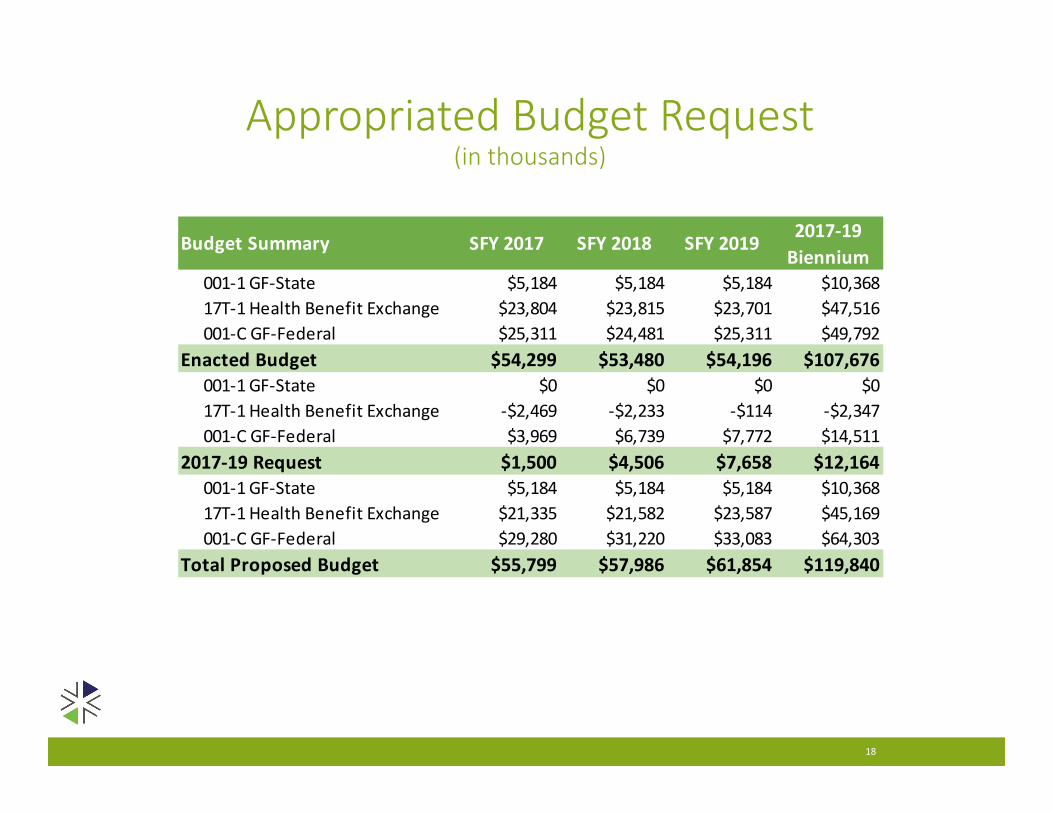
Appropriated Budget Request(in thousands)
18
Budget Summary SFY 2017 SFY 2018 SFY 2019 2017‐19 Biennium
001‐1 GF‐State $5,184 $5,184 $5,184 $10,36817T‐1 Health Benefit Exchange $23,804 $23,815 $23,701 $47,516001‐C GF‐Federal $25,311 $24,481 $25,311 $49,792
Enacted Budget $54,299 $53,480 $54,196 $107,676001‐1 GF‐State $0 $0 $0 $017T‐1 Health Benefit Exchange ‐$2,469 ‐$2,233 ‐$114 ‐$2,347001‐C GF‐Federal $3,969 $6,739 $7,772 $14,511
2017‐19 Request $1,500 $4,506 $7,658 $12,164001‐1 GF‐State $5,184 $5,184 $5,184 $10,36817T‐1 Health Benefit Exchange $21,335 $21,582 $23,587 $45,169001‐C GF‐Federal $29,280 $31,220 $33,083 $64,303
Total Proposed Budget $55,799 $57,986 $61,854 $119,840
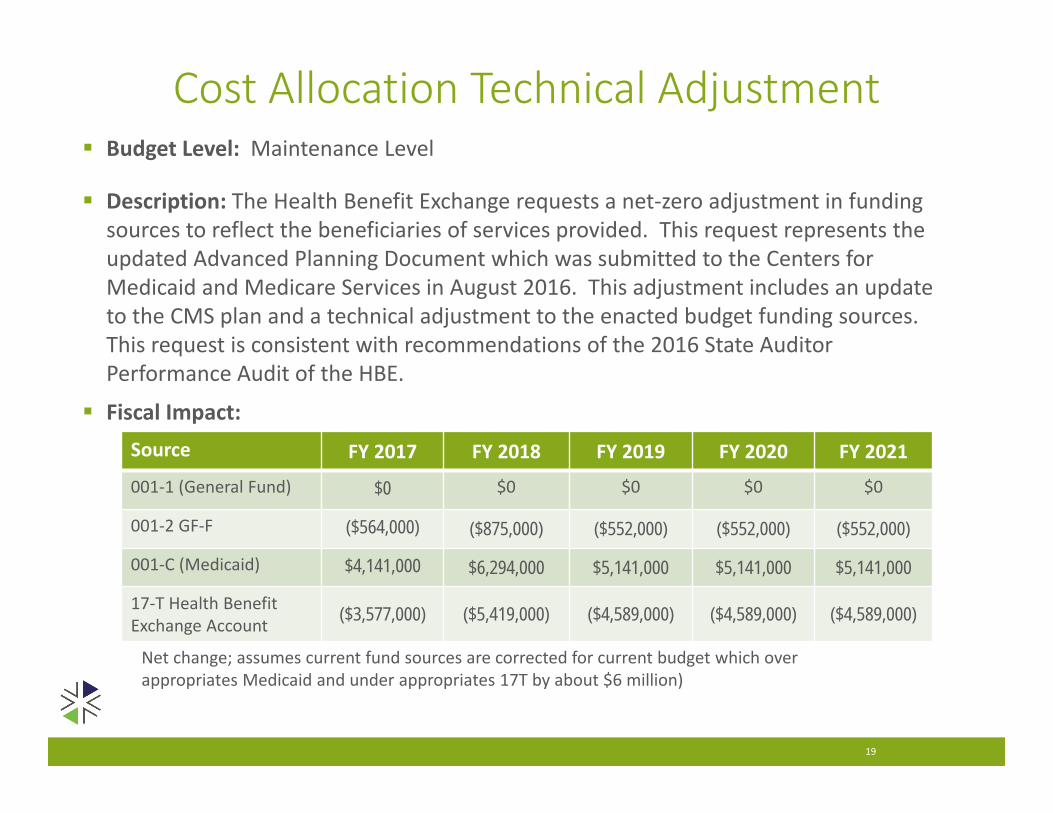
Cost Allocation Technical Adjustment Budget Level: Maintenance Level
Description: The Health Benefit Exchange requests a net‐zero adjustment in funding sources to reflect the beneficiaries of services provided. This request represents the updated Advanced Planning Document which was submitted to the Centers for Medicaid and Medicare Services in August 2016. This adjustment includes an update to the CMS plan and a technical adjustment to the enacted budget funding sources. This request is consistent with recommendations of the 2016 State Auditor Performance Audit of the HBE.
Fiscal Impact:Source FY 2017 FY 2018 FY 2019 FY 2020 FY 2021
001‐1 (General Fund) $0 $0 $0 $0 $0
001‐2 GF‐F ($564,000) ($875,000) ($552,000) ($552,000) ($552,000)
001‐C (Medicaid) $4,141,000 $6,294,000 $5,141,000 $5,141,000 $5,141,000
17‐T Health Benefit Exchange Account ($3,577,000) ($5,419,000) ($4,589,000) ($4,589,000) ($4,589,000)
Net change; assumes current fund sources are corrected for current budget which over appropriates Medicaid and under appropriates 17T by about $6 million)
19
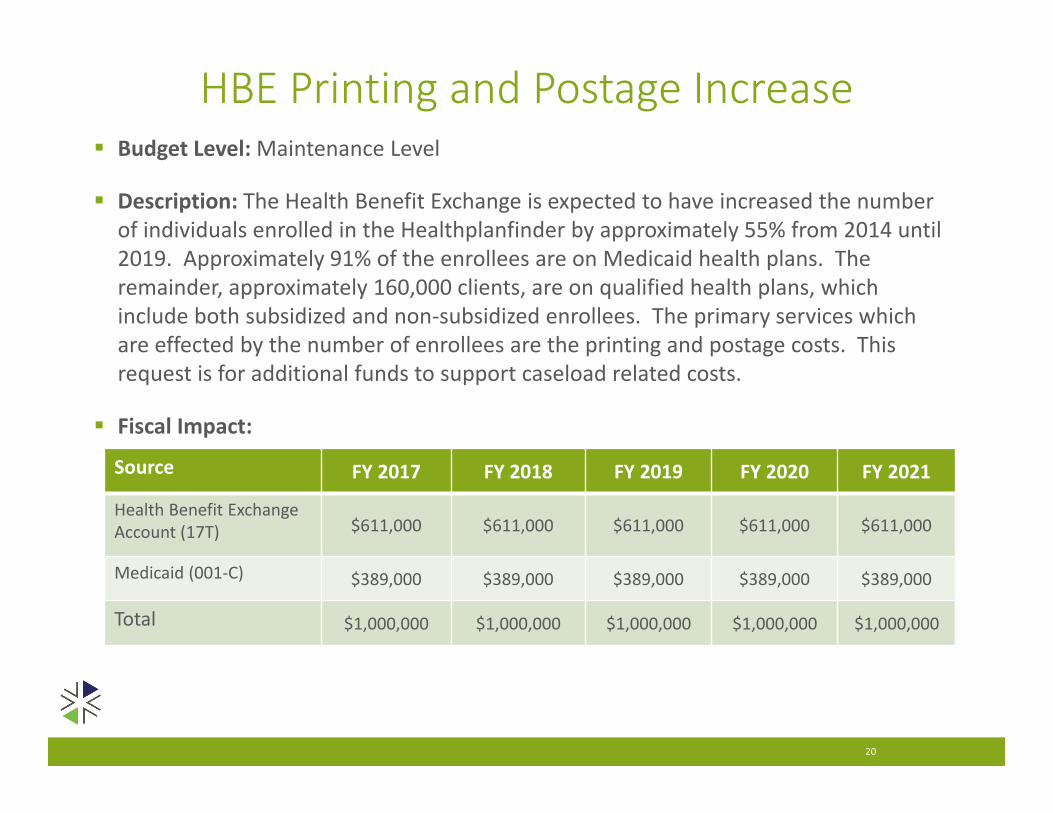
HBE Printing and Postage Increase Budget Level:Maintenance Level
Description: The Health Benefit Exchange is expected to have increased the number of individuals enrolled in the Healthplanfinder by approximately 55% from 2014 until 2019. Approximately 91% of the enrollees are on Medicaid health plans. The remainder, approximately 160,000 clients, are on qualified health plans, which include both subsidized and non‐subsidized enrollees. The primary services which are effected by the number of enrollees are the printing and postage costs. This request is for additional funds to support caseload related costs.
Fiscal Impact:
20
Source FY 2017 FY 2018 FY 2019 FY 2020 FY 2021
Health Benefit Exchange Account (17T) $611,000 $611,000 $611,000 $611,000 $611,000
Medicaid (001‐C) $389,000 $389,000 $389,000 $389,000 $389,000
Total $1,000,000 $1,000,000 $1,000,000 $1,000,000 $1,000,000
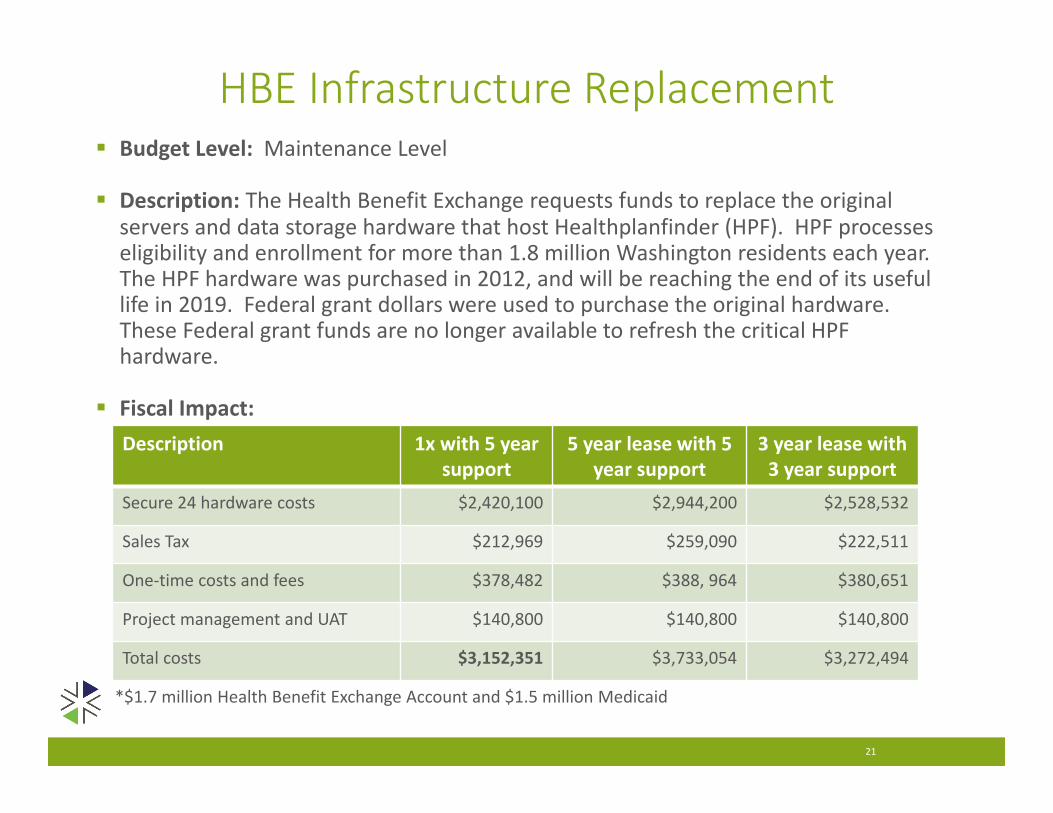
HBE Infrastructure Replacement Budget Level: Maintenance Level
Description: The Health Benefit Exchange requests funds to replace the original servers and data storage hardware that host Healthplanfinder (HPF). HPF processes eligibility and enrollment for more than 1.8 million Washington residents each year. The HPF hardware was purchased in 2012, and will be reaching the end of its useful life in 2019. Federal grant dollars were used to purchase the original hardware. These Federal grant funds are no longer available to refresh the critical HPF hardware.
Fiscal Impact:Description 1x with 5 year
support5 year lease with 5
year support3 year lease with 3 year support
Secure 24 hardware costs $2,420,100 $2,944,200 $2,528,532
Sales Tax $212,969 $259,090 $222,511
One‐time costs and fees $378,482 $388, 964 $380,651
Project management and UAT $140,800 $140,800 $140,800
Total costs $3,152,351 $3,733,054 $3,272,494
21
*$1.7 million Health Benefit Exchange Account and $1.5 million Medicaid
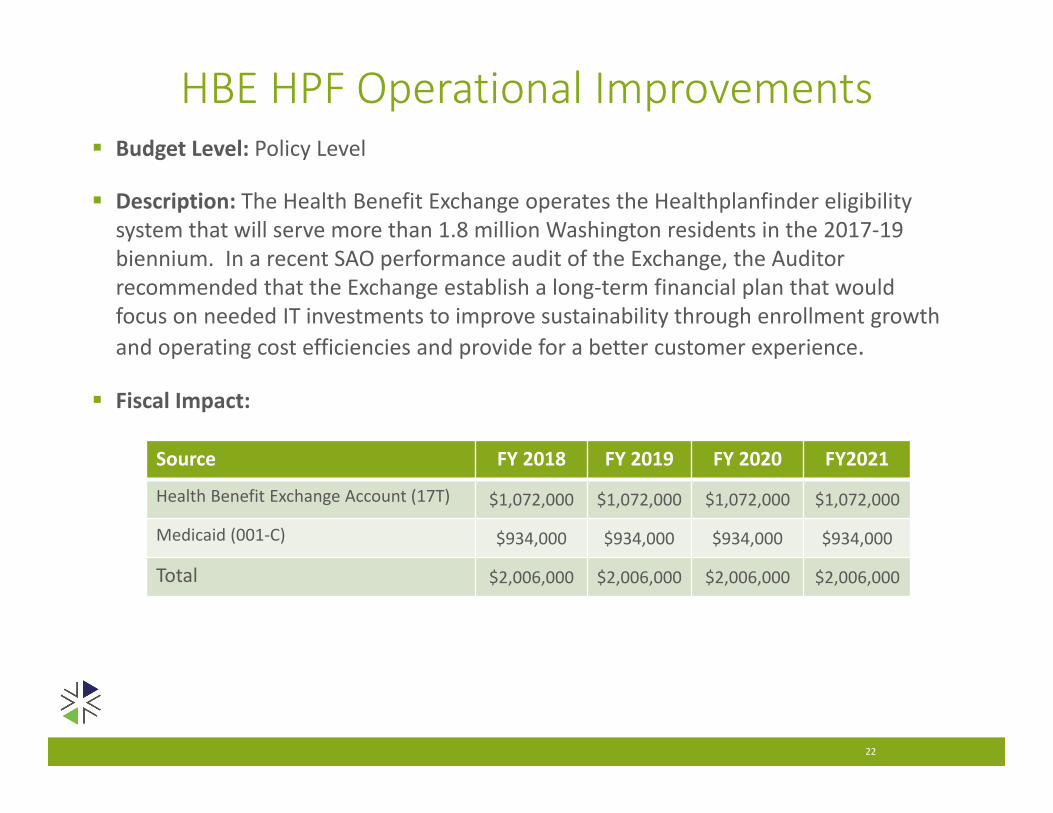
HBE HPF Operational Improvements Budget Level: Policy Level
Description: The Health Benefit Exchange operates the Healthplanfinder eligibility system that will serve more than 1.8 million Washington residents in the 2017‐19 biennium. In a recent SAO performance audit of the Exchange, the Auditor recommended that the Exchange establish a long‐term financial plan that would focus on needed IT investments to improve sustainability through enrollment growth and operating cost efficiencies and provide for a better customer experience.
Fiscal Impact:
22
Source FY 2018 FY 2019 FY 2020 FY2021
Health Benefit Exchange Account (17T) $1,072,000 $1,072,000 $1,072,000 $1,072,000
Medicaid (001‐C) $934,000 $934,000 $934,000 $934,000
Total $2,006,000 $2,006,000 $2,006,000 $2,006,000
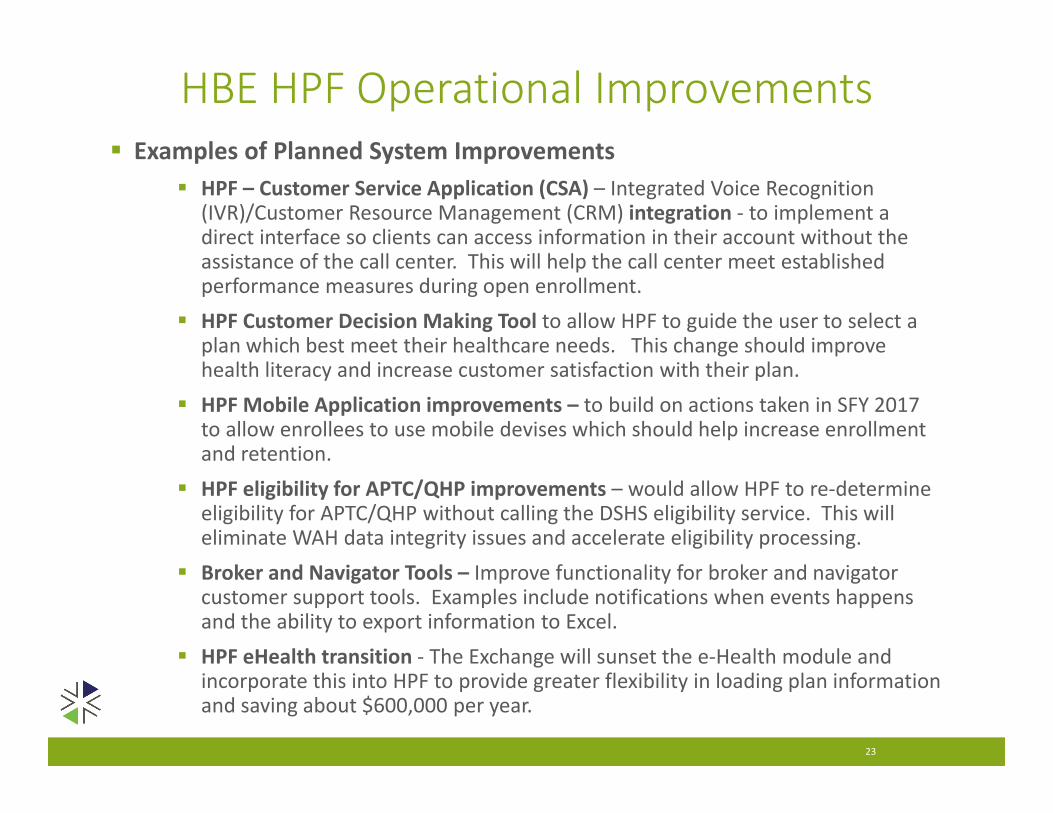
HBE HPF Operational Improvements Examples of Planned System Improvements
HPF – Customer Service Application (CSA) – Integrated Voice Recognition (IVR)/Customer Resource Management (CRM) integration ‐ to implement a direct interface so clients can access information in their account without the assistance of the call center. This will help the call center meet established performance measures during open enrollment.
HPF Customer Decision Making Tool to allow HPF to guide the user to select a plan which best meet their healthcare needs. This change should improve health literacy and increase customer satisfaction with their plan.
HPF Mobile Application improvements – to build on actions taken in SFY 2017 to allow enrollees to use mobile devises which should help increase enrollment and retention.
HPF eligibility for APTC/QHP improvements – would allow HPF to re‐determine eligibility for APTC/QHP without calling the DSHS eligibility service. This will eliminate WAH data integrity issues and accelerate eligibility processing.
Broker and Navigator Tools – Improve functionality for broker and navigator customer support tools. Examples include notifications when events happens and the ability to export information to Excel.
HPF eHealth transition ‐ The Exchange will sunset the e‐Health module and incorporate this into HPF to provide greater flexibility in loading plan information and saving about $600,000 per year.
23

Consumer Outreach and Marketing Budget Level: Policy Level
Description: The Health Benefit Exchange must retain and/or grow the number of qualified health plan (QHP) enrollees to be self‐sustainable. Currently the Exchange earns approximately $15 per member per month for each enrollee. A recent analysis by The Henry J. Kaiser Family Foundation identified that Washington had only 35% of marketplace signups as a share of the potential market in 2016 and 46% of the subsidized QHP marketplace QHP as a share of the estimated eligible enrollees. The SAO 2016 Performance report recommended the Exchange increase its enrollments to achieve sustainability. In addition, discussions with CCIO indicate an interest in having sufficient marketing resources. Outreach and advertising resources are key to achieving increased enrollment.
Fiscal Impact:
24
Source FY 2018 FY 2019 FY 2020 FY 2021
Health Benefit Exchange Account (17T) $1,108,000 $1,108,000 $1,108,000 $1,108,000
Medicaid (001‐C) $392,000 $392,000 $392,000 $392,000
Total $1,500,000 $1,500,000 $1,500,000 $1,500,000
25
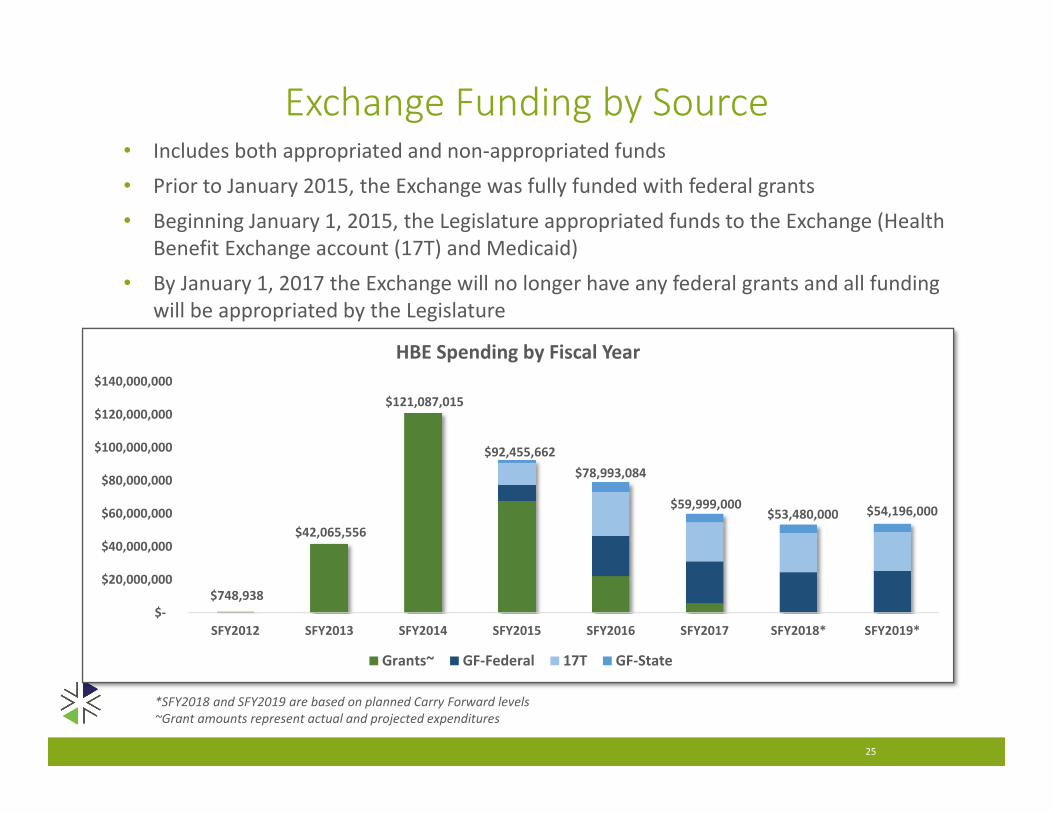
*SFY2018 and SFY2019 are based on planned Carry Forward levels~Grant amounts represent actual and projected expenditures
$748,938
$42,065,556
$121,087,015
$92,455,662 $78,993,084
$59,999,000 $53,480,000 $54,196,000
$‐
$20,000,000
$40,000,000
$60,000,000
$80,000,000
$100,000,000
$120,000,000
$140,000,000
SFY2012 SFY2013 SFY2014 SFY2015 SFY2016 SFY2017 SFY2018* SFY2019*
HBE Spending by Fiscal Year
Grants~ GF‐Federal 17T GF‐State
• Includes both appropriated and non‐appropriated funds• Prior to January 2015, the Exchange was fully funded with federal grants• Beginning January 1, 2015, the Legislature appropriated funds to the Exchange (Health
Benefit Exchange account (17T) and Medicaid)• By January 1, 2017 the Exchange will no longer have any federal grants and all funding
will be appropriated by the Legislature
Exchange Funding by Source
26
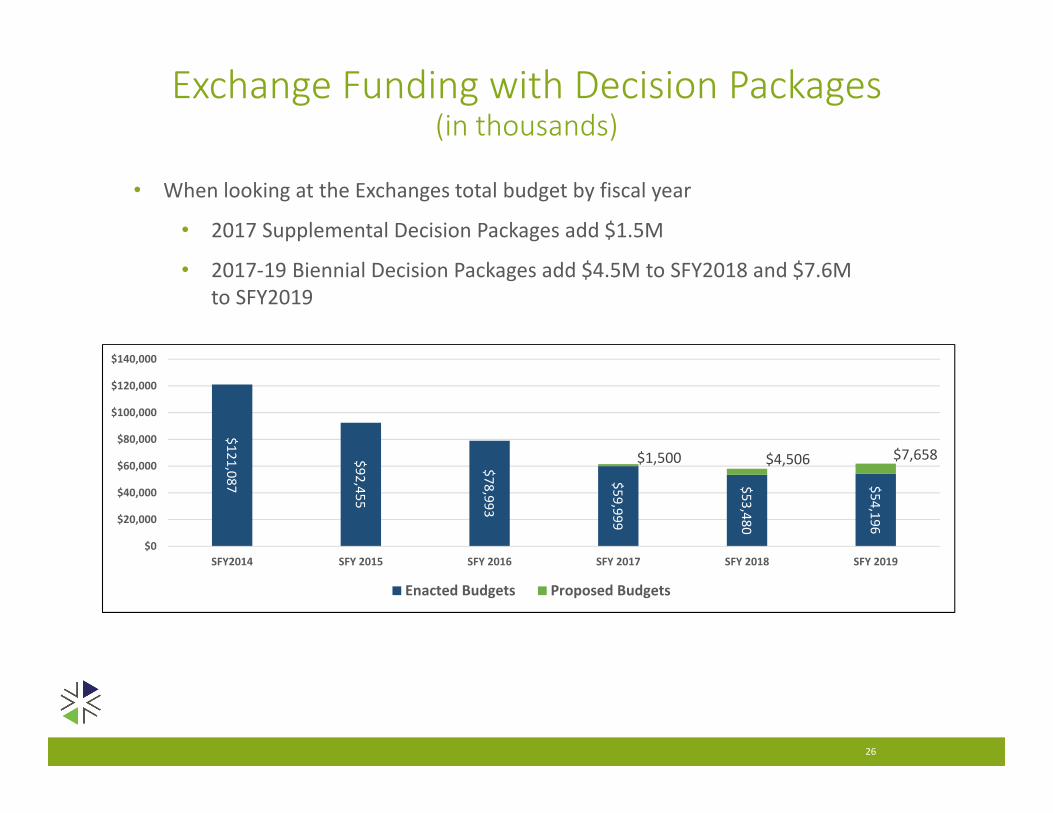
• When looking at the Exchanges total budget by fiscal year
• 2017 Supplemental Decision Packages add $1.5M
• 2017‐19 Biennial Decision Packages add $4.5M to SFY2018 and $7.6M to SFY2019
Exchange Funding with Decision Packages(in thousands)
$121,087
$92,455
$78,993
$59,999
$53,480
$54,196
$1,500 $4,506 $7,658
$0
$20,000
$40,000
$60,000
$80,000
$100,000
$120,000
$140,000
SFY2014 SFY 2015 SFY 2016 SFY 2017 SFY 2018 SFY 2019
Enacted Budgets Proposed Budgets
27
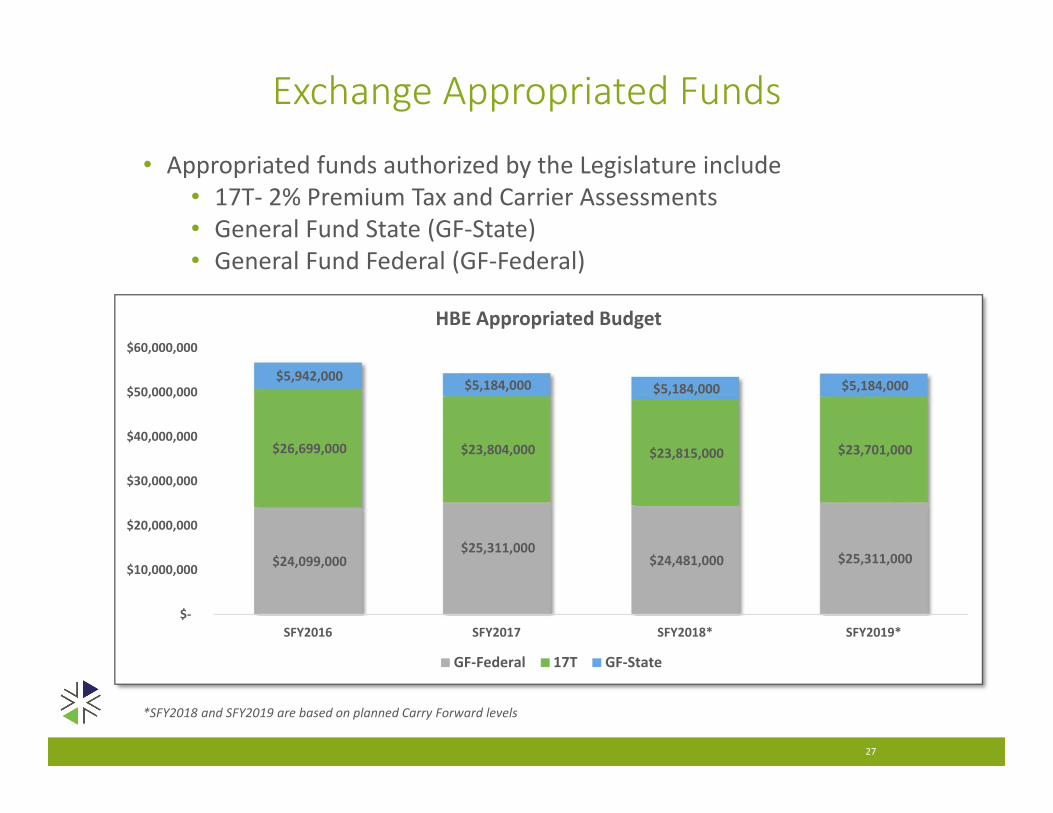
*SFY2018 and SFY2019 are based on planned Carry Forward levels
$24,099,000 $25,311,000
$24,481,000 $25,311,000
$26,699,000 $23,804,000 $23,815,000 $23,701,000
$5,942,000 $5,184,000 $5,184,000 $5,184,000
$‐
$10,000,000
$20,000,000
$30,000,000
$40,000,000
$50,000,000
$60,000,000
SFY2016 SFY2017 SFY2018* SFY2019*
HBE Appropriated Budget
GF‐Federal 17T GF‐State
Exchange Appropriated Funds
• Appropriated funds authorized by the Legislature include• 17T‐ 2% Premium Tax and Carrier Assessments • General Fund State (GF‐State)• General Fund Federal (GF‐Federal)
28
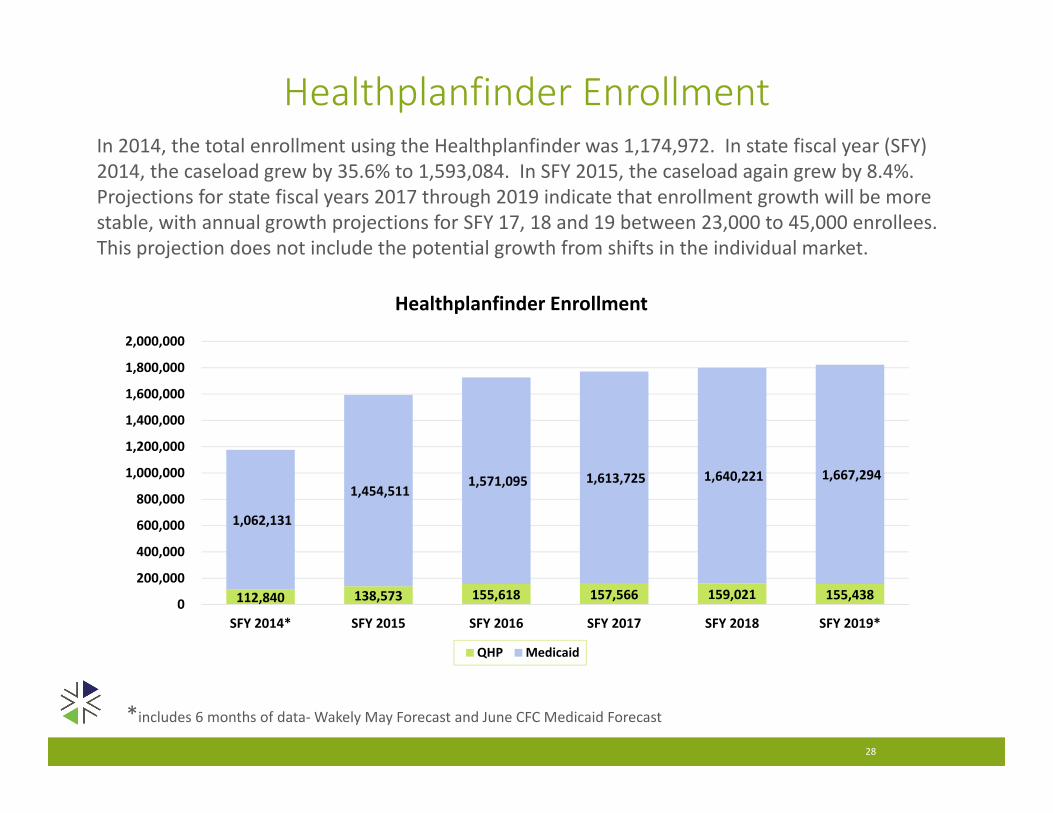
In 2014, the total enrollment using the Healthplanfinder was 1,174,972. In state fiscal year (SFY) 2014, the caseload grew by 35.6% to 1,593,084. In SFY 2015, the caseload again grew by 8.4%. Projections for state fiscal years 2017 through 2019 indicate that enrollment growth will be more stable, with annual growth projections for SFY 17, 18 and 19 between 23,000 to 45,000 enrollees. This projection does not include the potential growth from shifts in the individual market.
Healthplanfinder Enrollment
*includes 6 months of data‐Wakely May Forecast and June CFC Medicaid Forecast
112,840 138,573 155,618 157,566 159,021 155,438
1,062,131
1,454,511 1,571,095 1,613,725 1,640,221 1,667,294
0
200,000
400,000
600,000
800,000
1,000,000
1,200,000
1,400,000
1,600,000
1,800,000
2,000,000
SFY 2014* SFY 2015 SFY 2016 SFY 2017 SFY 2018 SFY 2019*
Healthplanfinder Enrollment
QHP Medicaid
Revenue Forecast Compared to Appropriation
29
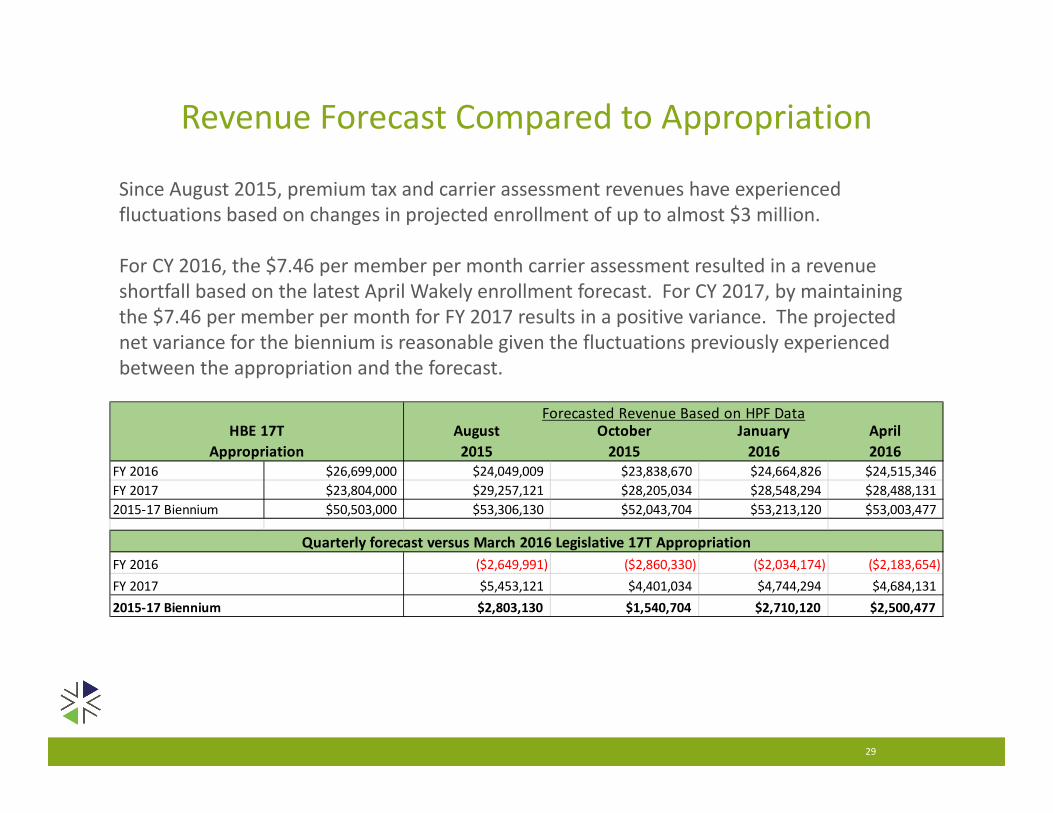
Since August 2015, premium tax and carrier assessment revenues have experienced fluctuations based on changes in projected enrollment of up to almost $3 million.
For CY 2016, the $7.46 per member per month carrier assessment resulted in a revenue shortfall based on the latest April Wakely enrollment forecast. For CY 2017, by maintaining the $7.46 per member per month for FY 2017 results in a positive variance. The projected net variance for the biennium is reasonable given the fluctuations previously experienced between the appropriation and the forecast.
August2015
October2015
January2016
April2016
FY 2016 $26,699,000 $24,049,009 $23,838,670 $24,664,826 $24,515,346FY 2017 $23,804,000 $29,257,121 $28,205,034 $28,548,294 $28,488,1312015‐17 Biennium $50,503,000 $53,306,130 $52,043,704 $53,213,120 $53,003,477
($2,649,991) ($2,860,330) ($2,034,174) ($2,183,654)$5,453,121 $4,401,034 $4,744,294 $4,684,131$2,803,130 $1,540,704 $2,710,120 $2,500,477
Forecasted Revenue Based on HPF Data
2015‐17 BienniumFY 2017FY 2016
Quarterly forecast versus March 2016 Legislative 17T Appropriation
HBE 17T Appropriation