Embed Size (px)
Citation preview
Warm-up2.4 Summary Statistics
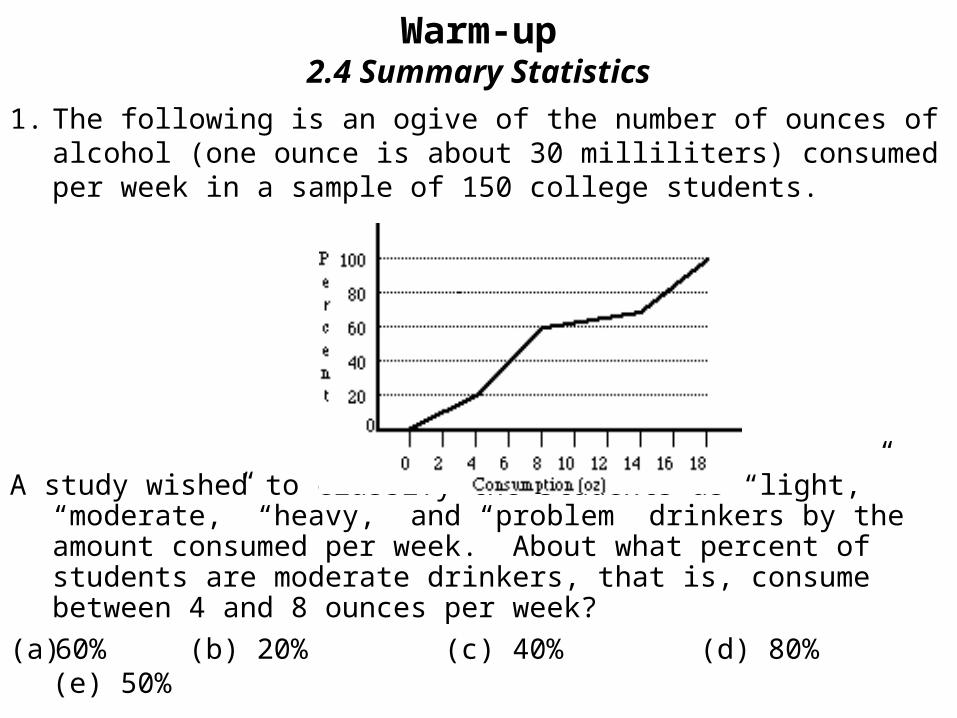
1. The following is an ogive of the number of ounces of alcohol (one ounce is about 30 milliliters) consumed per week in a sample of 150 college students.
A study wished to classify the students as “light,” “moderate,” “heavy,” and “problem” drinkers by the amount consumed per week. About what percent of students are moderate drinkers, that is, consume between 4 and 8 ounces per week?
(a)60% (b) 20% (c) 40% (d) 80% (e) 50%
Student of the day!Block 1

Student of the day!Block 2

H.W. Answers 2.3 D#16

c. and d. of D #16

e. D #16
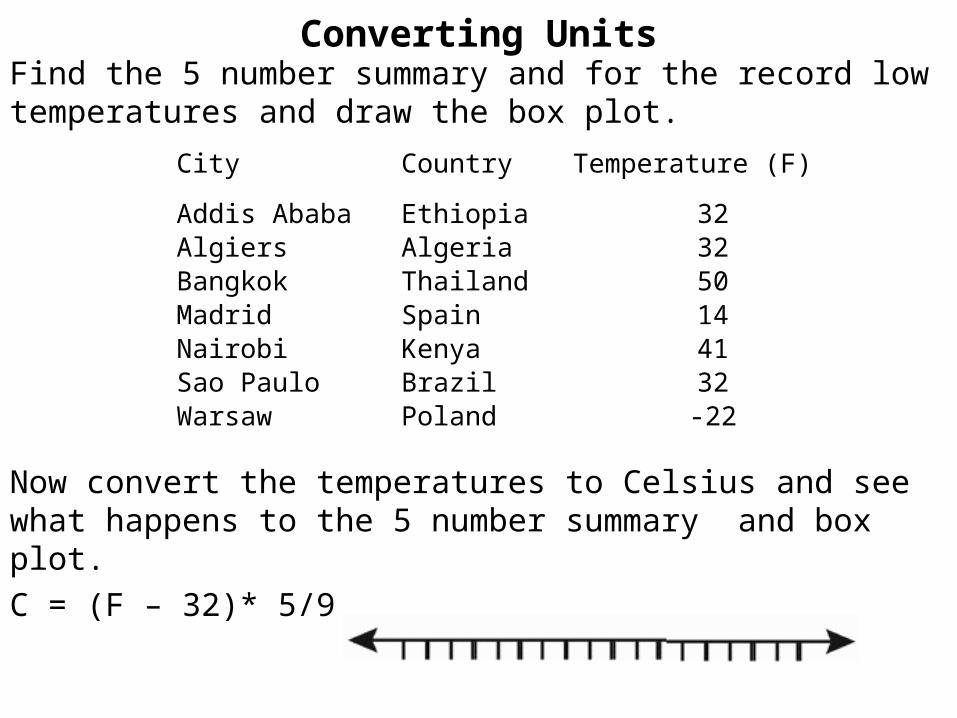
Converting UnitsFind the 5 number summary and for the record low temperatures and draw the box plot.
Now convert the temperatures to Celsius and see what happens to the 5 number summary and box plot.C = (F – 32)* 5/9
City Country Temperature (F)
Addis Ababa Ethiopia 32Algiers Algeria 32Bangkok Thailand 50Madrid Spain 14Nairobi Kenya 41Sao Paulo Brazil 32Warsaw Poland -22
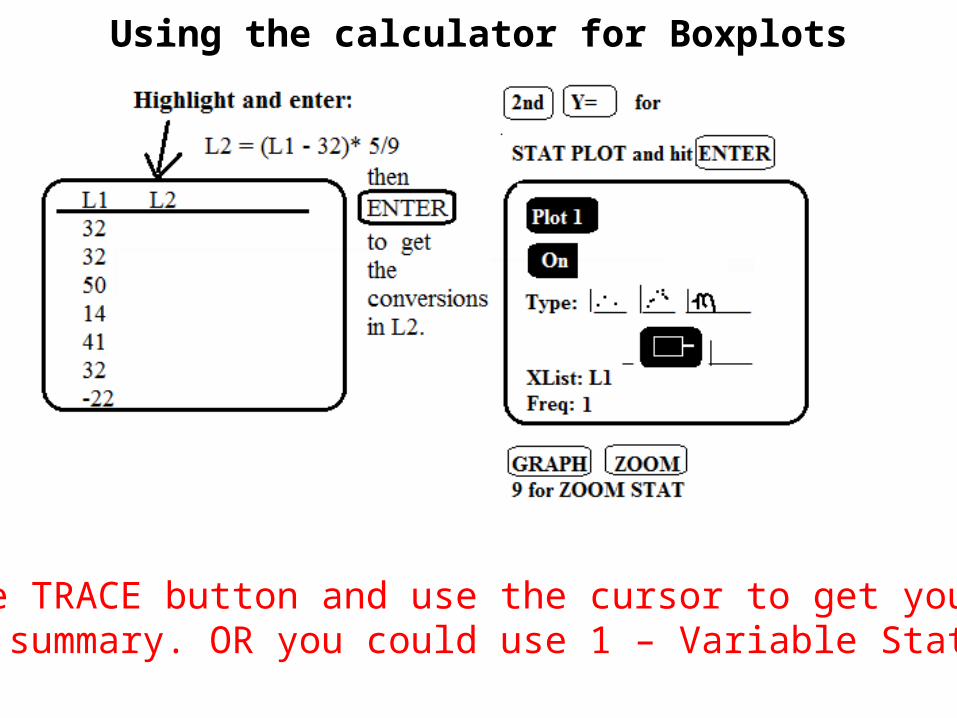
Using the calculator for Boxplots
Hit the TRACE button and use the cursor to get your 5 number summary. OR you could use 1 – Variable Stats
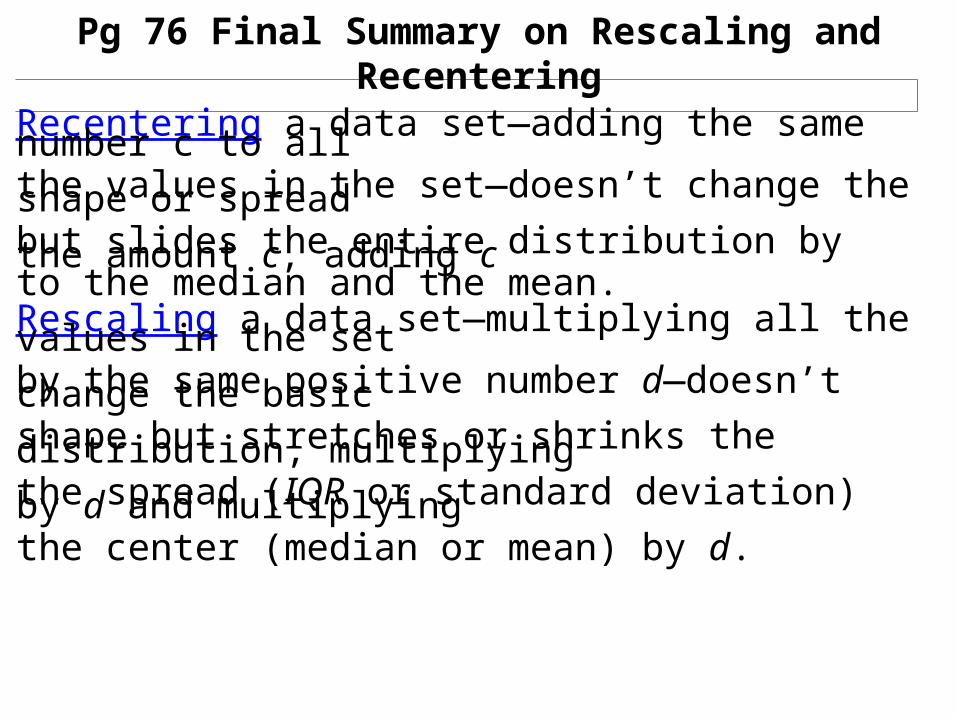
Pg 76 Final Summary on Rescaling and Recentering
Recentering a data set—adding the same number c to all the values in the set—doesn’t change the shape or spread but slides the entire distribution by the amount c, adding c to the median and the mean. Rescaling a data set—multiplying all the values in the set by the same positive number d—doesn’t change the basic shape but stretches or shrinks the distribution, multiplying the spread (IQR or standard deviation) by d and multiplying the center (median or mean) by d.

Summary Statistics and Resistant to Outliers
Suppose you were working with a realtor to find a new home. You are interested in a particular area, but you are not sure if the houses are in your budget. The realtor has access to the median and mean price of homes in different areas. Which one do you believe most accurately represents the neighborhood and why?
Think-Pair-ShareUse the first minute to think and write down your answer.After the minute share your answers at your table.Come up with your joint answer for your table to share with the class.

Pg 81 E #48 and End of Chapter Info.• Answer E#48 a – c and explain. • If you finish before the 10 minutes, start on the 2.1 to 2.4
Review.• There will be a 2.1 to 2.4 Quiz, next blockAnything in the notes or from the homework could be on thequiz, so be sure to review your materials.• The last section in Ch. 2 will be 2.5.• After the lesson on 2.5 there will be a notebook check on
1.0 to 2.5 notes and definitions from Ch. 2• We will have two blocks of review in class before the test
on Ch. 1 and Ch. 2

Answers to E #48 a. – c.
a.
b.
c.

Dear OCSA Students: When school first started you did a great job throwing your lunch time trash away. Since then, however, it has gottenprogressively worse. Yesterday, (Tuesday) was particularly bad, with trash left on 10th street, in the planters and on thetower tables. I was thoroughly embarrassed when Dr. Opacic brought it up since he was visiting the school right afterlunch. This is the man who founded our school and without whom none of us would be here. He, and all of you, deservebetter than to leave our campus looking like the students here don’t care about their school, when we know that you We will not go back to Trash Troopers because that is not a responsible use of instructional time, nor is it ok to tell people it’s ok to leave their trash laying around and someone else will clean up after you. I can’t imagine any of you leave yourtrash on the floor in your homes, and as much time as you spend here, OCSA is your second home. I truly don’t believe that this problem is malicious in any way. I’m sure it’s just kids being forgetful and in a hurry to get toclass when the bell rings. However, knowing that still doesn’t solve the problem. I had truly hoped that your love andpassion for this place would fuel a pride in wanting to take care of it and wanting to be responsible for its care. The lastthing that the administrative team wants to do is punish students for this problem. We not only have more importantthings to do, but we also don’t want to have negative interactions with our students. Unfortunately, though, that is whatwill happen soon if students don’t permanently change their lunch time habits. So, I’m asking you again to step up as leaders and OCSA citizens. If you always throw away your trash, be a leader andremind those around you. If you haven’t been cleaning up after yourself, please start now. There are trash cans every fewfeet so there simply is no excuse for making our school look like a typical school, when there is nothing typical about OCSA.
Common Mistakes on 2.1 to 2.2 Quiz
• Before the quiz I specified that instructions that say ‘Describe’, ‘Explain’, and ‘Compare’ means you write sentences.
• Also SOCS is to help you remember how to describe the distribution. Do not write out SOCS to describe distribution.
• Many people forgot measures of spread are IQR, range and standard deviation.Also don’t forget to address whether data has any outliers when describing the distribution.
• In the future to save time use the calculator to come up with the 5 number summary.