Embed Size (px)
Citation preview
Wang, Keceli, and Maier-Speredelozzi 1
EFFECT OF DYNAMIC MESSAGE SIGN MESSAGES ON TRAFFIC SLOW DOWNS by J. H. Wang Department of Industrial and Systems Engineering University of Rhode Island, Kingston, RI 02881 Phone: (401) 874-5195, Fax: (401) 874-5540 E-mail: [email protected] M. Keceli Department of Industrial and Systems Engineering University of Rhode Island, Kingston, RI 02881 Phone: (508) 339-3000, E-mail: [email protected]
V. Maier-Speredelozzi Department of Industrial and Systems Engineering University of Rhode Island, Kingston, RI 02881 Phone: (401) 874-5187, Fax: (401) 874-5540 E-mail: [email protected] Prepared for the 88th Annual Meeting of the Transportation Research Board Washington D.C. January 2009 Submitted Word Count Abstract: 247 Body: 4,453 Tables: 3 × 250 = 750 Figures: 6 × 250 = 1,500 Total: 6,950
TRB 2009 Annual Meeting CD-ROM Paper revised from original submittal.
Wang, Keceli, and Maier-Speredelozzi 2
ABSTRACT In this study, the effects of dynamic message sign (DMS) messages on traffic approaching and passing the signs were investigated. Traffic data gathered by several Mobility Technology Units (MTUs) near DMSs along I-95 in Rhode Island were analyzed. It is intended, through this traffic data analysis, to understand the effects of various DMS messages on the speed variations on traffic approaching and passing the signs. With a positive correlation found between certain posted DMS messages and traffic slow-downs, the study next explored means to better the design and display on DMSs. A questionnaire survey was developed to find the general and specific causes of slow-downs. It was also used to assess drivers’ preferences and responses to various DMS design and display features such as message category, message type, number of frames, message details, and use of graphics. A total of 150 subjects participated in the survey. Survey results indicated that DMS was among the top few that caused drivers to slow down while danger warning messages attracted the most attention from drivers. It also showed that the majority of drivers reduced their speeds when approaching active DMSs while lengthy, complex, or abbreviated messages caused further slow downs. Regarding DMS design and display, surveyed drivers preferred text-only messages over graphic-aided ones, one-frame messages over two-frame ones, messages with more details over those with less. When cross-examined by the age distribution, it found that elder drivers exhibited a higher tendency to slow down as affected by active DMS messages. Keywords: slow-down effect, dynamic message sign, traffic data analysis, driver survey.
TRB 2009 Annual Meeting CD-ROM Paper revised from original submittal.

Wang, Keceli, and Maier-Speredelozzi 3
INTRODUCTION This paper presents a study that investigated the effect of various DMS messages on the speed variations on traffic approaching and passing the signs. The study was motivated by observations made on traffic monitors that “slow-downs” occurred when DMS messages were displayed. Thirteen dynamic message signs (overhead electronic bulletin boards) were installed on Rhode Island state and interstate highways since 2004. They have helped the traffic management authorities to communicate effectively with the drivers to disseminate real-time traffic information and travel advice. The DMS system is considered as the most critical component in RI’s Intelligent Transportation System. Though successful with its function, it has been observed that drivers often reduced their speed to read, comprehend and respond to these DMS messages. It has also been observed that drivers usually sped up after passing the DMSs to compensate for the slow-downs took place earlier. These variations in speed could stress driving conditions, increase congestion, and cause accidents.
A traffic data analysis was conducted to determine whether the “slow-downs” were caused by active DMSs and the extent that the traffic speed was affected by various DMS messages. The study next examined various design and display features on DMS messages such as message type (text-only, graphic-aided or graphic-integrated messages), message category (danger warning, regulatory, and informative messages), number of frames, the amount of information and use of graphics in multi-frame messages. A questionnaire survey was developed to gather drivers’ opinions about possible causes of slow-downs and to capture their preferences on various DMS design and display features. The objectives of this study are to understand the effect of active dynamic message signs on traffic, to identify causes of slow-downs, and to improve the DMS message design and display. The findings of this study could help highway transportation authorities better manage the traffic on highways via DMS messages, enhance drivers’ comprehension of and responses to DMS messages, and ease the slow-downs caused by DMS messages.
BACKGROUND Reviews of literature and past studies regarding the dynamic message sign its effect on traffic are provided below. Impact of DMSs on drivers Many studies were conducted to investigate the impact of DMSs on drivers to see whether the posted message were noticed and responded to by drivers while driving. In Benson’s study (1), a questionnaire survey was conducted to investigate the effect of DMSs on drivers. Among the 500 drivers participated in the survey, it found that about half of the participants often responded to DMSs while 38% occasionally or sometimes responded to them. In another similar study conducted in Wisconsin by Peng et.al. (2), 62% of the drivers indicated that they responded to DMS messages more than once per week and 66% of them changed their route at least once per month due to the posted message. Chatterjee (3) also employed surveys to investigate drivers’ response to DMSs in London. Most of the participants indicated that DMS information could be very useful to them. An empirical analysis based on an extensive survey conducted in Amsterdam by
TRB 2009 Annual Meeting CD-ROM Paper revised from original submittal.

Wang, Keceli, and Maier-Speredelozzi 4
Emmerink et. al. (4) revealed that over 70% of the drivers were sometimes influenced by VMS information. Speed change and its effects Many researches were conducted to assess the relationship between speed and crash occurrences. Moore et. al. (5) found that the risk of being involved in a severe crash is proportional to the speed of driving. Kloeden et. al. (6) also found that the risk of involvement in a casualty crash with traveling speeds above 60 km/h increased exponentially when compared to the risk of involvement with traveling at 60 km/h. In their study they conclude that “the risk of involvement in a casualty crash is twice as great at 65 km/h as it is at 60 km/h, and four times as great at 70 km/h”. Many researches (7, 8, 9, 10, 11) found that the risk of a car getting involved in an accident is related to the relative speed of that vehicle to other vehicles traveling in the traffic. In other words, the deviation of the speed of a vehicle from the speeds of other vehicles increases the risk of being involved in a crash. Vehicles traveling at speeds much faster or slower than the average traffic speed have high probability of involving in a crash. These findings pointed out that crashes are highly correlated to driving speed and speed variation could pose a threat to the other vehicles in the traffic. The speed changes observed on vehicles approaching active DMSs could have serious consequences if not being remedied. Slow-down effect The slow-down effect has been studied by a few researchers. Using a computer based driving simulator, Harder et. al. (12) conducted two experiments to see if different DMS messages cause slow-downs or not. The first experiment displayed a crash message and a recommended exit to use and the second experiment displayed an AMBER Alert message. One hundred and twenty subjects participated in the simulation and results showed that 21.7% of the participants slowed down by at least 2 mph (3.2 km/h) and up to as much as 13.9 mph (22.6 km/h) as they approached the AMBER Alert messages. When a “Crash” message is displayed, 13.3% slowed down by at least 2 mph (3.2 km/h) and up to as much as 12.7 mph (20.4 km/h) as they approach to the recommended exit in the message. It would be a concern if these many drivers were to slow down on highways in real life and its consequences on crash and traffic congestion.
In another study, Boyle and Mannering (13) used driving simulators to study the impact of DMSs on drivers’ driving speed. Drivers’ driving speeds were collected when they were approaching DMS messages. They found that while DMS messages cause drivers to reduce speeds significantly, drivers tend to compensate for this speed reduction by increasing speeds downstream once passing the DMS message. The study found that when drivers encounter a new DMS message, they were more likely to have a larger deviation in speed. New messages with new information required drivers more time to process the information and act accordingly. They also found that once a driver got familiar with a message, she/he no longer take much time to read the message.
In their research about incident warning systems, Alm and Nilsson (14) found that incident warning messages posted on VMSs could cause drivers to decrease their speeds before the VMS is posted and an increase in their speeds afterwards. They also found that the long text messages displayed on the VMSs resulted in high levels of visual workload. To compensate for this increased workload, participants tend to reduce their speed so that
TRB 2009 Annual Meeting CD-ROM Paper revised from original submittal.

Wang, Keceli, and Maier-Speredelozzi 5
they have more time to respond and react to the displayed message. A recent study conducted by MacCarley (15) analyzed drivers’ responses to “fog warning” or “traffic hazards ahead” messages displayed on a DMS in terms of traffic speed. The study found that when mean speeds were compared for the same visibility level, sites after the DMS had higher means than sites before the DMS. This indicated that drivers increase their speed once they pass the DMS.
Use of graphics Use of graphics or symbols on DMS signs has many advantages over text-only DMS signs. A graphic-aided message could be identified easier, quicker, and from a further distance and thus might help ease the slow-downs caused by DMSs. In many European countries such as Great Britain, the Netherlands, Italy, Spain and France, graphical traffic information has been used on DMSs to influence drivers’ route choices as mentioned by Tsavachidis et. al. (16). It is also recommended by the Conference of European Directors of Roads (CEDR) report and Lucas et. al.’s study that graphics and symbols should be used as much as possible to avoid the problem of disseminating information to drivers who speak and use different languages (17, 18).
Many studies found that graphically presented information allowed faster responses than words (19, 20, 21). Wang et. al. (22) conducted a pioneer study on the use of graphics on DMSs and found that most test drivers preferred graphics over text and responded faster to graphic-aided messages than text-alone messages. Their study indicated that adding graphics to DMS messages might help enhance drivers’ understanding of and responses to those messages and ease the slow-downs. DESCRIPTION OF THE STUDY Two approaches were employed in the study, a traffic data analysis, and a questionnaire survey. A description of each is given below. Traffic data analysis To investigate the effect of DMS messages on speed variations, traffic data gathered by four Mobility Technology units (MTUs) along I-95 in Rhode Island were analyzed. It intended to find out, through these data, whether particular messages displayed on these DMSs cause slow-downs or not. These MTUs are part of a network of radar vehicle detectors which are capable of collecting average speed and vehicle count information on all lanes of a highway. The data collected by the four MTUs, located in close proximities of four DMS sites (see Figure 1), between June 1 and June 14, 2007 were analyzed. Each MTU recorded the average speed in 5 minute intervals. The average speed was calculated by averaging the speed of all the vehicles that passed the MTU. A log of the DMS messages displays and their durations for the same time period (June 1st - June 14th) were provided by Rhode Island Traffic Management Authorities so that the speed data could be synchronized with messages displayed. The DMS log contained the following information: 1) the message content, 2) the time when the message was sent to the DMS, and 3) the time when the message was removed. Table 1 shows the full message content of each message as it was displayed in real time during the two weeks.
TRB 2009 Annual Meeting CD-ROM Paper revised from original submittal.

Wang, Keceli, and Maier-Speredelozzi 6
To facilitate the analysis regarding the effect of different messages, the messages were grouped into three categories (as shown in Table 1), they are: danger warning messages, informative messages, and regulatory messages per Ridgeway’s classification (23). After synchronizing the speed data with the message display log, an Excel file was created for each MTU location. Each of these Excel files contained data for four time periods: “pre-display”, “first 5 min”, “last 5 min”, and “post-display”. FIGURE illustrates the four time periods via an example where a DMS message was posted on 10:47 AM and removed on 11:45 AM.
FIGURE 1 Lo
3 B
TRB 2009 Annual Meeting CD-ROM
DMS 2-4 S
cations of MTUs and DMSs
4
2
7
B B
B
Pap
DMS 2-3 N
DMS 2-13 N
DMS 2-6 S MTU # 812MTU # 813
MTU #811
MTU #810
er revised from original submittal.

Wang, Keceli, and Maier-Speredelozzi 7
TABLE 1 Contents of Individual DMS Messages
Message category
Actual message displayed
DISABLED VEHICLE 195 E EX 4
LEFT LANE CLOSED
DISABLED VEHICLE EX 18 RAMP BLOCKED
USE CAUTION
CRASH 195 E EX 2 CENTER LN CLOSED
ACCIDENT AHEAD
KEEP RIGHT
Dan
ger
War
ning
REDUCE SPEED AHEAD
RIGHT LANES CLOSED
REDUCE SPEED SLOW TRAFFIC
AHEAD ROADWORK 95 N EX 23
LEFT LANE CLOSED
ROADWORK 1 /2 MILE
LEFT LNES CLOSED
Info
rmat
ive
DELAYS AHEAD THRU EX 20
DELAYS EX 22 THRU 20
WORK ZONE KEEP RIGHT
WORK ZONE KEEP LEFT
Reg
ulat
ory
S-CURVES AHEAD REDUCE SPEED
S-CURVES 1/ 2 MI REDUCE SPEEDS
FIGURE 2 The Four Time Periods Considered in Traffic Data Analysis
Traffic data were compared between the “pre-display” period and the “first 5 min”
period for the same message. The analysis performed here was named “before and during analysis”. It was hypothesized that drivers might slow down due to the active DMS message. If a significant slow down occurred, the speed averages in “pre-display” period would be higher than that of the “first 5 min” period. Traffic data were also compared between the “last 5 min” period and the “post-display” period. The analysis here was named “during and after analysis”. Again, if the slow down did occur while the message was displayed; the average speed in the “last 5 min” period would be lower than that of the “post-display” period. These hypotheses were tested using paired t-tests with a 0.1 significance level within individual message category.
TRB 2009 Annual Meeting CD-ROM Paper revised from original submittal.

Wang, Keceli, and Maier-Speredelozzi 8
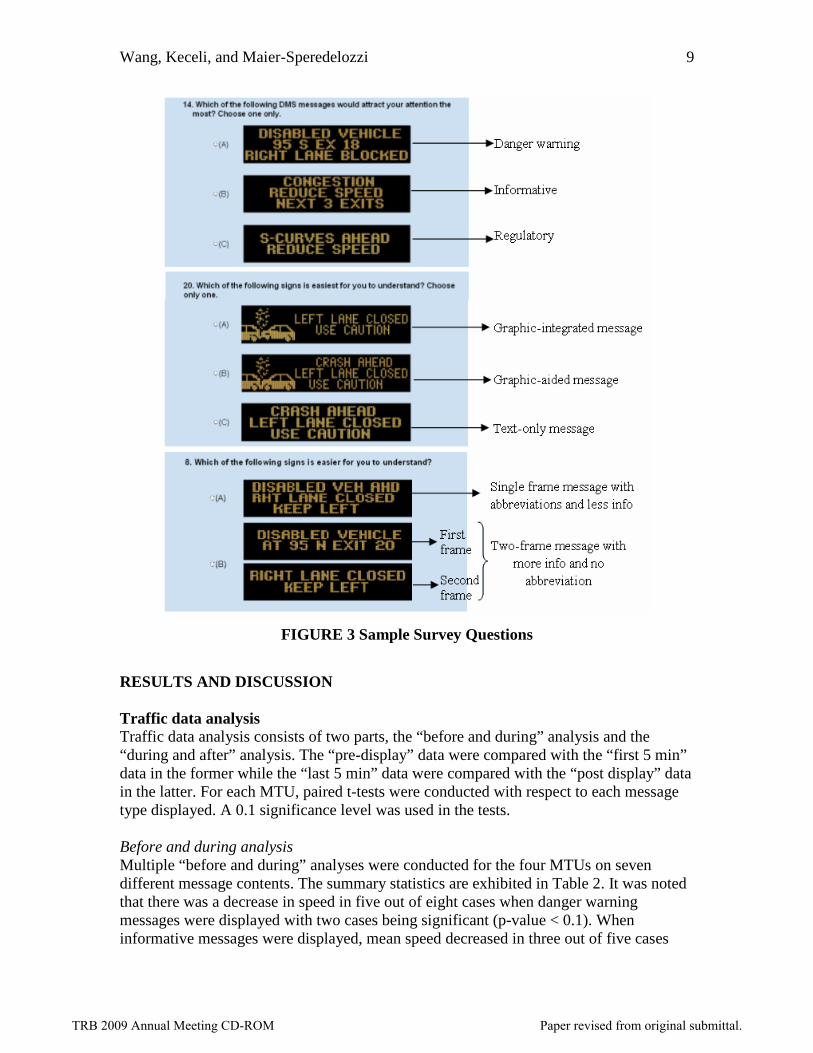
Questionnaire survey A questionnaire survey was developed to gain insights about the causes of slow-downs on highway driving and also to identify drivers’ preferences on various message design and display features. Design a computer-based questionnaire survey The electronic survey was developed using Microsoft PowerPoint with Visual Basic macros. The survey contained 24 questions. The first six questions were designed to find out the causes of slow-downs in general and those associated with DMS designs. In some of these questions, participants had the option to choose multiple answers. Other questions investigated drivers’ opinions and preferences regarding various DMS message display features. Each question was designed to assess a single design or display feature with multiple DMS displays as possible choices. Some questions assessed subjects’ attentions attracted by messages in different message categories (danger warning, informative, and regulatory messages.) Some others surveyed subjects’ preferences among three matching messages displayed in different types, text-only, graphic-aided (graphic placed on the left of the complete text message), and graphic-integrated (graphic replaced the first line of words in the original message). Other questions surveyed subjects’ opinions regarding the number of frames used to display the same message (single frame vs. two-frame) on the ease of understanding, and their preferences between messages with more details displayed in two frames and those with less details in one frame. Figure 3 gives a few sample questions.
Survey administration The survey was conducted at multiple locations in Rhode Island in order to obtain a representative sample of the Rhode Island driving population. The University of Rhode Island, Pawtucket Department of Motor Vehicles, and Warwick Mall were among several survey sites where the survey took place. A total of 150 subjects participated in the survey. Among them, 75 were between 18 and 40 years old, 39 between 41 and 60, and 36 were older than 60, and there were 71 females and 79 males. Age and gender percentages of the survey and Rhode Island population are almost the same. The survey was done by voluntary contribution. Each participant was asked to read and sign a consent form, approved by the university’s Institutional Review Board, prior to the survey. The subject would then start taking the survey presented as PowerPoint slides on a laptop computer. Survey questions were presented one at a time with no constraint on the answering (response) time. Answer(s) could be made by using a clickable mouse or by telling the survey assistant. Upon the completion of all survey questions, the subject was asked to fill out some demographic information such as age group, gender and native language background. Answers made and demographic information provided by subjects were stored in a password protected computer for later analysis. Individual’s demographic information was only used in data sorting and analysis and was kept confidential at all time.
TRB 2009 Annual Meeting CD-ROM Paper revised from original submittal.
Wang, Keceli, and Maier-Speredelozzi 9
FIGURE 3 Sample Survey Questions
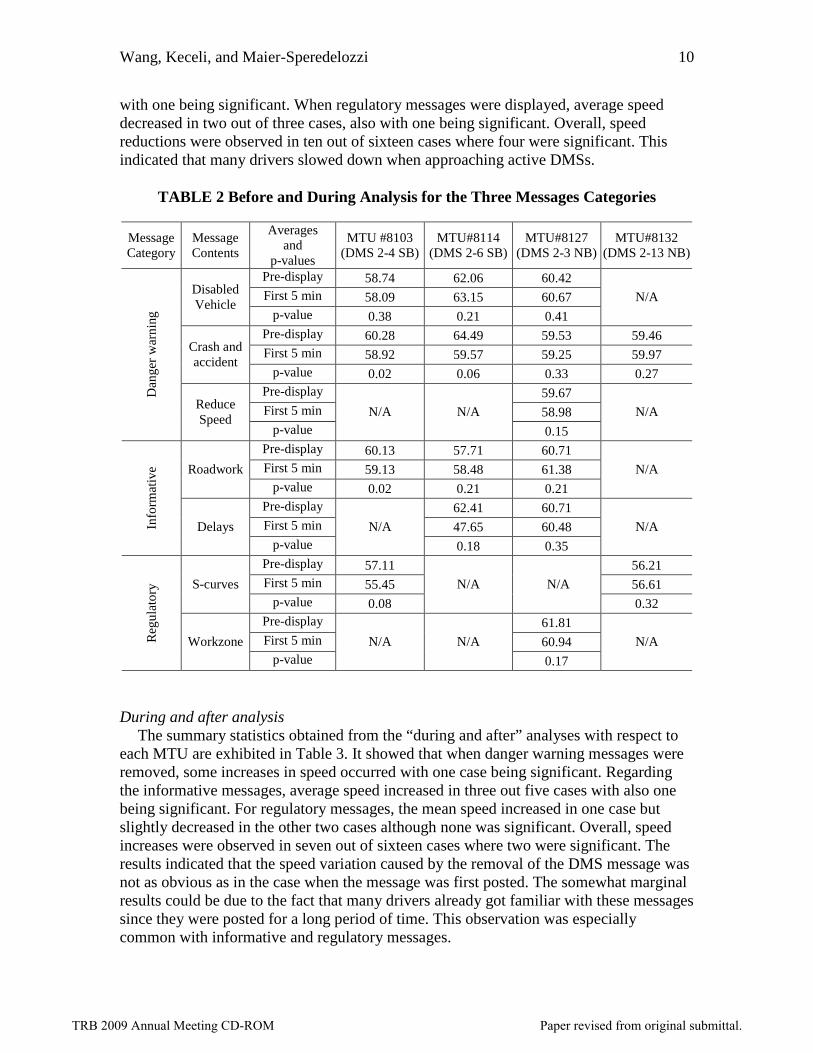
RESULTS AND DISCUSSION Traffic data analysis Traffic data analysis consists of two parts, the “before and during” analysis and the “during and after” analysis. The “pre-display” data were compared with the “first 5 min” data in the former while the “last 5 min” data were compared with the “post display” data in the latter. For each MTU, paired t-tests were conducted with respect to each message type displayed. A 0.1 significance level was used in the tests. Before and during analysis Multiple “before and during” analyses were conducted for the four MTUs on seven different message contents. The summary statistics are exhibited in Table 2. It was noted that there was a decrease in speed in five out of eight cases when danger warning messages were displayed with two cases being significant (p-value < 0.1). When informative messages were displayed, mean speed decreased in three out of five cases
TRB 2009 Annual Meeting CD-ROM Paper revised from original submittal.
Wang, Keceli, and Maier-Speredelozzi 10
with one being significant. When regulatory messages were displayed, average speed decreased in two out of three cases, also with one being significant. Overall, speed reductions were observed in ten out of sixteen cases where four were significant. This indicated that many drivers slowed down when approaching active DMSs.
TABLE 2 Before and During Analysis for the Three Messages Categories
Message Category
Message Contents
Averages and
p-values
MTU #8103 (DMS 2-4 SB)
MTU#8114 (DMS 2-6 SB)
MTU#8127 (DMS 2-3 NB)
MTU#8132 (DMS 2-13 NB)
Pre-display 58.74 62.06 60.42 First 5 min 58.09 63.15 60.67
Disabled Vehicle
p-value 0.38 0.21 0.41
N/A
Pre-display 60.28 64.49 59.53 59.46 First 5 min 58.92 59.57 59.25 59.97
Crash and accident
p-value 0.02 0.06 0.33 0.27 Pre-display 59.67 First 5 min 58.98
Dan
ger
war
nin
g
Reduce Speed
p-value N/A N/A
0.15
N/A
Pre-display 60.13 57.71 60.71 First 5 min 59.13 58.48 61.38 Roadwork
p-value 0.02 0.21 0.21
N/A
Pre-display 62.41 60.71 First 5 min 47.65 60.48 In
form
ativ
e
Delays p-value
N/A
0.18 0.35
N/A
Pre-display 57.11 56.21 First 5 min 55.45 56.61 S-curves
p-value 0.08
N/A N/A
0.32 Pre-display 61.81 First 5 min 60.94 R
egu
lato
ry
Workzone p-value
N/A N/A
0.17
N/A
During and after analysis
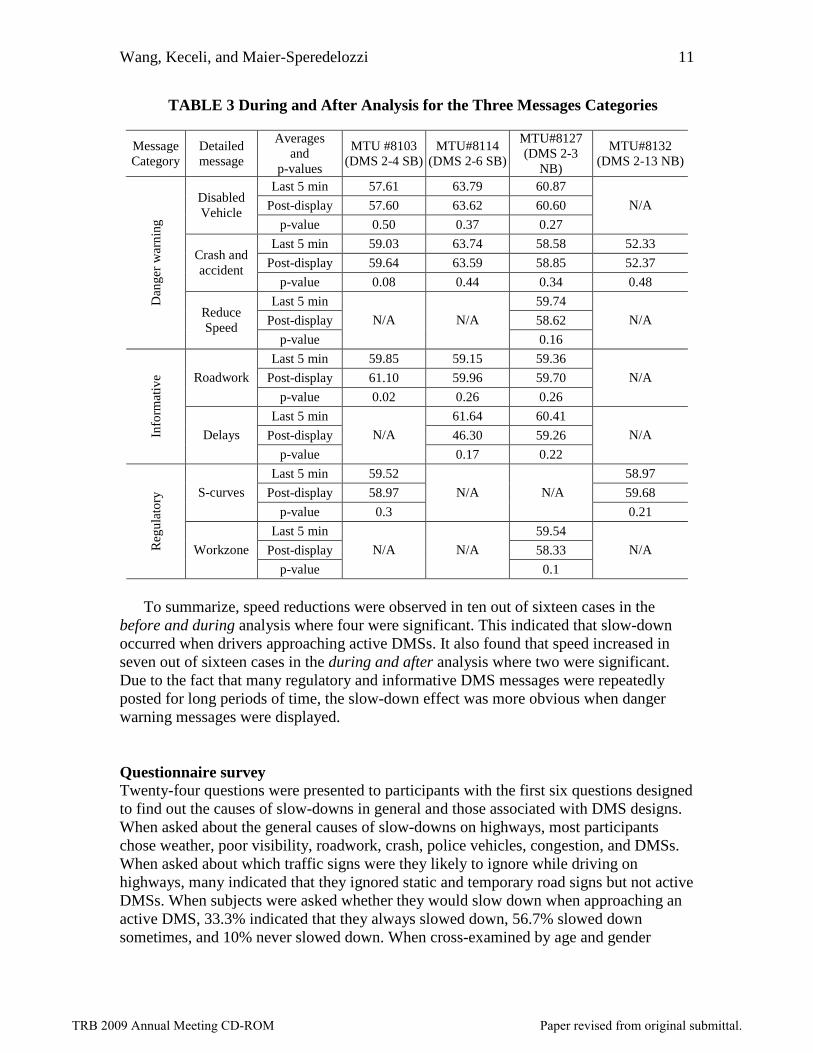
The summary statistics obtained from the “during and after” analyses with respect to each MTU are exhibited in Table 3. It showed that when danger warning messages were removed, some increases in speed occurred with one case being significant. Regarding the informative messages, average speed increased in three out five cases with also one being significant. For regulatory messages, the mean speed increased in one case but slightly decreased in the other two cases although none was significant. Overall, speed increases were observed in seven out of sixteen cases where two were significant. The results indicated that the speed variation caused by the removal of the DMS message was not as obvious as in the case when the message was first posted. The somewhat marginal results could be due to the fact that many drivers already got familiar with these messages since they were posted for a long period of time. This observation was especially common with informative and regulatory messages.
TRB 2009 Annual Meeting CD-ROM Paper revised from original submittal.
Wang, Keceli, and Maier-Speredelozzi 11
TABLE 3 During and After Analysis for the Three Messages Categories
Message Category
Detailed message
Averages and
p-values
MTU #8103 (DMS 2-4 SB)
MTU#8114 (DMS 2-6 SB)
MTU#8127 (DMS 2-3
NB)
MTU#8132 (DMS 2-13 NB)
Last 5 min 57.61 63.79 60.87
Post-display 57.60 63.62 60.60 Disabled Vehicle
p-value 0.50 0.37 0.27
N/A
Last 5 min 59.03 63.74 58.58 52.33
Post-display 59.64 63.59 58.85 52.37 Crash and accident
p-value 0.08 0.44 0.34 0.48
Last 5 min 59.74
Post-display 58.62
Dan
ger
war
nin
g
Reduce Speed
p-value
N/A N/A
0.16
N/A
Last 5 min 59.85 59.15 59.36
Post-display 61.10 59.96 59.70 Roadwork
p-value 0.02 0.26 0.26
N/A
Last 5 min 61.64 60.41
Post-display 46.30 59.26 Info
rmat
ive
Delays
p-value
N/A
0.17 0.22
N/A
Last 5 min 59.52 58.97
Post-display 58.97 59.68 S-curves
p-value 0.3
N/A N/A
0.21
Last 5 min 59.54
Post-display 58.33 Reg
ula
tory
Workzone
p-value
N/A N/A
0.1
N/A
To summarize, speed reductions were observed in ten out of sixteen cases in the
before and during analysis where four were significant. This indicated that slow-down occurred when drivers approaching active DMSs. It also found that speed increased in seven out of sixteen cases in the during and after analysis where two were significant. Due to the fact that many regulatory and informative DMS messages were repeatedly posted for long periods of time, the slow-down effect was more obvious when danger warning messages were displayed.
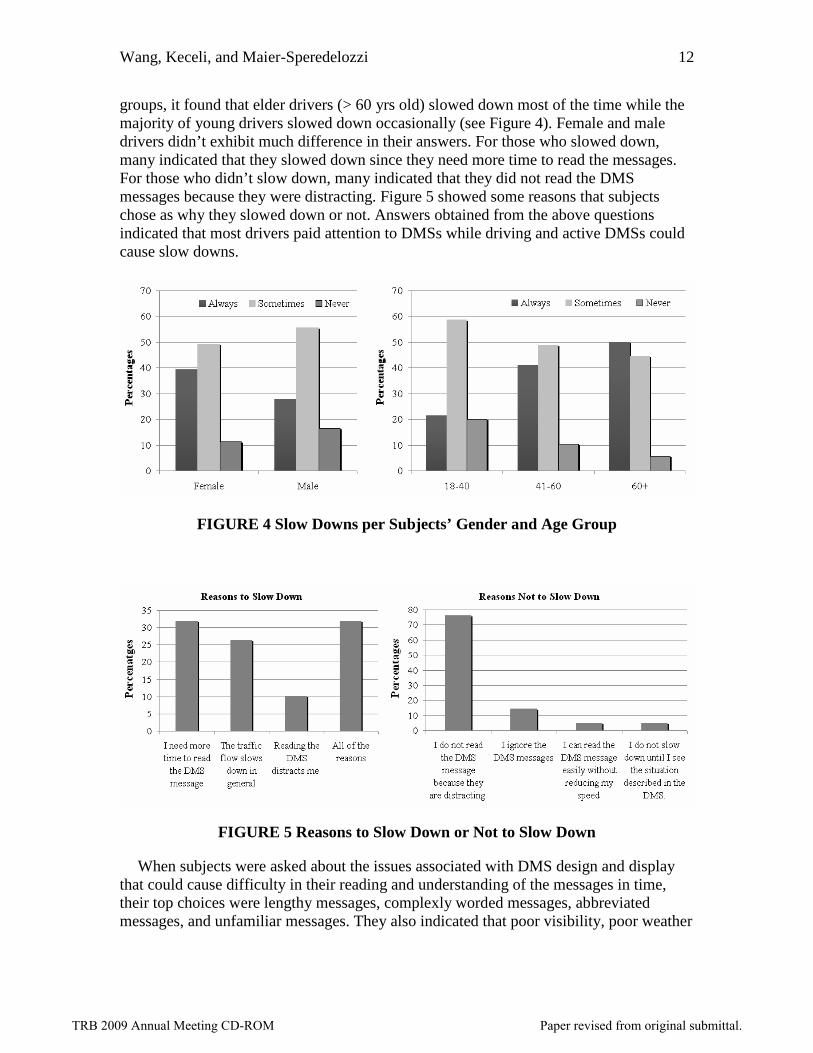
Questionnaire survey Twenty-four questions were presented to participants with the first six questions designed to find out the causes of slow-downs in general and those associated with DMS designs. When asked about the general causes of slow-downs on highways, most participants chose weather, poor visibility, roadwork, crash, police vehicles, congestion, and DMSs. When asked about which traffic signs were they likely to ignore while driving on highways, many indicated that they ignored static and temporary road signs but not active DMSs. When subjects were asked whether they would slow down when approaching an active DMS, 33.3% indicated that they always slowed down, 56.7% slowed down sometimes, and 10% never slowed down. When cross-examined by age and gender
TRB 2009 Annual Meeting CD-ROM Paper revised from original submittal.
Wang, Keceli, and Maier-Speredelozzi 12
groups, it found that elder drivers (> 60 yrs old) slowed down most of the time while the majority of young drivers slowed down occasionally (see Figure 4). Female and male drivers didn’t exhibit much difference in their answers. For those who slowed down, many indicated that they slowed down since they need more time to read the messages. For those who didn’t slow down, many indicated that they did not read the DMS messages because they were distracting. Figure 5 showed some reasons that subjects chose as why they slowed down or not. Answers obtained from the above questions indicated that most drivers paid attention to DMSs while driving and active DMSs could cause slow downs.
FIGURE 4 Slow Downs per Subjects’ Gender and Age Group
FIGURE 5 Reasons to Slow Down or Not to Slow Down
When subjects were asked about the issues associated with DMS design and display that could cause difficulty in their reading and understanding of the messages in time, their top choices were lengthy messages, complexly worded messages, abbreviated messages, and unfamiliar messages. They also indicated that poor visibility, poor weather
TRB 2009 Annual Meeting CD-ROM Paper revised from original submittal.

Wang, Keceli, and Maier-Speredelozzi 13
conditions, distractions on the road, and driving at high speed could make it difficult to read and understand the DMS messages. The majority of subjects (46%) indicated that danger warning messages got most of their attention, followed by informative (30%) and regulatory messages (24%). This supports the findings found from the traffic data analysis where the slow-down effect was more obvious when danger warning messages were displayed. When subjects were asked about their preferences on message types, text-only messages were preferred (44%) over graphic-aided messages (34%) and graphic-integrated messages (22%) by the majority except young subjects (18-40) who preferred graphic-aided messages over others (See Figure 6). This finding is at odds with the common understanding that graphics are usually better than texts since they could be identified easier, quicker, and from a further distance.
0
5
10
15
20
25
Text-only message Graphic-aided message Graphic-integratedmessage
Per
cent
ag
e
18-4041-6061 & above
FIGURE 6 Subjects’ Preferences Regarding Message Types
Regarding the number of frames used in a message, the survey showed that subjects preferred a one-frame message (58%) over a two-frame message (42%) if the same contents were displayed. If a two-frame message gives more information and uses no abbreviations whereas a single-frame message gives less information and uses abbreviations, most subjects would then preferred a two-frame message (59%) over a single-frame (41%). When a two-frame message was displayed, the subjects’ preferences regarding whether to include graphics in the message or not were split at 50-50.
In conclusion, the majority of drivers would reduce their speeds when approaching active DMSs, especially elder drivers. Danger warning messages got most of drivers’ attention, followed by informative and regulatory messages and this agreed with the findings found from the traffic data analysis. Lengthy, complexly worded, and abbreviated messages could cause drivers to slow down. It is also found that drivers preferred text-only messages over graphic-aided and graphic-integrated messages; one-frame messages over two-frame ones if they contain exactly the same content; two-frame
TRB 2009 Annual Meeting CD-ROM Paper revised from original submittal.

Wang, Keceli, and Maier-Speredelozzi 14
messages with more information were preferred over single-frame ones with less information and abbreviations. CONCLUSION AND FUTURE WORKS In this study, the effect of dynamic message sign messages on traffic slow downs were assessed through a traffic data analysis and a questionnaire survey. Traffic data collected by MTUs near four DMS sites were synchronized with DMS log to investigate the effect of different DMS messages on speed variations. Paired comparisons were made on speed data collected in five-minute periods before the message was posted and after the message was posted. Same comparisons were also made to compare data collected in the last five minutes of the message and the first five minutes after the message was removed. Results showed that slow down occurred in more than half the cases especially when danger warning messages were posted. Since the positive correlation found between active DMS and slow downs, a questionnaire was developed to collect drivers’ opinions regarding the causes of slow downs in general and those related to DMSs. The survey also collected drivers’ preferences on various DMS features with the intention to better the design and display of DMS messages to ease the slow down effect. Results of the survey showed that the majority of drivers would reduce their speeds when approaching active DMSs, especially elder drivers. Lengthy, complexly worded, and abbreviated messages could cause drivers to slow down. The survey also found that drivers preferred text-only messages over graphic-aided and graphic-integrated messages. Single frame messages were preferred over two-frame ones if they contain exactly the same content; otherwise, two-frame messages with more information were preferred over single-frame ones with less information and abbreviations.
To further assess the relationship between DMS messages and slow downs, traffic monitoring videos shot during the same period when the traffic data were collected will be examined. Also, another traffic data analysis for a longer period in a different season could be performed to help validate the findings found in this study. Employing different technologies will help in understanding more about specific in-vehicle driver behaviors, e.g. eye-tracking technology. To help assess drivers’ responses to DMS messages with different designs and displays, it plans to set up a driving simulation study to find out whether a preferred feature could lead to shorter response time. A factorial design would be employed to help investigate the effects of various features on subjects’ response times.
Overall, this study found that active DMS could cause slow downs. Some features in the DMS design and display could impact drivers’ reading and understanding of the message and thus cause slow downs. Results of this study could help traffic management authorities better manage the traffic on highways by improving current DMS message design and display practices to ease the slow-downs. ACKNOWLEDGEMENTS
The authors wish to thank the Rhode Island Department of Transportation (RIDOT) for their financial support and guidance in this study.
TRB 2009 Annual Meeting CD-ROM Paper revised from original submittal.

Wang, Keceli, and Maier-Speredelozzi 15
REFERENCE
1. Benson B.G. Motorist Attitudes about Content of Variable-Message Signs. In
Transportation Research Record: Journal of the Transportation Research Board, No. 1550, TRB, National Research Council, Washington, D.C., 1996, 48-57.
2. Peng Z. R., N. Guequierre, and J.C. Blakerman. Motorist Response to Arterial Variable Message Signs. In Transportation Research Record: Journal of the Transportation Research Board, No.1899, TRB, National Research Council, Washington, D.C., 2004, 55-63.
3. Chatterjee, K., N.B. Hounsell, P.E. Firmin, and P.W. Bonsall. Driver Response to Variable Message Sign Information in London. Transportation Research – C, Vol. 10, No. 2, 2002, 149-169.
4. Emmerink, R., P. Nijkamp, P. Rietveld, and J.N.Van Ommeren. Variable Message Signs and Radio Traffic Information: An Integrated Empirical Analysis of Drivers’ Route Choice Behaviour. Transportation Research – A, Vol. 30, No. 2, 1996, 135-153.
5. Moore, M.M., J.Dolinis, and A.J. Woodward. Vehicle speed and risk of a severe crash. Epidemiology, Vol.6, No.3, 1995, pp. 258-62.
6. Kloeden, C.N., A.J. McLean, V.M. Moore, and G. Ponte. Travelling speed and the risk of crash involvement. NHRMC Road Accident Research Unit, 1997, University of Adelaide.
7. Transportation Research Board. Managing Speed: Review of Current Practices for Setting and Enforcing Speed Limits -- Special Report 254, Effects of Speed, 1998, p.41.
8. Solomon, D. Accidents on Main Rural Highways Related to Speed, Driver and Vehicle. Federal Highway Administration, U.S Department of Transportation, 1964.
9. Hauer, E. Accidents, Overtaking and speed control, Accident analysis and prevention, 1971, pp. 1-12.
10. Lave, C.A. Speeding, Coordination, and the 55 mph limit. The American Economic Review, 1985, pp. 1159-64.
11. Rodriguez, R.J. Speed, Speed Dispersion, and the highway fatality rate. Southern Economic Journal, Vol.57, 1990, No.2, pp.349-356.
12. Harder, K.A., J. Bloomfield, and B.J. Chihak. The Effectiveness and Safety of Traffic and Non-traffic Related Messages Presented on Changeable Message Signs (CMS). Publication MN/RC-2004-27. Minnesota: Minnesota Department of Transportation, 2003.
13. Boyle, L.N., and F. Mannering. Impact of Traveler Advisory Systems on Driving Speed: Some New Evidence, Transportation Research – C , Vol.12, 2003, pp. 57-72.
14. Alm, H. and L. Nilsson. Incident Warning systems and traffic safety: a comparison between the PORTICO and MELYSSA test site systems. Transportation Human Factors, Vol.2, No.1, 2000, pp. 77-93.
15. MacCarley, A. Automated Driver Information Systems and Traffic Detectors: the state of the art and evaluation results. Presented at 87th Annual Meeting of the Transportation Research Board, Washington, D.C., January 2008.
TRB 2009 Annual Meeting CD-ROM Paper revised from original submittal.

Wang, Keceli, and Maier-Speredelozzi 16
16. Tsavachidis M., and H. Keller. Graphical Traffic Information on Dynamic Information Boards. Proceeding of European Transport Conference, Cambridge, England, 2000, pp. 201-215.
17. Conference of European Directors of Roads. Action FIVE-Framework for harmonized implementation of Variable message signs in Europe. Draft amended version 3.5. 2003. http://www.esafetysupport.org/download/documents/Harmonisation_VMS_Systems.pdf , Accessed on March, 17th 2008.
18. Lucas, A., A. Arbaiza, and M.T. Blanch. New Steps towards an International Symbolic Language: Some Results from Spain. Proceedings of the 8th International IEEE Conference on Intelligent Transportation Systems, 2005.
19. Staplin, L., K. Lococo, and J. Sim. Traffic Control Design Elements for Accommodating Drivers with Diminished Capacity, Volume II. Report No. FHWA-RD-90-055. Washington, D.C.: Federal Highway Administration, 1990.
20. Hanowski, R.J. and B. H. Kantowitz. Driver Memory Retention of In-Vehicle Information System Messages. Transportation Research Record 1573, 1997, pp. 8-18.
21. Bruce D., D.A. Boehm-Davis. and K. Mahach. In-Vehicle Auditory Display of Symbolic Information. Proceedings of the XIVth Triennial Congress of the International Ergonomics Association and the 44th Annual Meeting of the Human Factors and Ergonomics Society: Ergonomics for the New Millennium, 2000, San Diego, CA, pp. 230-233.
22. Wang, J.H., S. Hesar, and C. Collyer. Adding Graphics to Dynamic Message Sign Messages. Transportation Research Record, Vol. 2018, 2007, p. 63-71.
23. Ridgeway, R. Framework for harmonized Implementation of Variable Message Signs in Europe. Rijkswaterstaat. The Netherlands, 2003.
TRB 2009 Annual Meeting CD-ROM Paper revised from original submittal.