Embed Size (px)
Citation preview
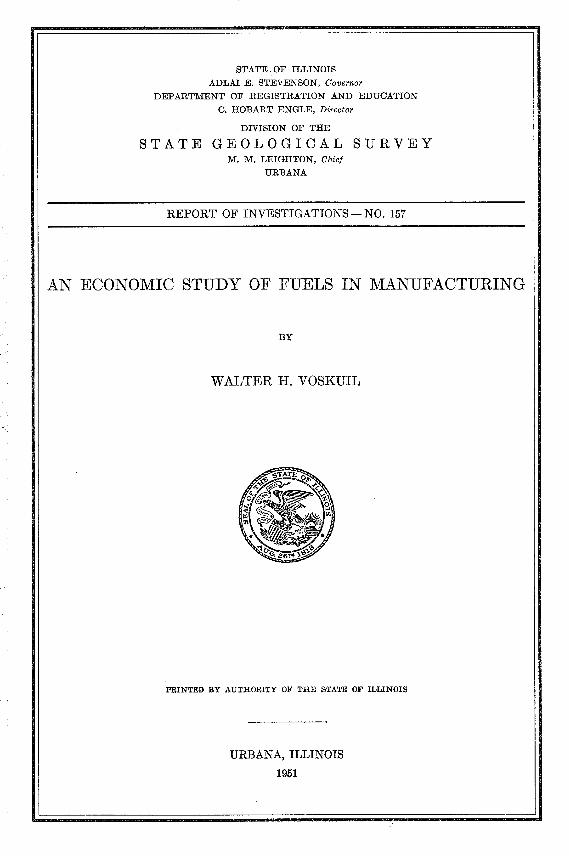
STATE OF ILLINOIS
ADLAI E. STEVENSON, Governor DEPARTMENT OF REGISTRATION AND EDUCATION
C. HOBART ENGLE, Director
DIVISION OF THE
S T A T E G E O L O G I C A L S U R V E Y M. M. LEIGHTON, Chief
URBANA
REPORT OF INVESTIGATIONS - NO. 157
WALTER H. VOSKUIL
PRINTED BY AUTHORITY OF THE STATE OF ILLINOIS
URBANA, ILLINOIS
1951
This report is also a publication of the University of Illinois Engineering Experiment Station
as its Circular Series No. 63
STATE OF ILLINOIS
ADLAI E. STEVENSON, Governor
DEPARTMENT O F REGISTRATION AND EDUCATION
C. HOBART ENGLE, Director
DIVISION OF THE
S T A T E G E O L O G I C A L S U R V E Y M. M. LEIGHTON, Chief
URBANA
REPORT OF INVESTIGATIONS - NO. 157
AN ECONOMIC STUDY OF FUELS IN MANUFACTURING
BY
WALTER H. VOSKUIL Mineral Economist, State Geological Survey,
and
Professor of Mineral Economics, Depa rhen t of Mining and Metallurgical Engineering,
University of Illinois
PRINTED BY AUTHORITY OF THE STATE OF ILLINOIS
URBANA, ILLINOIS
1951
ORGANIZATION
STATE OF ILLINOIS RON. ADLAI E. STEVENSON, Governor
DEPARTMENT O F REGISTRATION AND EDUCATION HON. C. HOBART ENGLE,
BOARD OF NATURAL RESOURCES
Director
AND CONSERVATION
HON. C. HOBART ENGLE, B.EDN., M.A., Chairman
W. H. NEWHOUSE, PH.D., Geology
ROGER ADAMS, PH.D., D.Sc., Chemistry
LOUIS R. HOWSON, C.E., Engineering
A. E. EMERSON, PH.D., Biology
LEWIS H. TIFFANY, PH.D., PD.D., Forestry
GEORGE D. STODDARD, PH.D., LITT.D., LL.D., L.H.D. President o f the University o f Illinois
DELYTE W. MORRIS, PH.D. President o f Southern Illinois University
GEOLOGICAL SURVEY DIVISION M. M. LEIGHTON, Pw.D., Chief
CONTENTS
1. Purpose and Significance of the Study
2. Fuels Used in Manufacturing Kinds and Quantity Conversion to a Common Equivalent Meaning of Unit Cost
3. Consumption by Manufacturing Groups
4. Fuels and the Production Worker
5 . Fuel Costs
IV. FUELS AND POWER IN THE IRON AND STEEL INDUSTRIES
6. Fuels for Iron Reduction
7. Fuels and Power in the Iron and Steel Industries Compared to Total Fuel Requirements in Manufacturing
8. Fuels Used in Iron and Steel Making
9. The Fuel Structure of the Iron and Steel Industries
10. Cost of Fuels
11. Blast Furnace Fuel Costs Location of Coking Coal Deposits Mine Price of Coking Coal Transportation Costs Cost of Coal and Coke at the Ovens Cost of Coke per Ton of Pig Iron Produced
12. Fuels in Steel Works and Rolling Mills
13. Fuel Costs in the Steel Industry
TABLES
1. Fuels Consumed and Electric Energy Purchased and Generated by Manufacturing Industries, 1947 and 1939
2. Conversion Factors for Fuels 3. Conversion Factors for Fucl Units Used in the United States 4. Fuel and Power Consumption, by Manufacturing Industry Groups, 1947 5. Fuel and Power Used per Production Worker, 1947 6. Cost of Fuel, Wages and Salaries Paid, and Value Added by Manufacture 7. Electric Power Used in Manufacturing, 1939 and 1947 8. Fuels and Electric Power Used in Industry, 1947 9. Electric Power Used per Worker, 1939 and 1947
10. Electric Power Used by the Primary Rllctal Industries, 1947 11. Electric Power Used in the Production of Aluminum and Electric Steel 12. Summary of Fuels Used in Iron and Steel Manufacture 13. Fuel Requirements in Coke Ovens, Blast Furnaces, and Steel Works and
Rolling Mills 14. Place of the Iron and Steel Industries with Respect to Cost of Fucl and
Rclated Factors 15. A11 Industries: Ratio of Fucl Costs to Wages and Salaries 16. Steel Industries: Ratio of Fuel Costs to Wages and Salaries 17. Pig-Iron Cost Data 18. Cost of Coke, by Leading Coke-Using Counties, 1947 19. Costs of Coal a t the Oven, and Value of Furnace Coke 20. Cost of Coke per Ton of Pig Iron Produced 21. Fuel Used in Steel Works and Rolling Mills, 1947 22. Comparative Fuel Costs in the Iron and Steel Industry, for Leading States 23. Fuels and Power Used, by Geographic Divisions, 1947 24. Fuel Consumption, by Geographic Divisions-Converted into Millions
of Iiilowatt-hour Equivalent 25. Fuels and Power Consumption in Selected Metropolitan Areas-Converted
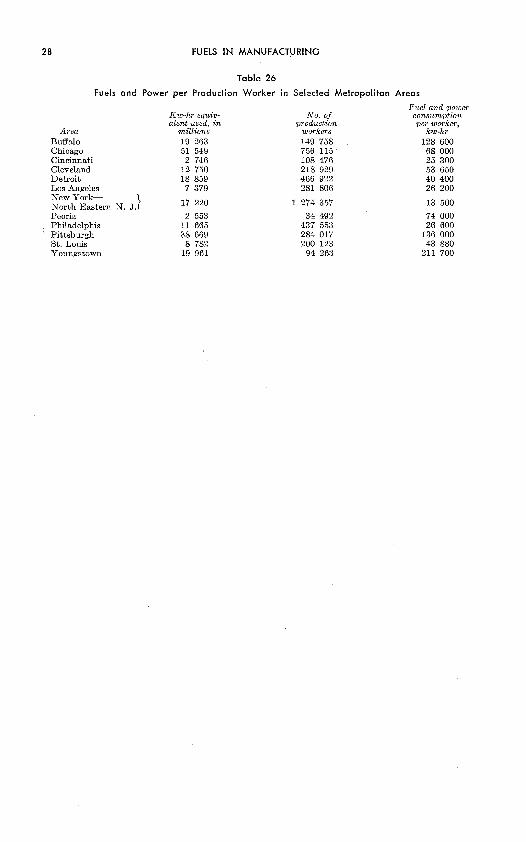
into Millions of Kilowatt-hour Equivalent 26. Fuels and Power per Production Worker in Selected Metropolitan Areas
I . INTRODUCTION
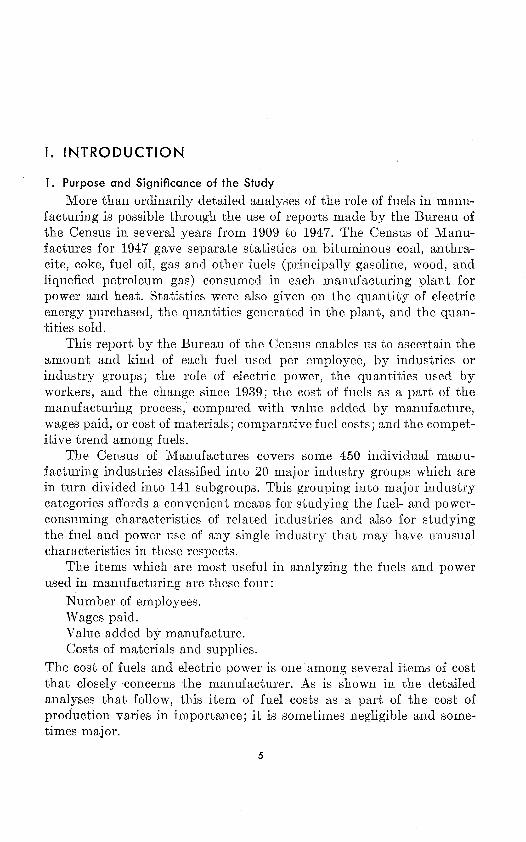
1. Purpose and Significance of the Sfudy
More than ordinarily detailed analyses of the role of fuels in manu- facturing is possible through the use of reports made by the Bureau of the Census in several years from 1909 to 1947. The Census of Manu- factures for 1947 gave separate statistics on bituminous coal, anthra- cite, coke, fuel oil, gas and other fuels (principally gasoline, wood, and liquefied petroleum gas) consumed in each manufacturing plant for power and heat. Statistics were also given on the quantity of electric energy purchased, the quantities generated in the plant, and the quan- tities sold.
This report by the Bureau of the Census enables us to ascertain the amount and kind of each fuel used per employee, by industries or industry groups; the role of electric power, the quantities used by workers, and the change since 1939; the cost of fuels as a part of the manufacturing process, compared with value added by manufacture, wages paid, or cost of materials; comparative fuel costs; and the compet- itive trend among fuels.
The Census of Manufactures covers some 450 individual manu- facturing industries classified into 20 major industry groups which are in turn divided into 141 subgroups. This grouping into major industry categories affords a convenient means for studying the fuel- and power- consuming characteristics of related industries and also for studying the fuel and power use of any single i n d ~ s t ~ r y that may have unusual characteristics in these respects.
The items which are most useful in analyzing the fuels and power used in manufacturing are these four :
Number of employees. Wages paid. Value added by manufacture. Costs of materials and supplies.
The cost of fuels and electric power is one among several items of cost that closely concerns the manufacturer. As is shown in the detailed analyses that follow, this item of fuel costs as a part of the cost of production varies in importance; i t is sometimes negligible and some- times major.
6 FUELS I N MANUFACTURING
2. Fuels Used in Manufacturing
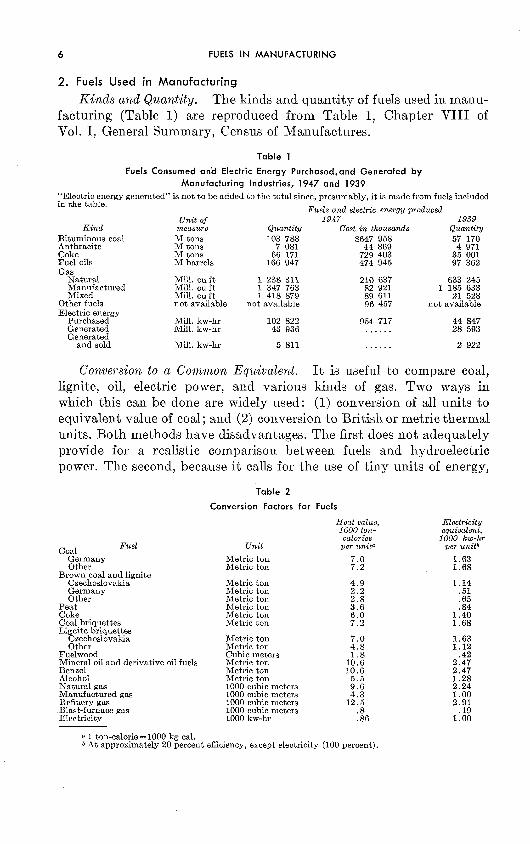
K i n d s and Quantity. The kinds and quantity of fuels used i11 manu- facturing (Table 1) are reproduced from Table 1, Chapter VIII of Vol. I, General Summary, Census of Manufactures.
Table 1 Fuels Consumed aria Electric Energy Purchased,and Generated by
Manufacturing Industries, 1947 and 1939 "Electric energy generated" is not to be added to the total since, presumably, it is made from fuels included in the table.
Fuels and electric energy produced Un i t of 1947 1939
K i n d measure Quantitv Cost i n thousands Quantity Bituminous coal M tons 103 788 $647 958 Anthracite M tons 7 081 44 869 Coke M tons 66 171 729 403 Fuel oils M barrels 166 947 474 945 Gas - Natural
Manufactured Mixed
Mill. cu f t 1 238 311 Mill. cu ft 1 347 763 Mill. cu ft 1 418 879
Other fuels not available not available 96 457 Electric energy
Purchased Mill. lrw-hr 102 822 954 717 Generated Mill. lrw-hr 43 936 . . . . . . Generated
and sold Mill. kw-hr 5 811 ......
Conversion to a Common Equivalent. It is useful to lignite, oil, electric power, and various kinds of gas. which this can be done are widely used: (1) conversion
633 245 1 185 633
21 528 not avadable
compare coal, Two ways in of all units to
equivalent value of coal; and (2) conversion to British or metric thermal units. Both methods have disadvantages. The first does not adequately provide for a realistic comparison between fuels and hydroelectric power. The second, because i t calls for
Table 2
Conversion Factors
the use of tiny units of energy,
Coal Fuel Un i t
Germany Metric ton Other Metric ton
Brown coal and lignite Czechoslovakia Metric ton Germany Metric ton Other Metric ton
Peat Metric ton Coke Metric ton Coal briquettes Metric ton Lignite briquettes
Czechoslovakia Metric ton Other Metric ton
Fuelwood Cubic meters Mineral oil and derivative oil fuels Metric ton 10.6 Benzol Metric ton 10.6 Alcohol Metric ton 5 . 5 Natural gas 1000 cubic meters 9 . 6 Manufactured gas 1000 cubic meters 4 . 3 Refinery gas 1000 cubic meters 12.5 Blast-furnace gas 1000 cubic meters . 8 Electricity 1000 kw-hr .86
a 1 ton-calorie = 1000 lrg cal. b At approximately 20 percent efficiency, except electricity (100 percent).
for Fuels
Reat value, 1000 ton- calories
per unit"
7 . O 7 . 2
4 . 9 2 . 2 2 . 8 3 . 6 6 . 0 7 .2
7 . 0 4 . 8 1 . 8
Electricity equivalent, 1000 kw-hr
per unitb
1.63 1 .68
1.14 .51 .65 .84
1.40 1.68
1.63 1.12
.42
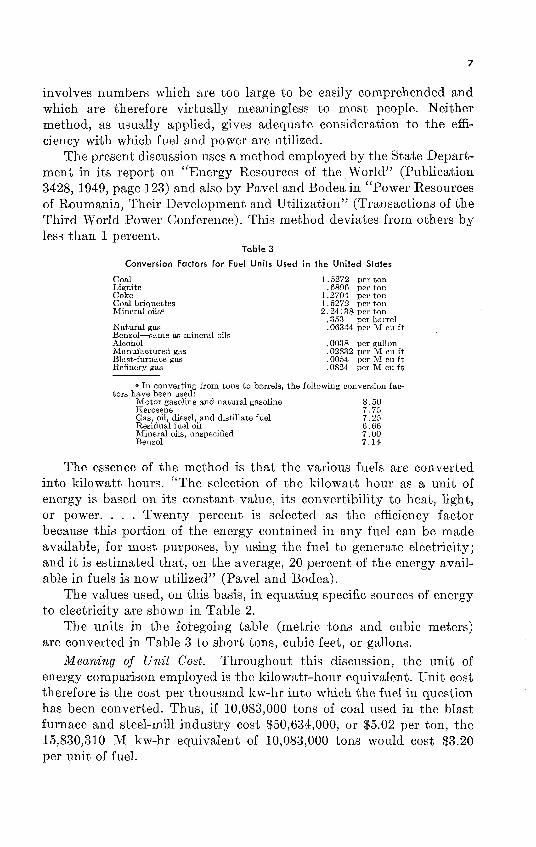
involves numbers which are too large to be easily comprehended and which are therefore virtually meaningless to most people. Neither method, as usually applied, gives adequate consideration to the effi- ciency with which fuel and power are utilized.
he present discussion uses a method employed by the State Depart- ment in its report on "Energy Resources of the World" (Publication 3428, 1949, page 123) and also by Pavel and Bodea in "Power Resources of Roumania, Their Development and Utilization" (Transactions of the Third World Power Conference). This method deviates from others by less than 1 percent.
Table 3
Conversion Factors for Fuel Units Used in the United States
Coal Lignite Coke Coal briquettes Mineral oils5
Natural gas Benzol-same as mineral oils Alcohol Manufactured gas Blast-furnace gas Refinery gas
1.5272 per ton .6896 per ton
1.2704 per ton 1.5272 per toil 2.24138 per ton
.353 per barrel
.06344 per RiI cu f t ,
.0038 per gallon
.02832 per M cu ft ,0054 per M cu ft .0824 per M cu f t
a In converting from tons to barrels, the following co~~vcrsion fac- tors have been used:
Motor gasoline and natural gasoline 8.50 Kerosene 7.75 Gas, oil, diesel, and distillate fuel 7.25 Residual fuel oil 6.66 Mineral oils, unspecified 7.00 Benzol 7.14
The essence of the method is that the various fuels are converted into kilowatt hours. "The selection of the kilowatt hour as a unit of energy is based on its constant value, its convertibility to heat, light, or power. . . . Twenty percent is selected as the efficiency factor because this portion of the energy contained in any fuel can be made available, for most purposes, by using the fuel to generate electricity; and it is estimated that, on the average, 20 percent of the energy avail- able in fuels is now utilized" (Pavel and Bodea).
The values used, on this basis, in equating specific sources of energy to electricity are shown in Table 2.
The units in the foregoing table (metric tons and cubic meters) are converted in Table 3 to short tons, cubic feet, or gallons.
Meaning of Unit Cost. Throughout this discussion, the unit of energy comparison employed is the kilowatt-hour equivalent. Unit cost therefore is the cost per thousand kw-hr into which the fuel in question has been converted. Thus, if 10,083,000 tons of coal used in the blast furnace and steel-mill industry cost $50,634,000, or $5.02 per ton, the 15,830,310 M kw-hr equivalent of 10,083,000 tons would cost $3.20 per unit of fuel.
I . GENERAL SURVEY OF FUELS I N MANUFACTURING
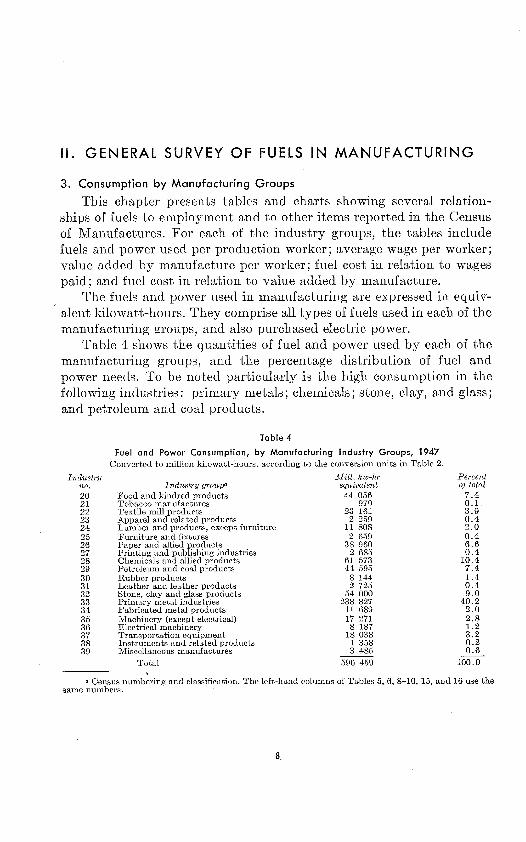
3. Consumption by Manufacturing Groups
This chapter presents tables and charts showing several relation- ships of fuels to employment and to other items reported in the Census of Manufactures. For each of t,he industry groups, the tables include fuels and power used per production worker; average wage per worker; value added by manufacture per worker; fuel cost i11 relation to wages paid; and fuel cost in relation to value added by manufacture.
The fuels and power used in manufacturing are expressed in equiv- alent kilowatt-hours. They comprise all types of fuels used in each of the manufacturing groups, and also purchased electric power.
Table 4 shows the quantities of fuel and power used by each of the manufacturing groups, and the percentage distribution of fuel and power needs. To be noted particularly is the high consumption in the following industries : primary metals ; chemicals ; stone, clay, and glass ; and petroleum and coal products.
Table 4
Fuel and Power Consumption, by Manufacturing industry Groups, 1947 Converted to million kilowatt-hours, according to the conversion units in Table 2.
Industry Mill. kw-lir Percent no. Industry groupa equivalent of total 20 Food and kindred products 44 056 7.4 21 Tobacco manufactures 979 0 .1 22 Textile mill products 23 161 3 .9 23 Apparel and related products 2 259 0 .4 24 Lumber and products, except furniture 11 808 2 .0 25 Furniture and fixtures 2 659 0 .4 26 Paper and allied products 38 960 6 .6 27 Printing and publishing industries 2 685 0 .4 28 Chemicals and allied products 61 573 10.4 29 Petroleum and coal products 44 595 7 .4 30 Rubber products 8 144 1 .4 31 Leather and leather products 2 725 0 .4 32 Stone, clay and glass products 54 000 9 .0 33 Primary metal industries 238 827 40.2 34 Fabricated metal products 11 689 2 .0 35 Machinery (except electrical) 17 271 2 .8 36 Electrical machinery 8 187 1 .2 37 Transportation equipment 18 038 3.2 38 Instruments and related products 1 358 0 .2 39 Miscellaneous manufactures 3 485 0 .6
Total 596 459 100.0 b
a Census numbering and classification. The left-hand columns of Tables 5, 6, 8-10, 15, and 16 use the same numbers.
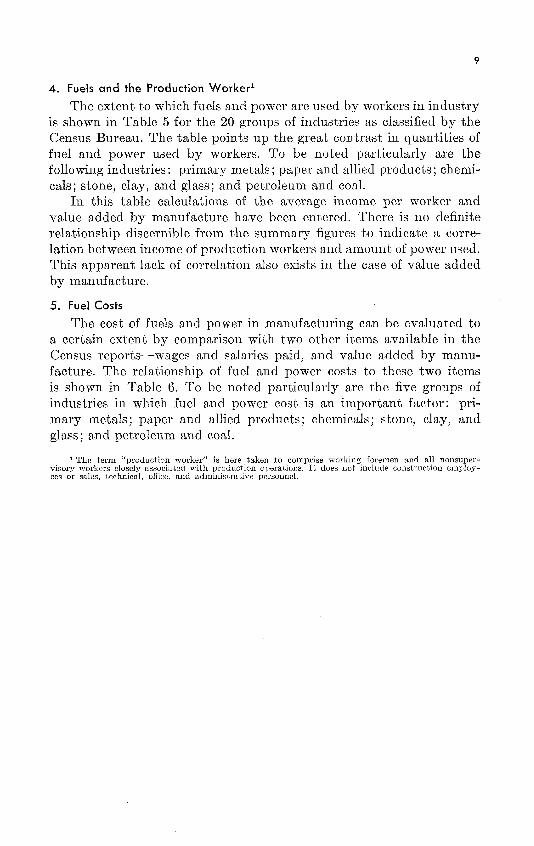
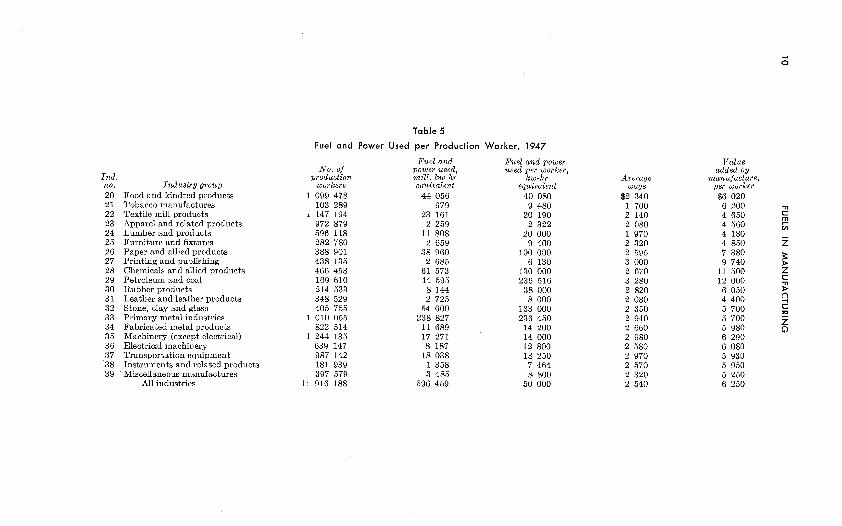
4. Fuels a n d t h e Production Worker1 The extent to which fuels and power are used by workers in industry
is shown in Table 5 for the 20 groups of industries as classified by the Census Bureau. The table points up the great contrast in quantities of fuel and power used by workers. To be noted particularly are the following industries : primary metals ; paper and allied products ; chemi- cals; stone, clay, and glass; and petroleum and coal.
In this table calculations of the average income per worker and value added by manufacture have been entered. There is no definite relationship discernible from the summary figures to indicate a corre- lation between income of production workers and amount of power used. This apparent lack of correlation also exists in the case of value added by manufacture.
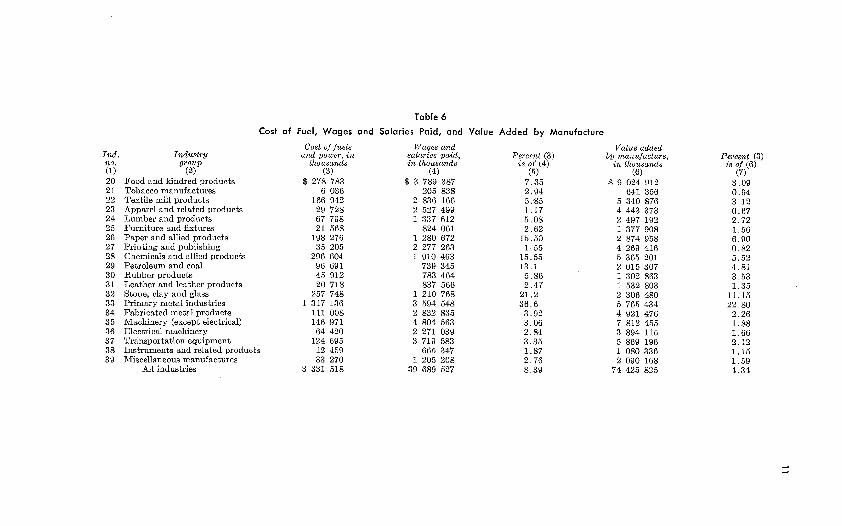
5. Fuel Costs
The cost of fuels and power in manufacturing can be evaluated to a certain extent by comparison with two other items available in the Census reports-wages and salaries paid, and value added by manu- facture. The relationship of fuel and power costs to these two items is shown in Table 6. To be noted particularly are the five groups of industries in which fuel and power cost is an important factor: pri- mary metals; paper and allied products; chemicals; stone, clay, and glass; and petroleum and coal.
The term "production worker" is here taken $0 comprise working foremen and all nonsuper- visory workers closely associated w ~ t h production operations. It does not include construction employ- ees or sales, technical, ofice, and administrative personnel.
I n d . Industry group no.
20 2 1 22 23 24 25 26 27 28 29 30 31 32 33 34 35 36 37 3 8 39
Food and kindred products Tobacco manufactures Textile mill products Apparel and related products Lumber and products Furniture and fixtures Paper and allied products Printing and publishing Chemicals and allied products Petroleum and coal Rubber products Leather and leather products Stone, clay and glass Primary metal industries Fabricated metal products Machinery (except electrical) Electrical machinery Transportation equipment Instruments and related products Miscellaneous manufactures
All industries
Table 5
Fuel and Power Used per Production Worker, 1947
Fuel and Fuel and power N o . of power used, used per worker,
production mil l . kw-hr kw-hr workers equivalent eouivalent
Average wage
$2 340 1 700 2 140 2 080 1 970 2 320 2 595 3 000 2 670 3 280 2 820 2 080 2 350 2 940 2 660 2 980 2 580 2 970 2 570 2 320 2 540
Value added by
manufacture , per worleer $6 020 6 200 -n 4 650 C rn 4 560 4 180
t; - 4 850 Z 7 380 9 740
11 500 5 z
12 000 6 050 4 400
; 2
5 700 C Fj 700 E 5 980 z 0 6 290 6 080 5 930 5 950 5 250 6 250
I n d . no. (1) 20 2 1 22 23 24 25 26 27 28 29 30 31 32 33 34 3 5 36 37 38 3 9
Table 6
Cost of Fuel, Wages and Salaries Paid, and Value Added by Manufacture
Industry group
(2) Food and kindred products Tobacco manufactures Textile mill products Apparel and related products Lumber and products Furniture and fixtures Paper and allied products Printing and publishing Chemicals and allied products Petroleum and coal Rubber products Leather and leather products Stone, clay and glass Primary metal industries Fabricated metal products Machinery (except electrical) Electrical machinerv
Cost of fuels and power, i n
thousands (3)
$ 278 783 6 036
166 942 29 728 67 798 21 568
198 276 35 205
296 604 96 691 45 912 20 718
257 748 1 317 136
111 008 146 971 64 420
Transportation equipment 124 695 Instruments and related products 12 459 R/Iiscellaneous manufactures 33 270
All industries 3 331 518
Wages and salaries paid, in thousands
(4) $ 3 789 387
205 838 2 836 166 2 527 499 1 337 612
824 061 1 280 672 2 277 263 1 910 463
739 345 783 464 837 566
1 210 768 3 594 548 2 832 835 4 804 563
Percent (3) i s of (4)
(5) 7.35 2.94 5.85 1.17 5.08 2.62
15.50 1.55
15.55 13.1 5.86 2.47
21.2 36.6 3.92 3.06
Value added by manufacture,
i n thousands (6)
$ 9 024 912 641 356
5 340 876 4 443 373 2 497 192 1 377 908 2 874 958 4 269 416 5 365 201 2 015 307 1 302 863 1 532 803 2 306 480 5 765 434 4 921 476 7 812 455
Percent (3) i s of (6)
(7)
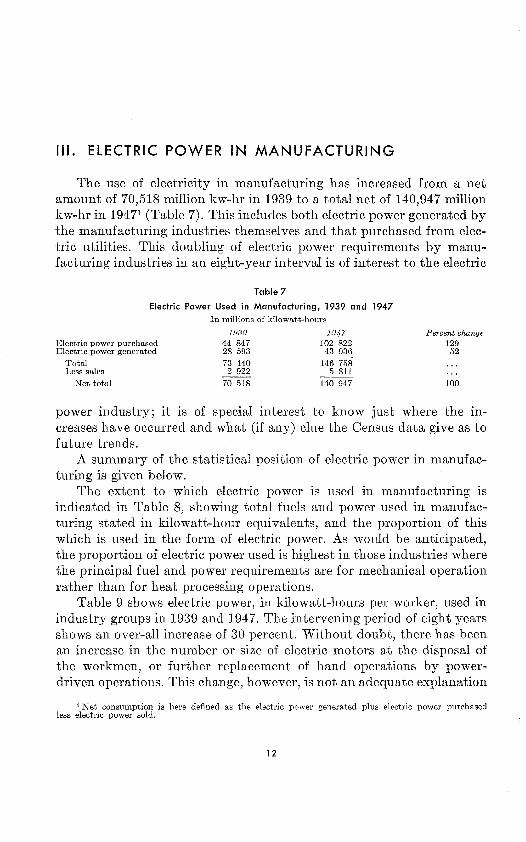
1 1 1 . ELECTRIC POWER I N MANUFACTURING
The use of electricity i11 manufacturing has increased from a net amount of 70,518 million kw-hr i11 1939 to a total net of 140,947 million kw-hr in 1947l (Table 7). This includes both electric power generated by the manufacturing industries themselves and that purchased from elec- tric utilities. This doubling of electric power requirements by manu- facturing industries in an eight-year interval is of interest to the electric
Table 7
Electric Power Used in Manufacturing, 1939 and 1947 In millions of kilowatt-hours
1939 Electric power purchased 44 847 Electric power generated 28 593
Total 73 440 Less sales 2 922
Net total 70 518
Percent c h a n ~ e
power industry; i t is of special interest to know just where the in- creases have occurred and what (if any) clue the Census data give as to future trends.
A summary of the statistical position of electric power in manufac- turing is given below.
The extent to which electric power is used i11 manufacturing is indicated in Table 8, showing total fuels and power used in manufac- turing stated in kilowatt-hour equivalents, and the proportion of this which is used in the form of electric power. As would be anticipated, the proportion of electric power used is highest in those industries where the principal fuel and power requirements are for mechanical operation rather than for heat processing operations.
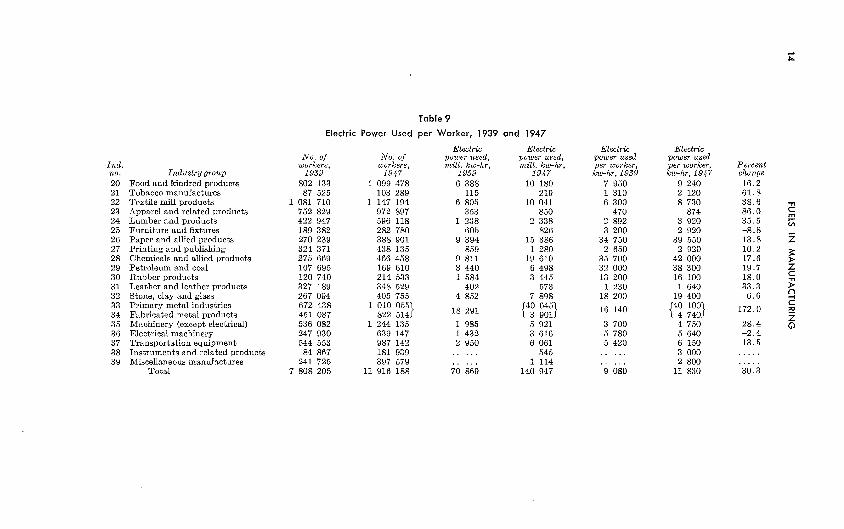
Table 9 shows electric power, in kilowatt-hours per worker, used in industry groups in 1939 and 1947. The intervening period of eight years shows an over-all increase of 30 percent. Without doubt, there has been an increase in the number or size of electric motors at the disposal of the workmen, or further replacement of hand operations by power- driven operations. This change, however, is not an adequate explanation
1 Net consumption is here defined as the electric power generated plus electric power purchased less electric power sold.
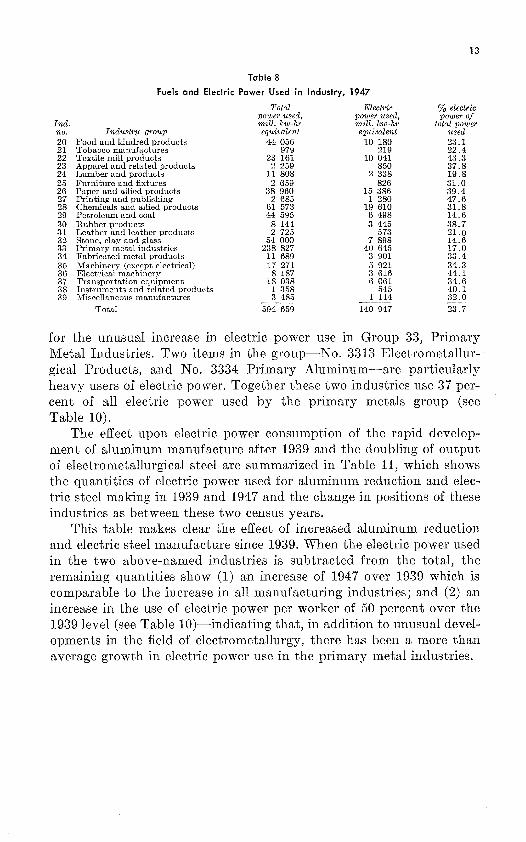
Table 8
Fuels and Electric Power Used in Industry, 1947
Total Electric % electric power used, power used, power of
I n d . mill. kw-hr mil l . k111-7w total vower no. 20 21 22 23 24 25 26 27 28 29 30 3 1 32 33 34 35 36 37 3 8 39
for
Indus t r y group Food and kindred products Tobacco manufactures Textile mill products Apparel and related products Lumber and products Furniture and fixtures Paper and allied products Printing and publishing Chemicals and allied products Petroleum and coal Rubber products Leather and leather products Stone, clay and glass Primary metal industries Fabricated metal products Machinery (except electrical) Electrical machinery Transportation equipment Instruments and related produc Miscellaneous manufactures
Total
equivalent equivalent uied
the uimsual increase in electric power use in Group 33, Primary Metal Industries. Two items in the group-No. 3313 Electrometallur- gical Products, and No. 3334 Primary Aluminum-are particularly heavy users of electric power. Together these two industries use 37 per- cent of all electric power used by the primary metals group (see Table 10).
The effect upon electric power consumption of the rapid develop- ment of aluminum manufacture after 1939 and the doubling of output of electrometallurgica1 steel are summarized in Table 11, which s h o w the quantities of electric power used for aluminum reduction and elec- tric steel making in 1939 and 1947 and the change in positions of these industries as between these two census years.
This table makes clear the effect of increased aluminum reduction and electric steel manufacture since 1939. When the electric power used in the two above-named industries is subtracted from the total, the remaining quantities show (1) an increase of 1947 over 1939 which is comparable to the increase in all manufacturing industries; and (2) an increase in the use of electric power per worker of 50 percent over the 1939 level (see Table 10)-indicating that, in addition to unusual devel- opments in the field of electrometallurgy, there has been a more than average growth in electric power use in the primary metal industries.
Tnd. no. 20 2 1 22 23 24 25 26 27 28 29 30 31 32 33 34 3 5 3 6 37 38 39
Table 9
Electric Power Used per Worker, 1939 and 1947
Electric Electric No . of No . of power used, power used,
workers, workers, mill. kw-hr, mill. kw-hr, Industry group 1939 1947 1939 1947
Food and kindred products 802 133 1 099 478 6 388 10 180 Tobacco manufactures 87 525 103 289 115 219 Textile mill products 1 081 710 1 147 194 6 805 10 041 Apparel and related products 752 829 972 897 3 53 850 Lumber and products 422 947 596 118 1 238 2 338 Furniture and fixtures 189 382 282 780 605 826 Paper and allied products 270 239 388 901 9 394 15 386 Printing and publishing 324 371 438 135 859 1 280 Chemicals and allied products 275 669 466 458 9 811 19 610 Petroleum and coal 107 695 169 610 3 440 6 498 Rubber products 120 740 214 533 1 584 3 445 Leather and leather products 327 189 348 529 402 573 Stone, clay and glass 267 094 405 755 4 852 7 898 Primary metal industries 672 438 1 010 055 Fabricated metal products 451 087 822 5141 291 Machinery (except electrical) 536 082 1 244 135 1 985
i"," :3 5 921
Electrical machinery 247 930 639 147 1 432 3 616 Transportation equipment 544 553 987 142 2 950 6 061 Instruments and related products 84 867 181 939 . . ... 545 Miscellaneous manufactures 241 725 397 579 . . ... 1 114
Total 7 808 205 11 916 188 70 869 140 947
Electric power used per worker, kw-hr, 1939
7 950 1 310 6 300
470 2 892 3 200
34 750 2 650
35 700 32 000 13 200 1 230
18 200
16 140
3 700 5 780 5 420 .. ...
Electric power used per worker, kw-hr, 1947
9 240 2 120 8 730
874 3 920 2 920
39 550 2 920
42 000 38 300 16 100 1 640
19 400
I": :3 4 750 5 640 6 150 3 000 2 800
11 830
Percent change 16.2 61.8 38.6 71
86.0 5 35.5 -8.8 - 13.8 Z 10.2 5: 17.6 g 19.7 18.0 33.3
6.6 ? C
172.0 z
28.4 0 -2.4 13.5
. . . . .

Table 10
I n d . no.
3311 3312 3313 3321 3322 3323 3331 3332 3333 3334 3339 3341 3351 3352 3359 3361 3391 3392 3393 3399
Electric Power Used by the Primary
Industry ~ r o u p Blast furnaces Steel works and rolling mills Electrometallurgical products Gray-iron foundries Malleable-iron foundries Steel foundries Primary copper Primary lead Primary zinc Primary aluminum Primary non-ferrous metals, n.e.c. Secondary non-ferrous metals Copper rolling and drawing Aluminum rolling and drawing Non-ferrous rolling, n.e.c. Non-ferrous foundries Iron and steel forgings Wire drawing Welding and heavy riveted pipc Primary metal industries, n.e.c.
Total
Number of workers 32 697
438 088 8 175
157 361 26 659 55 252 13 065 4 022
11 088 7 336 1 885
14 750 45 924 22 786 6 086
57 469 32 384 45 644 11 305 18 078
Metal Industries, 1947
Electric Electric power used power per worker mil l . kw-h; kw-hr
1 425 43 500 15 391 35 000 4 903 600 000
966 6 160 236 9 000 .
1 062 19 200 738 56 500 141 35 000
1 473. 133 000 10 270. 1 400 000
32 17 000 156 10 500 987 21 500 970 42 500 132 21 700 295 5 000 296 9 140 714 15 600 135 12 000 323 17 900
40 645
a Partly calculated.
Table 1 1 Electric Power Used in the Production of Aluminum and Electric Steel
In millions of kilowatt-hours
1939 1947 Group 33-Primary Metal industries 18 281 44 546 Aluminum reduction 2 943. 10 270 Electric steel furnaces 1 740b 4 903
Total of aluminum and steel 4 683 15 173 Difference: all other primary metals 13 608 29 373 Number of employees in "all other
primary metals" 696 862 999 995 Electric power used per "other"
employees 19 500 29 400
Percent 3.5
37.9 12.0 2.4 0 .6 2 .5 1 .9 0 .3 3.6
25.4 0 .1 0 .3 2 . 5 2 . 5 0 . 3 0 . 8 0 .8 1 .7 0 . 3 0 .9
a Electric power calculated for 1939 on a basis of 9 kw-hr of electric power to reduce 1 lb of aluminum.
b Calculated on the basis of the same rate of electric power consumption per ton of steel in 1939 as in 1947.

IV. FUELS AND POWER IN THE IRON AND STEEL INDUSTRIES
6. Fuels for lron Reduction
The fundamental fact that must be grasped i11 considering iron supply for industry is that iron is as much a product of fuel as i t is of the metal-bearing ore itself. Moreover, i t is equally essential to under- stand that in the process of manufacturing-from ore to finished auto- mobile, corn planter, or Boy Scout knife-the fuel that is needed to get over the first step of converting the ore to the pig-iron and steel-ingot stage seems like an inordinately large part of the total fuels needed in manufacture; i t is about 33 percent. Moreover, the fuel that can be used in the large-scale blast furnace for the production of iron on a large scale must be a hard, porous, strong load-bearing coke which is made from coal.
Nor have we as yet included all the necessary factors. This coke must be low in sulfur, to keep the percentage of the harmful material to a very small percentage in the resultant pig iron. While all other steps in manufacturing can, with occasional exceptions, use oil and gas as well as coal for the needed fuel requirements, the initial step i11 the manufac- turing process-getting the metal out of the ore-can be taken, for all practical purposes, only with coke from coal. This fuel is so special and exacting in its nature that a special term, ((coking coal," is applied to those coals from which coke or (more narrowly) metallurgical coke can be made.
In view of these many circumscribing factors, we realize with a start that, although the coal deposits of the nation are extensive and well distributed, yet the supply of coking coals and the districts in which they are found are very restricted.
7. Fuels and Power in the lron and Steel Industries Compared to
Total Fuel Requirements in Manufacturing
Among the 20 manufacturing industry groups, the one listed as pri- mary metal industries is by far the largest user of fuels and power; and within this group the iron and steel industries are d0minant.l A
1 I n this analysis, the manufacturing industries included under iron and steel are blast furnaces, steel works and rolling mills, and electrometallurgical products, but not gray-iron foundries, mal- leable-iron foundries, and steel foundries.
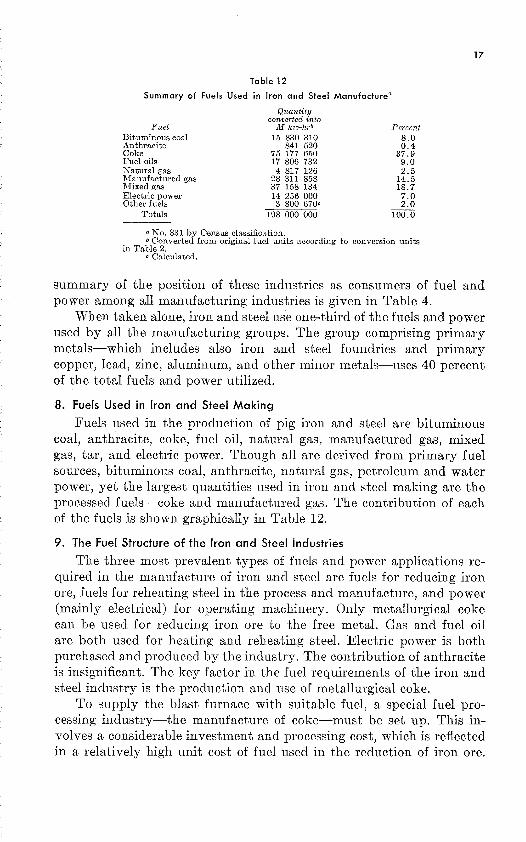
Table 12
Summary of Fuels Used in lron and Steel Manufacturea
Fuel Bituminous coal Anthracite Coke Fuel oils Natural gas Manufactured gas Mixed gas Electric power Other fuels
Totals
Q u a n t i t y converted i n t o
M kw-hr* 15 830 310
Percent
No. 331 by Census classification. b Converted from original fuel units according to conversion units
in Table 2. c Calculated.
summary of the position of these industries as consumers of fuel and power among all manufacturing industries is given in Table 4.
When taken alone, iron and steel use one-third of the fuels and power used by all the manufacturing groups. The group comprising primary metals-which includes also iron and steel foundries and primary copper, lead, zinc, aluminum, and other minor metals-uses 40 percent of the total fuels and power utilized.
8. Fue l s U s e d in l r o n a n d S t e e l M a k i n g
Fuels used in the production of pig iron and steel are bituminous coal, anthracite, coke, fuel oil, natural gas, manufactured gas, mixed gas, tar, and electric power. Though all are derived from primary fuel sources, bituminous coal, anthracite, natural gas, petroleum and water power, yet the largest quantities used in iron and steel making are the processed fuels-coke and manufactured gas. The contribution of each of the fuels is shown graphically in Table 12.
9. T h e Fuel S t r u c t u r e o f t h e l r o n a n d S t e e l I n d u s t r i e s
The three most prevalent types of fuels and power applications re- quired in the manufacture of iron and steel are fuels for reducing iron ore, fuels for reheating steel in the process and manufacture, and power (mainly electrical) for operating machinery. Only metallurgical coke can be used for reducing iron ore to the free metal. Gas and fuel oil are both used for heating and reheating steel. Electric power is both purchased and produced by the industry. The contribution of anthracite is insignificant. The key factor in the fuel requirements of the iron and steel industry is the production and use of metallurgical coke.
To supply the blast furnace with suitable fuel, a special fuel pro- cessing industry-the manufacture of coke-must be set up. This in- volves a considerable investment and processing cost, which is reflected in a relatively high unit cost of fuel used in the reduction of iron ore.
FUELS I N MANUFACTURING
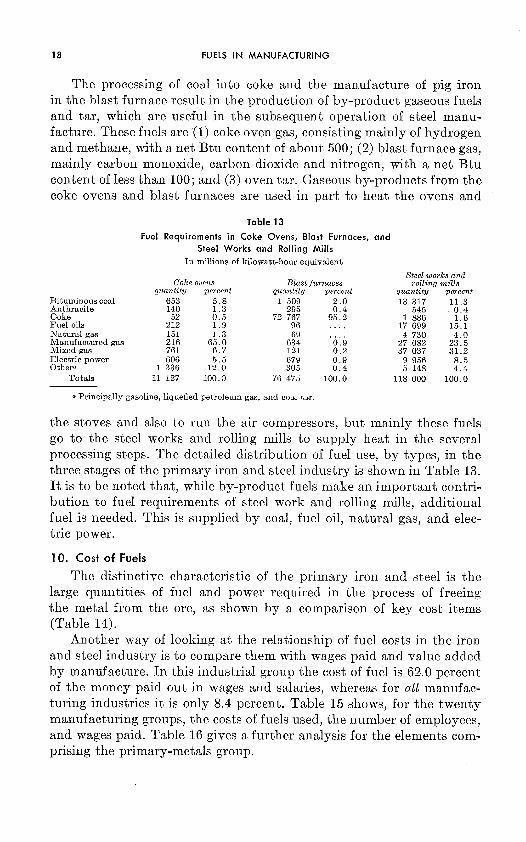
The processing of coal into coke and the manufacture of pig iron in the blast furnace result in the production of by-product gaseous fuels and tar, which are useful in the subsequent operation of steel manu- facture. These fuels are (1) coke oven gas, consisting mainly of hydrogen and methane, with a net Btu content of about 500; (2) blast furnace gas, mainly carbon monoxide, carbon dioxide and nitrogen, with a net Btu content of less than 100; and (3) oven tar. Gaseous by-products from the coke ovens and blast furnaces are used in part to heat the ovens and
Bituminous coal Anthracite Coke Fuel oils Natural gas Manufactured gas Mixed gas Electric power Other.
Totals
Table 13
Fuel Requirements in Coke Ovens, Blast Furnaces, Steel Works and Rolling Mills
In millions of kilowatt-hour equivalent
Coke ovens Blast furnaces quantity percent quantity percent
and
Steel works and rolling mills
quantitg percent 13317 11.3
545 0.4 1886 1.6
17699 15.1
a Principally gasoline, liquefied petroleum gas, and coal tar.
the stoves and also to run the air compressors, but mainly these fuels go to the steel works and rolling mills to supply heat in the several processing steps. The detailed distribution of fuel use, by types, in the three stages of the primary iron and steel industry is shown in Table 13. It is to be noted that, while by-product fuels make an important contri- bution to fuel requirements of steel work and rolling mills, additional fuel is needed. This is supplied by coal, fuel oil, natural gas, and elec- tric power.
10. Cost of Fuels
The distinctive characteristic of the primary iron and steel is the large quantities of fuel and power required in the process of freeing the metal from the ore, as shown by a comparison of key cost items (Table 14).
Another way of looking at the relationship of fuel costs in the iron and steel industry is to compare them with wages paid and value added by manufacture. In this industrial group the cost of fuel is 62.0 percent of the money paid out in wages and salaries, whereas for all manufac- turing industries it is only 8.4 percent. Table 15 shows, for the twenty manufacturing groups, the costs of fuels used, the number of employees, and wages paid. Table 16 gives a further analysis for the elements com- prising the primary-metals group.
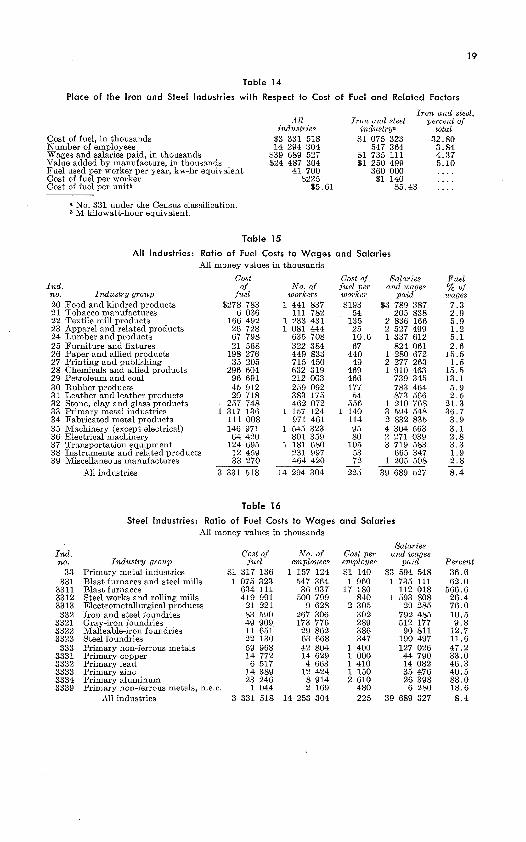
Table 14
Place of the Iron and Steel Industries with Respect to Cost
Cost of fuel, in thousands
All industries
$3 331 518
of Fuel and Related Factors
I r o n and steel, I r o n and steel percent of
industr ya total $1 075 323 32.80
Number of employees 14 294 304 547 364 3.84 Wages and salaries paid, in thousands $39 689 527 $1 735 111 4.37 Value added by manufacture, in thousands $24 487 304 $1 250 499 5.10 Fuel used per worker per year, kw-hr equivalent 41 700 360 000 . . . . Cost of fuel per worker $225 $1 140 . . . . Cost of fuel per unitb $5.61 $5.43 . . . .
a No. 331 under the Census classification. b M kilowatt-hour equivalent.
Table 15
All Industries: Ratio of Fuel Costs to Wages and Salaries All money values in thousands
I n d . Indus t r y group no.
20 21 22 23 24 25 26 27 28 29 30 3 1 32 33 34 35 36 37 3 8 39
Food and kindred products Tobacco manufactures Textile mill products Apparel and related products Lumber and products Furniture and fixtures Paper and allied products Printing and publishing Chemicals and allied products Petroleum and coal Rubber products Leather and leather products Stone, clay and glass products Primary metal industries Fabricated metal products Machinery (except electrical) Electrical machinery Transportation equipment Instruments and related products Miscellaneous manufactures
I n d . no .
33 331
3311 3312 3313 332
3321 3322 3323 333
3331 3332 3333 3334 3339
All industries
Cost Cost of Salaries of N o . of fuel per and wages
fuel workers worker paid
Table 16
Steel Industries: Ratio of Fuel Costs to Wages All money values in thousands
Cost of I ndus t r y group fuel
Primary metal industries $1 317 136 Blast furnaces and steel mills 1 075 323 Blast furnaces 634 111 Steel works and rolling mills 419 991 Electrometallurgical products 21 221 Iron and steel foundries 83 590 Gray-iron foundries 49 909 Malleable-iron foundries 11 651 Steel foundries 22 130 Primary non-ferrous metals 59 968 Primary copper 14 772 Primary lead 6 517 Primary zinc 14 389 Primary aluminum 23 246 Primary non-ferrous metals, n.e.c. 1 044
N o . of employees
1 157 124 547 364 36 937
500 799 9 628
and Salaries
Cost per employee $1 140 1 960
17 180 840
2 305 302 289 3 86 347
1 400 1 000 1 410 1 150 2 610
480
Salaries and wages
paid $3 594 548 1 735 111
112 018 1 593 808
29 285 792 485 512 177 90 811
190 497 127 026 44 790 14 082 35 476 26 398 6 280
Fuel % of wages
7.3 2 .9 5.9 1.2 5 .1 2 .6
15.5 1 .5
15.5 13.1 5 .9 2 .5
21.3 36.7 3.9 3 .1 2 .8 3 .3 1.9 2 .8 - 8 .4
Percent 36.6 62.0
566.6 26.4 76.0 10.5 9 .8
12.7 11.6 47.2 33.0 46.3 40.5 88.0 18.6
All industries 3 331 518 14 253 304 225 39 689 327 8 . 4
20 FUELS IN MANUFACTURING
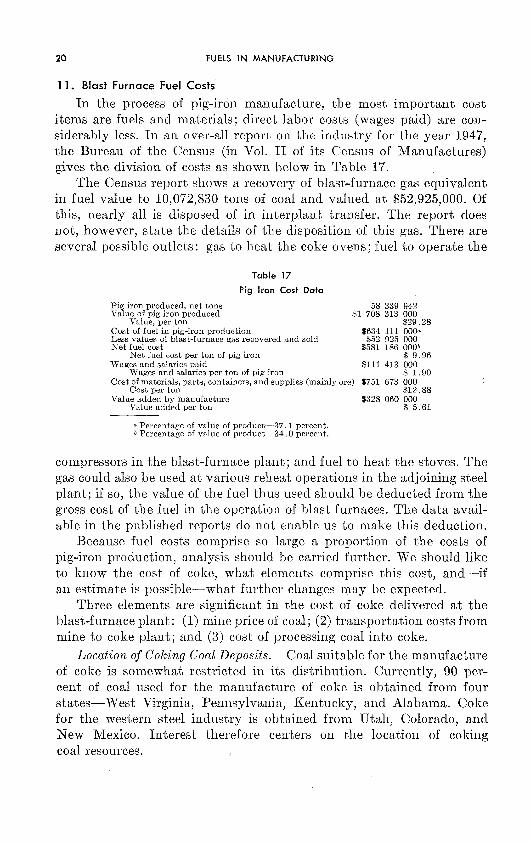
1 1 . Blast Furnace Fuel Costs
In the process of pig-iron manufacture, the most important cost items are fuels and materials; direct labor costs (wages paid) are con- siderably less. I11 an over-all report on the industry for the year 1947, the Bureau of the Census (in Vol. I1 of its Census of Manufactures) gives the division of costs as shown below in Table 17.
The Census report shows a recovery of blast-furnace gas equivalent in fuel value to 10,072,830 tons of coal and valued at $52,925,000. Of this, nearly all is disposed of in interplant transfer. The report does not, however, state the details of the disposition of this gas. There are several possible outlets: gas to heat the coke ovens; fuel to operate the
Table 17
Pig Iron Cost Data
Pig iron produced, net tons Value of pig iron produced
Value, per ton Cost of fuel in pig-iron production Less values of blast-furnace gas recovered and sold Net fuel cost
Net fuel cost per ton of pig iron Wages and salaries paid
Wages and salaries per ton of pig iron Cost of materials, parts, containers, and supplies (mainly
Cost per ton Value added by manufacture
Value added per ton
58 339 942 $1 708 313 000
$29.28 $634 111 OOOa $52 925 000
$581 186 OOOb $ 9.96
$111 413 000 $ 1.90
ore) $751 673 000 $12.88
$328 060 000 $ 5.61
a Percentage of value of product-37.1 percent. b Percentage of value of product-34.0 percent.
compressors in the blast-furnace plant; and fuel to heat the stoves. The gas could also be used at various reheat operations in the adjoining steel plant; if so, the value of the fuel thus used should be deducted from the gross cost of the fuel in the operation of blast furnaces. The data avail- able in the published reports do not enable us to make this deduction.
Because fuel costs comprise so large a proportion of the costs of pig-iron production, analysis should be carried further. We should like to know the cost of coke, what elements comprise this cost, and-if an estimate is possible-what further changes may be expected.
Three elements are significant in the cost of coke delivered at the blast-furnace plant: (1) mine price of coal; (2) transportation costs from mine to coke plant; and (3) cost of processing coal into coke.
Location of Coking Coal Deposits. Coal suitable for the manufacture of coke is somewhat restricted in its distribution. Currently, 90 per- cent of coal used for the manufacture of coke is obtained from four states-West Virginia, Pennsylvania, Kentucky, and Alabama. Coke for the western steel industry is obtained from Utah, Colorado, and New Mexico. Interest therefore centers on the location of coking coal resources.
For the years 1948 and 1949, the sources of coal used (in tons) for oven coke manufacture were as follows (source: Bureau of Mines, Minerals Yearbook).
1948
West Virginia 36,318,250 Pennsylvania 32,278,200 Kentucky 14,573,772 Alabama 8,822,325 Virginia 2,507,608
Partial Total 94,500,155 Western States
(Utah, Colorado, New Mexico) 3,529,512 Other States 2,343,060
Total 100,372,727
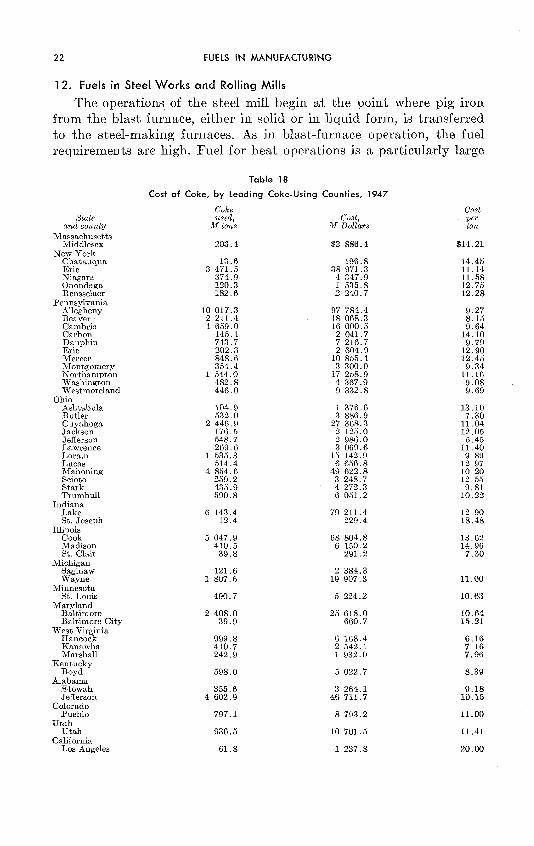
M i n e Price of Coking Coal. Table 18 shows the mine price of coal, by counties, for 1947.
Transportation Costs. Freight-rate increases during 1947, 1948, and 1949 affected considerably the delivered price of coal. The extent of these changes is indicated by two examples of increases in the rates from coking-coal districts to the Chicago market.
Rail Rates i n E$ect Dec. 1946 Dec. 1947 Dec. 1948 Dec. 1949
New River and Pocahontas $3.69 $3.79 $4.09 $4.44 Eastern Kentucky, West
Virginia high volatile $3.49 $3.59 $3.89 $4.25
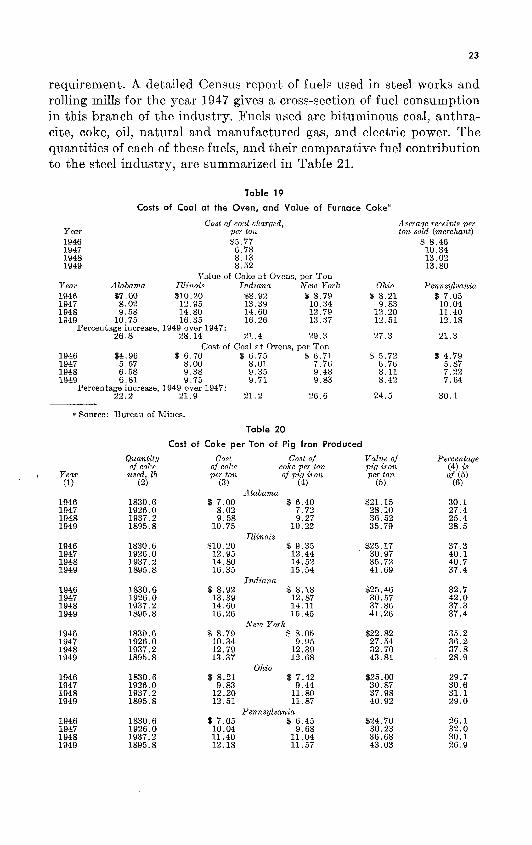
Cost of Coal and Coke at the Ovens. The combined effect of increased mine prices of coking coal and increases in rail freight on coal is reflected in the increasing costs of coke at the plant. The history of these price changes from 1946 to 1949 for the industry and for leading coke-con- suming states is shown in Table 19.
Cost of Coke per T o n of Pig I r o n Produced. An attempt has been made in Table 20 to arrive at a cost of coke per ton of pig iron produced in six of the important pig-iron producing states. I11 arriving a t this estimate, the figures for pounds of coke needed to produce a ton of pig iron are available only for the entire industry and not for individual states. This figure varies from year to year, depending upon the changing quality of coal available for the making of coke and also upon changes in operation conditions of the furnaces. It is not to be taken for granted that there are no variations in coke consumption among the several pig-iron producing districts or that changes in coke requirements from year to year are indentical among these districts. The figures in columns ( 2 ) , (4), and (6) must therefore be regarded as approximations only.
2 2 FUELS I N MANUFACTURING
12. Fuels in Steel Works and Rolling Mills The operations of the steel mill begin at the point where pig iron
from the blast furnace, either in solid or in liquid form, is transferred to the steel-making furnaces. As in blast-furnace operation, the fuel requirements are high. Fuel for heat operations is a particularly large
Table 18
Cost of Coke, by Leading Coke-Using Counties, 1947
Coke used
M tor& Cost,
M Dollars
Cost Per ton
State and county
Massachusetts Middlesex
New York Chatauqua Erie Niagara Onondaga Rensselaer
Pennsylvania Allegheny Beaver Cambria Carbon Dauphin Erie Mercer Montgomery Northampton Washington Westmoreland
Ohio Ashtabula Butler Cuyahoga Jackson Jefferson Lawrence Lorain Lucas Mahoning Scioto Stark Trumbull
Indiana Lake St. Joseph
Illinois Cook Madison St. Clair
Michigan Saginaw Wavne
~ i n n e s o t a St. Louis
Maryland Baltimore Baltimore City
West Virginia Hancock IZanawha Marshall
Kentucky Boyd
Alabama Etowah Jefferson
Colorado Pueblo
Utah Utah
California Los Angeles
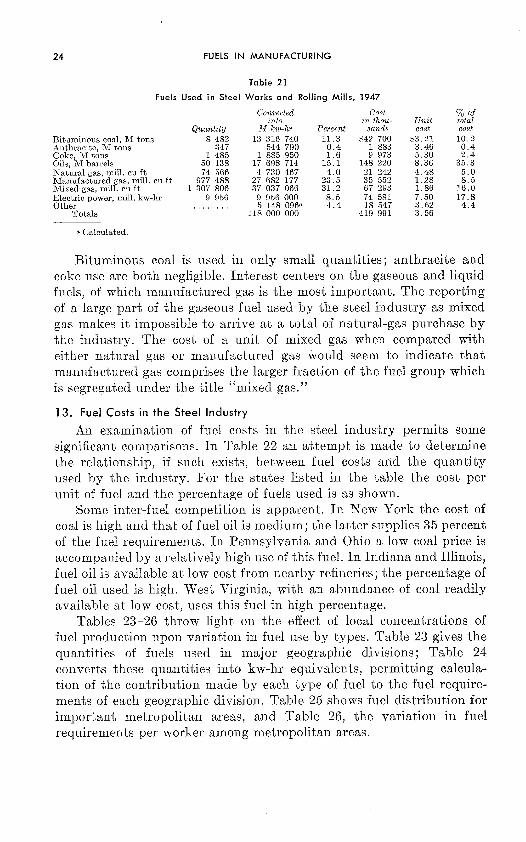
requirement. A detailed Census report of fuels used in steel works and rolling mills for the year 1947 gives a cross-section of fuel consumption in this branch of the industry. Fuels used are bituminous coal, anthra- cite, coke, oil, natural and manufactured gas, and electric power. The quantities of each of these fuels, and their comparative fuel contribution to the steel industry, are summarized in Table 21.
Table 19
Costs of Coal at the Oven, and Value of Furnace Cokea
Year Cost of coal charged,
per t on Average receipts per ton sold (merchant)
1949 8.52 Value of Coke a t Ovens, per Ton
Year Alabama I l l inois Ind iana N e w York 0 hio Pennsylvania .% 7.05 1946 $7.00 $10.20 $8.92 $ 8.79 9% 8.21
1947 8.02 12.95 13.39 10.34 9.83 1948 9.58 14.80 14.60 12.79 12.20 1949 10.75 16.35 16.26 13.37 12.51
Percentage increase, 1949 over 1947: 26.8 28.14 21.4 29.3 27.3
Cost of Coal a t Ovens, per Ton 1946 $4.96 $ 6.70 $ 6.75 $ 6.71 $ 5.72 1947 5.57 8.00 8 .01 7.76 6.76 1948 6.58 9.38 9.35 9.48 8.11 1949 6,81 9.75 9 .71 9.83 8.42
Percentage increase, 1949 over 1947: 22.2 21.9 21.2 26.6 24.5
a Source: Bureau of Mines.
Table 20
Cost of Coke per Ton of Pig Iron Produced
Quanti ty Cost Cost of Va lue of of coke of coke coke per ton pig i ron
used, lb per ton of pig i ron per ton (2) (3 (4) (5)
Alabama
, Year (1)
I l l inois
Ind iana
N e w Y o r k 1830.6 9b 8.79 9b 8.05 $22.82
Ohio $ 8.21 $ 7.42
9.83 9.44 12.20 11.80 12.51 11.87
Pennsylvania $ 7.05 $ 6.45
10.04 9 .68 11.40 11.04 12.18 11.57
FUELS IN MANUFACTURING
Table 21
Fuels Used in Steel Works and Rolling Mills, 1947
Converted Cost into in thou-
Quantity M lcw-hr Percent sands Bituminous coal, M tons 8 482 13 316 740 11.3 $42 700 Anthracite, M tons 347 544 790 0 .4 1 883 Coke, M tons 1 485 1 885 950 1 . 6 9 973 Oils, M barrels 50 138 17 698 714 15.1 148 220 ~ a t ' u r a l gas mill. cu ft 74 566 4 730 467 4 .0 21 242 Manufactukd gas, mill. cu f t 977 488 27 682 177 23.5 35 552 Mixed gas, mill. cu ft 1 307 806 37 037 066 31.2 67 293 Electric power, ndl . ltw-hr 9 956 9 956 000 8.5 74 581 Other , . . . , . . . 5 148 096a 4 .4 18 547
Totals 118 000 000 419 991
Uni t cost
$3.21 3.46 5.30 8.36 4.48 1.28 1.86 7.50 3.62 3.56
% of total cost 10.2 0.4 2.4
35.3 5.0 8.5
16.0 17.8 4.4
a Calculated.
Bituminous coal is used in only small quantities; anthracite and coke use are both negligible. Interest centers on the gaseous and liquid fuels, of which manufactured gas is the most important. The reporting of a large part of the gaseous fuel used by the steel industry as mixed gas makes it impossible to arrive at a total of natural-gas purchase by the industry. The cost of a unit of mixed gas when compared with either natural gas or manufactured gas would seem to indicate that manuf actureci gas comprises the larger fraction of the fuel group which is segregated under the title "mixed gas."
13. Fuel Costs in the Steel Industry
An examination of fuel costs in the steel industry permits some significant comparisons. In Table 22 an attempt is made to determine the relationship, if such exists, between fuel costs and the quantity used by the industry. For the states listed in the table the cost per unit of fuel and the percentage of fuels used is as shown.
Some inter-fuel competition is apparent. In New York the cost of coal is high and that of fuel oil is medium; the latter supplies 35 percent of the fuel requirements. In Pennsylvania and Ohio a low coal price is accompanied by a relatively high use of this fuel. I11 Indiana and Illinois, fuel oil is available at low cost from nearby refineries; the percentage of fuel oil used is high. West Virginia, with an abundance of coal readily available at low cost, uses this fuel in high percentage.
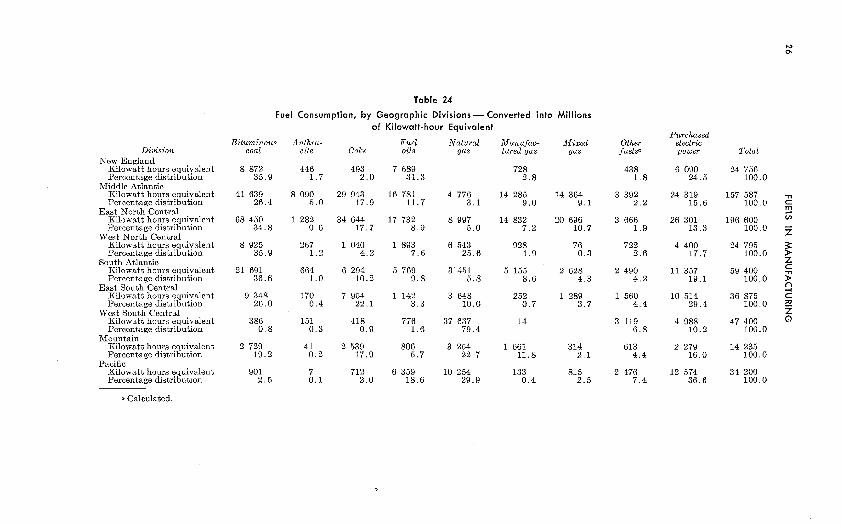
Tables 23-26 throw light on the effect of local concentrations of fuel production upon variation in fuel use by types. Table 23 gives the quantities of fuels used in major geographic divisions; Table 24 converts these quantities into kw-hr equivalents, permitting calcula- tion of the contribut,ion made by each type of fuel to the fuel require- ments of each geographic division. Table 25 shows fuel distribution for important metropolitan areas, and Table 26, the variation in fuel requirements per worker among metropolitan areas.
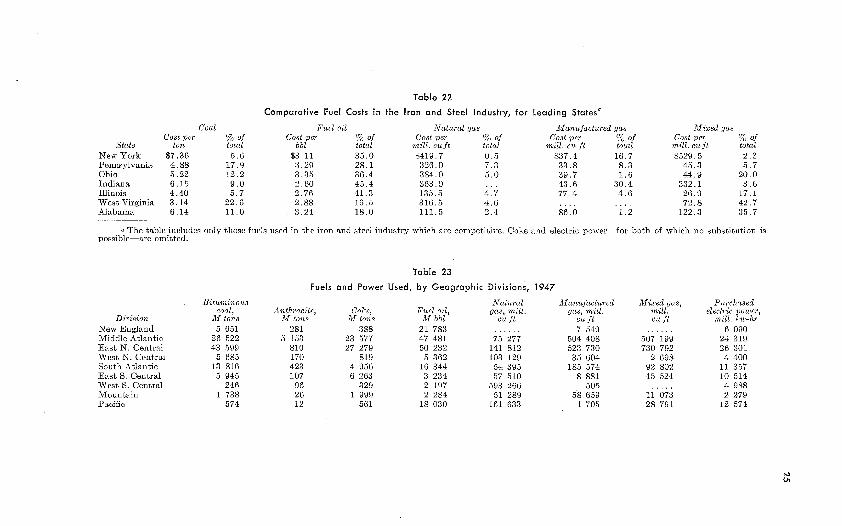
Table 22
State New York Pennsylvania Ohio Indiana Illinois West Virginia Alabama
Coal Cost per
ton $7.36 4.88 5.22 6.15 4.40 3.14 6.14
Comparative Fuel Costs in the Iron and Steel Industry, for Leading Statesa
Fuel oil % of Cost per total bbl 5 .6 $3.11
17.9 3.29 12.2 3.35 9 .0 2 . 60 5 .7 2.76
22.6 2.88 11.0 3.24
% of total 35.0 28.1 36.4 45.4 41.3 16.5 18.0
Natural gas Cost per % of
mi l l . cu f t total $419.7 0 . 5 326.0 7 . 3 384.0 5 .0 363.0 . . . 135.5 4.7 316.5 4 . 6 111.5 2 .4
Manufic tured gas Cost per % of
mi l l . c u f t total $37.4 16.7 33.8 8 . 3 39.7 1 . 6 43.6 30.4 77.4 4 .6 . . . . . . . . 86.0 1 . 2
Mixed gas Cost per % of
mi l l . c u f t total $529.5 2 .3
45.3 5 .7 44.9 20.0
332.1 3 .6 26.9 17.1 72.8 42.7
122.3 35.7
a The table includes only those fuels used in the iron and steel industry which are competitive. Coke and electric power-for both of which no substitution is possible-are omitted.
Division New England Middle Atlahtic East N. Central West N. Central South Atlantic East S. Central West S. Central Mountain Pacific
Bi tuminous coal,
M tons 5 651
26 522 43 599
5 685 13 816 5 945
246 1 738
574
Table 23
Fuels and Power Used, by Geographic Divisions,
Natural Anthracite, Coke, Fuel oil, gas, mi l l .
M tons M tons iV1 b bl cu f t 281 388 21 783 . . . . . .
5 153 23 577 47 481 75 277 810 27 279 50 232 141 812 170 819 5 362 103 129 423 4 956 1G 344 54 395 107 6 263 3 234 57 510
9 6 329 2 197 593 266 26 1 999 2 284 51 289 12 561 18 030 161 633
1947
Manufactured gas, mi l l .
cu f t 7 549
504 408 523 730 35 604
185 574 8 881
505 58 659 4 705
Mixed gas, mi l l . c u f t
Purchased electric power,
mi l l . kw-hr 6 090
24 319 26 301 4 400
11 357 10 514 4 988 2 279
12 574
Division New England
Kilowatt hours equivalent Percentage distribution
Middle Atlantic Kilowatt hours equivalent Percentage distribution
East North Central Kilowatt hours equivalent Percentage distribution
West North Central Kilowatt hours equivalent Percentage distribution
South Atlantic Kilowatt hours equivalent Percentage distribution
East South Central Kilowatt hours equivalent Percentage distribution
West South Central Kilowatt hours equivalent Percentage distribution
Mountain Kilowatt hours equivalent Percentage distribution
Pacific Kilowatt hours equivalent Percentage distribution
a Calculated.
Table 24
Fuel Consumption, by Geographic Divisions - Converted into Millions
Bituminous coal
8 872 35.9
41 639 26.4
68 450 34.8
8 925 35.9
21 691 36.6
9 348 26.0
3 86 0 .8
2 729 19.2
901 2 .5
Anthra- cite
446 1 . 7
8 090 5 .0
1 282 0 . 6
267 1 . 2
664 1 . 0
170 0 .4
151 0 .3
41 0 .2
7 0 . 1
of Kilowatt-hour Equivalent
Fuel oils
7 689 31.3
16 781 11.7
17 732 8 . 9
1 893 7 . 6
5 769 9 . 8
1 142 3 .3
776 1 .6
806 5 . 7
6 359 18.6
Natural gas
4 776 3 .1
8 997 5 .0
6 543 25.6
3 451 5 .8
3 648 10.0
37 637 79.4
3 254 22.7
10 254 29.9
Manufac- tured gas
728 2 . 8
14 285 9 .0
14 832 7 .2
928 4 .9
5 155 8 . 6
252 0 . 7
14
1 661 11.8
133 0 .4
Mixed gas
14 364 9 .1
20 696 10.7
76 0 .3
2 628 4.3
1 289 3 .7
314 2 .1
815 2 .5
Other fuels.
43 8 1 . 8
3 392 2 .2
3 666 1 .9
722 2.6
2 490 4 .2
1 560 4.4
3 119 6 . 8
613 4 .4
2 476 7 .4
Purchased electric power
6 090 24.5
24 319 15.6
26 301 13.3
4 400 17.7
11 357 19.1
10 514 29.4
4 988 10.2
2 279 16.0
12 574 36.6
Total
24 756 100.0
157 587 100.0
196 600 100.0
24 795 100.0
59 400 100.0
36 875 100.0
47 400 100.0
14 235 100.0
34 200 100.0
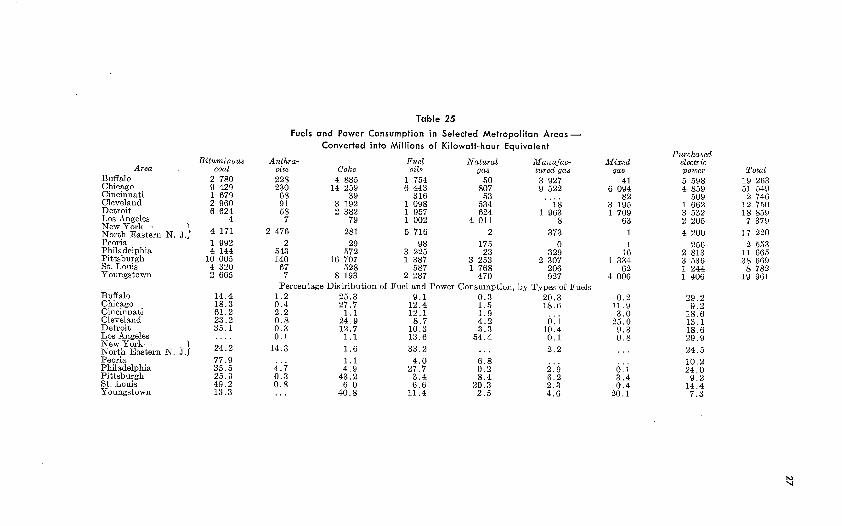
Table 25
Area Buffalo Chicago Cincinnati Cleveland Detroit Los Angeles New York- North Eastern N. J.) Peoria Philadelphia Pittsbu~gh St. LOUIS Youngstown
Buffalo Chicago Cincinnati Cleveland Detroit Los Angeles New York- North Easter Peoria Philadelphia Pittsburgh St. Louis Youngstown
Bituminous coal
Fuels and Power Consumption in Selected Metropolitan Areas- Converted info Millions of Kilowatt-hour Equivalent
Anthra- Fuel Natural Manufac- cite Coke oils gas tured gas 228 4 885 1 754 50 3 927 230 14 259 6 443 807 9 522
68 3 9 316 53 . . . . 9 1 3 192 1 098 534 18 58 2 382 1 957 624 1 963 7 79 1 002 4 011 8
2 476 281 5 716 2 373 2 29 98 175 0
543 572 3 225 23 329 140 16 707 1 387 3 253 2 307 67 528 587 1 768 206 7 8 193 2 287 470 927
Percentage Distribution of Fuel and Power Consumption, by Types of Fuels 1 . 2 25.3 9 .1 0 .3 20.3 0 .4 27.7 12.4 1 . 5 18.6 2 .2 1 . 1 12.1 1 .9 . . . 0 . 8 24.9 8 . 7 4 .2 0 . 1 0 .3 12.7 10.3 3 .3 10.4 0 .1 1 . 1 13.6 54.4 0 . 1
14.3 1 .6 33.2 ... 2.2
Purchased electric power 5 598 4 859
509 1 662 3 532 2 205 4 200
Total
FUELS I N MANUFACTURING
Table 26
Fuels and Power per Production Worker in Selected Metropolitan
Area Buffalo Chicago Cincinnati Cleveland Detroit Los Angeles New York- North Eastern N. J.) Peoria Philadelphia Pittsburgh St. Louis Youngstown
Kw-hr equiv- alent used, in
millions 19 263 51 549 2 746
12 750 18 859 7 379
17 220
2 553 11 665 38 669 8 782
19 961
N o . of production
workers 149 758 756 115 108 476 218 929 466 922 281 806
274 357
34 492 437 553 284 017 200 123
94 263
Areas
Fuel and power consumption per worker,
kw-hr 128 600 68 000 25 300 53 650 40 400 26 200
13 500
74 000 26 600
136 000 43 880
211 700


![[XLS]minoritywelfare.bih.nic.inminoritywelfare.bih.nic.in/scholarships/PreMatric/Fresh... · Web view1 1000 0 0 1000 2 1000 0 0 1000 3 1000 0 0 1000 4 1000 0 0 1000 5 1000 0 0 1000](https://img.pdfslide.us/doc/110x75/5ab4f6537f8b9a7c5b8c491e/xls-view1-1000-0-0-1000-2-1000-0-0-1000-3-1000-0-0-1000-4-1000-0-0-1000-5-1000.jpg)


![[XLS] · Web view1 6 66.2 60000 0 0 1000 1000 2 7 72.599999999999994 60000 0 0 1000 1000 3 8 75 60000 0 0 1000 1000 4 4 65 65000 0 0 1000 1000 5 4 66.400000000000006 65000 0 0 1000](https://img.pdfslide.us/doc/110x75/5ab110787f8b9a284c8bff61/xls-view1-6-662-60000-0-0-1000-1000-2-7-72599999999999994-60000-0-0-1000-1000.jpg)