Embed Size (px)
Citation preview

STATE OF ILLINOIS WILLIAM 6. STRATTON, Governor
DEPARTMENT O F REGISTRATION AND EDUCATION VERA M. BINKS, Director
DIVISION O F T H E
S T A T E G E O L O G I C A L S U R V E Y JOHN C. FRYE, Chief
URBANA
REPORT OF INVESTIGATIONS 190
PRINTED BY AUTHORITY OF THE STATE OF ILLINOIS
URBANA, ILLINOIS
1 9 5 5

STATE OF ILLINOIS
WILLIAM G. STRATTON, Governor
DEPARTMENT OF REGISTRATION AND EDUCATION VERA M. BINKS, Direitor
DIVISION OF THE
S T A T E G E O L O G I C A L S U R V E Y JOHN C. FRYE, Chief
URBANA
REPORT OF INVESTIGATIONS 190
SOME EXPERIMENTAL FACTORS THAT MODIFY DIFFERENTIAL THERMOGRAMS OF BITUMINOUS COAL
BY
KENNETH E. CLEGG
PRINTED BY AUTHORITY OF THE STATE OF ILLINOIS
URBANA, ILLINOIS
1 9 5 5
ORGANIZATION
STATE OF ILLINOIS HON. WILLIAM G. STRATTON, Governor
DEPARTMENT OF REGISTRATION AND EDUCATION HON. VERA M. BINKS, Director
BOARD OF NATURAL
HON. VERA M.
RESOURCES
BINKS, Chairman
AND CONSERVATION
W. H. NEWHOUSE, PH.D., Geology
ROGER ADAMS, PH.D., D.Sc., Chemistry
ROBERT H. ANDERSON, B.S., Engineering
A. E . EMERSON, PILD., Biology
LEWIS H. TIFFANY, PH.D., PD.D., Forestry
W. L. EVERITT, E.E., PH.D. Representing the President of the University of Illinois
DELYTE W. MORRIS, PKD. President of Southern Illinois University
GEOLOGICAL SURVEY DIVISION JOHN C. F R Y E , PH.D., D.Sc., Chief

STATE GEOLOGICAL SURVEY DIVISION Natural Resources Building, Urbana
JOHN C. FRYE, PH.D., D.Sc., Chief M. M. LEIGHTON, PH.D., D.Sc., Chief, Emeritus
ENID TOWNLEY, M.S., Geologist and Assistant to the Chief VELDA A. MILLARD, Junior Assistant to the Chief
HELEN E. MCMORRIS, Secretary to the Chief
. R E S E A R C H (not including part-time personnel)
GEOLOGICAL RESOURCES ARTHUR BEVAN, PH.D., D.Sc., Principal Geologist FRANCES H . ALSTERLUND, A.B., Research Assistant
Coal JACK A. SIMON, MS. , Geologist and Head G. 13. CADY, PH.D., Senior Geologist and Head, Emeritus CHARLES E . MARSHALL, PH.D., Visiting Research Scien-
tist ROBERT M. KOSANKE, PH.D., Geologist RAYMOND SIEVER, PH.D., Geologist JOHN A. HARRISON, M.S., Associate Geologist PAUL EDWIN POTTER, PH.D., Associate Geologist HAROLD B. STONEIIOUSE, PH.D., Associate Geologist MARGARET A. PARKER, M.S., Assistant Geologist M. E. HOPKINS, M.S., Assistant Geologist KENNETH E. CLEGG, M.S., Assistant Geologist
Oil and Gas A. H. BELL, PH.D., Geologist and Head LESTER L. WHITING, B.A., Associate Geologist VIRGINIA KLINE, PH.D., Associate Geologist WAYNE F. MEENTS, Assistant Geologist MARGARET 0. OROS, B.A., Assistant Geologist KENNETH R. LARSON, A.B., Research Assistant JACOB VAN DEN BERG, B.S., Research Assistant
Petroleum Engineering PAUL A. WITHERSPOON, M.S., Petroleum Engineer and
Head FREDERICK SQUIRES, A.B., B.S., D.Sc., Petroleum Engi-
neer, Emeritus
Industrial Minerals J. E. LAMAR, B.S., Geologist and Head DONALD L. GRAF, PH.D., Geologist JAMES C. BRADBURY, A.M., Associate Geologist MEREDITH E. OSTROM, M.S., Assistant Geologist DONALD L. BIGGS, M.A., Assistant Geologist
Clay Resources and Clay Mineral Technology RALPH E. GRIM, PH.D., Consulting Clay Mineralogist W. ARTHUR WHITE, PH.D., Geologist HERBERT D. GLASS, PH.D., Associate Geologist CHARLES W. SPENCER, M.S., Research Assistant
Groundwater Geology and Geophysical Exploration GEORGE B. MAXEY, PH.D., Geologist and Head MERLYN B. BUHLE, M.S., Geologist ROBERT E. BERGSTROM, PH.D., Associate Geologist JOHN W. FOSTER, M.S., Associate Geologist JAMES E. HACKETT, M.S., Assistant Geologist MARGARET J . CASTLE, Assistant Geologic Draflsman
(on leave) WAYNE A. PRYOR, M.S., Assistant Geologist LIDIA SELKREGG, D.N.S., Assistant Geologist ROBERT C. PARKS, Technical Assistant
Engineering Geology and Topographic Mapping GEORGE E. EKBLAW, PH.D., Geologist and Head WILLIAM C. SMITH, M.A., Assistant Geologist
Stratigraphy and Areal Geology H. B. WILLMAN, PH.D., Geologist and Head DAVID H. SWANN, P H . ~ . . Geologist ELWOOD ATHERTON, PH.D., Geologist CHARLES W. COLLINSON, P H . ~ . , Associate Geologist DONALD B. SAXBY, M.S., Associate Geologist T. C. Buscr-IBAC~, M.S., Assistant Geologist HOWARD R . SCHWALB, B.S., Research Assistant FRANK B. TITUS, JR., B.S., Research Assistant CHARLES C. ENGEL, Technical Assistant JOSEPH F. HOWARD, Assistant
Physics R. J. PIERSOL, PH.D., Physicist, Emeritus
Topographic Mapping in Cooperation with the United States Geological Survey.
July 1, 1955
GEOCHEMISTRY FRAXK 13. REED, PH.D., Chief Chemist GRACE C. JOHNSON, B.S., Research Assistant
Coal Chemistry G. R. YOHE, P H . ~ . , Chemist and Head EARLE C. SMITH, B.S., Research Assistant GUEY H. LEE, M.S., Research Assistant
Physical Chemistry J. S. MACHIN, PH.D., Chemist and Head JUANITA WITTERS, M.S., Assistant Physicist DANIEL L. DEADMORE, B.S., Research Assistant
Fluorine Chemistry G. C. FINGER, PH.D., Chemist and Head ROBERT E. OESTERLING, B.A., Assistant Chemist CARL W. KRUSE, M.S., Special Research Assistant RAYMOND H. WHITE, B.S., Special Research Assistant RICHARD H. SHILEY, B.S., Special Research Assistant
Chemical Engineering H. W. JACKMAN, M.S.E., Chemical Engineer and Head R. J. HELFINSTINE, M.S., Mechanical Engineer and
Supervisor of Physical Plant B. J. GREENWOOD, B.S., Mechanical Engineer JAMES C. MCCULLOUGH, Research Associate (on leave) ROBERT L. EISSLER, B.S., Assistant Chemical Engineer WALTER E. COOPER, Technical Assistant EDWARD A. SCIIAEDE, Technical Assislant CORNEL MARTA, Technical Assistant
X- Ray W. F. BRADLEY, PH.D., Chemist and Head
Analytical Chemistry 0. W. REES, PII.D., Chemist and Head L. D. MC~JICKER, B.S., Chemist EMILE D. PIERRON, M.S., Associate Chemist FRANCES A. COOLICAN, B.S., Assistant Chemist DONALD R. DICKERSON, B.S., Assistant Chemist CHARLES T . ALLBRIGHT. B.S., Research Assistant
(on leave) WILLIAM J. ARMON, B.S., Research Assistant JOSEPH M. HARRIS, B.A., Research Assistant JOANNE E. KUNDE, B.A., Research Assistant JOAN M. CEDERSTRAND. Research Assistant HAROLD E. WINTERS, Technical Assistant GEORGE R. JAMES, Technical Assistant FRANCES L. SCHEIDT, Technical Assistant
MINERAL ECONOMICS W. H. VOSKUIL, PH.D., Mineral Economist W. L. B u s c ~ , A.B., Assistant Mineral Economist ETHEL M. KING, Research Assistant
EDUCATIONAL EXTENSION GEORGE M. WILSON, M.S., Geologist and Head DOROTHY E. ROSE, B.S., Assistant Geologist
RESEARCH AFFILIATES I N GEOLOGY J HARLEN BRETZ, PII.D., University of Chicago JOHN A. BROPHY, M.S., Research Assistant, State Geologi-
cal Survey STANLEY E. HARRIS, JK., PH.D., Southern Illinois U n i -
versity C. LELAND HORBERG, PH.D., University of Chicago M. M. LEIGHTON, PH.D., D.SC., Research Professional
Scientist, State Geological Survey HEINZ A. LOWENSTAV, PH.D., California Institute of
Technology WILLIAM E. POWERS, PH.D., Northwestern University PAUL R. SHAFFER, PH.D., University of Illinois HAROLD R. WANLESS, PH.D., University of Illinois J. MARVIN WELLER, PH.D., University of Chicago
CONSULTANTS Geology: GEORGE W. WHITE, PH.D., University of Illinois
RALPH E. GRIM, PH.D., University of Illinois L. E. WORKMAN, M.S., Former Head, Subsurface
Division Ceramics: RALPH K. H u ~ s a , B.S., University of Illinois Mechanical Engineering: SEICHI KONZO, M.S., University of
Illinois
GENERAL ADMINISTRATION (not including part-time personnel)
LIBRARY OTHER TECHNICAL SERVICES ANNE E. KOVANDA, B.S., B.L.S., Librarian
MINERAL RESOURCE RECORDS VIVIAN GORDON, Head MARGARET B. BROPHY, B.A., Research Assistant SUE J . CUNNINGHAM, Technical Assistant BETTY CLARK. B.S.. Technical Assistant JEANINE CLIMER, Technical Assistant MARILYN W. THIES, B.S., Technical Assislant HANNAH FISHER, Technical Assistant LAROY PETERSON, Technical Assistant PATRICIA L. LUEDTKE, B.S., Technical Assislant KATHRYN BROWN, Technical Assistant
PUBLICATIONS BARBARA ZEIDERS, B.S., Associate Technical Editor MEREDITH M. CALKINS, Geologic Draftsman MARLENE PONSHOCK, Assistant Geologic Draftsman
TECHNICAL RECORDS BERENICE REED, Superui~ory Technical Assistant MARILYN DELAND, B.S., Technical Assislant MIRIAM HATCH, Technical Assistant
GENERAL SCIENTIFIC 1NFORMATION MARIAN L. WINGARD, Technical Assistant GENEVIEVE VAN HEYNINGEN, Technical Assistant
July 1, 1955
WM. DALE FARRIS, Research Associate BEULAH M. UNFER, Technical Assistant A. W. GOTSTEIN, Research Associate GLENN G. POOR, Research Associate* GILBERT L. TINBERG, Technical Assistant WAYNE W. NOFFTZ, Supervisory Technical Assistant DONOVAN M . WATKINS, Technical Assistant RUBY D. FRISON, Technical Assistant JILL B. CAHILL, Technical Assistant
FINANCIAL RECORDS VELDA A. MILLARD, I n Charge LEONA K. ERICKSON, Clerk-Typist I I I VIRGINIA C. SANDERSON, B.S., Clerk-Typist 1 1 IRMA E. SAMSON, Clerk-Typist I
CLERICAL SERVICES MARY CECIL Clerk-Stenographer 111 MARY M. S~LLIVAN, Clerk-Stenographer 111 LYLA NOFFTZ, Clerk-Stenographer I I LILLIAN WEAKLEY, Clerk-Stenographer I I BARBARA BARHAM, Clerk-Stenographer I IRENE BENSON, Clerk-Typist I MARY J . DE HAAN, Messenger-Clerk I
AUTOMOTIVE SERVICE GLENN G. POOR, I n Charge* ROBERT 0. ELLIS, Automotive Mechanic EVERETTE EDWARDS, Automotive Mechanic DAVID H . COOLEY, Automotive Mechanic's Helper
"Divided time

CONTENTS
. . . . . . . . . . . . Introduction Acknowledgments . . . . . . . . .
. . . . . . . . Equipment and materi a1 Equipment . . . . . . . . . . .
. . . . . . . . . . . . Test material . . . . . . . . . . . . . . Techniques
. . . . . . . . . . . . . Sampling . . . . . . . . . . . . . . Packing
. . . . . . . . . . . . . Particle size Galvanometer resistance . . . . . . . . .
. . . . . . . . . . . . Heating rate . . . . . . . . . . . Reference material
. . . . . . . . . . . . Theoretical aspects
. . . . . . . . . . . . Terminology . . . . . . . Concepts of coal carbonization
Processes occurring in the differential thermal furnace . . . . . . . Interpretation of thermograms
. . . . . . . . . Differential thermogram types . . . . . . . . . . . Importance of sampling
. . . . . . . . Effects of diluting the specimen . . . . . . . . . . . Effects of particle size . . . . . . . . . . . Effects of heating rate
. . . . . . . . Effects of galvanometer resistance . . . . . . . . . . Summary and conclusions
. . . . . . . . . . . . . . References
ILLUSTRATIONS
PAGE Differential thermal apparatus and recording equipment used in investigating experimental factors
. . . . Uninterrupted and interrupted thermograms showing terminology used in this report Thermograms showing the similarity of deflections obtained from coal and from bituminous shale
. . . . Thermogram types obtainable from one coal by manipulating experimental factors Summary of thermogram types showing the control exerted by the degree of packing. by geometry
. . . . . . . . . . . . of the specimen holder. and by covering the sample . . . . . . Thermograms showing variations resulting from heterogeneity of banded coal
. . . . . . . Thermograms showing the effects of diluting the specimen with alundum . . . . . . . . . . . . Thermograms showing the influence of coal particle size
. . . . . . . . . . . . . Thermograms showing the influence of heating rate . . . . . . Thermograms showing the influence of differences in galvanometer resistance
TABLE
1 . Summary of experimental factors applied to each analysis

SOME EXPERILMENTAL FACTORS THAT MODIFY
DIFFERENTIAE THERMOGRAMS OF BITUMINOUS COAL
K E N N E T H E. CLEGG
A B S T R A C T
Investigation of bituminous coal by an adaptation of differential thermal analysis in which the sample is covered and heated in the absence of free air shows that the resulting thermogram is strongly influenced by several experimental factors.
T h e coal undergoes thermal decomposition, and the thermogram reflects the predom- inantly endothermic chemical and physical reactions taking place. Peak shifting, change of peak height, variation of temperature range, and/or interruption of devolatilization occur when amounts of inert diluent in the specimen, maxlmum particle size, rate of temperature increase, manner of covering the specimen, manner of packing, or geometry of the specimen holder are varied.
Variation in thermograms from random samples of bright clarain selected from the same diamond drill core of coal shows the need for sampling techniques that will insure samples representative of the coal being tested.
A series of progressively altered thermogram types w a s obtained by manipulating one or more experimental factors. Curves fitting into this series were then produced by progressively altering one factor while keeping all others as nearly constant as possible. Any one thermogram type could be reproduced with reasonable accuracy only when all experimental factors and sampling techniques were duplicated.
T h e ultimate cause of variation in thermograms is shown to be related to the ease and manner in which decomposition gases escape from the sample, and to pressure de- veloped inside the specimen well.
T h e studies emphasize the need of care both in adopting and maintaining constant experimental conditions and in selecting and preparing the specimen when differential thermal analvsis of coal is conducted under conditions that restrain swelling of the sample - -
and expansion and escape of volatile matter.
I N T R O D U C T I O N
NALYSES OF COAL are essential to its A well-planned use, and various physical and chemical analytic procedures are used in the laboratory. Differential thermal anal- ysis is a relatively new method of evalua- ting certain characteristics of coal. Th i s re- port deals with factors that affect the results of differential thermal analysis of coal.
T h e influence of experimental factors on differential thermograms of clay minerals has been aptly demonstrated and discussed (Arens, 1951). However, the great diver- sity of results obtained by various workers who have applied differential thermal an- alysis to coal has indicated the need of a sim- ilar study of some of these factors and their relation to coal thermograms. T h e tests discussed in this report were designed to fill that need in part.
These studies have a twofold purpose. First, they were designed to determine to
what extent and in what manner differen- tial thermograms of coal are influenced by factors other than differences in the coal it- self. I n this respect they may be regarded as a progress report because factors other than those herein considered, and their re- sultant problems, require further investiga- tlon.
Second, the studies may be regarded as an initial attempt to evaluate the thermal tech- nique as i t applies to coal, and to determine what particular adaptations are most suit- able for coal analysis. T h e great variety of results obtained by various workers shows that some methods result in thermograms with much more detail than others. I t seems desirable, therefore, to determine which adaptations will yield thermograms with maximum interpretable detail and consist- ently good reproducibility.
T h e first differential thermal analysis of coal probably was made by Hollings and Cobb (1923), who heated their samples in

8 I L L I N O I S S 2 ' A T E GEOLOGICAL SURVEY
a nitrogen atmosphere and used coke as the reference material. V a r i ~ u s adaptations of the technique, such as heating in oxygen, in an inert gas, in air, in partial vacuum, un- der pressure, or with a cover over the assay, have more recently been used (Stott and Baker, 1953 ; Whitehead, 1950 ; Whitehead and Breger, 1950; Breger, 1950; Glass, 1954 ; and others).
I n the study reported here, oxidation was inhibited, but not completely prevented, by covering the specimen or packing it tightly in a deep sample well. T h e coal was there- by subjected to carbonization and distilla- tion. Laboratory studies of coal carboni- zation and distillation are not new, but the use of differential temperatures is a rela- tively new approach to analyzing carboni- zation reactions.
Except for the covering of the assay, the method is similar to that applied to clays and mixtures of coal and clay minerals by Grim and Rowland (1952). T h e assay covering, added to adapt the method to coal, was used by Glass (1954) in a study of coal rank.
G. H. Cady, Senior Geologist and Head, Emeritus, of the Coal Division of the Illi- nois State Geological Survey, supplied the coal used for test material in this study. H e also obtained the chemical analysis and made the profile measurements of banded ingredients.
T h e manuscript was critically read by 0. W. Rees, J. S. Machin, J. E. Lamar, J. A. Simon, A. C. Bevan, H. D. Glass, Ray- mond Siever, and J. A. Harrison of the Survey staff, and by C. E. Marshall, visit- ing research scientist from the Department of Geology and Geophysics, University of S ydnep, Sydney, Australia.
EQUIPMENT A N D M A T E R I A L
A Stone style B variable pressure differ- ential thermal analysis unit was used for the investigation. Minor adjustments were made so that the equipment could be used without employing pressure or controlled
atmosphere. T h e arrangement of the unit and recording equipment is shown in fig- ure 1.
A spherical pressure chamber with an inside diameter of 8 inches encloses the speci- men holder and heating unit. T h e upper half of the pressure sphere was not used.
T h e specimen holder used for most of the tests was a cylinder of inconel steel 1y2 inches in diameter supported vertically just below the center of the pressure sphere by two stainless steel rods. T w o y2-inch diam- eter wells for the sample and reference ma- terial are drilled 1 inch deep parallel to the length of the cylinder. A flat nickel plate 1/16 of an inch thick and large enough to cover both wells was used as a lid. T h e depth of the wells was adjusted by placing a t the bottom one or more ceramic disks 1 /10 of an inch thick. Th i s method admit- tedly is not absolutely equivalent to deeper or shallower wells because the disks are per- vious to gas and hence give a "cushioning" effect that would not normally be present. Also, the thermocouples were in effect brought 1/10 of an inch nearer the bottom of the wells for each disk inserted.
A few runs were made with nickel speci- men holders having the same outside diam- eter as the inconel but with smaller wells. T h e results obtained with them will be dis- cussed in relation to their thermograms.
A platinum-platinum 10 % rhodium fur- nace temperature thermocouple is located in the reference well. A double-junction dif- ference thermocouple, consisting of two platinum leads joined by a platinum 10 % rhodium wire, has one junction in the ref- erence well and the other in the specimen well. All thermocouple leads run to a small Dewar flask for cold junctions.
A cylindrical heating unit fits down over the sample holder. T h e inside is approxi- mately 3 inches in diameter and 2% inches deep, with a heating element of 12 coiled kanthal wires evenly spaced about the periphery and extending vertically through its length. T w o inches of refractory brick insulation surrounds the heating element. T h e entire assembly is covered with sheet aluminum with several turns of copper tub-

EQUIPMENT AND AfATEIPIAL 9
FIG. 1.-Differential thermal apparatus and recording equipment used in investigating experimental factors. A. upper half of pressure sphere; B. lower half of pressure sphere; C. heating unit, in place; D. control
panel of driving mechanism; E. galvanometer; I;. potentiometer; G. photopen recorder.
ing around the outside. Wa te r flowing through the tubing keeps the outside of the unit cool. T h e top is closed and the base fits closely upon a stand of refractory brick which surrounds the two rods supporting the specimen holder. T h e arrangement is thus designed to hold convection flow of air to a minimum.
T h e controlling mechanism is a variable- speed motor-controlled powerstat that per- mits a wide range of heating rates. Furnace temperatures are read directly on a Brown portable potentiometer. Differential tem- peratures are reflected by a suspension mir- ror galvanometer, and the thermogram is recorded directly by a Beckman photopen re- corder. Resistance in series with the galva- nometer can be varied from zero to 300 ohms in steps of 50 ohms.
A quartered section of a 2-inch diameter diamond drill core of high-volatile C bright- banded bituminous coal was used as a stand- ard test material. I ts ingredient content, de-
termined by megascopic measurement of a polished surface, was : vitrain,* 18.1 % ; fusain, 2.56 'j& ; bright clarain, 51.1 % ; dull clarain, 27.7 CTo ; pyrite, 0.5 % ; and other mineral matter, 0.1 %. Chemical analysis of the core "as received" was: moisture, 10 % ; volatile matter, 35.44% ; fixed carbon, 42.43 % ; sulfur, 3.28% ; ash, 12.13 % ; and Btu, 10,961. T h e Btu on a mineral-free basis is 12,688.
T h e core was collected a t the drilling site, wrapped in heavy waxed paper, and brought directly to the laboratory. There it was split in half lengthwise, and one half was again split lengthwise. T h e half core was polished for measurement of banded ingre- dients. One of the quarter sections was pre- pared for chemical analysis, and the one to be used in this study was put into a container with a tight-fitting lid. T o retard evapora- tion, a moist paper was placed in the con- tainer and, except when samples were being removed, the lid was kept in place. Ther -
"Only those bands of vitrdin 1 mm. o r thicker were assigned to the total l-itrnin content. Bands less t h a n I mrn. were included as a constituent of clarain.

10 ILLINOIS S T A T E GEOLOGICAL SURVEY
mograms produced periodically under iden- tical conditions throughout the 12-mon th period of investigation showed that any oxi- dation or weathering during that period was too minor to be reflected.
T E C H N I Q U E S
Sampling was first attempted by selecting narrow-banded bright clarain for each run. Variations in thermograms, however, indi- cated that consistently uniform specimens could not be selected by this method. T o avoid this variability (believed to result from the heterogeneity of banded coal), enough bright-banded clarain was taken for all runs needed to test any one experimental factor. Th i s was crushed and sieved to 10 by 28 mesh size and the fines discarded. T h e coarse fraction was kept in a screw-cap bottle from which samples were taken as required for each run and crushed to a finer size (normally to minus 100 mesh). Th i s method assured that samples for all curves of a particular experimental factor were sufficiently uniform.
Final grinding, done immediately before each test, restored fresh particle surfaces so that the effect of any oxidation taking place during the one or two days required for all tests of one experimental factor was consid,- ered negligible. T h e fact that the samples were not representative of the whole coal core was of small consequence because the tests were designed to study experimental factors related to coal rather than coal it- self.
Methods of packing the specimen are designated as loose, medium, and tight. Loose packing was accomplished by pouring the material into the sample well until it was filled and a small cone, its base Hush with the top, had formed. T h e sample holder was then tapped lightly until settling had rounded off the top of the cone xt the level of the well rim. T o o much tapping caused excessive settling, but with proper care reproduction of thermograms was good and considered to be well within normal
limits of accuracy for the methods and equipment used.
Fo r medium packing, the sample well was filled as above, but tapping and refilling were continued until the material would settle no more. A steel plunger, 3 inches long and weighing about $3 grams, was then placed lightly on top of the material and immediately lifted off. Enough material was added to refill the well, and application of the plunger was repeated. Th i s proce- dure was continued until the well remained full under the weight of the plunger. Of the three packing methods used, this one af- forded the least accurate reproduction of thermograms.
A specimen was tightly packed by filling the well and pressing the material down as firmly as possible with the steel plunger. Filling and pressing were repeated until the well remained filled to the top. Th i s method gave reasonably good reproducibility of thermograms.
Although most runs were made with a full well, several analyses were made with a %-inch air space left between the speci- men and the cover. T h e resulting thermo- grams did not differ greatly from those ob- tained by using a shallower specimen well
(fig. 5 ) .
Except when the effect of maximum par- ticle-size differences was tested, all analyses were made with the coal crushed to minus 100 mesh. Grinding and crushing was done with mortar and pestle, with frequent siev- i n g ~ made to avoid an excess of very small sizes in the assay.
A resistance of 50 ohms was used in se- ries with the galvanometer for all except one set of tests. Fo r those made to show the effect of variation on peak height, re- sistance was varied.
T h e standard rate of heating was about 10' C. per minute. Corrections for slight irregularities in the rate were not made when the original thermograms were re-

T H E O R E T I C A L A S P E C T S
Main volatiles endotherm
P o i n t of in te r rup t ion I
B I n t e r r u p t i o n in fe rva l -
FIG. 2.-Uninterrupted (A) and interrupted (B) thermograms showing terminology used in this report.
produced for printing. The degree of ir- regularity may thus be observed and taken into consideration when the thermograms are studied.
Alundum (aluminum oxide calcined to 1250" C.) was used as the inert reference material and also as a diluent when diluter1 samples were analyzed.
T H E O R E T I C A L A S P E C T S
I n this report, the large endotherm that reaches its apex between 450" and 500' C. will be called the main volatiles endotherm. I t may occur in uninterrupted or intermpted form (fig. 2 ) . T h e interrupted endotherm is characterized by a point of interruption, an interruption interval, and a point of re- turn (fig. 2B). Interruption intervals may vary greatly in width, i.e., horizontal dimen- sion. A narrow interruption interval may involve a time lapse of about 5 minutes and a temperature range of about 50' C., whereas a wide interval may require from 45 to 50 minutes and an increase of 450" to 460' C. No cognizance will be taken of
the vertical dimension of the re-entrant, that being a function of peak height of the main volatiles endotherm.
A series of thermogram types consists of a number of thermograms grading irorn those with small uninterrupted endotherms, through those with increasing peak height to the interrupted type with narrow inter- ruption intervals, and thence through the relatively complex types having increasingly wider intervals. Figure 7 shows two well- developed series of thermogram types. Th i s development from simple to comparatively complex types can be obtained by varying several experimental factors, or by progres- sively altering only one while all others re- main constant.
Detailed consideration of the theoretical aspects of the differential thermograms is not the purpose of this report. However, recognition of the general nature of proc- esses involved during distillation and car- bonization of coal in the absence of air, or in limited air, is necessary for an under- standing of why the thermograms react as they do to experimental factors.
These processes were briefly summarized
12 ILLINOIS S T A T E GEOLOGICAL SURVEY
by Stutzer and Noe (1940) as: loss of water up to 100" C., evolution of CO, and H,S up to about 330" C., and of CH,, H,, and NH, up to about 800" C., and release of H, for the most part above that tempera- ture. Low temperature tar was referred to as "primary tar," and the process of its for- mation as "low temperature carbonization."
Katwinkle ( in National Research Coun- cil, 1945, p. 172-173) observed the forma- tion of light oil and gas after exclusion of moisture. A t higher temperatures, as the coal began to soften, decomposition products were mainly brown and black primarv tar. T a r evolution subsided during the suften- ing range and, as swelling progressed, the volatiles consisted only of gas. Gas evolu- tion was strongest in the latter part of the softening range, it decreased rapidly there- after through resolidification, and then re- mained constant or rose slightly in the semi- coke zone. I n low-rank noncaking coals, gas evolution was greatest before softening tem- peratures were reached.
Sweitoslawski ( 1942, p. lO3-lO5), in dis- cussing the amount of energy absorbed dur- ing the coking process, divided the exchange into three stages corresponding to the three stages of carbonization.
I n the first stage, heat is required to raise the temperature of the coal from the start- ing point to the softening temperature. T h e main quantity of heat is absorbed by evapo- ration of water in the coal.
I n the second stage, the melting and heat- ing of the coal to its resolidification temper- ature takes place. Hea t is absorbed in the melting process and in thermal decomposi- tion.
I n the third stage, the transformation of semicoke into coke occurs during which, in addition to the heat required for heating the material, relatively large amounts of heat are required for some of the endothermic re- actions that take place during this period. T h e main reactions are: ( I ) reduction of CO, to CO ; ( 2 ) reduction of water with formation of H, and C O ; and ( 3 ) decom- position of methane and other hydrocar- bons, with the formation of H, and some unsaturated hydrocarbons. Presumably the CO, referred to in the first step is that re-
sulting from the presence of air in the coal charge, and the water in the second step is chemically bound water.
Sweitoslawski recognized that almost all of these later reactions are typically rever- sible processes that can reach a state of equi- librium under optimum conditions. How- ever, he pointed out two factors usually present to prevent establishment of equilib- riums : ( 1 ) the time is too short, and (2 ) the quantities of reacting gases are very small in comparison to the quantities of the solid phase. T h e surface of the solid phase is inhomogeneous, and therefore the gases re- act only with those areas that are character- ized by the presence of more active atoms.
T h e processes taking place in the differ- ential thermal furnace, as adapted for this investigation, are mainly endothermic. T h e heating rate is too fast for the establishment of equilibriums in the reversible reactions a t higher temperatures. T h e thermograms ap- pear to reflect two opposing forces, endo- thermic and exothermic, with the exother- mic tendencies shown by the minor deflec- tions that develop upon the larger endo- therms. Some of the smaller deflections within the interruption interval of the more complex thermograms may be especially likely to reflect exothermic tendencies. T h e wider interruption intervals are a result of the inability of early formed decomposition products to escape from the sample, leaving them available for further reactions a t higher temperatures.
T h e solid residue left in the sample well after the heating of coal to various tempera- tures yields information pertinent to an un- derstanding of the thermograms. A t 300° C. no visible change in the appearance of the coal could be detected, but gas evolution was already underway and was reflected by downward sweep of the thermogram. Above 400" to 4-20" C., immediately prior to the point of interruption of the main volatiles endotherm, slight evidence of softening was shown by the rounding of some coal parti- cles. Cohesion was weak and the residue crumbled under slight pressure. T h e top

T H E O R E T I C A L ASPECTS 13
and sides of the specimen holder were cov- ered with a thick deposit of soot or carbon. Above 450" C., immediately following up- ward movement from the point of interrup- tion, little or no further change in the coal was visibly detectable. A t the point of re- turn from a narrow interruption interval, however, the coal had reached its resolidifi- cation temperature. Cohesion of coal par- ticles was considerably better than a t 450' C. T h e soot deposit had begun to disap- pear, and a t a still higher temperature had disappeared entirely. A thin film of ash usually covered part of the surface of the assay when the temperature went above 650" to 700' C. T h e significance of oxi- dation will be briefly considered later in this report.
Residue formed during heating under conditions that gave a wide interruption in- terval showed that vesiculation was not complete a t 500' to 550' C. if endothermic downsweep to the point of return had not been completed. Better cohesion of coal par- ticles resulted than when the interruption interval was narrow.
T h e residue of samples giving uninter- rupted endotherms appeared to have under- gone about the same degree of physical change a t comparable temperatures as those of samples that produced curves with nar- row interruption intervals, but cohesion of particles appeared to be somewhat weaker.
Major features of the differential ther- mograms shown in this report were inter- preted on the basis of the above observations and those of other workers who have stud- ied coal carbonization and distillation un- der many kinds of experimental conditions.
T h e first major endotherm is the result of loss of moisture. T h e temperature a t which it reaches its apex reflects nonequi- librium conditions. These conditions pre- vail throughout the entire heating range.
Exothermic reaction is thought to follow water loss. Upward deflection of the ther- mogram is more pronounced when samples are loosely packed or run in comparatively shallow specimen wells. During the short interval between the end of moisture loss
and the start of volatiles escape, a small amount of air, unhindered by outflowing gas, may enter the specimen well and en- hance oxidation.
T h e main volatiles endotherm, which us- ually begins to develop a t around 300' C., reflects evolution of volatile matter. T h e size and shape of the endotherm, however, is controlled not only by the formation of gas but also by the ease and manner of its escape from the sample. Endothermic cool- ing is a function of the escape of those mole- cules of greater thermal energy from the rest of the comparatively cooler sample. I f this escape is delayed until higher tempera- ture is reached, devolatilization proceeds a t an accelerated rate and the endotherm is steeper and has greater peak height.
I f , however, a t or near the time of maxi- mum gas escape, and when endothermic cooling of the sample is most pronounced, a factor suddenly stops or greatly retards the process, a condition of considerable thermal unbalance exists with no cooling process to support it. T h e establishment of such a condition appears to initiate interruption in- tervals.
Davidson ( i n IbTational Research Coun- cil, 1945, p. 21 1 ) observed, while using an adaption of the Foxwell apparatus, which involved heating coal in a tube through which a stream of inert nitrogen flowed, that resistance during the plastic stage was sometimes so great that it caused complete stoppage and even reversal of the nitrogen stream. T h e tube became choked as the softening and swelling coal and coal tars sealed the interstitial space between coal par- ticles.
T h e adherence of coal particles in the specimen well of the differential thermal ap- paratus showed that, a t the temperature of interruption of the main volatiles endo- therm, primary tars and tar mists had formed a seal sufficient to stop temporarily the passage of decomposition gas through the interstices. Th i s is believed to be the cause of temporary stoppage of gas escape a t a time of considerable thermal unbalance, and of initiation of the interruption interval.
A second factor that contributes to the development of interrupted endotherms is
14 ILLINOIS S T A T E GEOLOGICAL SURVEY
heat transfer through the massive sample holder. Absorbed heat tends to disperse equally throughout a medium until uniform- ity is attained. Coal is a good heat absorber but a poor heat conductor. T h e metal of the specimen holder, on the other hand, is an excellent conductor. T h e thermal con- ductivity of inconel is about .036, consider- ably greater than that of coal.
T h e effects of this difference in thermal properties are reflected by a temperature re- versal a t the beginning of the interruption interval. Immediately following the point of interruption of the main volatiles endo- therm, and as the line is returning upwards, the temperature indicator of the potentiom- eter comes to a stop and then reverses its direction. O n curves 159, 162, and 163 of figure 6, two ticks denoting temperatures of 450" C. have been placed. These are fur- nace temperatures recorded as the indicator reached 450' C., reversed temporarily, and a few moments later again advanced. A loss of as much as 15' to 20' C. has been ob- served, but 10' to 15' C. is more normal. Th i s phenomenon was not observed with un- interrupted endotherms. I t shows that ad- jacent to the furnace thermocouple in the reference material heat is being lost a t a faster rate than it is being replaced by the furnace.
Th i s temperature reversal occurs when endothermic cooling has exerted its masi- mum effect upon the coal sample. I t is con- cluded, therefore, that furnace heat is flow- ing from the hotter areas of the specimen holder towards the comparatively cooler and highly absorptive coal. If heat is flowing from the vicinity of the furnace thermo- couple in the reference material and towards the coal, it must also affect the differential thermocouples by counteracting the tem- perature relationship previously established by endothermic reaction.
T o summarize, the interruption interval is a result of the combination of two proc- esses : ( 1 ) sealing of interstitial particle space temporarily interrupting gas escape a t a time of excessive thermal unbalance; (2 ) transfer of furnace heat from the area of the differential thermocouple in the refer- ence material to the one in the sample. T h e
results are reflected on the thermogram by sudden stop of endothermic downsweep, im- ~nediately followed by rapid upward return as thermal balance is established between the two thermocouples. Because the heat in- volved is not heat of reaction, the re-entrant is not an exotherm.
T h e duration of the interruption and the width of the interruption interval depend upon resistance to pressure developed inside the specimen well. If the coal is one that becomes highly fluid during the plastic stage, gas pressure may soon become suffi- cient to induce vesiculation. Gas escape is then renewed suddenly and a t an accelerated rate; the coal vesiculates and then resolidi- fies into semicoke. A sudden downsweep to the point of return on the thermogram re- flects the process. If the furnace is opened a t the time of the point of return, a vesicu- lar residue is found in the sample well. If the coal is more viscous during plasticity, o r if artificial conditions impose greater resist- ance to expansion, vesiculation and accom- panying downsweep to the point of return proceed more slowly and are not completed until more time has elapsed and higher tem- perature is reached.
Complete fluidity is not necessary to cause interruption of gas escape from the specimen well. A bituminous shale, such as the Chat- tanooga, does not become completely plas- tic. However, the main volatiles endotherm can be interrupted by the formation of tars and liquid hydrocarbons and controlled by the same experimental factors that control it in a coal sample (fig. 3 ) . A sample of cellulose, obtained by scraping the surface of filter paper, reacts the same way when the cotton-like material is packed into a deep specimen well. Unless it is tightly packed, however, an uninterrupted endotherm re- sults.
I n curves 173 and 174 (fig. 7 ) , opposing forces (expansion and resistance thereto) are so nearly balanced that the endother~n may or may not be interrupted. Identical samples and experimental conditiorls were used for both curves. A similar balance has been attained by manipulation of other ex- perimental factors, and in each case the in- terruption could be controlled by incrws-

THEORETICAL ASPECTS 15
Medium Pack
Medium Pack
FIG. 3.-Thermograms showing the similarity of deflections obtained from coal and from bituminous
shale.
ing or decreasing the effects of the particular factor involved. I n the case illustrated In figure 7, a little less than 56.25 percent coal in the sample always produced an uninter- rupted endotherm ; slightly more than 56.25 percent coal always resulted in an inter- rupted one. If the balance is obtained by packing, looser packing inhibits and tighter packing enhances interruption. If heating rate is the controlling factor, an increase tends towards and a decrease tends away from interruption. If geometry of the speci- men well is involved, a sufficiently shallow well eliminates and a sufficiently deep well produces the interruption. Whatever the factor, when conditions are imposed that tend to delay or temporarily stop free escape of decomposition gases from the sample as they form, the result is reflected on the ther- mogram, first by increased peak height and then by interruption of the main volatiles endotherm. I n each case, the interval can be widened by continued increase of the influencing factor.
Careful consideration was given to the possibility that exothermic reaction might be responsible for the interruption interval,
but there is no supporting evidence for such an interpretation. T h e interval can not be explained by burning of gas within the sam- ple well because the very conditions that should enhance burning-looser packing, shallower sample wells, or even uncovered samples-are those that inhibit interrup- tion of the endotherm. When the furnace is opened immediately following upsweep from the point of interruption, the space outside the specimen wells is filled with gas in contact with the heating elements of the furnace. If burning does not take place here, where the gas is mixed with compara- tively free air and where it is in contact with the hot kanthal wires, it is not likely to occur inside the sample well where the air supply is much more limited and tem- perature is several degrees lower.
Neither can the interruption be attrib- uted to a difference in the content of the coal. I n the instance demonstrated by curves 173 and 174 (fig. 7 ) , where the same sample and experimental factors were involved, it is difficult to conceive that any substance might be present in one assay in quantity sufficient to produce such a large upward deflection and not be present in the next assay in quantity a t least sufficient to produce some incipient deflection.
Hydrogenation also is ruled out as an eu- planation of the interruption interval be- cause the temperature is still too low for breakdown of hydrocarbons and release of free hydrogen in significant quantities. Nor does it seem likely that any exothermic re- action could be made to vary to such ex- tremes of time and temperature range as are reflected by the interruption interval. T h e shape of the re-entrant and the fact that its upward extent is always delimited to about the same relative position on the thermogram do not conform to the normal trends of exotherms.
T h e reversal of rise in furnace tempera- ture cannot be related to exothermic reac- tion. Instead, it offers strong argument against an exothermic interpretation. T h e manner in which the thermogram responds to manipulation of factors that control gas escape supports the conclusion that it is not an expression of exothermic reaction.
16 ILLINOIS STATE GEOLOGICAL SURVEY
D I F F E R E N T I A L T H E R M O G R A M T Y P E S
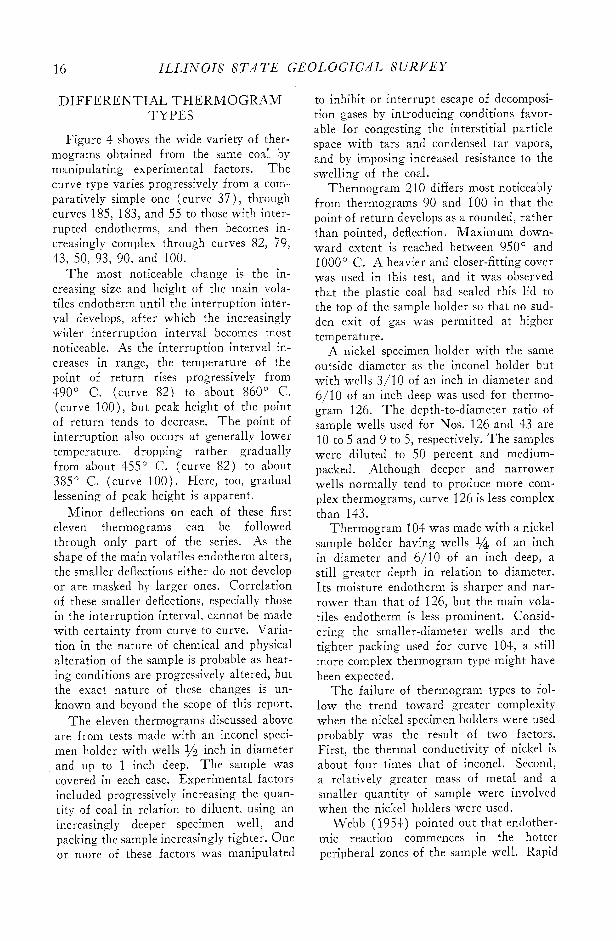
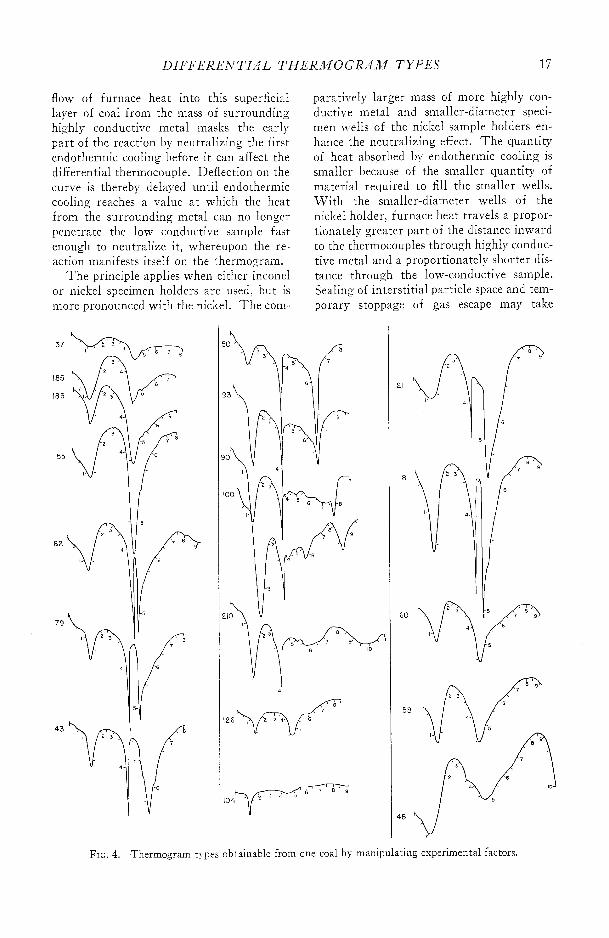
Figure 4 shows the wide variety of ther- mograms obtained from the same coal by manipulating experimental factors. T h e curve type varies progressively from a com- paratively simple one (curve 3 7 ) , through curves 185, 183, and 55 to those with inter- rupted endotherms, and then becomes in- creasingly complex through curves 82, 79, 43, 50, 93, 90, and 100.
T h e most noticeable change is the in- creasing size and height of the main vola- tiles endotherm until the interruption inter- val develops, after which the increasingly wider interruption interval becomes most noticeable. As the interruption interval in- creases in range, the temperature of the point of return rises progressively from 490' C. (curve 82 ) to about 860' C. (curve l o o ) , but peak height of the point of return tends to decrease. T h e point of interruption also occurs a t generally lower temperature, dropping rather gradually from about 455" C. (curve 82 ) to about 385" C. (curve 100). Here, too, gradual lessening of peak height is apparent.
Minor deflections on each of these first eleven thermograms can be followed through only part of the series. As the shape of the main volatiles endotherm alters, the smaller deflections either do not develop or are masked by larger ones. Correlation of these smaller deflections, especially those in the interruption interval, cannst be made with certainty from curve to curve. Varia- tion in the nature of chemical and physical alteration of the sample is probable as hear- ing conditions are progressively altered, but the exact nature of these changes is un- known and beyond the scope of this report.
T h e eleven thermograms discussed above are from tests made with an inconel speci- men holder with wells v2 inch in diameter and up to 1 inch deep. T h e sample was covered in each case. Experimental factors included progressively increasing the quan- tity of coal in relation to diluent, using an increasingly deeper specimen well, and packing the sample increasingly tighter. One or more of these factors was manipulated
to inhibit or interrupt escape of decomposi- tion gases by introducing conditions favor- able for congesting the interstitial particle space with tars and condensed tar vapors, and by imposing increased resistance to the swelling of the coal.
Thermogram 2 10 differs most noticeably from thermograms 90 and 100 in that the point of return develops as a rounded, rather than pointed, deflection. Maximum down- ward extent is reached between 950" and 1000" C. A heavier and closer-fitting cover was used in this test, and it was observed that the plastic coal had sealed this lid to the top of the sample holder so that no sud- den exit of gas was permitted a t higher temperature.
A nickel specimen holder with the same outside diameter as the inconel holder but with wells 3/10 of an inch in diameter and 6/10 of an inch deep was used for thermo- gram 126. T h e depth-to-diameter ratio of sample wells used for Nos. 126 and 43 are 10 to 5 and 9 to 5, respectively. T h e samples were diluted to 50 percent and medium- packed. Although deeper and narrower wells normally tend to produce more com- plex thermograms, curve 126 is less complex than 143.
Thermograrn 101 was made with a nickel sample holder having wells 1/4! of an inch in diameter and 6/10 of an inch deep, a still greater depth in relation to diameter. I ts moisture endotherm is sharper and nar- rower than that of 126, but the main vola- tiles endotherm is less prominent. Consid- ering the smaller-diameter wells and the tighter packing used for curve 104, a still more complex thermogram type might have been expected.
T h e failure of thermogram types to fol- low the trend toward greater complexity when the nickel specimen holders were used probably was the result of two factors. First, the thermal conductivity of nickel is about four times that of inconel. Second, a relatively greater mass of metal and a smaller quantity of sample were involved when the nickel holders were used.
Webb (1954) pointed out that endother- mic reaction commences in the hotter peripheral zones of the sample well. Rapid
D I F F E R E N T I A L THERMO GRAM T Y P E S 17
flow of furnace heat into this superficial layer of coal from the mass of surrounding highly conductive metal masks the early part of the reaction by neutralizing the first endothermic cooling before it can affect the differential thermocouple. Deflection on the curve is thereby delayed until endothermic cooling reaches a value a t which the heat from the surrounding metal can no longer penetrate the low conductive sample fast enough to neutralize it, whereupon the re- action manifests itself on the thermogram.
T h e principle applies when either inconel or nickel specimen holders are used, but is more pronounced with the nickel. T h e com-
paratively larger mass of more highly con- ductive metal and smaller-diameter speci- men wells of the nickel sample holders en- hance the neutralizing effect. T h e quantity of heat absorbed by endothermic cooling is smaller because of the smaller quantity of material required to fill the smaller wells. W i t h the smaller-diameter wells of the nickel holder, furnace heat travels a propor- tionately greater part of the distance inward to the thermocouples through highly conduc- tive metal and a proportionately shorter dis- tance through the low-conductive sample. Sealing of interstitial particle space and tem- porary stoppage of gas escape may take
FIG. 4.-Thermogram types obtainable from one coal by manipulating experimental factors.

18 ILLINOIS S T A T E GEOLOGICAL SURVEY
place more readily than in the %-inch di- ameter well of the inconel specimen holder, but the blanketing influence of surrounding furnace heat maintains a closer thermal bal- ance between the differential thermocouples and thereby tends to reduce the deflection on the thermogram.
Heating rate increased when the nickel holders were used, even though the same furnace-control settings were used as for the inconel. Th i s increase is attributed to the difference in conductivity of the two metals and to the greater proportion of the distance that furnace heat travels through metal when smaller-diameter wells are used.
Additional tests were made with the two nickel specimen holders but the results were generally unsatisfactory, and nickel was abandoned in favor of inconel. No tests were made with nickel holders having well diameters of v2 inch, or with a smaller mass of metal, hence these results do not imply that nickel is an unsatisfactory material to use for sample holders.
T h e right-hand row of thermograms of figure 4 are of tests made with the inconel holder with no cover over the specimen. Be- cause of its wider interruption interval, curve 21 is considered more complex than curve 18. Actually, however, the sample for curve 21 was medium-packed while that for curve 18 was tightly packed, and the sample-well dimensions were the same in both cases. Although the two curves xp- pear contrary to the expected trend, they were selected to emphasize the difficulty of controlling uncovered samples.
Thermograms 60, 58, and 48 are of bright clarain heated in a sample well v2 inch in diameter and 9/10 of an inch deep. T h e influencing factor probably was pack- ing, which was tight for curve 60, medium for curve 58, and loose for curve 48. Pro- gressively increasing exothermic tendeilcy is apparent as the degree of packing is d imin- ished. T h e increase of exothermic trend be- fore the start of the main volatiles enclo- therm is believed to be due to oxidation re- sulting from the entrance of air into the greater interstitial particle space allowed by looser packing. Above 160' C., and after volatiles evolution has passed its maximum,
the temperature is high enough for burning. T h e rate of burning increases as the degree of packing is diminished and is reflected by the increasingly pronounced exothermic trend above the main volatiles endotherm. A t the end of the test of curve 48, only a powdered ash residue was left in the speci- men well.
These five thermograms show that burn- ing to completion can be prevented, even when no cover is used, if the sample well is deep enough or if the sample is tightly packed. Burning commences a t the top of the specimen and proceeds downward. If conditions are present to retard its progress it does not extend down to the differential thermocouple, but heat of oxidation no doubt affects the differential thermocouple even though actual burning is above it.
I n general, it was observed that with the specimen uncovered experimental factors exerted less influence and, except where con- ditions were such that complete burning could take place freely, accurate reproduc- tion of thermograms was almost impossible.
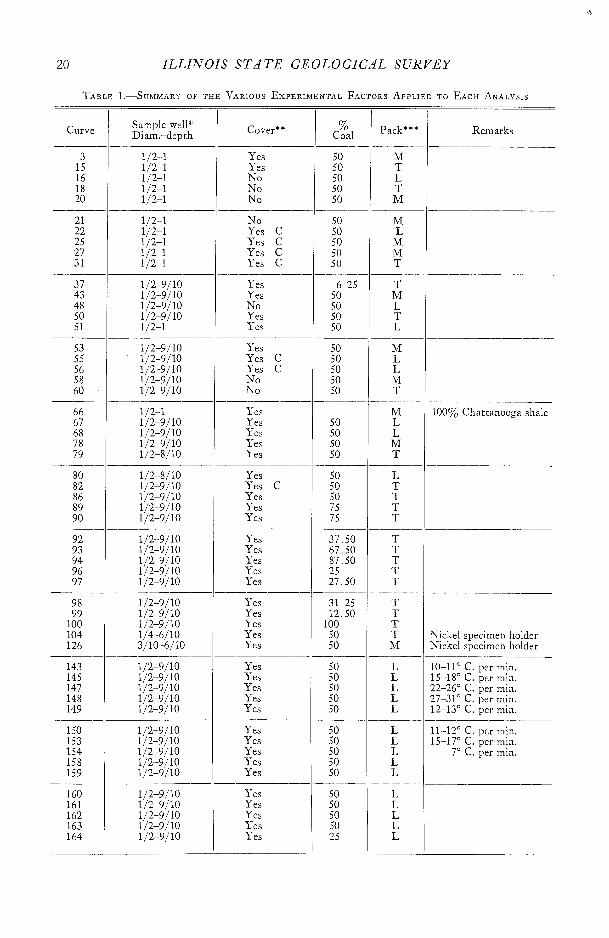
Figure 5 summarizes the effects exerted by variation of sample-well dimensions, de- gree of packing, leaving a %-inch cushion of air between the top of the specimen and the cover, and heating with no cover. All samples consisted of bright clarain diluted with 50 percent alundum. Table 1 gives other experimental data involved. Each thermogram is considered as the most rep- resentative type occurring under the par- ticular experimental conditions. Progres- sive development of curve type results as any one factor is increased or decreased while all others are kept constant.
IMPORTANCE OF S A M P L I N G
T h e necessity for careful sampling in making accurate analyses cannot be overem- phasized. T h e chemical and physical dif- ferences of individual ingredients of banded bituminous coal have long been recognized, and the importance of selecting representa- tive samples is fully appreciated by all who work with coal.
All curves shown in figures 4 and 5, and discussed in the preceding pages, were made

IMPORTANCE OE SAMPLING
DIMENSIONS OF SPECIMEN W E L L
+" DIA. x I " DEEP h
- EEP
FIG. 5.-Summary of thermogram types showing the control exerted by the degree of packing, by geometry of the specimen holder, and by covering the sample.
2 0 ILLINOIS S T A T E GEOLOGICAL SURVEY
T'ABLE 1.-SUMMARY OF THE VARIOUS EXPERIMENTAL FACTORS APPLIED TO EACH ANALYSIS
Remarks Sample well* Diam.-depth
% Coal Curve
Yes Yes No No No
No Yes C Yes C Yes C Yes C
Yes Yes No Yes Yes
Yes Yes C Yes C No No
Yes Yes Yes Yes Yes
100% Chattanooga shale
Yes Yes C Yes Yes Yes
Yes Yes Yes Yes Yes
Yes Yes Yes Yes Yes
Nickel specimen holder Nickel specimen holder
Yes Yes Yes Yes Yes
10-1 1" C. per min. 15-18" C. per min. 22-26" C. per min. 27-31" C. per min. 12-13" C. per min.
11-12" C. per min. 15-17" C. per min.
7" C. per min.
Yes Yes Yes Yes Yes
Yes Yes Yes Yes Yes
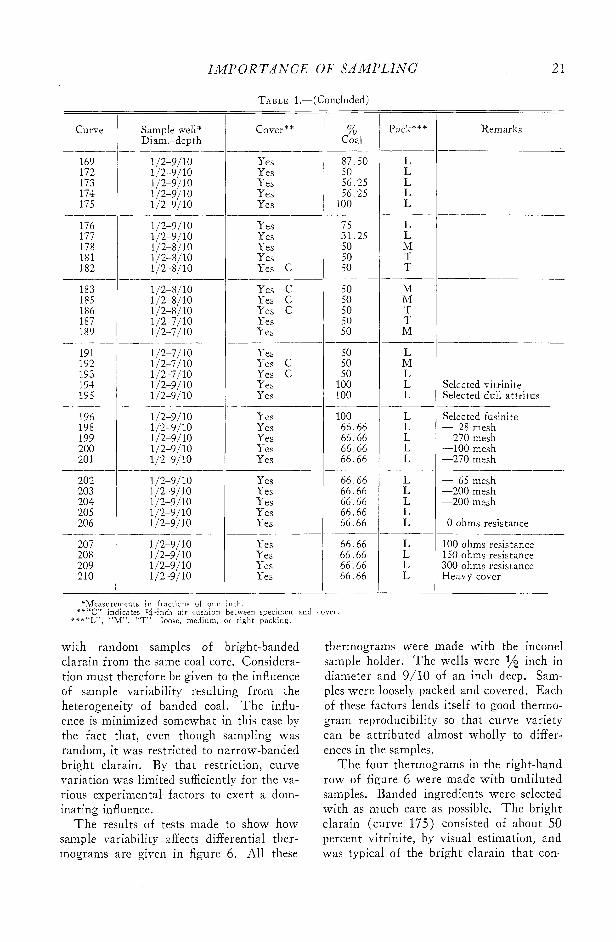
IMPORTANCE OF SAMPLIR7G
Remarks % Coal
Curve
----- 169 172 173 174 175
---- 176 177 178 18 1 182
Sample well* Diam.-depth
Yes Yes Yes Yes Yes
Yes Yes Yes Yes Yes C
Yes C Yes C Yes C Yes Yes
Yes Yes C Yes C Yes Yes
Selected vitrinite Selected dull attritus
Yes Yes Yes Yes Yes
Selected fusinite - 28 mesh -270 mesh -100 mesh -270 mesh
Yes Yes Yes Yes Yes
- 65 mesh -200 mesh -200 mesh
0 ohms resistance
Yes Yes Yes Yes
-
100 ohms resistance 150 ohms resistance 300 ohms resistance Heavy cover
"Measurements i n fractions of one inch. **"C" indicates 14-inch air cushion between suecimen and cover.
n**'cI,", "M", "T';-loose, medium, or tight ;ackirig.
with random samples of bright-banded clarain from the same coal core. Considera- tion must therefore be given to the influence of sample variability resulting from the heterogeneity of banded coal. T h e influ- ence is minimized somewhat in this case by the fact that, even though sampling was random, it was restricted to narrow-banded bright clarain. By that restriction, curve variation was limited sufficiently for the va- rious experimental factors to exert a dom- inating influence.
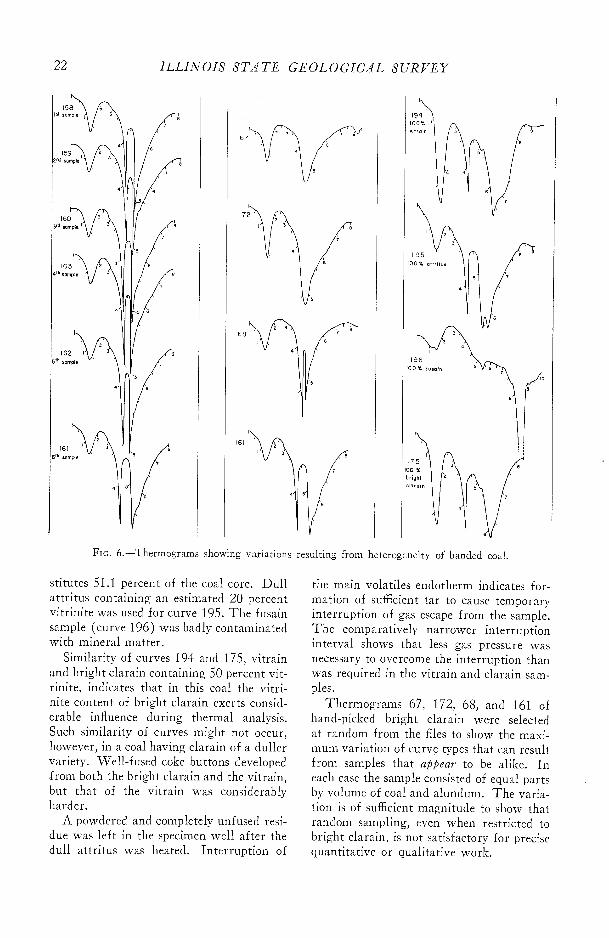
T h e results of tests made to show how sample variability affects differential ther- mograms are given in figure 6. All these
thermograms were made with the inconel sample holder. T h e wells were inch in diameter and 9/10 of an inch deep. Sam- ples were loosely packed and covered. Each of these factors lends itself to good thermo- gram reproducibility so that curve variety can be attributed almost wholly to differ- ences in the samples.
T h e four thermograms in the right-hand row of figure 6 were made with undiluted samples. Banded ingredients were selected with as much care as possible. T h e bright clarain (curve 175) consisted of about 50 percent vitrinite, by visual estimation, and was typical of the bright clarain that con-
22 I L L I N O I S S T A T E G E O L O G I C A L SURVEY
FIG. 6.-Thermograms showing variations resulting from heterogeneity of banded coal.
stitutes 51.1 percent of the coal core. Dul l attri tus containing an estimated 20 percent vitrinite was used for curve 195. T h e fusain sample (curve 196) was badly contaminated with mineral matter.
Similarity of curves 191 and 175, vitrain and bright clarain containing 50 percent vit- rinite, indicates that in this coal the vitri- nite content of bright clarain exerts consid- erable influence during thermal analysis. Such similarity of curves might not occur, however, in a coal having clarain of a duller variety. Well-fused coke buttons developed -from both the bright clarain and the vitrain, but that of the vitrain was considerably harder.
A powdered and completely unfused resi- due was left in the specimen well after the dull attritus was heated. Interruption of
the main volatiles endotherm indicates for- mation of sufficient tar to cause temporary interruption of gas escape from the sample. T h e comparatively narrower interruption interval shows that less gas pressure was necessary to overcome the interruption than was required in the vitrain and clarain sam- ples.
Thermograms 67, 172, 68, and 161 of hand-picked bright clarain were selected a t random from the files to show the maxi- mum variation of curve types that can result from samples that appear to be alike. I n each case the sample consisted of equal parts by volume of coal and alundum. T h e varia- tion is of sufficient magnitude to show that random sampling, even when restricted to bright clarain, is not satisfactory for precise quantitative or qualitative work.

EFFECTS OF DILUTING T H E SPECIMEAT 2 3
T h e series of thermograms in the left- hand row of figure 6 are of a test designed to check a possible variable resulting from the final grinding of a sample preparatory to analysis. I t was suspected that if a cpm- tity of coal was ground and sieved only until enough minus 100 mesh was obtained for the analysis, the plus 100 mesh remain- ing on the screen might not have the same composition as that which had crushed more readily. Therefore, enough 10 by 25 mesh bright clarain was prepared to make six anal- yses. T h e entire amount was then put into the mortar and ground until enough minus 100 mesh was obtained for the first run. Th i s sample was set aside and the grinding continued until enough minus 100 mesh was obtained for the second test. T h e process was continued until six samples of minus 100 mesh size had been prepared. T h e sample for the sixth consisted of the last material, supposedly the most resistant, to pass through the minus 100 mesh sieve.
Comparison of the thermograms indi- cates that, with the possible exception of the sixth sample (curve 16 1 ) , which has a somewhat broader interruption interval, no great difference existed in the individual samples. T h e variability of the first five curves is well within the limits of accuracy of methods and equipment used.
I t is nevertheless recommended that when a sample is to be crushed, the entire quantity be ground to the desired size and enough to fill the sample well be taken from the whole. If undiluted samples had been used, a greater difference might have resulted.
E F F E C T S OF D I L U T I N G THE S P E C I M E N
Diluted samples were used in most cases because of difficulty encountered in remov- ing the fused residue of undiluted coal with- out damaging the thermocouple. T h e ef- fects of varying amounts of an inert diluent were checked under both loose and tight packing conditions (fig. 7 ) . A specimen well v2 inch in diameter and 9/10 of an inch deep with a cover over the sample was used. A bulk sample of 10 by 28 mesh
bright clarain, from which amounts were taken and prepared for individual analyses, was used for all the loosely packed runs. T h e same method of sampling was used for the tightly packed tests. Thus, uniform samples were used for all curves under each condition of analysis, but the same bulk sax:- ple was not used for both the loosely paclied and tightly packed analyses.
A well-developed series of curve types rc- sulted with tightly packed samples. T h e series is equally well developed with loose packing but is not as complete, the masi- mum temperature of the point of return be- ing about 610" C. as compared to 860' C. with tight packing.
Diluting may be advantageous for rea- sons other than ease of removing the residue. W h e n the height and steepness of the main volatiles endotherm are reduced, smaller de- flections that tend to be masked by long, sweeping curves may appear to better ad- vantage. O n the whole, more accurate re- production was possible when samples were diluted and loosely packed. A loosely packed specimen of not more than 50 percent coal appeared to give the best reproducibility with the methods and equipment used in this study. The re are indications, however, that tight packing produces thermograms with greater detail and on which individual deflections can better be differentiated frorn each other.
If alundum is used as the reference ma- terial, diluting the coal with the same ma- terial serves to lessen the differences of heat capacity, heat transfer, and heat conductiv- ity and diffusivity that exist between coal and alundum. However, a diluent and comparison medium having particle size and thermal characteristics more like those of coal would be more desirable.
T h e influence of an inert diluent upon coal thermograms shows that accurate quan- titative work by differential thermal an- alysis could be limited by the presence of shale in the sample, even though the irn- purity contained no reactive minerals. Th i s factor must be considered if quantitative de- termination of volatile content of coal is attempted.

21 ILLINOIS S T A T E GEOLOGICAL SURYEY
TIGHT PACKING
FIG. 7.-Thermograms showing the effects of diluting the specimen with alundum. Percentage figures refer to the quantity of coal in relation to diluent.

EFFECTS OF HEATING RATE 2 5
E F F E C T S OF P A R T I C L E S I Z E
Considerable variation of thermograms was obtained with samples of different max- imum particle size (fig. 8 ) . All analyses for checking this factor were made with the inconel sample holder with specimen wells 1/2; inch in diameter and 9/10 of an inch deep. Samples were loosely packed and cov- ered. A bulk sample of 10 by 28 mesh bright clarain was prepared from which in- dividual samples were taken and prepared for each test.
No attempt was made to adopt a lower size limit for individual samples because it was felt that uniform samples for all an- alyses could not be assured if part of the sample was discarded each time. Frequent sieving during the final grinding was more closely adhered to than normally, however, so that the quantity of very fine sizes would be held as close to a minimum as possible. T h e exact particle size of the alundum dilu- ent was not determined, but it was a t least small enough to pass through a 270 mesh Tyler sieve. T w o parts of coal to one of diluent were used to reduce the effect of the fine-size alundum.
A gradual diminution of the interruption interval occurs as maximum grain size de- creases from minus 28 to minus 200 mesh. I n a minus 28 mesh sample there necessarily must be a considerable range of particle size in spite of frequent sieving. Th i s size range is progressively shortened, however, as max- imum particle size is reduced through minus 65, 100, and 200 mesh. W h e n minus 200 mesh or smaller is used, any effect of par- ticle size appears to be negligible as far as its reflection on the thermogram is con- cerned. Compare curve 204 (minus 200 mesh) with curve 199 (minus 270 mesh), and curve 203 (minus 200 mesh) with curve 201 (minus 270 mesh). T h e n com- pare the similarity of curves 204 and 201 (minus 200 and 270 mesh, respectively) and of curves 203 and 199 (also minus 200 and 270 mesh, respectively). T h e four are sufficiently alike to be considered within limits of experimental accuracy, regardless of particle size.
Bulk density decreases with decreasing
particle size and admits a smaller quantity of sample into a given space volume. I t also seems likely that narrower size range would afford better permeability to passage of gases since greater total surface area of particles would give more frictional resist- ance to settling in the specimen well. I t has -
been suggested that coal particles of . I7 rnm. or smaller behave as spheres (Staeckel and Radt, 1934).
T h e progressively smaller interruption in- terval produced by samples of smaller maxi- mum particle size shows that resistance to expansion and escape of gas decreased with decreasing particle size until the maximum size was as small as minus 200 mesh.
Direct experiments carried out with cok- ing coals have shown that the formation of coke could be prevented entirely if the coal particles were very small (Sweitoslawski, 1942, p. 1 15 ) . T h e condition of the residue from these tests confirms these findings. H a r d and well-fused coke buttons were found after minus 28 and minus 65 mesh samples were heated, and a weaker button after a minus 100 mesh size was heated. Only unconsolidated powder was left after minus 200 and 270 mesh sizes were heated. Renewal of gas escape following temporary interruption appears to have occurred with development of sufficient pressure to bind the coal particles.
T h e tests demonstrate the necessity of following uniform practices of sizing dur- ing sample preparation. Sizing is impera- tive for elimination of the uncontrolla5le variable introduced by random crushing of the sample. Minus 200 or smaller mesh size seems to settle uniformly into the specimen well and thereby helps to solve the difficult problem of uniform packing. I t is not sug- gested, however, that this is the final arr- swer to the problem. More study of par- ticle size and of crushing methods is needed.
E F F E C T S OF H E A T I N G R A T E
T o study the effects of heating rates, a series of tests was made in which all other experimental factors were held constant. Samples for each analysis were taken as re-

ILLINOIS S T A T E GEOLOGICAL SURVEY
270 mesh I
l g g Y
201 - 270 mesh
FIG. 8.-Thermograms showing the influence of coal particle size.
E F F E C T S OF H E A T I N G RA T E
10"- 1 1 " Der Min.
150
1 1 " - 12" per Min.
149 12" - 13" per Min.
147
22" - 26" per Min
148
27"-31" per M in
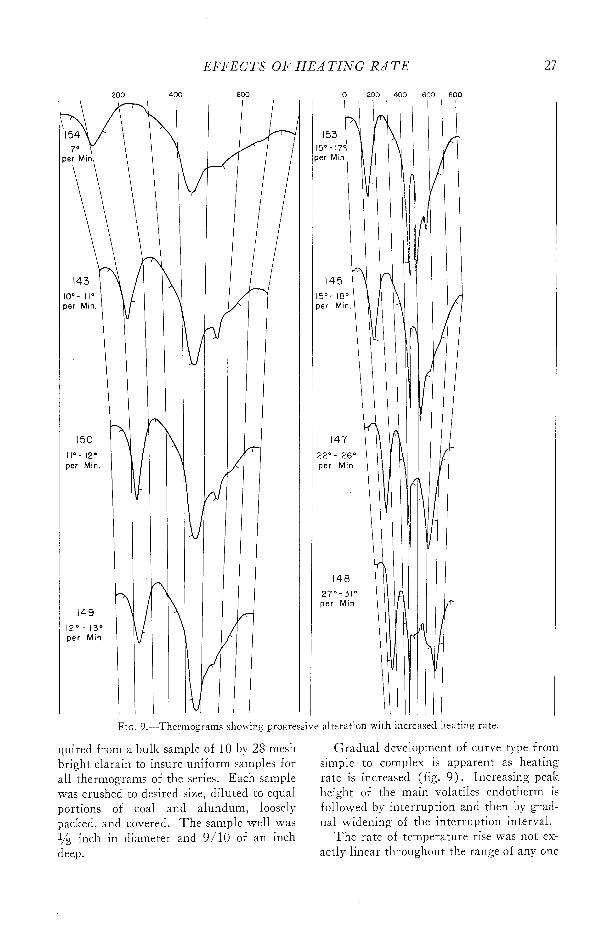
FIG. 9.-Thermograms showing progressive alteration with increased heating rate.
quired from a bulk sample of 10 by 28 mesh bright clarain to insure uniform samples for all thermograms of the series. Each sample was crushed to desired size, diluted to equal portions of coal and alundum, loosely packed, and covered. T h e sample well was y2 inch in diameter and 9/10 of an inch deep.
Gradual development of curve type from simple to complex is apparent as heating rate is increased (fig. 9 ) . Increasing peak height of the main volatiles endotherm is followed by interruption and then by grad- ual widening of the interruption interval.
T h e rate of temperature rise was not ex- actly linear throughout the range of any one
2 8 ILLINOIS S T A T E GEOLOGICAL SURYEY
thermogram, as shown by the lines connect- ing each 100" C. mark. A small endother- mic deflection a t about 5.50' C. is more or less pronounced on most of the thermo- grams. No attempt was made to interpret its cause.
This series again demonstrates the influ- ence upon the thermogram if evolved gases are not permitted to escape from the speci- men as they form. During slow heating, volatile matter escapes without interrup- tion, but as the heating rate is increased the sample well becomes congested with tar vapors and the sealing of interstitial particle space results. A t a rate of 1.5" to 17" C. per minute (curve 153), the congested con- dition inside the sample well is reflected by the development of an interruption interval that grows increasingly wider as heating rates are increased. Further investigation of heating rate is needed. T h e decomposition process of coal is such that a slower rate might permit certain reactions to more near111 reach completion and thus separate them on the thermogram.
E F F E C T S OF G A L V A N O M E T E R R E S I S T A N C E
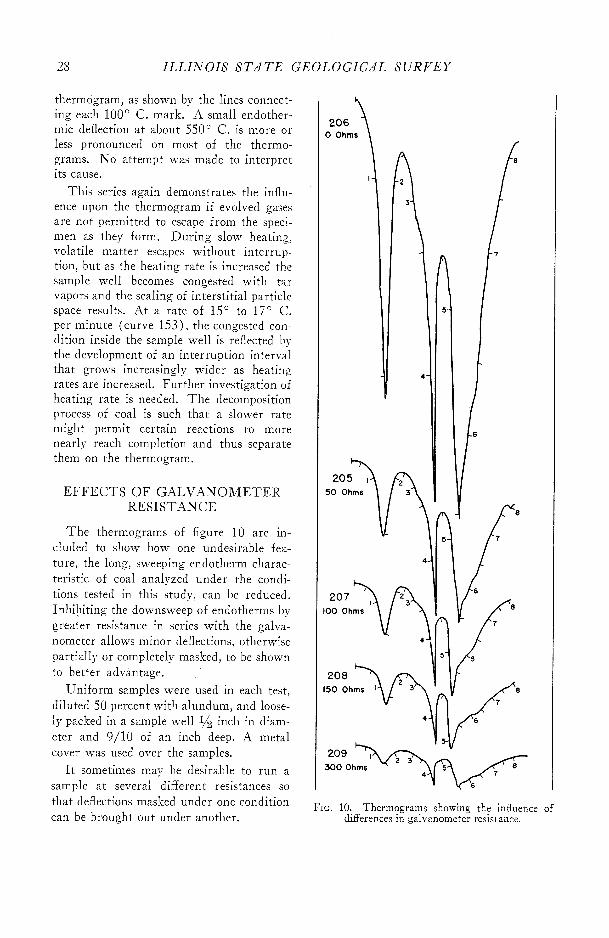
T h e thermograms of figure 10 are in- cluded to show how one undesirable fea- ture, the long, sweeping endotherm charac- teristic of coal analyzed under the condi- tions tested in this study, can be reduced. Inhibiting the downsweep of endotherms by greater resistance in series with the galva- nometer allows minor deflections, otherwise partially or completely masked, to be shown to better advantage.
Uniform samples were used in each test, diluted 50 percent with alundum, and loose- ly packed in a sample well y2 inch in diam- eter and 9/10 of an inch deep. A metal cover was used over the samples.
I t sometimes may be desirable to run a sample a t several different resistances so that deflections masked under one condition can be brought out under another.
0 Ohms
FIG, 10.-Thermograms showing the influence of differences in galvanometer resistance.
SUMMARY AND CONC'LUSIONS
S U M M A R Y A N D C O N C L U S I O N S
I n general it may be said that, insofar as the inherent differences of coal and clay permit a comparison of experimental fac- tors, and insofar as the experiments con- ducted can be compared with those of Arens (1951), thermograms respond in the same general direction whether they are of clay or of coal. T h e magnitude of the response, however, seems to be greater in coal.
I t should be borne in mind that variations are orderly and explainable and respond moderately well to control. Proper control over experimental factors eventually may lead to the development of a thermogram type with a maximum amount of interpreta- ble detail. T h e wide variety of curves ob- tained in this study, and by other workers who have made differential thermal studies of coals with different equipment and under other conditions, shows that under some cir- cumstances many deflections are partially or completely masked. I n many cases, experi- mental factors rather than the coal itself are responsible.
Solving the many problems involved in differential thermal studies of coal was not the primary object of this investigation. Some of the problems have been pointed out and emphasized, and an approach to the solution of a few of them suggested. De- sign of the specimen holder and control over oxidation are among the major items re- quiring modification.
T h e problem of heat transfer through the specimen holder can be solved by using sep- arated holders for the reference material and the sample. Sample holders with thin walls might reduce the smothering effect of an excessive mass of hot metal around the specimen. Further study of design, mass, geometry, and composition of the holder is needed.
Formation of ash on the surface of the specimen indicates oxidation, but the' extent
of its effect cannot be determined. Air also enters through the small thermocouple open- ing in the side of the specimen well, and comes into contact with the sample right a t the differential thermocouple where very slight oxidation conceivably could exert a very strong and uncontrollable influence. Oxidation might best be eliminated by an atmosphere of inert gas.
As mentioned in the discussion of dilu- ents, the alundum used in these tests is not considered the most desirable comparison material or diluent for coal analysis. A ma- terial having thermal characteristics more like those of coal and that can be crushed to particle size more nearly equal to that of coal would be more suitable.
T h e ' differential thermal technique ap- pears to offer possibilities as an additional tool for qualitative coal study, particularly when used with data obtained from other types of investigation. However, any evalua- tion of differential thermal data or any in- terpretation of thermograms must be made with full cognizance of the limits of accu- racy of the method and equipment em- ployed. The re is need for further experi- mentation before full evaluation of this technique can be determined. I ts ultimate value probably will depend upon the degree to which differences in coals can be made to register on the thermogram as individual entities that can be differentiated one from the other. The re is no longer any doubt that coals of different ranks and types do yield different thermograms. T h e need is for refinement of the technique so that as many as possible of the minor variations in coals can be detected by the deflections they produce.
Since minor variations of experimental factors and equipment design do cause such diversity of curve types, it is suggested that reports of coal study by differential thermal analysis contain detailed descriptions of equipment and methods employed.

ILLINOIS STATE GEOLOGICAL SURVEY
REFERENCES
ARENS, P. L., 1951, A study of the differential ther- Fuel, v. 13, no. 9, p. 282-285; no. 10, p. 311- ma1 analysis of clam and clay minerals: The 313. Hague, ~xcelsiors ~o to -~ f f s e ; , 131 p.
STOTT, J. B., and BAKER, 0. J., 1953, Differential BREGER, I. A., 1950, The chemical and structural thermal analysis of coal: Fuel, v. 32, no. 4,
relations hi^ of linnin to humic substances: D. 415-427. conference on theU0rigin and Constitution of Coal, Nova Scotia Dept. Mines, Nova Scotia STUTZER, O., and NOE, A. C., 1940, Geology of Research Foundation, p. 11 1-1 16. coal: Chicago, Univ. Chicago Press, 428 p.
GLASS, H . D., 1954, Investigation of rank in coal by differential thermal analysis: Econ. Geol., v. 49, no. 3, p. 294-310.
GRIM, R. E., and ROWLAND, R. A., 1942, Differential thermal analysis of clay minerals and other hydrous materials: Am. Mineralogist, v. 27, no. 11, p. 746-761; no. 12, p. 801-818.
HOLLINGS, H., and COBB, J. W., 1923, A thermal study of the carbonization process: Fuel, v. 2, no. 10, p. 322-333.
National Research Council, 1945, Chemistry of coal utilization, v. 1: New York, John Wiley, 920 p.
STAECKEL, W., and RADT, W. P., 1934, Effect of grain size on the bulk density of coking coal:
SWEITOSLAWSKI, W., 1942, Coke formation process and physico-chemical properties of coals (Polish Inst. Series 1): New York, Polish Inst. of Arts and Sciences in America, 140 p.
WEBB, T. L., 1954, Comparative performance of nickel and porous alumina sample holders for differential thermal analysis: Nature, v. 174, no. 4432, p. 686-689.
WHITEHEAD, W. L., 1950, The vacuum differential analysis of coals: Conference on the Origin and Constitution of Coal, Nova Scotia Dept. Mines, Nova Scotia Research Foundation, p. 100-110.
, and BREGER, I. A., 1950, Vacuum dif- ferential thermal analysis: Science, v. 11 1, no. 2881, p. 279-281.
ILLINOIS STATE GEOLOGICAL SURVEY, REPORT OF INVESTIGATIONS 190
30 p., 10 figs., 1 table, 1955