Embed Size (px)
Citation preview

MAY 2015NAPTP CONFERENCE
VTTI ENERGY PARTNERS LP INVESTOR PRESENTATION
1

CORPORATE OVERVIEW
VTTI Energy Partners LP was listed in August 2014 by the global independent energy storage company: VTTI B.V.
• IPO August 2014 (NYSE: VTTI)
• ~$ 1bn market capitalization
• 49% of Partnership is publicly owned
• Investors receive 1099 tax form
• Partnership owns 36% of VTTI Operating
• Multiple growth options available
• Sufficient liquidity to finance growth
2
VTTI MLP B.V.(VTTI OPERATING)
VTTI ENERGY PARTNERS GP LLC
(General Partner)
PUBLICUNITHOLDERS
VTTI MLPPARTNERS B.V.
VTTI B.V.
50% interest50% interest
100% interest
49% LP interest
36% economic interest51% voting interest
100% interest
2% GP int100% IDRs
64% economic interest49% voting interest
49% LPinterest
Seaport Canaveral, USA
Fujairah, UAEJohor, Malaysia
Amsterdam, Netherlands
Rotterdam, NetherlandsAntwerp, Belgium
6 Terminals35.5 MMBbls *
4 Continents
* Gross capacity
Simplified Organizational and Ownership Structure
* Including ATB Phase 2
7 Terminals*ROFO assets

VTTI is a unique global terminal MLP, well differentiated from its peers
VTTI INVESTMENT HIGHLIGHTS
3
• Vitol/MISC/VTTI B.V. provide extensive global commodity flow and opportunity insight
• Sponsors incentivized to promote and support us given their strong LP and GP ownership
High Quality, Strategically
Located Asset Base
Proven Track Record of
Growth
Unique Strategic Relationship
with Vitol/MISC
High Barriers to Entry
Cash flow stability
• Located in major global energy market hubs with extensive interconnectivity infrastructure
• Highly efficient and flexible terminals equipped with advanced technology
• Global network difficult to replicate
• Ability to execute projects in any region around the world
• Long-term, fee-based, take-or-pay contracts with no commodity price exposure
• Material non-USD FX exposures largely hedged to mid-2019
• VTTI B.V. increased storage capacity ~40% CAGR since 2006
• Seasoned management and terminal team with successful global execution
• ~40 MMBbls of capacity outside MLP available for dropdowns, >3x the existing capacity
• Opportunity to exploit highly fragmented international midstream industry outside USHigh Growth Potential
HISTORY OF VTTI B.V.
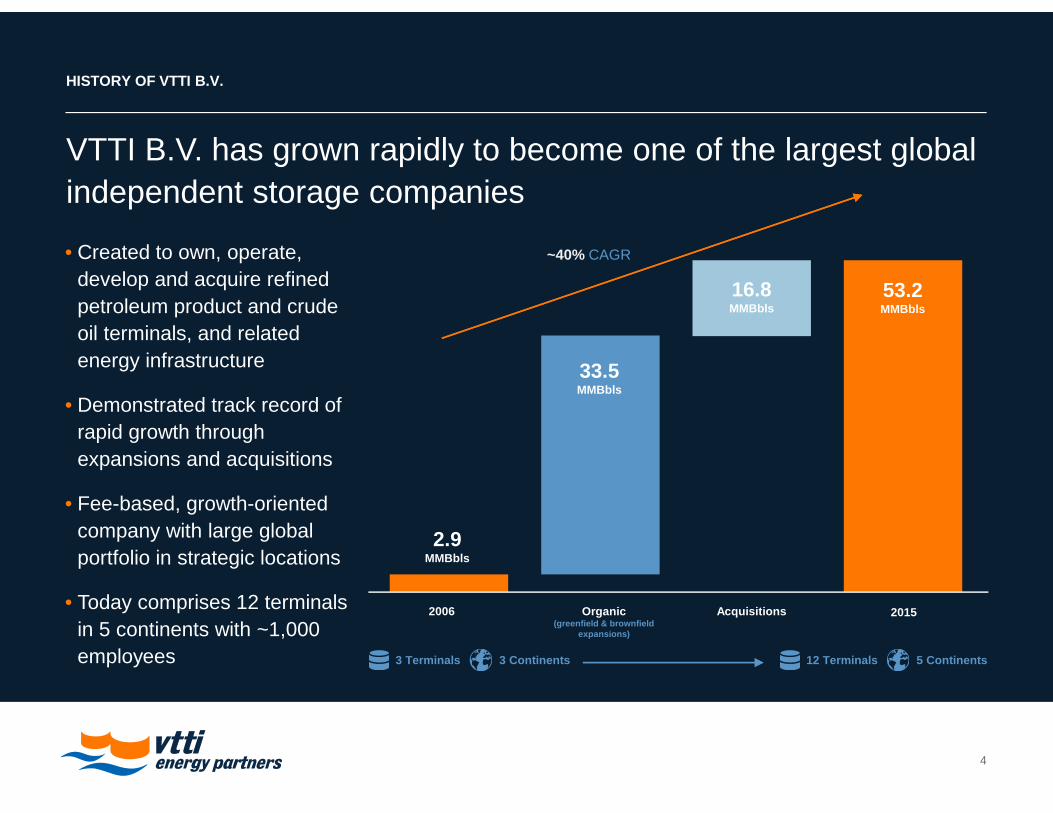
VTTI B.V. has grown rapidly to become one of the largest global independent storage companies
4
• Created to own, operate, develop and acquire refined petroleum product and crude oil terminals, and related energy infrastructure
• Demonstrated track record of rapid growth through expansions and acquisitions
• Fee-based, growth-oriented company with large global portfolio in strategic locations
• Today comprises 12 terminals in 5 continents with ~1,000 employees
AcquisitionsOrganic(greenfield & brownfield
expansions)
2006 2015
33.5MMBbls
16.8MMBbls
53.2MMBbls
2.9MMBbls
~40% CAGR
3 Terminals 3 Continents 12 Terminals 5 Continents

VTTI B.V. ASSET GROWTH
VTTI B.V. has acquired 6 terminals, developed 7 greenfield projects and executed 8 terminal expansions since 2006
5
VitcoZarate,Argentina
VTTI FTLFujairah, UAE
VitcoZarate, Argentina
SeaportCanaveralFlorida, USA
VTTI KenyaMombasa, Kenya
ETA Amsterdam,
The Netherlands
ETT Rotterdam,
The Netherlands
ETT Rotterdam,
The Netherlands
ETT Rotterdam,
The Netherlands
VitcoZarate, Argentina
BNKKaliningrad, Russia
ETA Amsterdam,
The Netherlands
VNTVentspils, Latvia
ETA Amsterdam,
The Netherlands
VTTI FTLFujairah, UAE
ATPCAntwerp, Belgium
NavgasLagos, Nigeria
ATBJohor, Malaysia
VTTVVasiliko, Cyprus
ATB 2Johor, Malaysia
VTTI KenyaMombasa, Kenya
2006 2015
MISC Enters investment
(2010)
GREENFIELD BROWNFIELD ACQUISITIONS
FTL 2Fujairah, UAE

VTTI EP TERMINALS
• Portfolio currently comprises six terminals located in four major global energy market hubs
• Well interconnected to sea, road, pipelines and railroads
• ~400 tanks, comprising 35.5 million barrels of capacity
6
• Newly constructed/retrofitted and fully automated infrastructure with extremely efficient operations
• Highly flexible, industry leading customer service and responsiveness
• Significant opportunities for expansion
Europe Middle East Asia North America
Locations Amsterdam Rotterdam Antwerp Fujairah Johore (Malaysia) Florida
Gross Capacity (MMBbls) 8.4 7.0 4.2 7.4 5.6 2.8
No. of Tanks 211 28 45 47 41 24
Products Refined products Refined products Refined products
Crude oil
Refined products
Crude oil
Refined products Refined products
Maximum draft (feet) 46 69 46 54 56 39
Connectivity Ship
Barge
Road
Railroad
Ship
Barge
Road
Railroad
Pipeline
Ship
Barge
Road
Railroad
Pipeline
Ship
Barge
Road
Pipeline
Ship
Barge
Road
Ship
Barge
Road
Pipeline

• Global presence
• Network of relationships
• Industry insight
• Sourcing and evaluation of opportunities
Trading Upstream Refining Terminals Shipping Retail
>5MM bpd of
crude/refined
products
Diversified portfolio in FSU,
West Africa and North America
Ownership of 4
refineries w/ 350k bpd
of capacity
Joint ownership of 12
terminals on 5
continents with 51
MMBbls of storage
capacity
>6,000 ship voyages in
2013
Ownership of 1,430
retail stations
Production in more than 20
countries across Asia, Middle
East, Latin America and Africa
Ownership of 3
refineries w/ 440k bpd
of capacity
Owns or charters 120
vessels w/ 13MM
deadweight tons
Ownership of 2,400
retail stations
WORLD CLASS SPONSORS WITH INSIGHT ACROSS VALUE CHAI N
VTTI Terminals
Vitol Offices
MISC / Petronas Locations

VTTI Energy Partners’ Assets are Strategic and Core to Vitol’s Business
IMPORTANCE OF VTTI TERMINALS TO VITOL
GLOBAL ENERGY MARKET
9
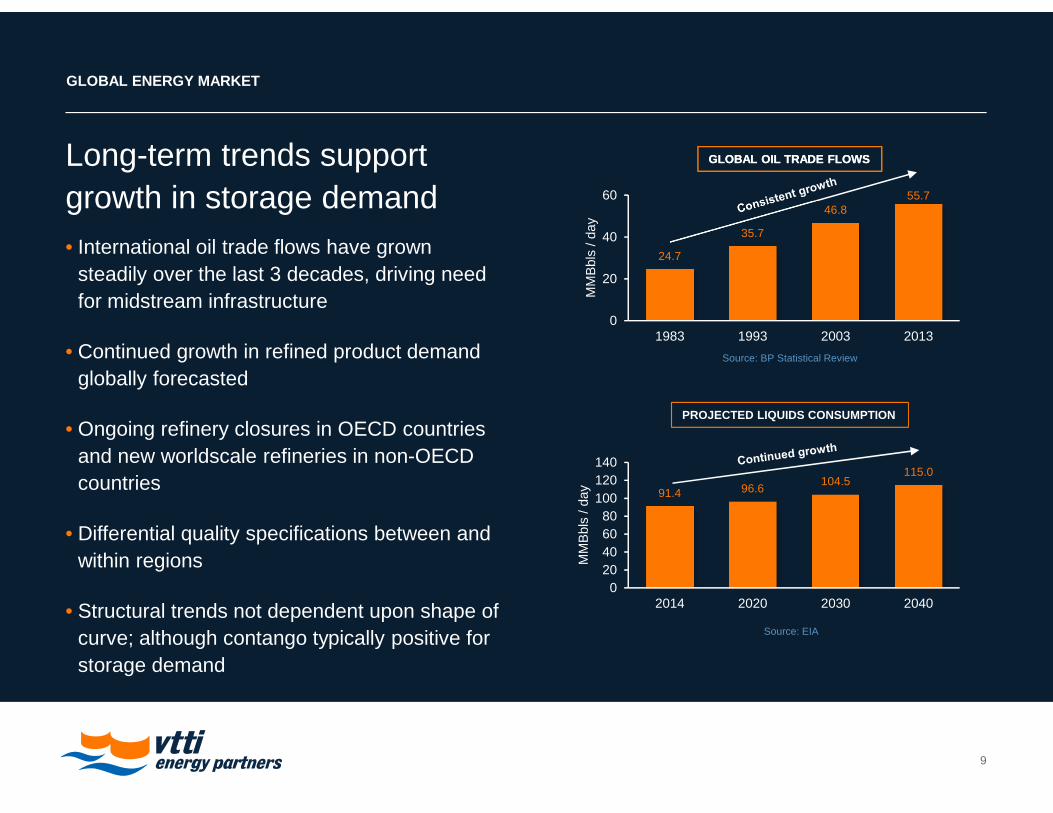
Long-term trends support growth in storage demand• International oil trade flows have grown
steadily over the last 3 decades, driving need for midstream infrastructure
• Continued growth in refined product demand globally forecasted
• Ongoing refinery closures in OECD countries and new worldscale refineries in non-OECD countries
• Differential quality specifications between and within regions
• Structural trends not dependent upon shape of curve; although contango typically positive for storage demand
GLOBAL OIL TRADE FLOWS
91.4 96.6104.5
115.0
020406080
100120140
2014 2020 2030 2040
MM
Bbl
s/ d
ay
PROJECTED LIQUIDS CONSUMPTION
Source: EIA
24.7
35.7
46.855.7
0
20
40
60
1983 1993 2003 2013
MM
Bbl
s / d
ay
GLOBAL OIL TRADE FLOWS
Source: BP Statistical Review

REGIONAL ENERGY TRENDS
North AmericaFlorida, USA
ARA RegionAmsterdam, The NetherlandsRotterdam, The NetherlandsAntwerp, Belgium
Middle EastFujairah, United Arab Emirates
AsiaJohor, Malaysia
10
• Supply and demand regional hub
• Refined petroleum export boom due to surge in shale oil and crude oil export ban
• Production continues to grow; albeit capex levels being cut for 2015
• U.S. refining capacity concentrated in Texas and Louisiana with structural excess of gasoline, diesel, LPG and naphtha on Gulf Coast
• Many states depend on refined petroleum imports
• Transport and marine fuel in high demand
• Remains one of the largest crude oil exporters
• Significant refining capacity with more being added creates surplus vs local demand; although shortages remain in certain products
• Fujairah plays a key role in balancing supply and demand for region
• Close to Straits of Hormuz and gateway to Indian Ocean from Persian Gulf; outlet to East Africa and South Asia
• Consolidation point for fuel oil outlets and regional bunker markets
• Key international supply and demand hub
• Serves ten refineries with refining capacity of three million barrels per day
• Shortage of diesel and excess of gasoline and fuel oil, leads to significant imports and exports
• VTTI Energy Partners are the only company to store diesel in all three ARA ports
• Singapore is a regional hub: 3 world class refineries; 7 independent oil terminals; 5 chemical plants; many floating storage vessels
• World’s largest bunker market where surpluses from Korea and Taiwan are matched with deficits in Malaysia, Vietnam, Indonesia and Australia
• Strong gasoline growth in most major Asian markets
• Increasing intraregional trade
• Platts to expand Singapore price scope to Straits (including ATB)

LIQUID BULK THROUGHPUT NW EUROPE
11
Sources: Port Statistics, EIA, WoodMackenzie (2014)
Main Waterway
CEPS: Central European Pipeline System
RRP: Rotterdam Rhine Pipeline
DSM: Naptha Pipeline
RMR: Rhein Main Rohrleitung
RAPL: Rotterdam Antwerp Pipeline
Total: Crude Pipeline
Rotterdam
Antwerp
Amsterdam
18%
53%
29%
THROUGHPUT
Gasoline Gasoil Fuel Oil
75 MT
44 MT
32MT
-100.0
-50.0
-
50.0
NWE Trade Imbalances MT/yr
2013 2020
Gasoil
Gasoline
IMPORT VOLUME
ARA75%
Other25%

Organic growth
Continuously evaluating organic development opportunities
5.0 MMBbls of organic projects recently completed (Cyprus, 3.4
MMbls) or under construction (Malaysia Phase II, 1.6 MMbls)
Progressing number of other projects including Fujairah (2.7 MMBbls) and Cape Town (0.8 MMBbls storage)
8.5MMblsof terminal storage capacity recently
completed, under construction or planned
GROWTH OPPORTUNITIES
Multiple sources of significant growth
12
Drop downs
ROFO on all current and future VTTI B.V. assets
Assets outside of MLP:
22.7 MMBbls gross storage capacity (64% proportional) in VTTI Operating
17.7 MMBbls gross storage capacity at VTTI B.V. (including assets under
construction)
40.4MMblsof terminal storage capacity
available for dropdowns
Acquisitions
Acquired 16.8 MMBbls of capacity since 2006
Highly fragmented international terminaling market provides
opportunity for additional consolidation
Strong base of operations will provide platform for strategic growth through
acquisitions
NON U.S. CAPACITY OWNERSHIP
Top 10 independents
16%
Balance ofcapacity
84%
3.3 BNBbls
3.3 Bn globally vs 1.0 Bn in US;top 10 independents own 16% vs 53% in US
Source: PortStorage Group-OPIS/STALSBY TankTerminals.com Database

Region / Location Ownership Interest
Gross Storage Capacity (MMBbls)
Total CapacityCapacity in VTTI Operating at
100% Capacity in MLP at 36% Remaining ROFO Capacity
Terminals in VTTI MLP B.V. (“VTTI Operating”) (1)
Europe / Amsterdam 100% 8.4 8.4 3.0 5.3
Europe / Rotterdam 90% 7.0 7.0 2.5 4.5
Europe / Antwerp 100% 4.2 4.2 1.5 2.7
Middle East / Fujairah 90% 7.4 7.4 2.7 4.8
North America / Florida 100% 2.8 2.8 1.0 1.8
Asia / Malaysia 100% 5.6 5.6 2.0 3.6
VTTI Operating Capacity 35.5 35.5 12.8 22.7
Terminals / Projects owned directly by VTTI B.V.
Europe / Cyprus 100% 3.4 -- -- 3.4
Europe / Latvia 49% 7.5 -- -- 7.5
Europe / Russia 100% 0.3 -- -- 0.3
South America / Argentina 100% 1.4 -- -- 1.4
Africa / Nigeria 50% 0.1 -- -- 0.1
Africa / Kenya 100% 0.7 -- -- 0.7
Asia / Malaysia expansion 100% 1.6 -- -- 1.6
Middle East / Fujairah expansion 90% 2.7 -- -- 2.7
VTTI BV Capacity 17.7 -- -- 17.7
Total Capacity 53.2 35.5 12.8 40.4
CURRENT DROPDOWN POTENTIAL
VTTI Energy Partners has a ROFO on approximately 40 MMBbls of gross storage capacity from its parent which represents >3.0x the storage capacity inside the MLP
13
MLP ASSETS >3.0xNote: 36% of VTTI Operating included in VTTI Energy Partners at IPO. Excludes Cape Town project
FINANCIAL PROFILE
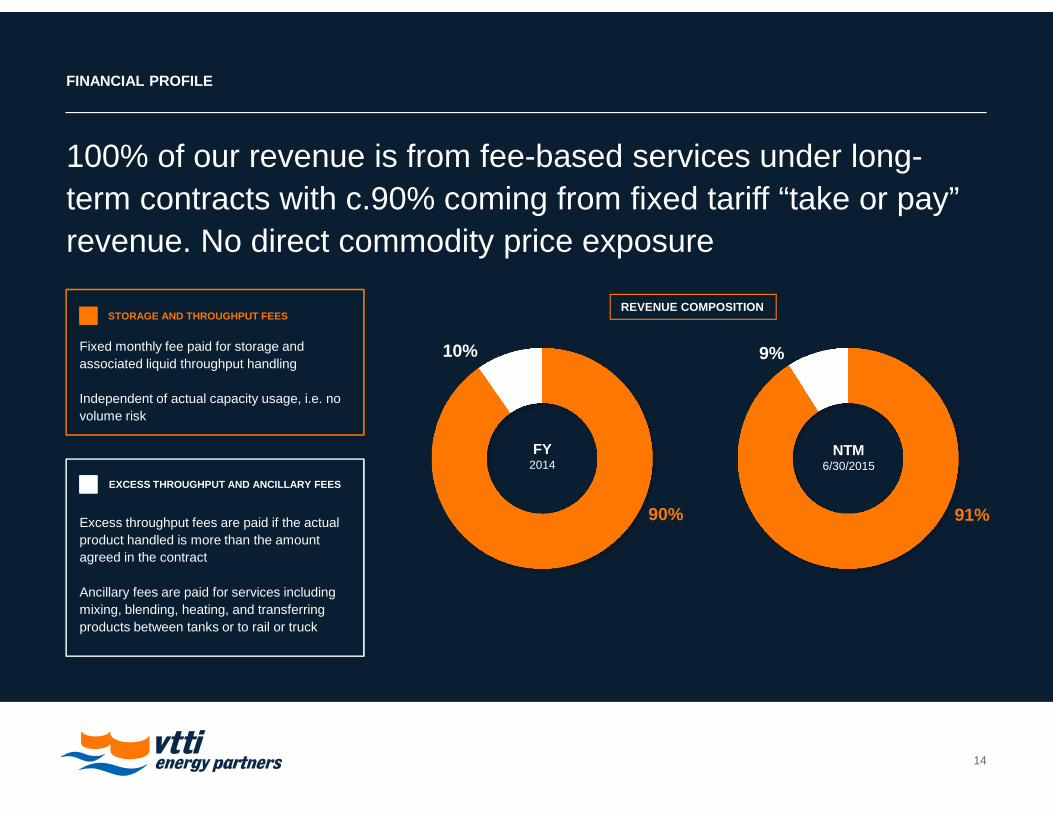
100% of our revenue is from fee-based services under long-term contracts with c.90% coming from fixed tariff “take or pay” revenue. No direct commodity price exposure
14
REVENUE COMPOSITION
FY2014
10%
90%
NTM6/30/2015
9%
91%
STORAGE AND THROUGHPUT FEES
EXCESS THROUGHPUT AND ANCILLARY FEES
Excess throughput fees are paid if the actual product handled is more than the amount agreed in the contract
Ancillary fees are paid for services including mixing, blending, heating, and transferring products between tanks or to rail or truck
Fixed monthly fee paid for storage and associated liquid throughput handling
Independent of actual capacity usage, i.e. no volume risk

Q1 2015 CORPORATE AND OPERATING REVIEW
15
Corporate
Update
Operating
Highlights
• Completed first year end as a public company and published 20-F annual report
• Raised dividend by 3.6% in line with mid-teen annual distribution growth target
• On track for first drop down 9 to 12 months following August 2014 IPO
• Revenue and operating costs in line with plan
• Continue to achieve high levels of utilization across portfolio
• Market leading customer service levels

Q1 2015 FINANCIAL AND DEVELOPMENT REVIEW
16
Development
Projects
• Various organic growth projects under review, particularly in ARA
• Greenfield project at Cape Town (0.8 MMBbls storage) and expansion at Fujairah (2.7 MMBbls) are ongoing
• Johore, Malaysia “Phase Two” (1.6 MMBbls) on track for completion in Q4 2015
Financial
Highlights
• Adjusted EBITDA for Q1 of $50.9m vs. $49.2m forecast
• Net debt of $518.6m implying a net debt to annualized EBITDA ratio of 2.5x
• RCF facility limit increased to €580m from €500m

SUMMARY FINANCIALS Q1 2015
• Adjusted EBITDA $1.7m ahead of forecast
• Interest costs below forecast due to falling market interest rates and Euro to USD FX rate
17
Adjusted EBITDA and Distributable Cash Flow
$ MMActual
Q1 2015F-1 Forecast
Q1 2015
Adjusted EBITDA 50.9 49.2
Cash interest expense (4.1) (6.3)
Cash income tax expense - -
Maintenance capital expenditures (7.8) (7.0)
Cash flow attributable to non-controlling interest (27.4) (24.4)
Distributable cash flow 11.6 11.5
Total distribution 11.2 11.2(1)
Coverage ratio 1.04x 1.03x(1)
• Maintenance capex broadly in line with expectation
• Distributable cash flow and coverage ratio also in line
1. Q1 2015 distribution forecast at the time of the IPO was the Minimum Quarterly Distribution, equating to $10.8m. For comparison purposes, forecast dividend shown above is equal to actual Q1 2015 dividend and coverage ratio adjusted accordingly

BALANCE SHEET AND FINANCIAL TARGETS UPDATE
18
VTTI Energy Partners LP
(USD $mm) ActualMarch 31 2015
Cash
Cash and cash equivalents(1) 25.5
Debt
VTTI Operating Revolving Credit Facility 544.1
Net debt(2) 518.6
Net debt / annualized Adjusted EBITDA 2.5x
VTTI MLP B.V.(VTTI OPERATING)
RCF FACILITY$270mm CAPACITY~$200m UNDRAWN
RCF FACILITY$270mm CAPACITY~$200m UNDRAWN
VTTI MLPPARTNERS B.V.
VTTI B.V.
Financial Targets
• Net Debt / EBITDA threshold of 3.0x - 3.5x
• Look to extend non-USD FX hedging each year
- Average ~4 years of non-USD cashflows largely
hedged
1. Excluding restricted cash2. Excluding restricted cash and debt held by affiliates
RCF FACILITY€580mm CAPACITY~$85m UNDRAWN
RCF FACILITY€580mm CAPACITY~$85m UNDRAWN
PUBLICPUBLIC
• VTTI B.V. also has ability to lend money to the MLP

HEDGING PROFILE
19
Hedging Policy
• Net cash flows of VTTI comprise approximately 60% USD and 40% EUR
• Decision taken at IPO to safeguard USD cashflows
- Majority of projected EUR exposure hedged in USD terms (sliding scale profile)
- Hedged at EUR/USD forward curve of the time (mid-2014)
• Hedging programme recently extended for another year to June 2019
- Continuation of sliding scale profile
• 75% of variable interest rate is fixed
12ms endingJune 30
Target exposure hedged
EUR cashflows Interest rate fixed
2015 ~90% 75%
2016 ~85% 75%
2017 ~80% 75%
2018 ~75% 75%
2019 ~70% -
Hedging Profile
OUTLOOK
20
Market
Dynamics
Third-Party
Acquisitions
Dropdowns
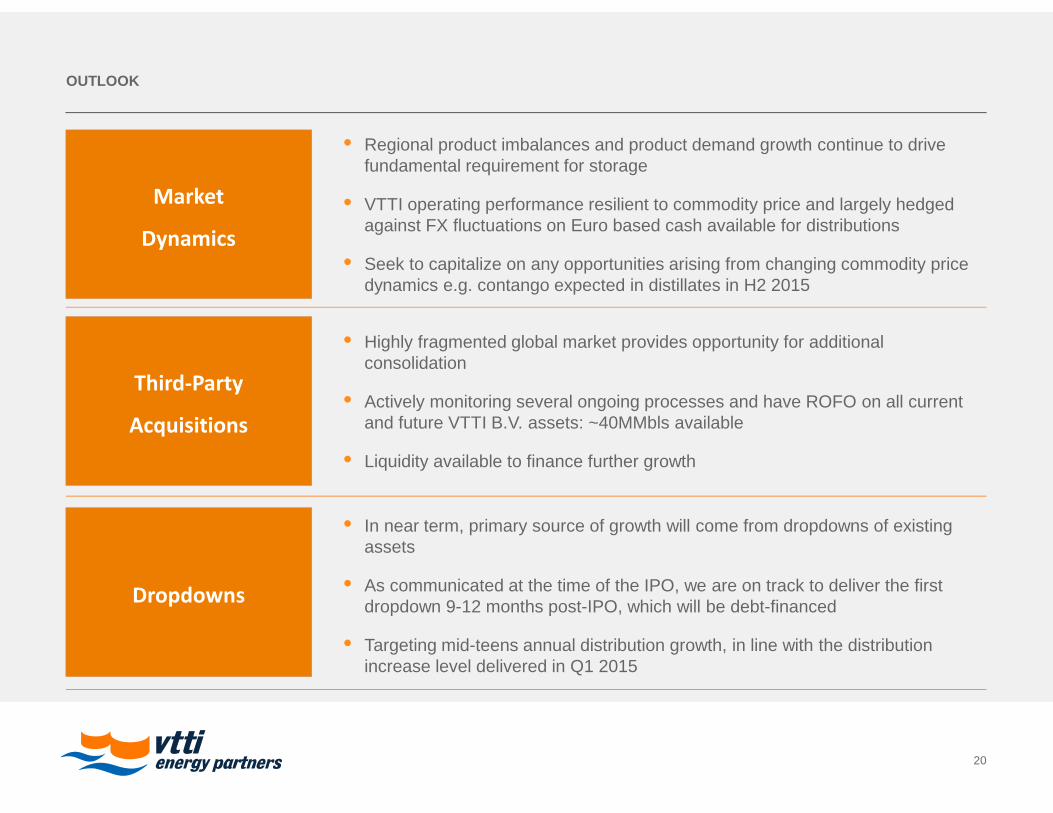
• Regional product imbalances and product demand growth continue to drive fundamental requirement for storage
• VTTI operating performance resilient to commodity price and largely hedged against FX fluctuations on Euro based cash available for distributions
• Seek to capitalize on any opportunities arising from changing commodity price dynamics e.g. contango expected in distillates in H2 2015
• Highly fragmented global market provides opportunity for additional consolidation
• Actively monitoring several ongoing processes and have ROFO on all current and future VTTI B.V. assets: ~40MMbls available
• Liquidity available to finance further growth
• In near term, primary source of growth will come from dropdowns of existing assets
• As communicated at the time of the IPO, we are on track to deliver the first dropdown 9-12 months post-IPO, which will be debt-financed
• Targeting mid-teens annual distribution growth, in line with the distribution increase level delivered in Q1 2015
VTTI ENERGY PARTNERS LP
THANK YOU
21

FINANCIAL DETAIL Q1 2015
(1) Other items comprise primarily the impact of FX and related derivatives on our financial results and the receipt of other miscellaneous revenues
Income Statement (unaudited)
$ MMActual
Q1 2015Actual
Q1 2014
Revenues 69.3 73.5
Operating expenses (incl. D&A) 43.0 47.1
Total operating income 26.3 26.4
Total other expense, net (3.4) (7.8)
Income before income tax expense 22.9 18.6
Income tax expense (7.2) -
Net income 15.7 18.6
Interest expense, including affiliates 2.6 7.5
Other items(1) 8.9 0.3
Depreciation and amortization 16.5 17.5
Income tax expense 7.2 -
Adjusted EBITDA 50.9 43.9

Balance Sheet March 31, 2015 (unaudited)
$ MM March 31, 2015
Cash and cash equivalents(1) 25.5
Property, plant & equipment 1,216.8
Other assets 307.2
Total assets 1,549.5
Debt(2) 544.1
Other liabilities 207.8
Total equity 797.6
Total liabilities and equity 1,549.5
Net debt 518.6
Net debt / Annualized adjusted EBITDA ratio 2.5x
FINANCIAL DETAIL Q1 2015
(1) Cash and cash equivalents excludes restricted cash(2) Debt excludes affiliate debt