Embed Size (px)
Citation preview
1
Hess Midstream Partners LP
2018 MLP & Energy Infrastructure Conference
May 2018
2
Disclaimers
Forward-Looking Statements
This presentation contains forward-looking statements. These forward-looking statements generally can be identified by use of
phrases such as “may,” “estimate,” “project,” “believe,” “plan,” “expect,” “anticipate,” “intend,” “forecast” or other similar words or
phrases in conjunction with a discussion of future operating or financial performance or events. Descriptions of our objectives,
goals, targets, plans, strategies, budgets and projected financial and operating performance are also forward-looking statements.
These statements represent our present expectation or beliefs concerning future events and are not guarantees. Such statements
speak only as of the date they are made, and we do not undertake any obligation to update any forward-looking statement. We
caution that forward-looking statements involve risks and uncertainties and are qualified by important factors that could cause
actual events or results to differ materially from those expressed or implied in any such forward-looking statements. Please see the
“Risk Factors” section in our Annual Report on Form 10-K, Quarterly Reports on Form 10-Q and our other filings with the
Securities and Exchange Commission (“SEC”). Investors are also urged to consider closely the risk factors and other disclosure in
Hess Corporation’s (“Hess”) filings with the SEC. You can obtain these filings from the SEC by visiting EDGAR on the SEC’s
website at www.sec.gov.
Non-GAAP Measures
This document includes certain non-GAAP financial measures as defined under SEC Regulation G. A reconciliation of those
measures to our most directly comparable financial measures calculated and presented in accordance with GAAP is provided in
the appendix to this presentation.
3
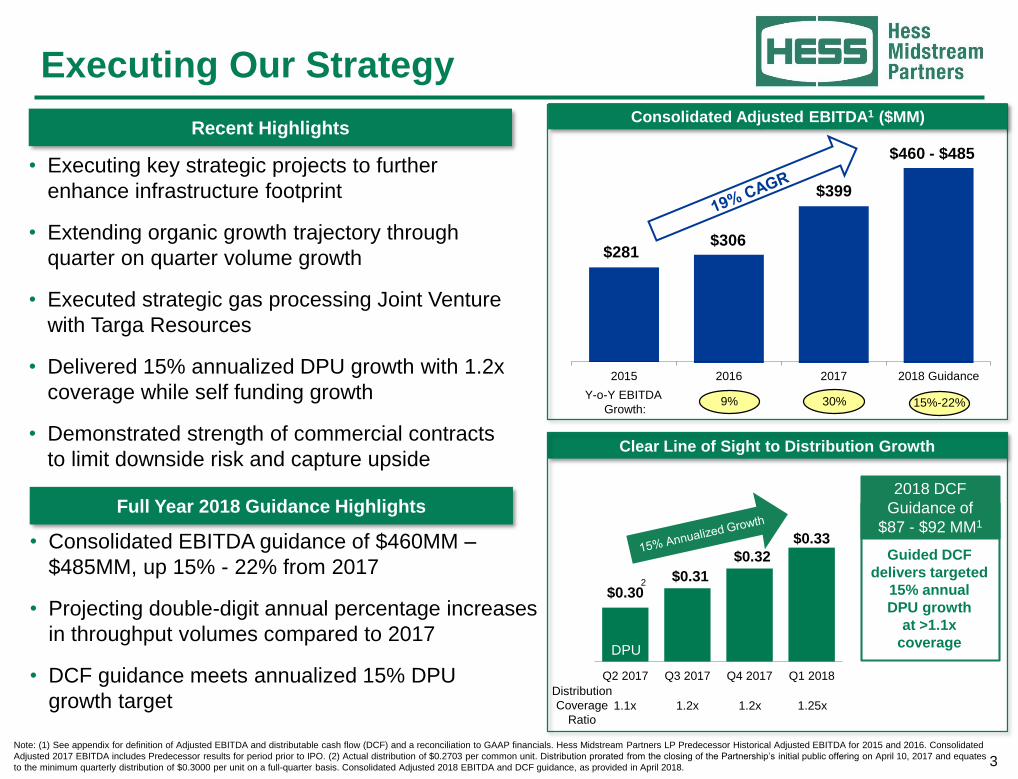
Executing Our Strategy
100
150
200
250
300
350
400
450
500
2015 2016 2017 2018 Guidance
$281$306
$460 - $485
Y-o-Y EBITDA
Growth:30%9% 15%-22%
$399
• Executing key strategic projects to further
enhance infrastructure footprint
• Extending organic growth trajectory through
quarter on quarter volume growth
• Executed strategic gas processing Joint Venture
with Targa Resources
• Delivered 15% annualized DPU growth with 1.2x
coverage while self funding growth
• Demonstrated strength of commercial contracts
to limit downside risk and capture upside
Recent Highlights
Full Year 2018 Guidance Highlights
• Consolidated EBITDA guidance of $460MM –
$485MM, up 15% - 22% from 2017
• Projecting double-digit annual percentage increases
in throughput volumes compared to 2017
• DCF guidance meets annualized 15% DPU
growth target
Clear Line of Sight to Distribution Growth
Consolidated Adjusted EBITDA1 ($MM)
$0.30$0.31
$0.32
$0.33
0 0 0 0 0 0 0 0 0
Q2 2017 Q3 2017 Q4 2017 Q1 2018
2
DPU
Distribution
Coverage
Ratio
1.1x 1.2x 1.2x
Guided DCF
delivers targeted
15% annual
DPU growth
at >1.1x
coverage
Note: (1) See appendix for definition of Adjusted EBITDA and distributable cash flow (DCF) and a reconciliation to GAAP financials. Hess Midstream Partners LP Predecessor Historical Adjusted EBITDA for 2015 and 2016. Consolidated
Adjusted 2017 EBITDA includes Predecessor results for period prior to IPO. (2) Actual distribution of $0.2703 per common unit. Distribution prorated from the closing of the Partnership’s initial public offering on April 10, 2017 and equates
to the minimum quarterly distribution of $0.3000 per unit on a full-quarter basis. Consolidated Adjusted 2018 EBITDA and DCF guidance, as provided in April 2018.
2018 DCF
Guidance of
$87 - $92 MM1
1.25x
4
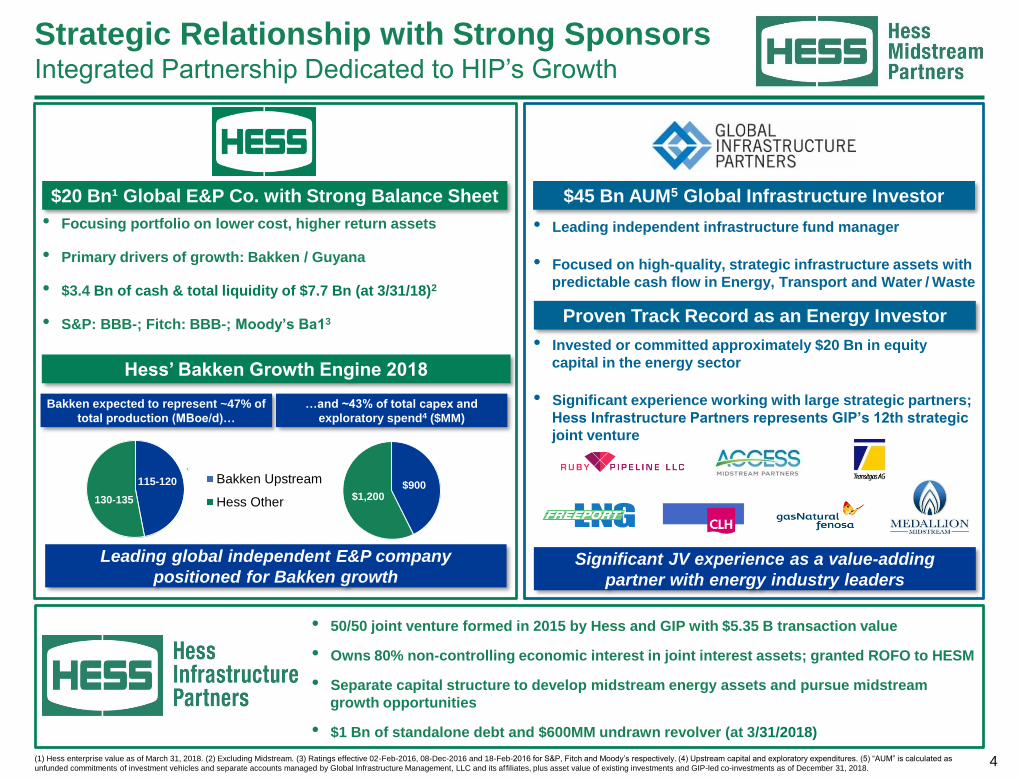
Strategic Relationship with Strong SponsorsIntegrated Partnership Dedicated to HIP’s Growth
$20 Bn¹ Global E&P Co. with Strong Balance Sheet
• Focusing portfolio on lower cost, higher return assets
• Primary drivers of growth: Bakken / Guyana
• $3.4 Bn of cash & total liquidity of $7.7 Bn (at 3/31/18)2
• S&P: BBB-; Fitch: BBB-; Moody’s Ba13
Leading global independent E&P company
positioned for Bakken growth
$45 Bn AUM5 Global Infrastructure Investor
• Leading independent infrastructure fund manager
• Focused on high-quality, strategic infrastructure assets with
predictable cash flow in Energy, Transport and Water / Waste
• Invested or committed approximately $20 Bn in equity
capital in the energy sector
• Significant experience working with large strategic partners;
Hess Infrastructure Partners represents GIP’s 12th strategic
joint venture
Proven Track Record as an Energy Investor
Significant JV experience as a value-adding
partner with energy industry leaders
Hess’ Bakken Growth Engine 2018
$900 $1,200
Bakken Upstream
Hess Other
Bakken expected to represent ~47% of
total production (MBoe/d)…
…and ~43% of total capex and
exploratory spend4 ($MM)
(1) Hess enterprise value as of March 31, 2018. (2) Excluding Midstream. (3) Ratings effective 02-Feb-2016, 08-Dec-2016 and 18-Feb-2016 for S&P, Fitch and Moody’s respectively. (4) Upstream capital and exploratory expenditures. (5) “AUM” is calculated as
unfunded commitments of investment vehicles and separate accounts managed by Global Infrastructure Management, LLC and its affiliates, plus asset value of existing investments and GIP-led co-investments as of December 31, 2018.
115-120
130-135
• 50/50 joint venture formed in 2015 by Hess and GIP with $5.35 B transaction value
• Owns 80% non-controlling economic interest in joint interest assets; granted ROFO to HESM
• Separate capital structure to develop midstream energy assets and pursue midstream
growth opportunities
• $1 Bn of standalone debt and $600MM undrawn revolver (at 3/31/2018)
5
$40 $50 $60 $70 $80 $90-100
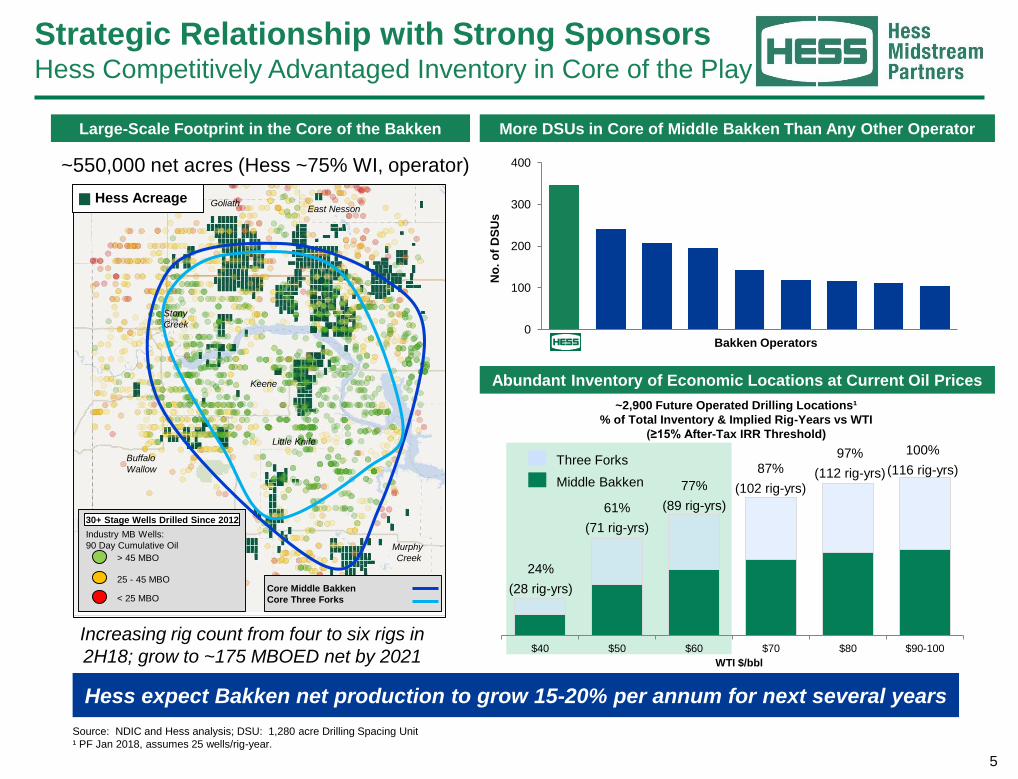
Strategic Relationship with Strong SponsorsHess Competitively Advantaged Inventory in Core of the Play
Source: NDIC and Hess analysis; DSU: 1,280 acre Drilling Spacing Unit
¹ PF Jan 2018, assumes 25 wells/rig-year.
Large-Scale Footprint in the Core of the Bakken
East NessonGoliath
Buffalo
Wallow
Core Middle Bakken
Core Three Forks
Industry MB Wells:
90 Day Cumulative Oil
> 45 MBO
< 25 MBO
25 - 45 MBO
Murphy
Creek
Keene
Little Knife
Stony
Creek
WTI $/bbl
100%
(116 rig-yrs)
97%
(112 rig-yrs)87%
(102 rig-yrs)77%
(89 rig-yrs)61%
(71 rig-yrs)
24%
(28 rig-yrs)
Middle Bakken
Hess expect Bakken net production to grow 15-20% per annum for next several years
Abundant Inventory of Economic Locations at Current Oil Prices
~2,900 Future Operated Drilling Locations¹
% of Total Inventory & Implied Rig-Years vs WTI
(≥15% After-Tax IRR Threshold)
Three Forks
Hess Acreage
~550,000 net acres (Hess ~75% WI, operator)
Increasing rig count from four to six rigs in
2H18; grow to ~175 MBOED net by 2021
0
100
200
300
400
Bakken Operators
No
. o
f D
SU
s
More DSUs in Core of Middle Bakken Than Any Other Operator
30+ Stage Wells Drilled Since 2012
6
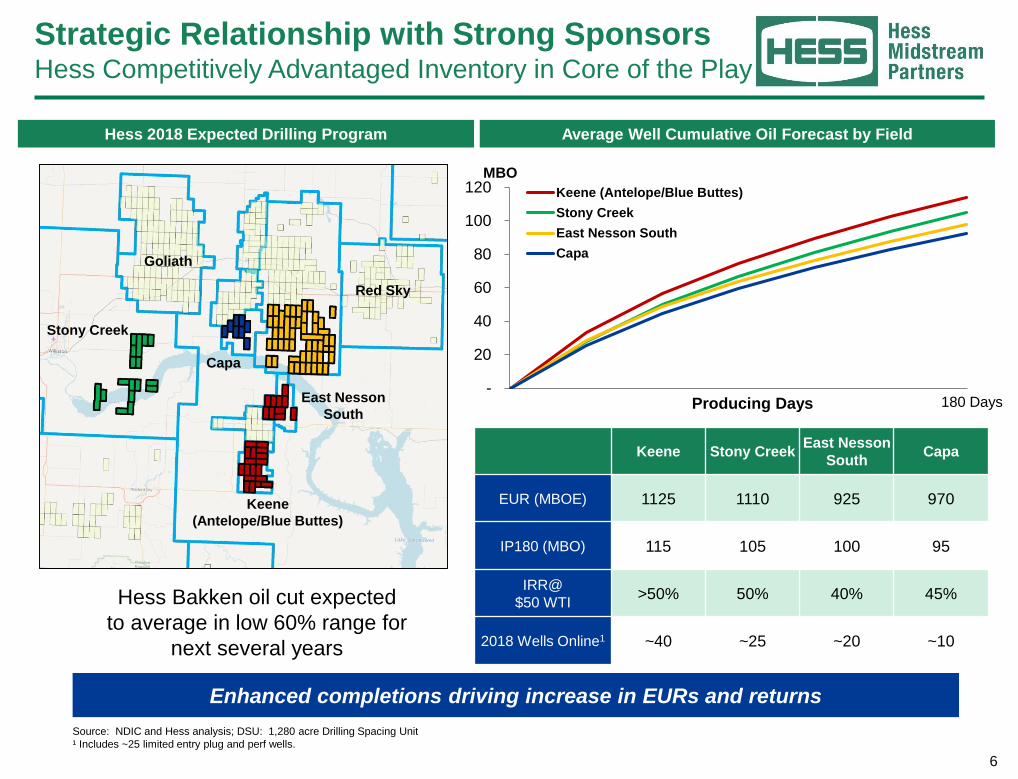
Strategic Relationship with Strong SponsorsHess Competitively Advantaged Inventory in Core of the Play
Source: NDIC and Hess analysis; DSU: 1,280 acre Drilling Spacing Unit
¹ Includes ~25 limited entry plug and perf wells.
Enhanced completions driving increase in EURs and returns
Average Well Cumulative Oil Forecast by Field
Keene Stony CreekEast Nesson
SouthCapa
EUR (MBOE) 1125 1110 925 970
IP180 (MBO) 115 105 100 95
IRR@
$50 WTI>50% 50% 40% 45%
2018 Wells Online1 ~40 ~25 ~20 ~10
Producing Days
MBO
180 Days
Keene
(Antelope/Blue Buttes)
Stony Creek
Capa
East Nesson
South
Goliath
Red Sky
Hess Bakken oil cut expected
to average in low 60% range for
next several years
Hess 2018 Expected Drilling Program
-
20
40
60
80
100
120 Keene (Antelope/Blue Buttes)
Stony Creek
East Nesson South
Capa
7
Note: Mentor Storage located in Mentor, MN (not shown). See appendix for reconciliation to GAAP financials.
(1) Hess Midstream’s interest in the Little Missouri 4 joint venture will be held by Hess TGP Operations LP, in which Hess Midstream owns a 20% controlling economic interest and Hess Infrastructure Partners LP owns the
remaining 80% economic interest. (2) Includes HESM 100% ownership of Mentor Storage Assets (3) Invested capital shown on a 100% basis as of 12/31/2017. Gross PP&E at cost. Segment contribution shown as
percentage of total assets. (4) Segment 2017 Adjusted EBITDA and percent contribution based on Combined Hess Midstream Partners LP Predecessor and Q4 HESM results. Excludes MLP public company costs.
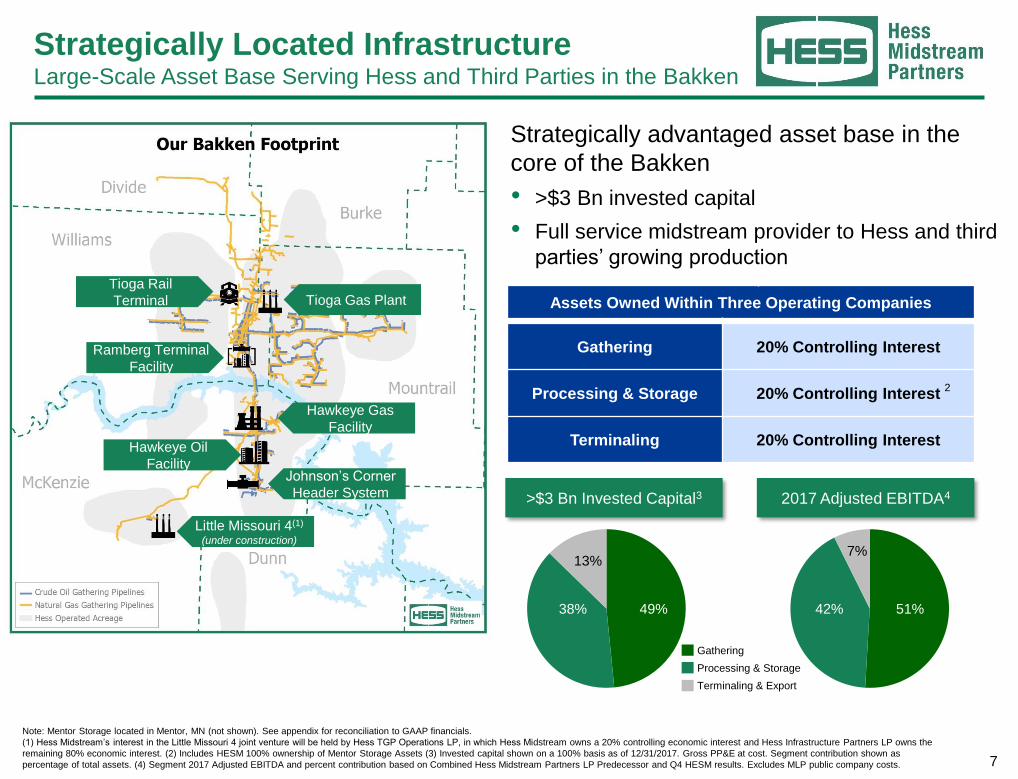
Strategically Located InfrastructureLarge-Scale Asset Base Serving Hess and Third Parties in the Bakken
Strategically advantaged asset base in the
core of the Bakken
• >$3 Bn invested capital
• Full service midstream provider to Hess and third
parties’ growing production
>$3 Bn Invested Capital3
13%
2017 Adjusted EBITDA4
Assets Owned Within Three Operating Companies
Gathering 20% Controlling Interest
Processing & Storage 20% Controlling Interest
Terminaling 20% Controlling Interest
Little Missouri 4(1)
(under construction)
Johnson’s Corner
Header System
Hawkeye Oil
Facility
Hawkeye Gas
Facility
Tioga Gas Plant
Ramberg Terminal
Facility
Tioga Rail
Terminal
Gathering
Processing & Storage
Terminaling & Export
38% 49%
7%
42% 51%
2
8
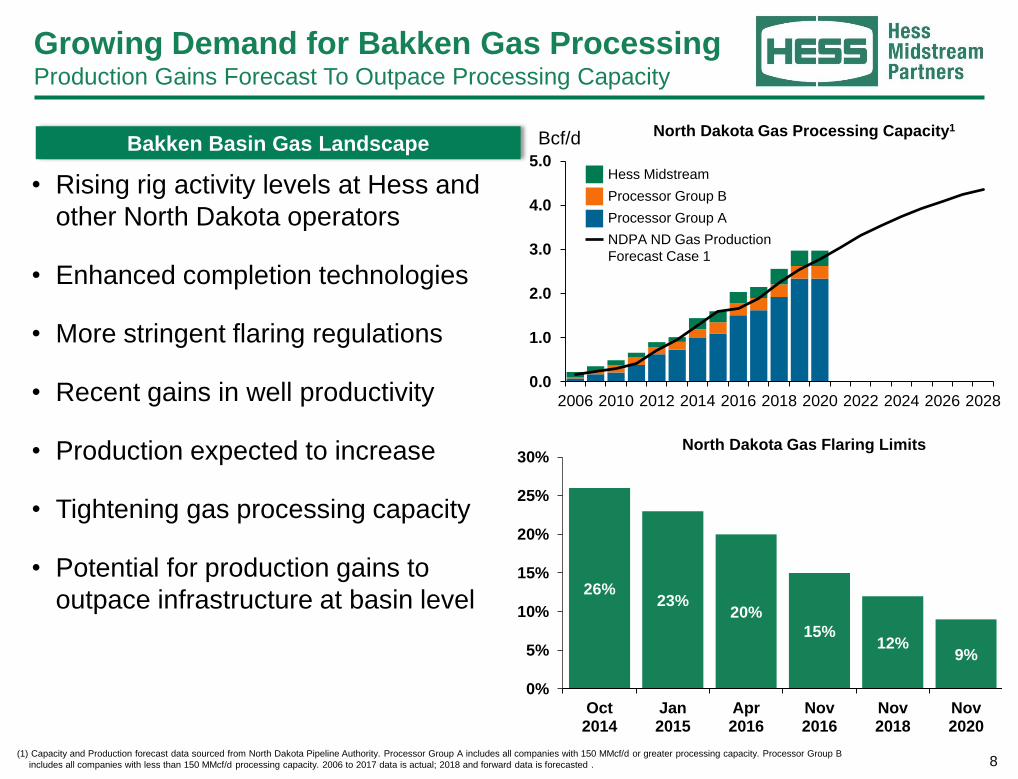
Growing Demand for Bakken Gas ProcessingProduction Gains Forecast To Outpace Processing Capacity
26%23%
20%
15%12%
9%
0%
5%
10%
15%
20%
25%
30%
Oct2014
Jan2015
Apr2016
Nov2016
Nov2018
Nov2020
North Dakota Gas Flaring Limits
• Rising rig activity levels at Hess and
other North Dakota operators
• Enhanced completion technologies
• More stringent flaring regulations
• Recent gains in well productivity
• Production expected to increase
• Tightening gas processing capacity
• Potential for production gains to
outpace infrastructure at basin level
North Dakota Gas Processing Capacity1
0.0
1.0
2.0
3.0
4.0
5.0
2006 2010 2012 2014 2016 2018 2020 2022 2024 2026 2028
(1) Capacity and Production forecast data sourced from North Dakota Pipeline Authority. Processor Group A includes all companies with 150 MMcf/d or greater processing capacity. Processor Group B
includes all companies with less than 150 MMcf/d processing capacity. 2006 to 2017 data is actual; 2018 and forward data is forecasted .
Bakken Basin Gas Landscape Bcf/d
Hess Midstream
Processor Group B
Processor Group A
NDPA ND Gas Production
Forecast Case 1
9
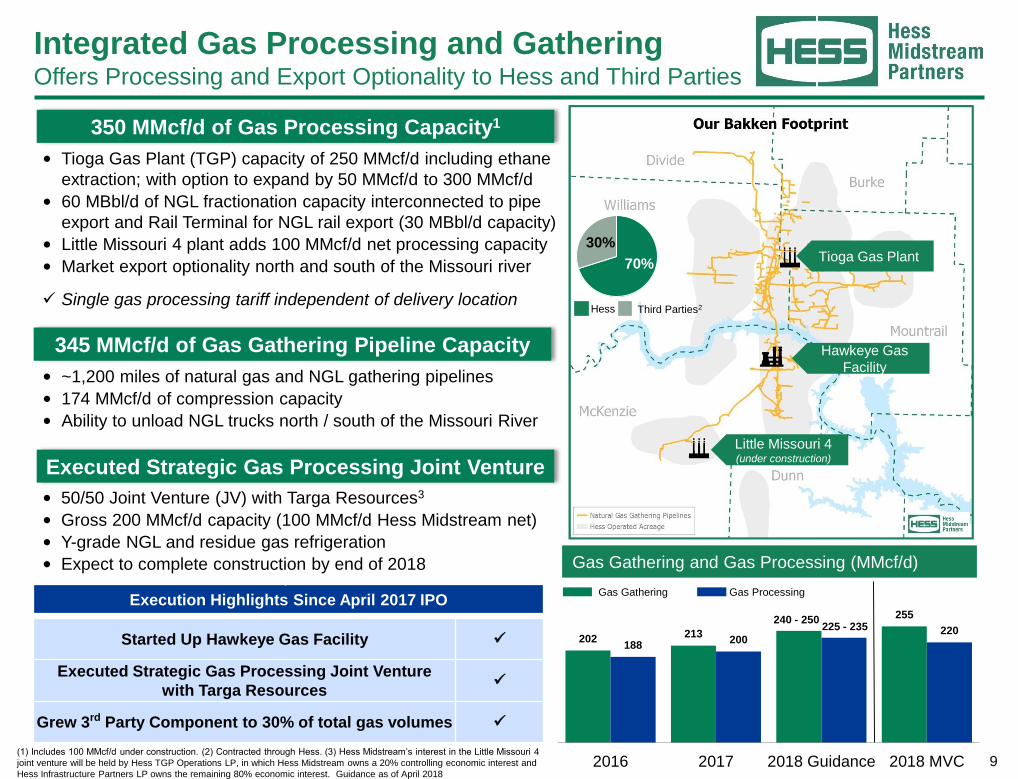
Integrated Gas Processing and GatheringOffers Processing and Export Optionality to Hess and Third Parties
350 MMcf/d of Gas Processing Capacity1
• Tioga Gas Plant (TGP) capacity of 250 MMcf/d including ethane
extraction; with option to expand by 50 MMcf/d to 300 MMcf/d
• 60 MBbl/d of NGL fractionation capacity interconnected to pipe
export and Rail Terminal for NGL rail export (30 MBbl/d capacity)
• Little Missouri 4 plant adds 100 MMcf/d net processing capacity
• Market export optionality north and south of the Missouri river
✓ Single gas processing tariff independent of delivery location
• ~1,200 miles of natural gas and NGL gathering pipelines
• 174 MMcf/d of compression capacity
• Ability to unload NGL trucks north / south of the Missouri River
• 50/50 Joint Venture (JV) with Targa Resources3
• Gross 200 MMcf/d capacity (100 MMcf/d Hess Midstream net)
• Y-grade NGL and residue gas refrigeration
• Expect to complete construction by end of 2018 Gas Gathering and Gas Processing (MMcf/d)
202 213
255
188200
220
2016 2017 2018 Guidance 2018 MVC
Gas Gathering Gas Processing
240 - 250225 - 235
Execution Highlights Since April 2017 IPO
Started Up Hawkeye Gas Facility ✓
Executed Strategic Gas Processing Joint Venture
with Targa Resources✓
Grew 3rd Party Component to 30% of total gas volumes ✓
(1) Includes 100 MMcf/d under construction. (2) Contracted through Hess. (3) Hess Midstream’s interest in the Little Missouri 4
joint venture will be held by Hess TGP Operations LP, in which Hess Midstream owns a 20% controlling economic interest and
Hess Infrastructure Partners LP owns the remaining 80% economic interest. Guidance as of April 2018
Little Missouri 4(under construction)
Hawkeye Gas
Facility
Tioga Gas Plant30%
70%
345 MMcf/d of Gas Gathering Pipeline Capacity
Executed Strategic Gas Processing Joint Venture
Hess Third Parties2
10
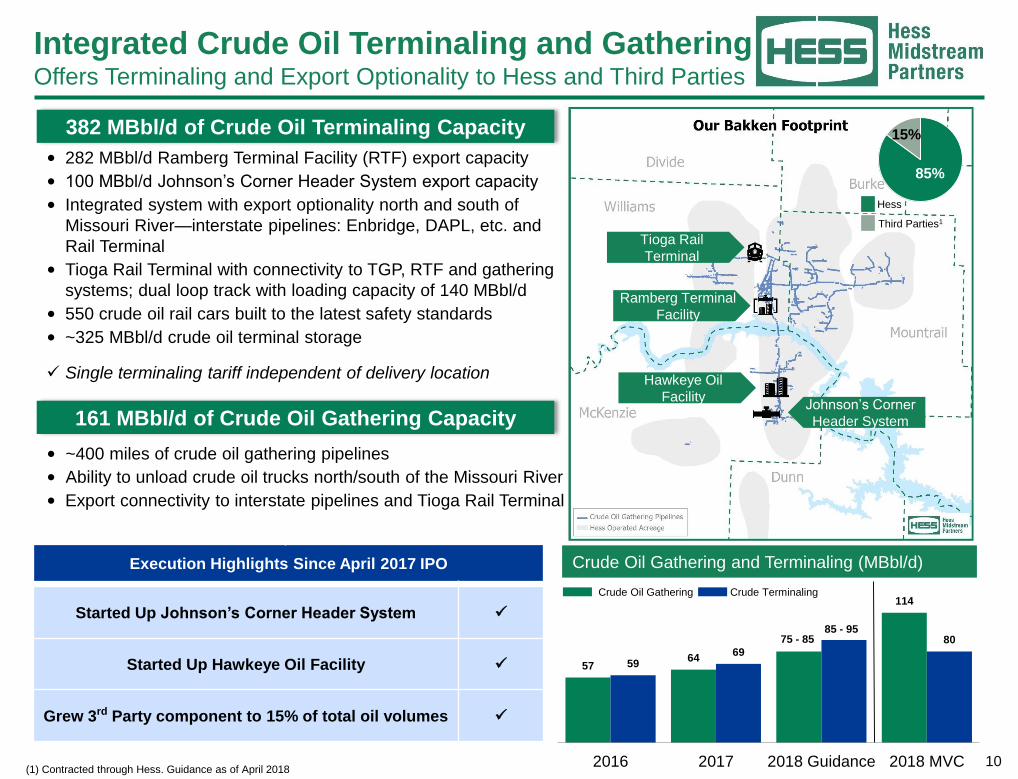
Integrated Crude Oil Terminaling and Gathering Offers Terminaling and Export Optionality to Hess and Third Parties
382 MBbl/d of Crude Oil Terminaling Capacity
• 282 MBbl/d Ramberg Terminal Facility (RTF) export capacity
• 100 MBbl/d Johnson’s Corner Header System export capacity
• Integrated system with export optionality north and south of
Missouri River—interstate pipelines: Enbridge, DAPL, etc. and
Rail Terminal
• Tioga Rail Terminal with connectivity to TGP, RTF and gathering
systems; dual loop track with loading capacity of 140 MBbl/d
• 550 crude oil rail cars built to the latest safety standards
• ~325 MBbl/d crude oil terminal storage
✓ Single terminaling tariff independent of delivery location
• ~400 miles of crude oil gathering pipelines
• Ability to unload crude oil trucks north/south of the Missouri River
• Export connectivity to interstate pipelines and Tioga Rail Terminal
60
-65
72
-77
Crude Oil Gathering and Terminaling (MBbl/d)
5764
114
5969
80
2016 2017 2018 Guidance 2018 MVC
Crude Oil Gathering Crude Terminaling
75 - 8585 - 95
Third Parties1
Hess
15%
85%
Execution Highlights Since April 2017 IPO
Started Up Johnson’s Corner Header System ✓
Started Up Hawkeye Oil Facility ✓
Grew 3rd Party component to 15% of total oil volumes ✓
(1) Contracted through Hess. Guidance as of April 2018
Johnson’s Corner
Header System
Hawkeye Oil
Facility
Ramberg Terminal
Facility
Tioga Rail
Terminal
161 MBbl/d of Crude Oil Gathering Capacity
11
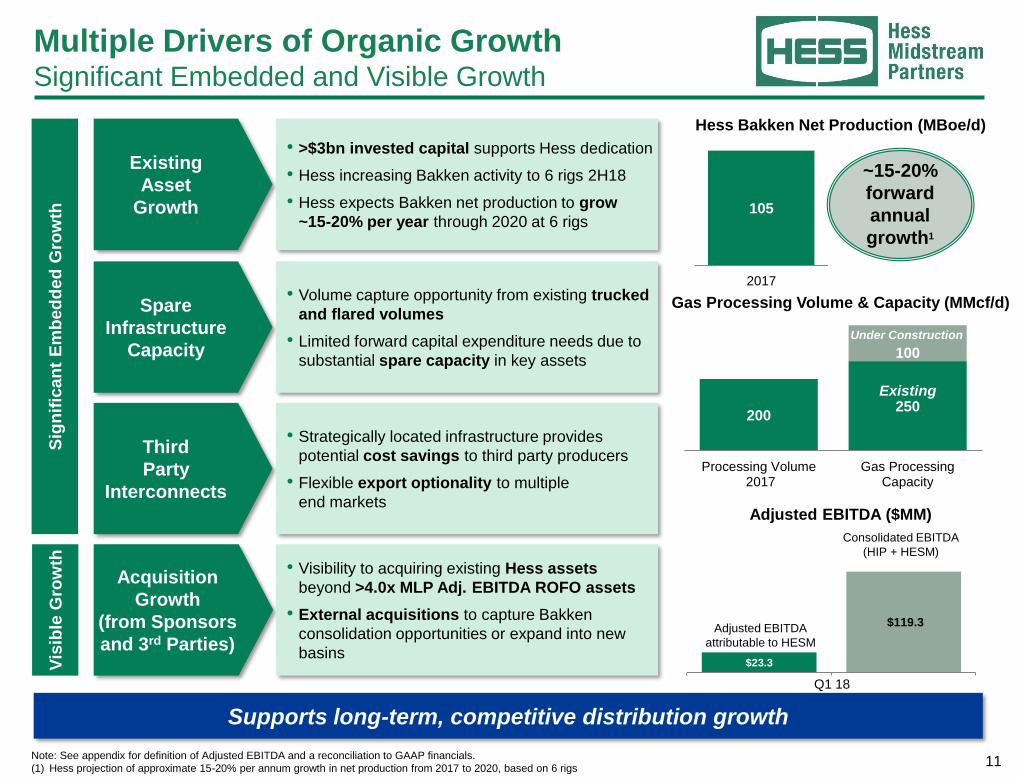
Acquisition
Growth
(from Sponsors
and 3rd Parties)
Multiple Drivers of Organic GrowthSignificant Embedded and Visible Growth
Supports long-term, competitive distribution growth
Third
Party
Interconnects
Existing
Asset
Growth
Spare
Infrastructure
Capacity
Sig
nif
ican
t E
mb
ed
ded
Gro
wth
Vis
ible
Gro
wth
200250
100
Processing Volume 2017
Gas ProcessingCapacity
Gas Processing Volume & Capacity (MMcf/d)
• >$3bn invested capital supports Hess dedication
• Hess increasing Bakken activity to 6 rigs 2H18
• Hess expects Bakken net production to grow
~15-20% per year through 2020 at 6 rigs
• Volume capture opportunity from existing trucked
and flared volumes
• Limited forward capital expenditure needs due to
substantial spare capacity in key assets
• Strategically located infrastructure provides
potential cost savings to third party producers
• Flexible export optionality to multiple
end markets
• Visibility to acquiring existing Hess assets
beyond >4.0x MLP Adj. EBITDA ROFO assets
• External acquisitions to capture Bakken
consolidation opportunities or expand into new
basins
105
-
20
40
60
80
100
120
140
2017
Hess Bakken Net Production (MBoe/d)
~15-20%
forward
annual
growth1
Note: See appendix for definition of Adjusted EBITDA and a reconciliation to GAAP financials.
(1) Hess projection of approximate 15-20% per annum growth in net production from 2017 to 2020, based on 6 rigs
Existing
Under Construction
$23.3
$119.3
Adjusted EBITDA ($MM)
Adjusted EBITDA
attributable to HESM
Consolidated EBITDA
(HIP + HESM)
Q1 18
12
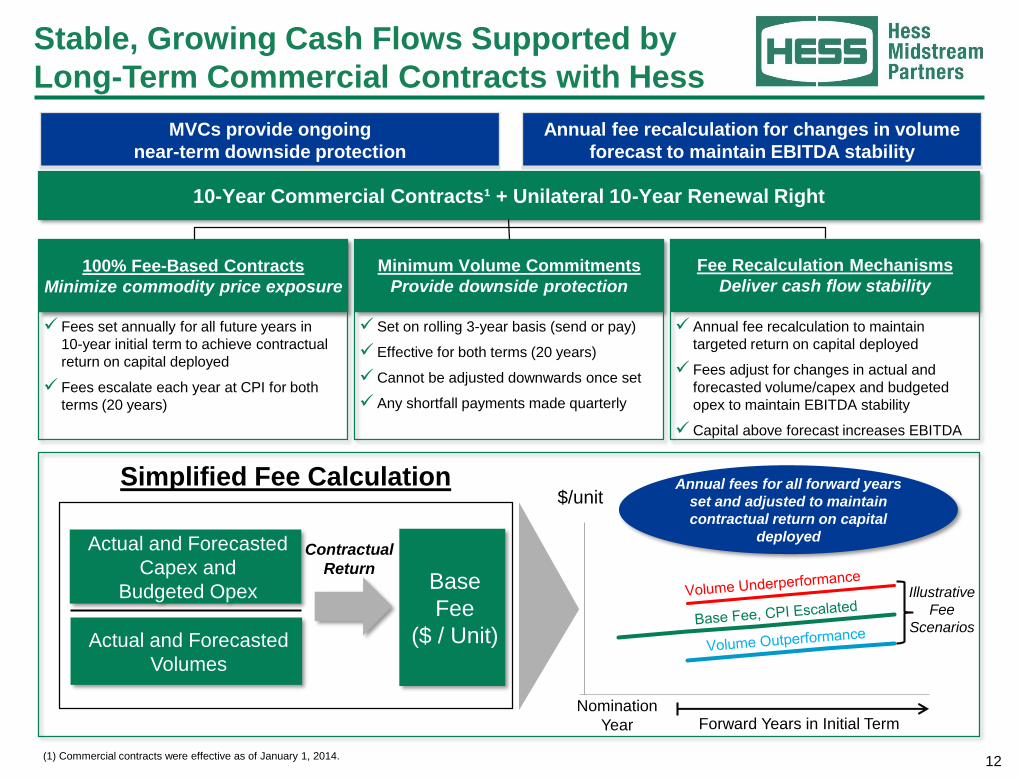
Stable, Growing Cash Flows Supported by
Long-Term Commercial Contracts with Hess
(1) Commercial contracts were effective as of January 1, 2014.
10-Year Commercial Contracts¹ + Unilateral 10-Year Renewal Right
100% Fee-Based Contracts
Minimize commodity price exposure
Minimum Volume Commitments
Provide downside protection
Fee Recalculation Mechanisms
Deliver cash flow stability
✓ Fees set annually for all future years in
10-year initial term to achieve contractual
return on capital deployed
✓ Fees escalate each year at CPI for both
terms (20 years)
✓ Set on rolling 3-year basis (send or pay)
✓ Effective for both terms (20 years)
✓ Cannot be adjusted downwards once set
✓ Any shortfall payments made quarterly
✓ Annual fee recalculation to maintain
targeted return on capital deployed
✓ Fees adjust for changes in actual and
forecasted volume/capex and budgeted
opex to maintain EBITDA stability
✓ Capital above forecast increases EBITDA
Simplified Fee Calculation
Actual and Forecasted
Volumes
Base
Fee
($ / Unit)
1
1 2 3 4 5
$/unit
Nomination
Year Forward Years in Initial Term
Illustrative
Fee
Scenarios
Actual and Forecasted
Capex and
Budgeted Opex
Contractual
Return
Annual fees for all forward years
set and adjusted to maintain
contractual return on capital
deployed
Annual fee recalculation for changes in volume
forecast to maintain EBITDA stability
MVCs provide ongoing
near-term downside protection
13
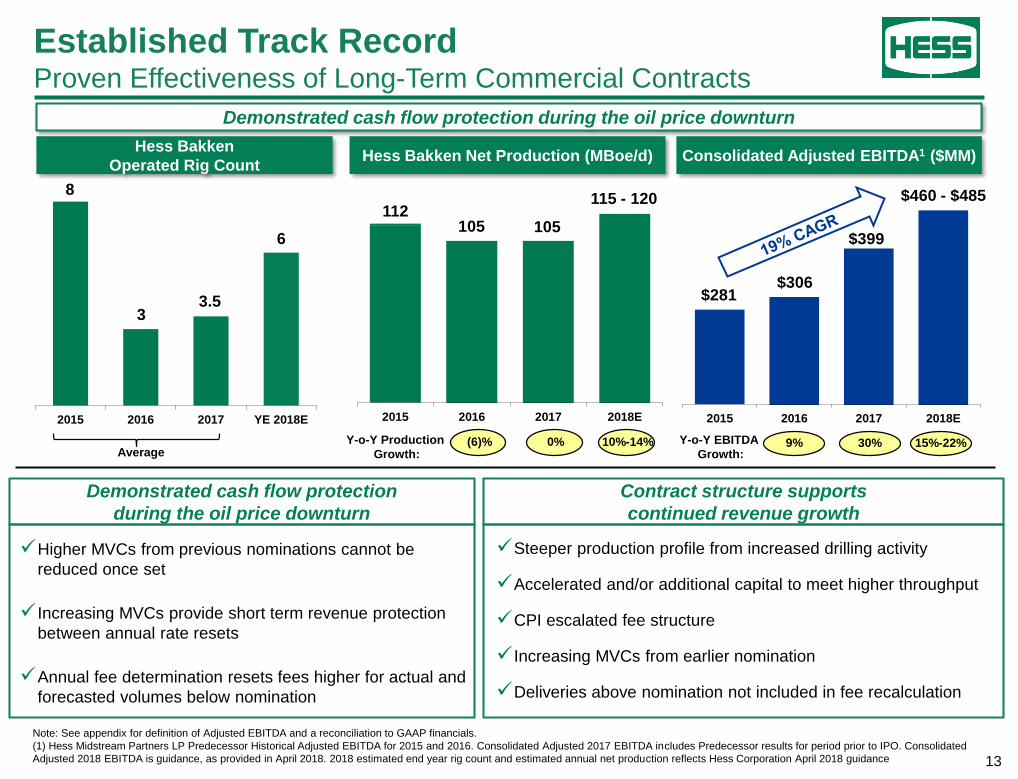
Established Track RecordProven Effectiveness of Long-Term Commercial Contracts
-
1
2
3
4
5
6
7
8
2015 2016 2017 YE 2018E
8
Hess Bakken
Operated Rig CountHess Bakken Net Production (MBoe/d) Consolidated Adjusted EBITDA1 ($MM)
2015 2016 2017 2018E
100
150
200
250
300
350
400
450
500
2015 2016 2017 2018E
33.5
6
112105 105
$281$306
$460 - $485
AverageY-o-Y EBITDA
Growth:30%9%Y-o-Y Production
Growth:0%(6)%
Note: See appendix for definition of Adjusted EBITDA and a reconciliation to GAAP financials.
(1) Hess Midstream Partners LP Predecessor Historical Adjusted EBITDA for 2015 and 2016. Consolidated Adjusted 2017 EBITDA includes Predecessor results for period prior to IPO. Consolidated
Adjusted 2018 EBITDA is guidance, as provided in April 2018. 2018 estimated end year rig count and estimated annual net production reflects Hess Corporation April 2018 guidance
Demonstrated cash flow protection during the oil price downturn
115 - 120
10%-14% 15%-22%
$399
Contract structure supports
continued revenue growth
Demonstrated cash flow protection
during the oil price downturn
✓Steeper production profile from increased drilling activity
✓Accelerated and/or additional capital to meet higher throughput
✓CPI escalated fee structure
✓ Increasing MVCs from earlier nomination
✓Deliveries above nomination not included in fee recalculation
✓Higher MVCs from previous nominations cannot be
reduced once set
✓ Increasing MVCs provide short term revenue protection
between annual rate resets
✓Annual fee determination resets fees higher for actual and
forecasted volumes below nomination
14
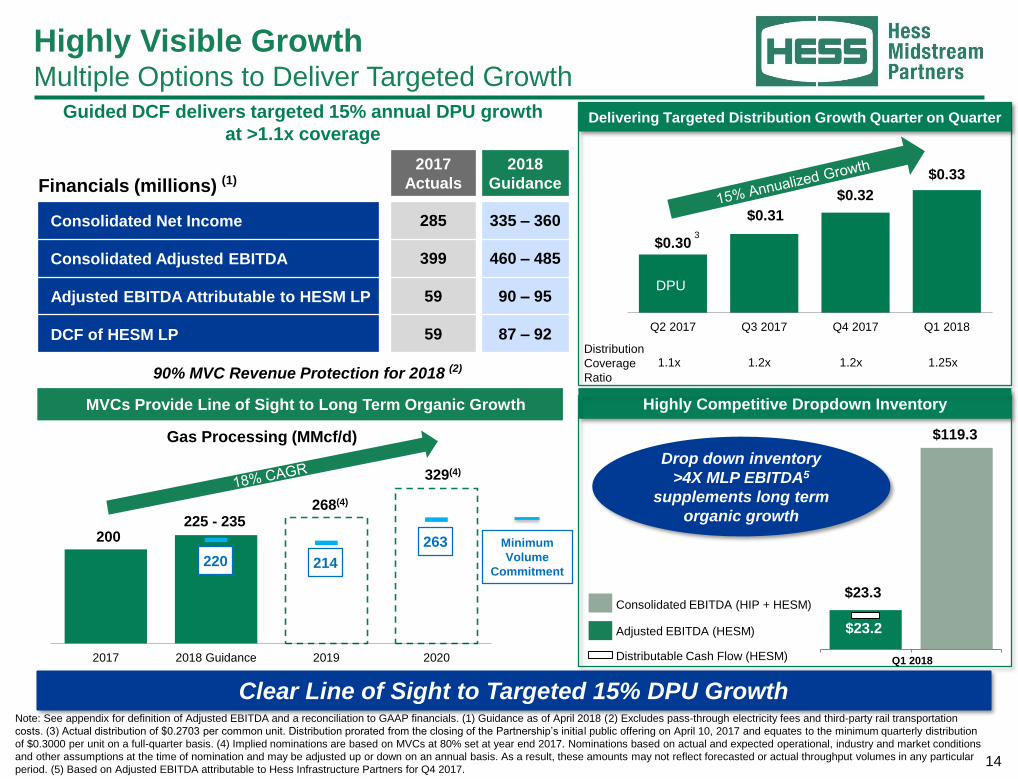
Clear Line of Sight to Targeted 15% DPU Growth
MVCs Provide Line of Sight to Long Term Organic Growth
Highly Visible GrowthMultiple Options to Deliver Targeted Growth
Financials (millions) (1)
2017
Actuals
2018
Guidance
Consolidated Net Income 285 335 – 360
Consolidated Adjusted EBITDA 399 460 – 485
Adjusted EBITDA Attributable to HESM LP 59 90 – 95
DCF of HESM LP 59 87 – 92
Guided DCF delivers targeted 15% annual DPU growth
at >1.1x coverage
Highly Competitive Dropdown Inventory
Adjusted EBITDA (HESM)
Consolidated EBITDA (HIP + HESM)
Distributable Cash Flow (HESM) Q1 2018
Drop down inventory
>4X MLP EBITDA5
supplements long term
organic growth
$0.30
$0.31
$0.32
$0.33
0
0
0
0
0
0
0
0
0
Q2 2017 Q3 2017 Q4 2017 Q1 2018
Delivering Targeted Distribution Growth Quarter on Quarter
3
DPU
Distribution
Coverage
Ratio
1.1x 1.2x 1.2x90% MVC Revenue Protection for 2018 (2)
$119.3
$23.3
$23.2
1.25x
0
50
100
150
200
250
300
350
2017 2018 Guidance 2019 2020
200225 - 235
268(4)
329(4)
Gas Processing (MMcf/d)
263
214220
Minimum
Volume
Commitment
Note: See appendix for definition of Adjusted EBITDA and a reconciliation to GAAP financials. (1) Guidance as of April 2018 (2) Excludes pass-through electricity fees and third-party rail transportation
costs. (3) Actual distribution of $0.2703 per common unit. Distribution prorated from the closing of the Partnership’s initial public offering on April 10, 2017 and equates to the minimum quarterly distribution
of $0.3000 per unit on a full-quarter basis. (4) Implied nominations are based on MVCs at 80% set at year end 2017. Nominations based on actual and expected operational, industry and market conditions
and other assumptions at the time of nomination and may be adjusted up or down on an annual basis. As a result, these amounts may not reflect forecasted or actual throughput volumes in any particular
period. (5) Based on Adjusted EBITDA attributable to Hess Infrastructure Partners for Q4 2017.
15
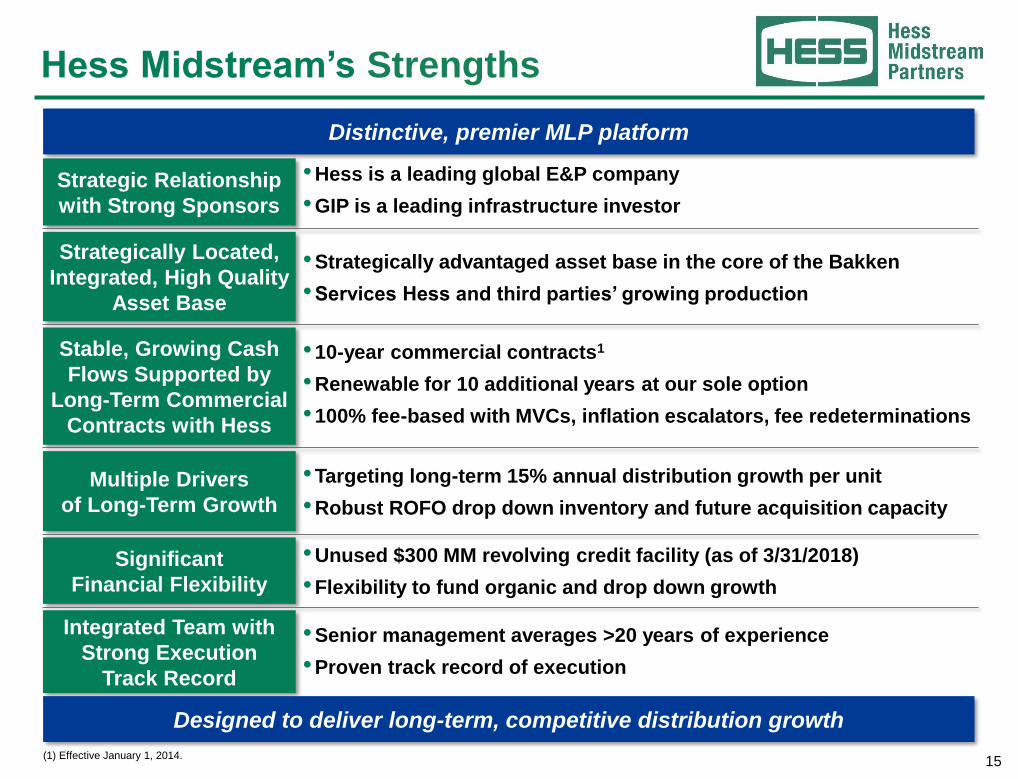
Hess Midstream’s Strengths
Strategic Relationship
with Strong Sponsors
Strategically Located,
Integrated, High Quality
Asset Base
Stable, Growing Cash
Flows Supported by
Long-Term Commercial
Contracts with Hess
Multiple Drivers
of Long-Term Growth
Significant
Financial Flexibility
Integrated Team with
Strong Execution
Track Record
•Hess is a leading global E&P company
•GIP is a leading infrastructure investor
•Strategically advantaged asset base in the core of the Bakken
•Services Hess and third parties’ growing production
•10-year commercial contracts1
•Renewable for 10 additional years at our sole option
•100% fee-based with MVCs, inflation escalators, fee redeterminations
•Targeting long-term 15% annual distribution growth per unit
•Robust ROFO drop down inventory and future acquisition capacity
•Unused $300 MM revolving credit facility (as of 3/31/2018)
•Flexibility to fund organic and drop down growth
•Senior management averages >20 years of experience
•Proven track record of execution
Designed to deliver long-term, competitive distribution growth
Distinctive, premier MLP platform
(1) Effective January 1, 2014.
17
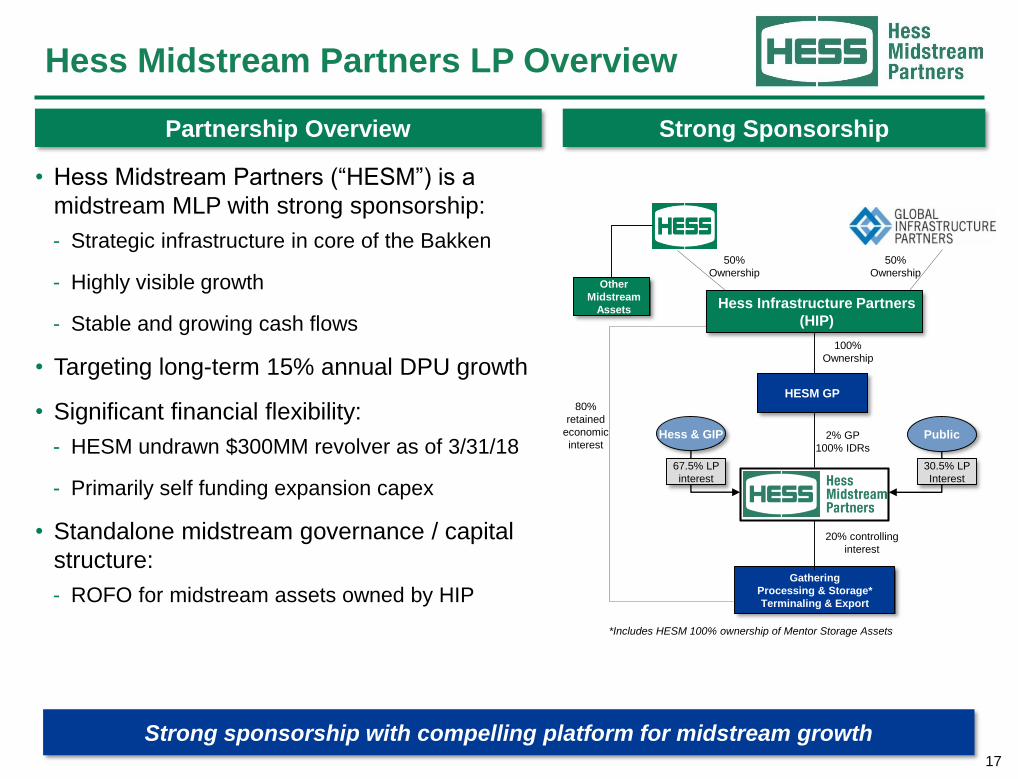
Hess Midstream Partners LP Overview
• Hess Midstream Partners (“HESM”) is a
midstream MLP with strong sponsorship:
- Strategic infrastructure in core of the Bakken
- Highly visible growth
- Stable and growing cash flows
• Targeting long-term 15% annual DPU growth
• Significant financial flexibility:
- HESM undrawn $300MM revolver as of 3/31/18
- Primarily self funding expansion capex
• Standalone midstream governance / capital
structure:
- ROFO for midstream assets owned by HIP
Partnership Overview Strong Sponsorship
PublicHess & GIP
67.5% LP
interest
30.5% LP
Interest
Gathering
Processing & Storage*
Terminaling & Export
Hess Infrastructure Partners
(HIP)
Other
Midstream
Assets
HESM GP
50%
Ownership
50%
Ownership
2% GP
100% IDRs
100%
Ownership
20% controlling
interest
*Includes HESM 100% ownership of Mentor Storage Assets
Strong sponsorship with compelling platform for midstream growth
80%
retained
economic
interest
18
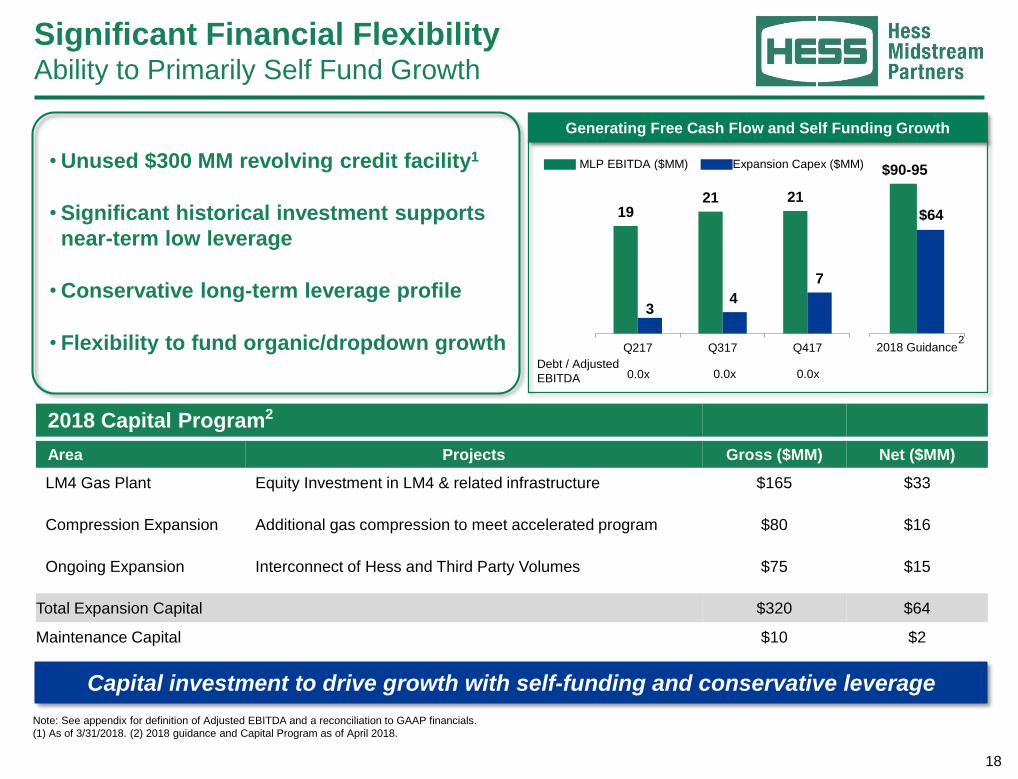
Significant Financial FlexibilityAbility to Primarily Self Fund Growth
Capital investment to drive growth with self-funding and conservative leverage
• Unused $300 MM revolving credit facility1
• Significant historical investment supports
near-term low leverage
• Conservative long-term leverage profile
• Flexibility to fund organic/dropdown growth
Note: See appendix for definition of Adjusted EBITDA and a reconciliation to GAAP financials.
(1) As of 3/31/2018. (2) 2018 guidance and Capital Program as of April 2018.
Debt / Adjusted
EBITDA 0.0x 0.0x 0.0x
1921 21
34
7
-
5
10
15
20
25
30
Q217 Q317 Q417
Generating Free Cash Flow and Self Funding Growth
-
10
20
30
40
50
60
70
80
90
100
2018 Guidance
$64
2018 Capital Program2
Area Projects Gross ($MM) Net ($MM)
LM4 Gas Plant Equity Investment in LM4 & related infrastructure $165 $33
Compression Expansion Additional gas compression to meet accelerated program $80 $16
Ongoing Expansion Interconnect of Hess and Third Party Volumes $75 $15
Total Expansion Capital $320 $64
Maintenance Capital $10 $2
2
MLP EBITDA ($MM) Expansion Capex ($MM) $90-95
19
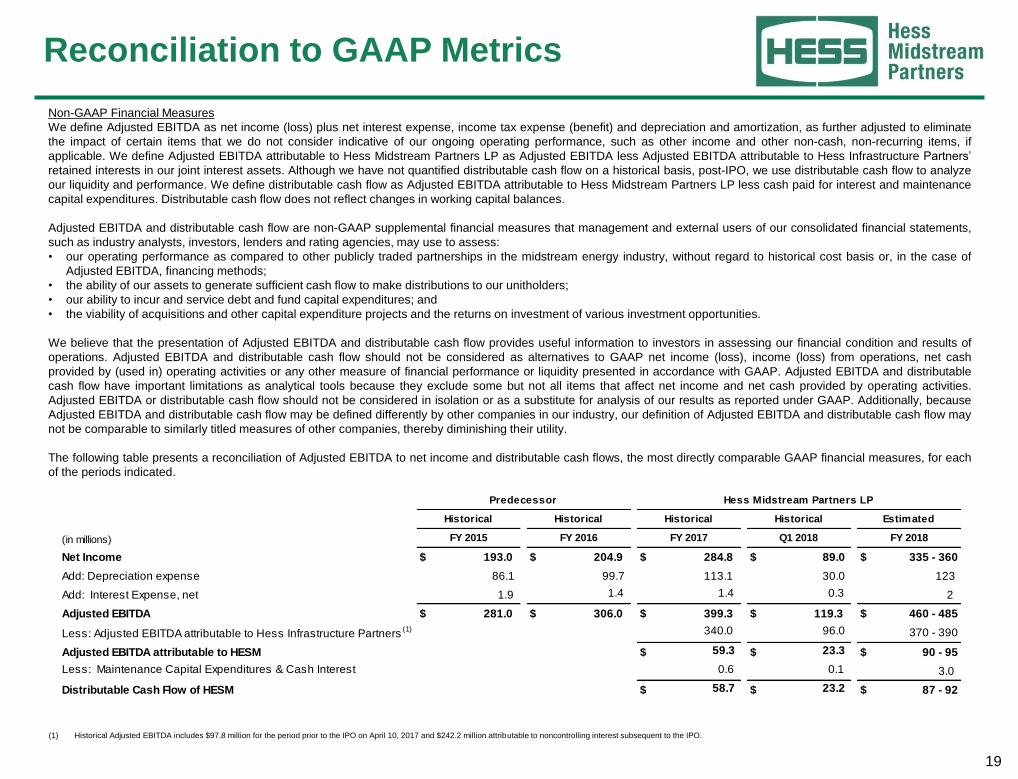
Reconciliation to GAAP Metrics
Non-GAAP Financial Measures
We define Adjusted EBITDA as net income (loss) plus net interest expense, income tax expense (benefit) and depreciation and amortization, as further adjusted to eliminate
the impact of certain items that we do not consider indicative of our ongoing operating performance, such as other income and other non-cash, non-recurring items, if
applicable. We define Adjusted EBITDA attributable to Hess Midstream Partners LP as Adjusted EBITDA less Adjusted EBITDA attributable to Hess Infrastructure Partners’
retained interests in our joint interest assets. Although we have not quantified distributable cash flow on a historical basis, post-IPO, we use distributable cash flow to analyze
our liquidity and performance. We define distributable cash flow as Adjusted EBITDA attributable to Hess Midstream Partners LP less cash paid for interest and maintenance
capital expenditures. Distributable cash flow does not reflect changes in working capital balances.
Adjusted EBITDA and distributable cash flow are non-GAAP supplemental financial measures that management and external users of our consolidated financial statements,
such as industry analysts, investors, lenders and rating agencies, may use to assess:
• our operating performance as compared to other publicly traded partnerships in the midstream energy industry, without regard to historical cost basis or, in the case of
Adjusted EBITDA, financing methods;
• the ability of our assets to generate sufficient cash flow to make distributions to our unitholders;
• our ability to incur and service debt and fund capital expenditures; and
• the viability of acquisitions and other capital expenditure projects and the returns on investment of various investment opportunities.
We believe that the presentation of Adjusted EBITDA and distributable cash flow provides useful information to investors in assessing our financial condition and results of
operations. Adjusted EBITDA and distributable cash flow should not be considered as alternatives to GAAP net income (loss), income (loss) from operations, net cash
provided by (used in) operating activities or any other measure of financial performance or liquidity presented in accordance with GAAP. Adjusted EBITDA and distributable
cash flow have important limitations as analytical tools because they exclude some but not all items that affect net income and net cash provided by operating activities.
Adjusted EBITDA or distributable cash flow should not be considered in isolation or as a substitute for analysis of our results as reported under GAAP. Additionally, because
Adjusted EBITDA and distributable cash flow may be defined differently by other companies in our industry, our definition of Adjusted EBITDA and distributable cash flow may
not be comparable to similarly titled measures of other companies, thereby diminishing their utility.
The following table presents a reconciliation of Adjusted EBITDA to net income and distributable cash flows, the most directly comparable GAAP financial measures, for each
of the periods indicated.
(1) Historical Adjusted EBITDA includes $97.8 million for the period prior to the IPO on April 10, 2017 and $242.2 million attributable to noncontrolling interest subsequent to the IPO.
Net Income $ 193.0 $ 204.9 $ 284.8 $ 89.0 $ 335 - 360
Add: Depreciation expense 86.1 99.7 113.1 30.0 123
Add: Interest Expense, net 1.9 1.4 1.4 0.3 2
Adjusted EBITDA $ 281.0 $ 306.0 $ 399.3 $ 119.3 $ 460 - 485
Less: Adjusted EBITDA attributable to Hess Infrastructure Partners(1) 340.0 96.0 370 - 390
Adjusted EBITDA attributable to HESM $ 59.3 $ 23.3 $ 90 - 95
Less: Maintenance Capital Expenditures & Cash Interest 0.6 0.1 3.0
Distributable Cash Flow of HESM $ 58.7 $ 23.2 $ 87 - 92
Historical
Q1 2018
Historical
FY 2015
Hess Midstream Partners LPPredecessor
(in millions)
Historical Historical Estimated
FY 2016 FY 2017 FY 2018