Embed Size (px)
Citation preview
State, Society and Democracy
264
Voting Behaviour in Namibia1
Christiaan Keulder
IntroductionElections are the cornerstones of democracy. If democracy is broadly defined to mean “responsive government or rule”2 , then elections are one of the tools that ensure responsive government. It is through elections that citizens appoint their representatives and hold them accountable.3 Elections also fulfil the important function of generating legitimacy for the organs of government. Together with economic growth and efficiency, legitimacy is often regarded as a key aspect for political stability.4
Since Independence in 1990 Namibians have been to the polls six times:
1 Excerpted and adapted from Keulder (1998). 2 The notion of responsive government/rule holds that there should be “necessary correspondence
between the acts of government and the equally weighted express wishes of citizens with respect to those acts” (Saward 1994:13).
3 Most theories of representation share two assumptions: 1) that sovereignty lies with the people and that Government is responsible to the people; and 2) that the will of the majority is more important than the will of the minorities (Ball 1981:119).
4 One often-used definition of legitimacy holds that it “involves the capacity of the system to engend- er and maintain the belief that the existing political institutions are the most appropriate ones for
the society” (Lipset 1984:88).
Number Election Year
1 Constituent Assembly 1989 (pre-Independence)
2 Regional Councils 1992
3 Local Authorities 1992
4 President and National Assembly 1994
5 Local Authorities 1998
6 Regional Councils 1998
7 President and National Assembly 1999
Table 1: Elections in Namibia
This paper will only be addressing the first five elections listed above. Where mention is made of the 1998 elections, this refers only to the Local Authority Elections in that year.
Voting Behaviour in Namibia
265
At least one trend that runs through all the elections at issue here is the declining voter turnouts. During the founding election of 1989, about 97% of all registered voters cast a vote. For the 1992 elections the voter turnout declined to 83% and for the 1994 elections it dropped further to 76%. Despite the decline, the overall or average turnout was considered “healthy”. Perhaps most expected a further decline for the 1998 elections, but few expected the decline to be so sharp: only slightly more than 33% of registered voters cast a vote. This effectively suggests adrop of 50% from the last Local Authority Elections (1992), despite an increase inthe number of registered voters.
Given the importance of elections, the study of voting behaviour is important as well. Thus far, two exit poll surveys of voters have been done, but generally, opin-ion polling does not feature strongly in Namibian politics. This adds to the impor-tance of studies on voting behaviour when and if they are done. Given the fact thatvoting behaviour is such a contentious and dynamic field, exit polling is not enough.In many respects it can only provide us with useful clues or propositions about thequalitative aspects of voter behaviour.5
Explaining the VoteThe study of voting behaviour is perhaps the most developed field in the disci-pline of political science. The body of literature is enormous and the methodolo-gies have become considerably sophisticated. At the same time, academics, party campaigners, the media and polling organisations have become bound together into symbiotic networks (Dunleavy 1990:460). Given the interest in and the im-portance of understanding voting behaviour, the debates on the effects of the re-search organisation, methodology, theories and “system biases” on our understand-ing of voting behaviour are as intense as ever.6 In recent years the contributions from other disciplines such as political geography and psychology have extended the scope of voting behaviour research well beyond its traditional focus.
In sharp contrast to the state of the field in advanced democracies, the study ofvoting behaviour is yet to assume its rightful place in the broad discipline of Afri-can studies. In addition, relatively few African scholars and Africanists have in-cluded voting behaviour in their research programmes.7 Instead, most of the re-cent work accompanying the “third wave of democracy” has maintained a strong
5 In the concluding part of this essay some of the alternative methodologies and unanswered ques- tions are discussed. 6 The body of country-specific literature is far too large to reflect here. For useful overviews in the
British, Canadian and American contexts see Catt (1996), Dunleavy (1990), Kinder & Kiewiet (1981), Gidengil (1992), Dalton (1988) and Niemi & Weisberg (1978).
7 There are exceptions. On the African continent, South African institutions such as the Institute for Democracy in South Africa, the University of Stellenbosch and the Human Sciences Research Council have led the field. Recently, the Department of Political Science at the University of
State, Society and Democracy
266
focus on institutions, policies, leadership and transformation politics in general. Where studies have focused on elections, their focus has usually been limited to the associated processes, structures and outcomes, but has not been extended to include the voters.8 As a result, we know little about voters in Africa.9
We also know relatively little about the tools for studying African voters. Can weimport the techniques used elsewhere? Should we use the same assumptions and explanatory frameworks? Should we develop new ones or can we successfully adapt existing ones to fit local conditions? Perhaps the most important question ofall is whether voters in Africa are any different from voters elsewhere. Do they vote for the same reasons?
African scholars such as Mafeje (1991, 1996) have been calling for Africans totake ownership of their epistemology: to develop conceptual frameworks “uniquely”African both in origin and content. For him, the “indigenisation of the social sci-ences” is part of the battle against the “intellectual hegemony” of the North.
At least part of Mafeje’s (1971) battle is against the ethnographic construction of the African reality. In this construction tribal and ethnic divisions are regarded asthe primary explanatory variables. Horowitz (1985:xi) writes that -
[E]thnicity is at the centre of politics in country after country, a potent source of challenges to the cohesion of states and of international tension. Connections among Biafra, Bangladesh and Burundi, Beirut, Brussels and Belfast were at first hesitantly made – isn’t one “tribal”, one “linguistic”, another “religious”? – but that is true no longer. Ethnicity has fought and bled and burned its way into public and scholarly consciousness.
Although the study of ethnicity is by no means confined to African societies, its importance for scholars of Africa has contributed to the marginalisation of Africa from mainstream political science. In this way African societies and peoples have attained some unique and exotic status in scholarship. The status of African socie-ties and peoples as the “other” reinforced the arguments in favour of a different set of methodological tools.
I do not accept these arguments. Like Sartori (1995:101), I believe that ideas should not be rejected (or accepted) on the basis of where they originated. Instead, they should be tested for validity and for their ability to “travel”. They should be
Zambia and the Electoral Institute of South Africa have circulated proposals with a special voter and electoral focus. In Europe, the programme(s) of the Institute of Development Studies at the University of Helsinki are noteworthy.
8 One need only survey the works listed in the bibliography of Crowen and Laakso’s (1997) article entitled “An overview of election studies in Africa” to realise this: none of the listed titles makes special reference to “voters” or “voting behaviour”.
9 One has to be fair to African scholars and concede that the political and institutional conditions on the continent have hardly allowed for extensive survey research. Not only is it costly, but institu-
tional support and the infrastructure required have also been lacking. Societal distrust, violence and instability have also limited the prospects for fieldwork.
Voting Behaviour in Namibia
267
adapted, accepted or rejected in areas where local conditions demand such ac-tions. First, however, they should be tested. I accept that, en route, new discover-ies will be made and new ideas will surface. Old ones will become superfluous, lose credibility or regain it. The outcome is uncertain and the process, perhaps, one of trial and error.
The models of voting behaviour discussed here form part of mainstream debates in the USA, Britain, Canada, Germany and France. It is our aim to see how well they “travel”, i.e. whether and to what extent such models help us to understand voting behaviour in Namibia.
The following models are discussed below: the ethnic vote, the party identifica-tion (loyalty) vote, the protest vote, the tactical vote, the pocket-book vote and thesociotropic vote.
The Ethnic VoteEthnically divided societies seem to produce ethnic voters and ethnic parties. Horowitz (1985:320) defines ethnic voting as -
... voting for the party identified with the voters’ own ethnic group, no matter who the individual candidates happen to be.
According to Mattes and Gouws (1998:1), ethnic parties are those that derive an “overwhelming” proportion of their support from members of one ethnic group orcluster of groups, to the exclusion of others. For Horowitz (1985:298), ethnic parties exist where “party boundaries stop at group boundaries ... regardless of whether any group is represented by more than one party”.
Ethnic parties are seldom “pure”: instead, they commonly feel the need to pre-serve afaçade of multi-ethnicity. The inclusion of “others” in ethnic parties’ lead-ership structures and on their candidate lists serves purposes other than those of creating truly multi-ethnic enterprises.10 In this line of argument, then, the true nature of a political party (ethnic or multi-ethnic) is to be found in its support base,not its leaders or candidates.
In ethnically divided societies, Horowitz (1985) argues, elections are mere eth-nic censuses as voting is based on ascriptive means. That is, the outcome will merely confirm the numerical dominance of the ethnic majority. What is more, where some voters express ethnic votes, they tend to drive out non-ethnic votes. He maintains that (1985:323) –
[T]he incentives toward reactive ethnic voting are strong. When voters of one group choose, in effect, not to choose, but to give their vote predictably on an ethnic basis toan ethnically defined party, they put voters of the other group who choose amongparties at a collective disadvantage. All else being equal, such voters will seek toreduce their disadvantage by concentrating their votes in a comparable ethnic party. Insuch a situation, ethnic votes tend to drive out non-ethnic votes.
10 See Horowitz (1985:320)
State, Society and Democracy
268
Ethnic voters do not choose, they register their (ethnic) identity. As a result, theexercise of voting is a predictable affair and the outcome of the elections a cer-tainty, as it is the demographic majority that will win. The only uncertainty is whether a potential voter will vote. Voter turnout is high “at the time when it is most important that all ethnic-group members be counted” (Horowitz 1985:328).
Despite its instant appeal to many analysts, the ethnic vote theory suffers from several methodological and theoretical problems.11 The first relates to the unit ofanalysis. In the ethnic vote theory, the group – and not the individual – is the primary unit of analysis. Hence, this type of analysis is based on group-level vot-ing patterns. This in itself is not the problem: but Horowitz (1985) uses the group-level voting patterns to infer individual-level motivations, and in doing so com-mits a serious ecological fallacy (Mattes & Gouws 1998:2). Secondly, ethnic vot-ing is more often assumed than proved. We need individual-level data on voter motivation and should not rely on post hoc analyses of electoral results. Linking demographic variables (such as race and language) to party choice does not pro-vide any meaningful grounds for “proving” ethnic voting. What is needed are data on ethnic solidarity as motivation for voting and party selection. The only way tocollect this is to ask voters about their voting motivations and party choices, rather than relying on post hoc inferences.12
Thirdly, the ethnic vote thesis eliminates all other possible explanations of thevote without putting them to the test. This amounts to a monolithic explanation ofthe vote. It is assumed, but not proved, that all voters are motivated and informed about party choice by ascriptive means rather than the contents of party pro-grammes, the quality of the candidates, their own economic position, etc. Partisan support is presumably “fixed” and constant – making voter volatility impossible. It negates the impact of a range of other potential influences on the vote, such as information, perceptual filters and socio-economic conditions. The only informa-tion an ethnic voter needs is when elections will take place, and which party rep-resents which ethnic group’s interests.
The Party Identification (Loyalty) VoteBriefly put, the party identification or loyalty explanation is based on two main premises: choosing the “best option”, and voting as a sign of support (Catt 1996:21).Catt (op cit.:23) argues that -
[T]he unstated assumption is that voters are deciding which party they like best and that they then indicate the result of their decision by voting for that party.
11 For my critique of the ethnic vote thesis, I made extensive use of the ideas contained in Mattes & Gouws (1998).
12 It is quite possible that ethnic and non-ethnic voters can coexist within the same party. Without motivational data, however, we cannot distinguish between them.
Voting Behaviour in Namibia
269
The vote is, thus, an indication of preference. Once cast, a vote is seen as a sign of support for a specific party. Some analysts (see Butler & Stokes 1974; cited in Catt 1996:26) have interpreted support as being a “strong commitment to” a spe-cific party, arguing the voters develop a partisan self-image. Voters think of them-selves as supporters of a specific party in a lasting sense, meaning that party sup-port is relatively stable and durable. The vote, as an expression of support, is oftenseen as a “hundred percent endorsement of everything a party says or stands for” (Rose & McAllister 1986; cited in Catt 1996:29). The implication is that loyalty voters regard their party as the best: on all issues, at all times and during all elec-tions. Their support is almost completely unconditional, giving party representa-tives almost blanket permission to carry out their tasks. Issues are not as impor-tant: the party in power is. There is no single, uniform basis for loyalty, however. It can differ from country to country and from party to party.13 The challenge, therefore, is first and foremost to establish the basis of party identification and loyalty. Secondly, we have to establish the mechanisms through which loyalty is cultivated and sustained. Thirdly, we need to investigate the durability of loyalty by looking at the factors corroding or strengthening it.
Party identification or loyalty votes are indicative of a stable electorate. Swingsare unusual, and unless something extraordinary happens, outcomes are predict-able as voter volatility is low. The party system, therefore, tends to be a stable oneas well.
However, there are also some problems with the loyalty argument. The first prob-lem stems from the assumption that the vote is an unequivocal expression of sup-port. This assumption chooses to ignore other motivations for the vote. It ignores or chooses to ignore the possibility of protest or tactical voting (see later herein). In neither of those cases is the vote a sign of endorsement: instead, it is “just a preference given the current situation” (Catt 1996:29). It also ignores the possibil-ity of negative voting, i.e. where votes are cast not to support, but to punish. The loyalty-vote analysts see “support” – not “preference”.14
The second problem, linked to the first, is the fact that supporters of the loyalty thesis choose to ignore alternative motivations for voting. In this respect, the latterthesis is also a monolithic explanation. It not only chooses to ignore voters’ pref-
13 In Britain, for example, the basis of party loyalty is long perceived to be class. In South Africa some have argued race and/or ethnic group to be the basis (see the overview in Mattes & Gouws
1998). 14 Chambers (1977; cited in Catt 1996:26) distinguishes between preference and support in the following manner: “Preference is the art of choosing, favouring or liking one above another, while
support is to uphold, to back-up, to supply with the means of living”. Preference can be short-term and can change quite frequently depending on the situation at hand. Support is long-term and less susceptible to rapid and frequent change. Preference can be based on positive as well as negative motivations and is generally associated with higher voter volatility. Support, on the other hand, is regarded as a positive motivation and is associated with voter stability.
State, Society and Democracy
270
erences, but also assumes that all voters vote or select their “best party” on the same basis. If we cannot accept that all votes are indications of support, then we cannot accept that all voters share the same views on what is “best”. The same voter can hold several ideas of what is “best” and these may vary across time and space. The same voter may, therefore, vote for different parties during different elections depending on his or her needs. The “best party” may, thus, be several parties, depending on whether the voter wants to support, protest or punish.
The Protest VoteNot all motivations to vote are positive; and negative motivations to vote result ina negative vote. Catt (1996:41) states that -
[I]n its simplest form, a negative vote is one cast for a party because that party is notanother, strongly disliked party. A negative voter may well like the party voted for, butwhat makes it a negative vote is that the dislike is stronger than the like. (emphasis added)
One strong negative view can outweigh several mild positive ones; as a result, anegative motivation to vote or choose is just as important as the positive one. Negative motivations to vote can flow from negative campaigning and its impact on voter anxiety and fear.15 For a better understanding of why a voter selected aspecific party, and to take account of the possibility of negative votes, Catt (1996:43)suggests that -
[U]sing information on how each voter feels about the whole range of parties facili-tates the identification of voters whose strongest feeling is negative (or positive) and those who have negative feelings towards most of the parties.
Negative voting can occur in constituencies with only two parties, but the chances are better (as choices are wider) in those with three or more parties. Very often, thevoters’ choice amounts to the lesser of two (or more) “evils”. Negative voting suggests higher levels of voter volatility, although party officials and representa-tives are keen to see all votes as indications of support. The challenge, therefore, is to identify negative votes (and very often it is up to the analysts to do so) and toseparate them from true votes of support.
The Tactical VoteTactical voting can only occur in constituencies with more than two different par-ties and/or candidates. Tactical voting occurs when voters have a strong urge to prevent a certain strongly disliked party from winning. To achieve this outcome
15 Negative campaigns emphasise the dire consequences of a victory for the other side rather than the beneficial results of a win for the party behind the campaign (Catt 1996:43). Negative campaigns can target both issues and a party’s or candidate’s image. For the impact of negative advertising on candidate evaluations, see Pinkleton (1997). For an analysis of the impact of anxiety and enthusi-
asm on the vote, see Marcus & MacKuen (1993).
Voting Behaviour in Namibia
271
they would vote for a party (not their usual choice) purely because it has the best chance of winning against the least-liked party. Catt’s (1996:46) definition of tac-tical voting is worth quoting here:
A tactical vote is cast for a party that is your second (or third or fourth) preference, because you think they have the chance of defeating a strongly disliked party.
Voters cannot be sure of this outcome, but they nevertheless perceive it as a real possibility; hence, it is not the actual outcome that matters, but the motivation for party choice. However, the reasons for tactical voting can, and often do, extend beyond the narrow goal of defeating the strongly disliked party. Galbraith and Rae(1989:126) argue that –
“[T]actical” or “strategic” voting can be defined as voting other than for one’s pre-ferred party or candidate in order to increase the probability of a satisfactory overall outcome. (emphasis added)
Although preventing the most-disliked party from winning is certainly an impor-tant consideration, one cannot exclude other considerations like achieving a bal-ance of power, creating and maintaining strong opposition to the dominant party, and making sure smaller parties are represented. In this sense, tactical voting is not inspired by negative motivations only. In fact, in electoral systems where one party dominates, minority and small-party representation can become an impor-tant consideration for voting tactically. Here, no single other party might have even a reasonable chance of winning, but a tactical vote might bring representa-tion (even if it is only a single seat). Although analysts have frequently made use of aggregate electoral data to determine tactical voting (see e.g. Galbraith & Rae 1989), this approach is problematic. Catt (1996:47) identifies three separate atti-tudes that converge to bring about a tactical vote:
1. great dislike of one party and the subsequent desire to see them defeated2. the desire to cast a strategic vote, and3. a willingness to gather information on the best way to cast an effective vote
(i.e. vote for whom it matters most).
Tactical voters, like protest voters, are not “loyalty voters” and their votes should not be interpreted as “support votes”. Instead, their votes reflect preferences, usu-ally short-term, and they are therefore “volatile voters”. Thus, to detect tactical voting, we need to understand voters’ motivations and choices and, hence, we require individual-level data.
The Pocket-book VotePocket-book voting is the first of two issue-based voting models discussed here (for the second, see the section on the sociotropic vote below). Issue-based mod-els share the assumption that voters are rational, that is, that they collect informa-tion, consider all their options based on the information gathered, and then, in a
State, Society and Democracy
272
non-emotive manner, decide on the “best option” and the party that is “best equipped” to bring about the “best option”.
Kinder and Kiewiet (1981:130) describe pocket-book voters as those –... swayed most of all by the immediate and tangible circumstances of their private lives. Citizens preoccupied with their pocketbooks support candidates and parties thathave advanced their economic interests and oppose candidates and parties that appear to threaten them.
For pocket-book voters, what matters most are their personal economic experi-ences. Information about who to vote for is based on personal experience and decisions made; hence, the usual costs incurred when collecting information about the political world are significantly reduced (Kinder & Kiewiet 1981). Usable political information includes retail prices, mortgage loan interest rates, income tax levels and stock prices. Pocket-book voters vote for the party they believe would provide more economic benefits than any other.
The first problem associated with orthodox pocket-book analysis is that it is often incumbency-oriented. In this explanation, a voter tends to defect from theincumbent party or candidate once his or her personal economic position deterio-rates. In this vein, pocket-book voting is the result of negative motivations, caus-ing it to be a negative vote, i.e. a vote against the incumbent(s). According to Kinder and Kiewiet (1981:134), the fact that pocket-book voting can be policy-oriented has thus far received only scant attention.
The second problem is that cross-sectional (aggregate) data are often used to discover pocket-book voters. Analysts have linked personal economic conditions with party identification, not the vote. The problem here is that pocket-book vot-ers might not sacrifice their party identification when they vote for an alternative party. Their shift might only be short-term, and strategic, especially when directed against the incumbent. This cannot be seen as a shift in loyalty, and the orthodoxy of aggregate data will not pick it up. Here again, individual-level data are needed. Panel studies, particularly, should be a suitable methodological alternative as they would facilitate the tracking of shifting votes over longer periods of time.
The Sociotropic VoteSociotropic voting is the opposite of pocket-book voting in the following sense (Kinder & Kiewiet 1981:132):
In reaching political preferences, the prototypic sociotropic voter is influenced most of all by the nation’s economic conditions. Purely sociotropic citizens vote accordingto the country’s pocketbook [and] not their own. Citizens moved by sociotropic infor-mation support candidates that appear to have furthered the nation’s economic well-being and oppose candidates and parties that seem to threaten it.
Although the sociotropic model has not yet attracted the same attention as some of the others discussed here, Kinder and Kiewiet (1981) suggest that, in America
Voting Behaviour in Namibia
273
at least, it has more explanatory value than the pocket-book model. Like the pocket-book voter, the sociotropic voter is considered to be a rational voter, motivated byinformation. Sociotropic voters would be informed by data on the incumbent par-ty’s record in managing the economy, recent trends in the business environment, and a party’s relative degree of competence when it comes to economic matters.
The first problem with sociotropic voting (and this is the case, too, with pocket-book voting) is its assumption of the rationality of the voter. Such approaches make no provision for voting based on emotion. Catt (1996) warns that approaches which discard emotive voting are potentially reductionistic. The second problem with sociotropic (and pocket-book) voting is the economic reductionism contained therein: in more than one way it removes politics from voting.
Towards an Explanation of Voting Behaviour in NamibiaTwo previous studies (Pendleton et al. 1993, Weiland 1996) concluded that the ethnic and party identification models of voting hold truest in Namibia. Given their methodological shortcomings we shall put that conclusion to the test, inves-tigate possible alternative explanations and, hopefully, open up new avenues for further enquiry.
Voter MotivationVoter motivation refers to the decision of any eligible voter to go to the polls to cast (or spoil) a vote. This is perhaps the first of a range of choices that needs to bemade by the potential voter. Voter motivations are answers to the question of “Whydid you vote?”. This is different from the issue of party choice discussed in the section below.
The Pendleton team (1993) found that most people vote because elections are an expression of “freedom and democracy” (59%). The Weiland team (1996) added the response “I have the right to vote” and found it to be the most popular (37%). The “freedom and democracy” option received only 31% of the total responses. From this, two interrelated conclusions are drawn:
1. Namibians vote because they have the right to do so, and2. they vote because they are democrats.
The main problem here is that these responses paint a picture of the vote as something removed from expectations and even, perhaps, purpose.16 This under-standing of voter motivation is incomplete. For example, if voters decide to ab-
stain from voting, should we conclude that they are no longer interested in free-dom and democracy or that they no longer want the right to vote?
16 The nature of the responses is a direct result of the options allowed for by the two teams (Pendleton et al. 1993, Weiland 1996). Both presented respondents with a fixed list of possible answers, hence limiting their options. Neither team provided for the standard “Other” option that usually permits unguided inputs from respondents.
State, Society and Democracy
274
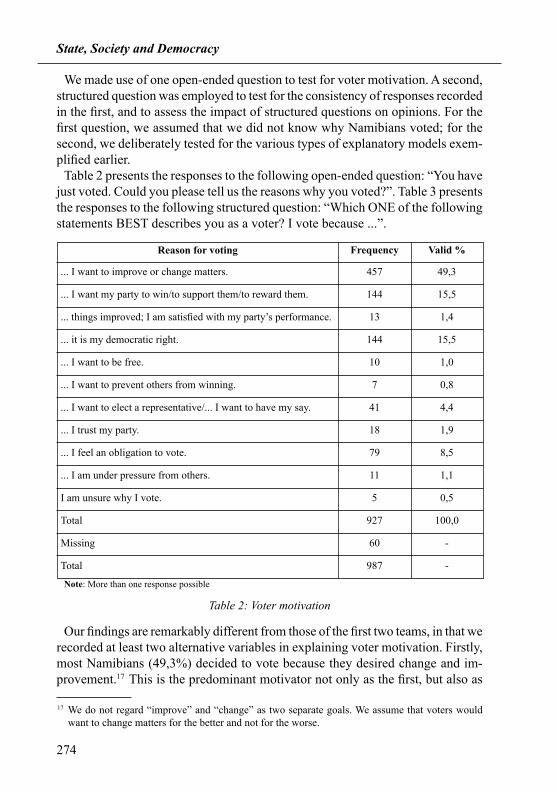
We made use of one open-ended question to test for voter motivation. A second,structured question was employed to test for the consistency of responses recordedin the first, and to assess the impact of structured questions on opinions. For the first question, we assumed that we did not know why Namibians voted; for the second, we deliberately tested for the various types of explanatory models exem-plified earlier.
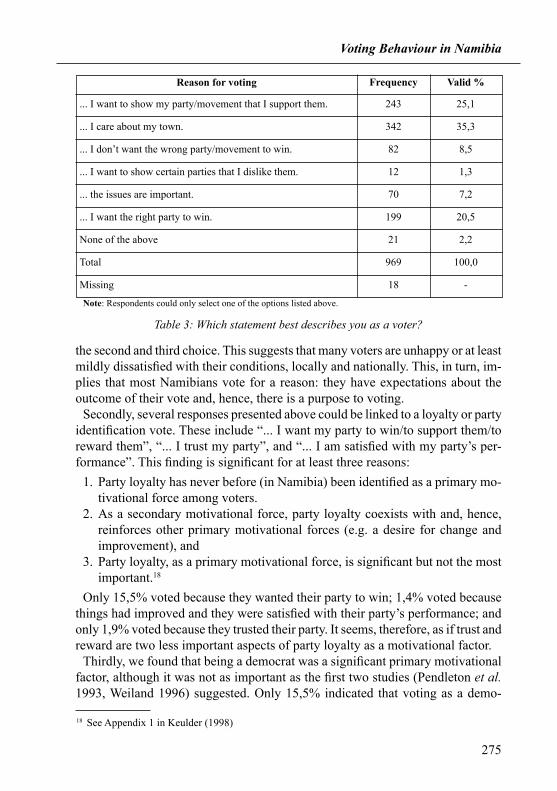
Table 2 presents the responses to the following open-ended question: “You have just voted. Could you please tell us the reasons why you voted?”. Table 3 presents the responses to the following structured question: “Which ONE of the following statements BEST describes you as a voter? I vote because ...”.
Reason for voting Frequency Valid %
... I want to improve or change matters. 457 49,3
... I want my party to win/to support them/to reward them. 144 15,5
... things improved; I am satisfied with my party’s performance. 13 1,4
... it is my democratic right. 144 15,5
... I want to be free. 10 1,0
... I want to prevent others from winning. 7 0,8
... I want to elect a representative/... I want to have my say. 41 4,4
... I trust my party. 18 1,9
... I feel an obligation to vote. 79 8,5
... I am under pressure from others. 11 1,1
I am unsure why I vote. 5 0,5
Total 927 100,0
Missing 60 -
Total 987 -
Table 2: Voter motivation
Note: More than one response possible
Our findings are remarkably different from those of the first two teams, in that we recorded at least two alternative variables in explaining voter motivation. Firstly,most Namibians (49,3%) decided to vote because they desired change and im-provement.17 This is the predominant motivator not only as the first, but also as
17 We do not regard “improve” and “change” as two separate goals. We assume that voters would want to change matters for the better and not for the worse.
Voting Behaviour in Namibia
275
the second and third choice. This suggests that many voters are unhappy or at leastmildly dissatisfied with their conditions, locally and nationally. This, in turn, im-plies that most Namibians vote for a reason: they have expectations about the outcome of their vote and, hence, there is a purpose to voting.
Secondly, several responses presented above could be linked to a loyalty or party identification vote. These include “... I want my party to win/to support them/to reward them”, “... I trust my party”, and “... I am satisfied with my party’s per-formance”. This finding is significant for at least three reasons:
1. Party loyalty has never before (in Namibia) been identified as a primary mo- tivational force among voters.2. As a secondary motivational force, party loyalty coexists with and, hence,
reinforces other primary motivational forces (e.g. a desire for change and improvement), and
3. Party loyalty, as a primary motivational force, is significant but not the most important.18
Only 15,5% voted because they wanted their party to win; 1,4% voted because things had improved and they were satisfied with their party’s performance; and only 1,9% voted because they trusted their party. It seems, therefore, as if trust andreward are two less important aspects of party loyalty as a motivational factor.
Thirdly, we found that being a democrat was a significant primary motivational factor, although it was not as important as the first two studies (Pendleton et al. 1993, Weiland 1996) suggested. Only 15,5% indicated that voting as a demo-
Reason for voting Frequency Valid %
... I want to show my party/movement that I support them. 243 25,1
... I care about my town. 342 35,3
... I don’t want the wrong party/movement to win. 82 8,5
... I want to show certain parties that I dislike them. 12 1,3
... the issues are important. 70 7,2
... I want the right party to win. 199 20,5
None of the above 21 2,2
Total 969 100,0
Missing 18 -
Table 3: Which statement best describes you as a voter?
Note: Respondents could only select one of the options listed above.
18 See Appendix 1 in Keulder (1998)
State, Society and Democracy
276
cratic right had motivated them to vote. Also, as a secondary motivator, it was not as important as loyalty. Having the right to vote was, therefore, simply not enough to bring the majority of voters to the polls.
Fourthly, we found no evidence here that ethnic loyalty or affiliation was a moti-vational force for Namibian voters. Only a small proportion, namely 8,5%, were motivated by an obligation to vote. When we compare these findings with those ofthe structured question, interesting and significant deviations become apparent.
Overall, the trends observed in Table 2 are confirmed. The largest single cate-gory of voters (35,3%) consider themselves as “caring voters”, which we regard as substantially similar to voting for change or improvement. Loyalty indicators, such as “... I want to show my party/movement that I support them” and “... I want the right party to win”, fared significantly better (25,1% and 20,5%, respectively). Together, the loyalty indicators constituted 45,6% of the total responses.
Here we also see some negative motivations: “... I don’t want the wrong party/movement to win” and “... I want to show certain parties that I dislike them”. These are small (8,5% and 1,3%, respectively), but nevertheless point to the factthat some Namibians are negatively motivated, which, in turn, suggests the possi-bility of tactical or protest voting. Also significant is the fact that some respond-ents considered themselves to be “issue voters”. Here, too, it is a small proportion (7,2%). The differences in findings are best explained by the manner in which the ques-tions were presented. Once the analyst issues prescriptions (as in Table 3), he/she guides the respondent and the responses can no longer be regarded as spontane-ous. Respondents might be made aware of new possibilities or may attempt to anticipate and provide the “correct” or “most acceptable” answer. Hence, struc-tured questions distort the opinions given. Open-ended questions, on the other hand, allow the respondents full control over their answers, and make it impossi-ble for them to anticipate any “correct” or “most acceptable” answers. Hence, wefeel the spontaneous opinions are more valid. We shall, therefore, consider the answers to the first question (Table 2) to be the real indicators of voter motivation.
There is a clear pattern when the motivations for voting are disaggregated by race, as recorded in Table 4.
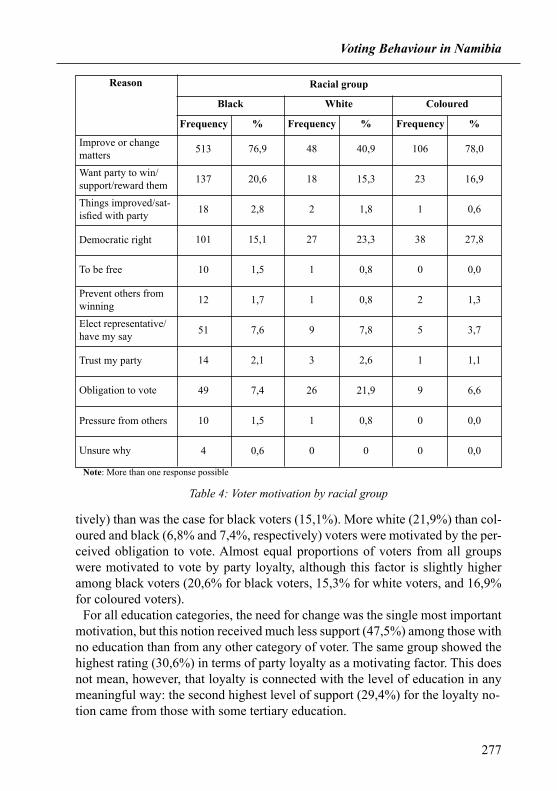
Given the spatial dimensions of inequality created and sustained by apartheid and colonial rule, it is not surprising that by far the majority of black (76,9%) andcoloured (78%) voters were motivated to vote by the need for change and im-provement. These are voters that reside in township areas that still lack the levelsand quality of development and services available in the historically white resi-dential areas. This is also true for the historically coloured residential areas. White voters were also motivated by the need for change (40,9%) but much less so than the other two groups. More significant numbers of white and coloured voters were motivated by having the democratic right to do so (23,3% and 27,8%, respec-
Voting Behaviour in Namibia
277
Table 4: Voter motivation by racial group
Note: More than one response possible
Reason
Frequency%
Improve or change matters
513 40,976,9 48 78,0106
Frequency %Frequency %
Black Coloured
Racial group
White
Want party to win/support/reward them
137 15,320,6 18 16,923
Things improved/sat-isfied with party
18 1,82,8 2 0,61
Democratic right 101 23,315,1 27 27,838
To be free 10 0,81,5 1 0,00
Prevent others from winning
12 0,81,7 1 1,32
Elect representative/have my say
51 7,87,6 9 3,75
Trust my party 14 2,62,1 3 1,11
Obligation to vote 49 21,97,4 26 6,69
Pressure from others 10 0,81,5 1 0,00
Unsure why 4 00,6 0 0,00
tively) than was the case for black voters (15,1%). More white (21,9%) than col-oured and black (6,8% and 7,4%, respectively) voters were motivated by the per-ceived obligation to vote. Almost equal proportions of voters from all groups were motivated to vote by party loyalty, although this factor is slightly higher among black voters (20,6% for black voters, 15,3% for white voters, and 16,9% for coloured voters).
For all education categories, the need for change was the single most important motivation, but this notion received much less support (47,5%) among those with no education than from any other category of voter. The same group showed the highest rating (30,6%) in terms of party loyalty as a motivating factor. This does not mean, however, that loyalty is connected with the level of education in any meaningful way: the second highest level of support (29,4%) for the loyalty no-tion came from those with some tertiary education.
State, Society and Democracy
278
We conclude that most Namibians, particularly black and coloured voters, were motivated to vote principally by the desire for change and improvement. This we consider to be the most important primary motivator. We consider party loyalty tobe the second most important primary motivator (more or less equal for all groups), followed by a range of others (such as having the right to vote, or feeling an obligation to do so). This means that the parties cannot rely on loyalty or voters’ democratic dispensation alone to secure a satisfactory turnout. Instead, parties are clearly being tested and evaluated in respect of their capacity to bring about change and improvement. Failure to do so will cause a further decline in voter turnout.
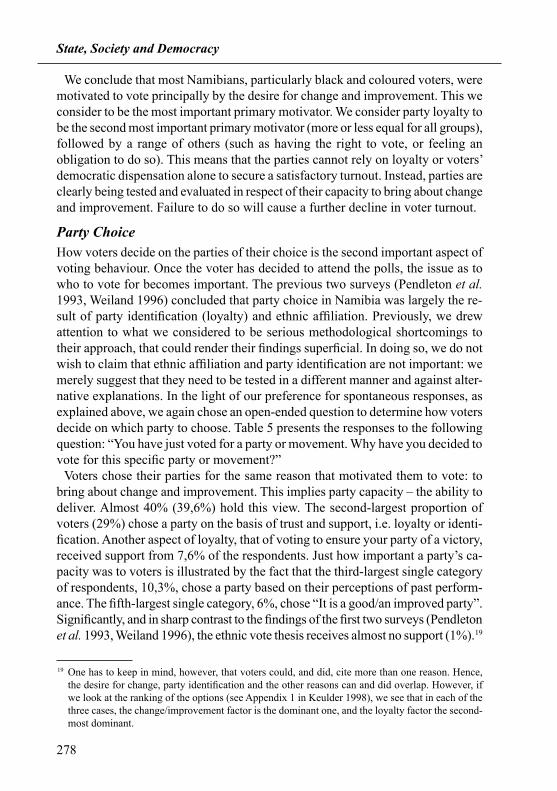
Party ChoiceHow voters decide on the parties of their choice is the second important aspect ofvoting behaviour. Once the voter has decided to attend the polls, the issue as to who to vote for becomes important. The previous two surveys (Pendleton et al. 1993, Weiland 1996) concluded that party choice in Namibia was largely the re-sult of party identification (loyalty) and ethnic affiliation. Previously, we drew attention to what we considered to be serious methodological shortcomings to their approach, that could render their findings superficial. In doing so, we do not wish to claim that ethnic affiliation and party identification are not important: we merely suggest that they need to be tested in a different manner and against alter-native explanations. In the light of our preference for spontaneous responses, as explained above, we again chose an open-ended question to determine how voters decide on which party to choose. Table 5 presents the responses to the following question: “You have just voted for a party or movement. Why have you decided tovote for this specific party or movement?”
Voters chose their parties for the same reason that motivated them to vote: to bring about change and improvement. This implies party capacity – the ability todeliver. Almost 40% (39,6%) hold this view. The second-largest proportion ofvoters (29%) chose a party on the basis of trust and support, i.e. loyalty or identi-fication. Another aspect of loyalty, that of voting to ensure your party of a victory, received support from 7,6% of the respondents. Just how important a party’s ca-pacity was to voters is illustrated by the fact that the third-largest single categoryof respondents, 10,3%, chose a party based on their perceptions of past perform-ance. The fifth-largest single category, 6%, chose “It is a good/an improved party”.Significantly, and in sharp contrast to the findings of the first two surveys (Pendleton et al. 1993, Weiland 1996), the ethnic vote thesis receives almost no support (1%).19
19 One has to keep in mind, however, that voters could, and did, cite more than one reason. Hence, the desire for change, party identification and the other reasons can and did overlap. However, if we look at the ranking of the options (see Appendix 1 in Keulder 1998), we see that in each of the three cases, the change/improvement factor is the dominant one, and the loyalty factor the second-most dominant.
Voting Behaviour in Namibia
279
Reason for choosing party Frequency Valid %
I know, trust and support the party. 330 29
I want my party to win. 86 7,6
The party will improve or change matters. 451 39,6
I am happy with their performance. 117 10,3
They brought independence. 29 2,5
They have good, strong leaders. 37 3,2
It is a good/an improved party. 46 5,3
My real party is not present. 2 0,2
The party represents my ethnic or language group. 12 1,0
I vote for opposition. 7 0,6
Total 1 139 100,0
Table 5: Party choice
Note: Respondents could provide up to three reasons; for a breakdown of the rankings (first, second and third choices), see Appendix 2 in Keulder (1998).
The relation between loyalty or party identification and party choice is more complex than the data suggest. Catt (1996:5) argues that, once acquired, party identification or loyalty acts as a perceptual filter on information and ideas that determines how voters evaluate issues or politicians. In most cases party identifi-cation is inherited and becomes part of the individual voter’s self-image. Such an emotive attachment is usually deeply ingrained and, hence, enduring. In societies where there is strong party loyalty, support and voting patterns are stable and voter volatility is low. Voters rarely switch parties (in extreme cases this could be perceived as “treason”) because they usually perceive their party or parties to be the “best”, irrespective of the issues at hand.
There is sufficient evidence to suggest that most Namibians display strong loy-alty toward their respective parties. In general, the distribution of party support through the vote has remained the same for all elections, irrespective of the de-cline in voter turnout. Party identification in Namibia is by and large the result ofthe country’s history of race and ethnicity-based colonialism. This, and the subse-quent development of a liberation struggle, caused a clear socio-political divide inthe society.20 It also caused party identification to become deeper and more dura-ble than in most (Western) societies. Namibian voters also regard the party of their
20 This “us” and “them” dichotomy is still very evident today. This is borne out in the importance of race and language detected in our analysis.
State, Society and Democracy
280
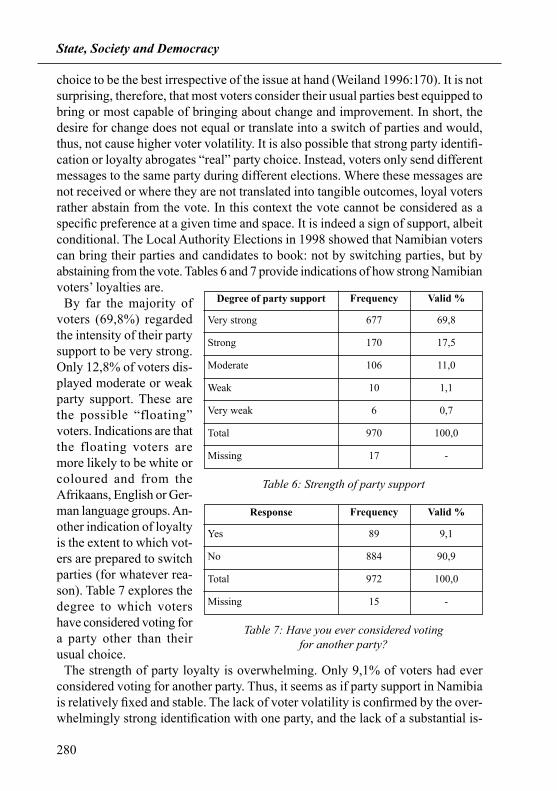
choice to be the best irrespective of the issue at hand (Weiland 1996:170). It is not surprising, therefore, that most voters consider their usual parties best equipped tobring or most capable of bringing about change and improvement. In short, the desire for change does not equal or translate into a switch of parties and would, thus, not cause higher voter volatility. It is also possible that strong party identifi-cation or loyalty abrogates “real” party choice. Instead, voters only send different messages to the same party during different elections. Where these messages are not received or where they are not translated into tangible outcomes, loyal voters rather abstain from the vote. In this context the vote cannot be considered as a specific preference at a given time and space. It is indeed a sign of support, albeit conditional. The Local Authority Elections in 1998 showed that Namibian voters can bring their parties and candidates to book: not by switching parties, but byabstaining from the vote. Tables 6 and 7 provide indications of how strong Namibianvoters’ loyalties are.
By far the majority of voters (69,8%) regarded the intensity of their party support to be very strong. Only 12,8% of voters dis-played moderate or weak party support. These are the possible “floating” voters. Indications are thatthe floating voters are more likely to be white orcoloured and from the Afrikaans, English or Ger-man language groups. An-other indication of loyalty is the extent to which vot-ers are prepared to switch parties (for whatever rea-son). Table 7 explores the degree to which voters have considered voting fora party other than their usual choice.
The strength of party loyalty is overwhelming. Only 9,1% of voters had everconsidered voting for another party. Thus, it seems as if party support in Namibia is relatively fixed and stable. The lack of voter volatility is confirmed by the over-whelmingly strong identification with one party, and the lack of a substantial is-
Degree of party support Frequency Valid %
Very strong 677 69,8
Strong 170 17,5
Moderate 106 11,0
Weak 10 1,1
Very weak 6 0,7
Total 970 100,0
Missing 17 -
Table 6: Strength of party support
Response Frequency Valid %
Yes 89 9,1
No 884 90,9
Total 972 100,0
Missing 15 -
Table 7: Have you ever considered votingfor another party?
Voting Behaviour in Namibia
281
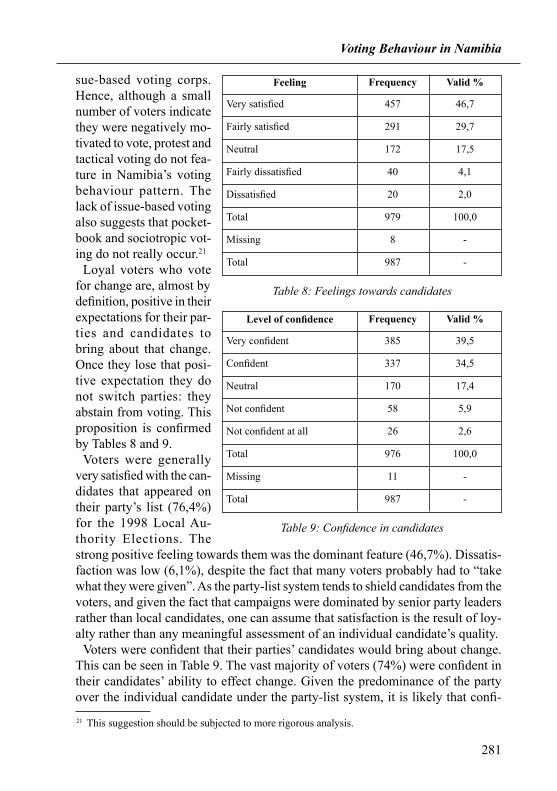
Feeling Frequency Valid %
Very satisfied 457 46,7
Fairly satisfied 291 29,7
Neutral 172 17,5
Fairly dissatisfied 40 4,1
Dissatisfied 20 2,0
Total 979 100,0
Missing 8 -
Total 987 -
Table 8: Feelings towards candidates
Level of confidence Frequency Valid %
Very confident 385 39,5
Confident 337 34,5
Neutral 170 17,4
Not confident 58 5,9
Not confident at all 26 2,6
Total 976 100,0
Missing 11 -
Total 987 -
Table 9: Confidence in candidates
sue-based voting corps. Hence, although a small number of voters indicatethey were negatively mo-tivated to vote, protest andtactical voting do not fea-ture in Namibia’s voting behaviour pattern. The lack of issue-based voting also suggests that pocket-book and sociotropic vot-ing do not really occur.21
Loyal voters who vote for change are, almost bydefinition, positive in their expectations for their par-ties and candidates to bring about that change. Once they lose that posi-tive expectation they do not switch parties: they abstain from voting. This proposition is confirmed by Tables 8 and 9.
Voters were generallyvery satisfied with the can-didates that appeared on their party’s list (76,4%) for the 1998 Local Au-thority Elections. The strong positive feeling towards them was the dominant feature (46,7%). Dissatis-faction was low (6,1%), despite the fact that many voters probably had to “take what they were given”. As the party-list system tends to shield candidates from thevoters, and given the fact that campaigns were dominated by senior party leaders rather than local candidates, one can assume that satisfaction is the result of loy-alty rather than any meaningful assessment of an individual candidate’s quality.
Voters were confident that their parties’ candidates would bring about change. This can be seen in Table 9. The vast majority of voters (74%) were confident in their candidates’ ability to effect change. Given the predominance of the partyover the individual candidate under the party-list system, it is likely that confi-
21 This suggestion should be subjected to more rigorous analysis.
State, Society and Democracy
282
dence in the party would be transferred to the candidate(s). Candidates are consid-ered “best” and “able” not necessarily because of their individual qualities, but much rather because they represent the “best” and “most able” party.
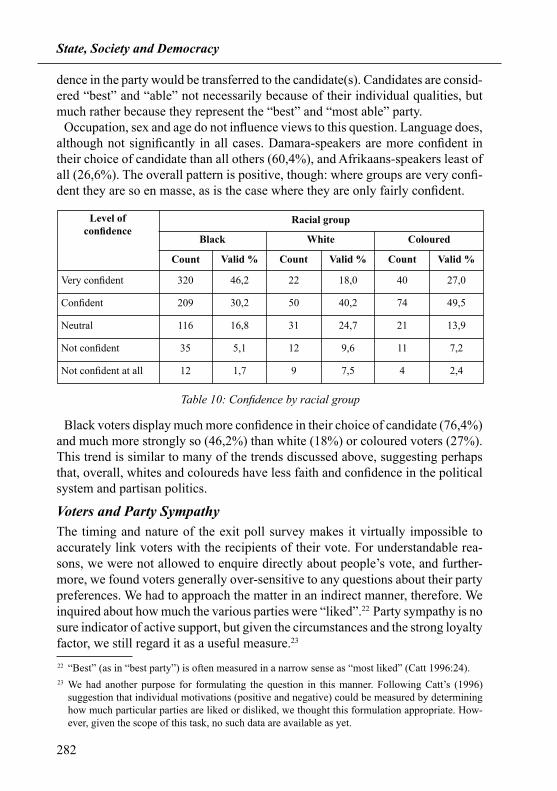
Occupation, sex and age do not influence views to this question. Language does, although not significantly in all cases. Damara-speakers are more confident intheir choice of candidate than all others (60,4%), and Afrikaans-speakers least ofall (26,6%). The overall pattern is positive, though: where groups are very confi-dent they are so en masse, as is the case where they are only fairly confident.
Table 10: Confidence by racial group
Level ofconfidence
CountValid %
Very confident 320 18,046,2 22 27,040
Count Valid %Count Valid %
Black Coloured
Racial group
White
Confident 209 40,230,2 50 49,574
Neutral 116 24,716,8 31 13,921
Not confident 35 9,65,1 12 7,211
Not confident at all 12 7,51,7 9 2,44
22 “Best” (as in “best party”) is often measured in a narrow sense as “most liked” (Catt 1996:24). 23 We had another purpose for formulating the question in this manner. Following Catt’s (1996) suggestion that individual motivations (positive and negative) could be measured by determining
how much particular parties are liked or disliked, we thought this formulation appropriate. How- ever, given the scope of this task, no such data are available as yet.
Black voters display much more confidence in their choice of candidate (76,4%) and much more strongly so (46,2%) than white (18%) or coloured voters (27%). This trend is similar to many of the trends discussed above, suggesting perhaps that, overall, whites and coloureds have less faith and confidence in the political system and partisan politics.
Voters and Party SympathyThe timing and nature of the exit poll survey makes it virtually impossible toaccurately link voters with the recipients of their vote. For understandable rea-sons, we were not allowed to enquire directly about people’s vote, and further-more, we found voters generally over-sensitive to any questions about their party preferences. We had to approach the matter in an indirect manner, therefore. We inquired about how much the various parties were “liked”.22 Party sympathy is nosure indicator of active support, but given the circumstances and the strong loyalty factor, we still regard it as a useful measure.23
Voting Behaviour in Namibia
283
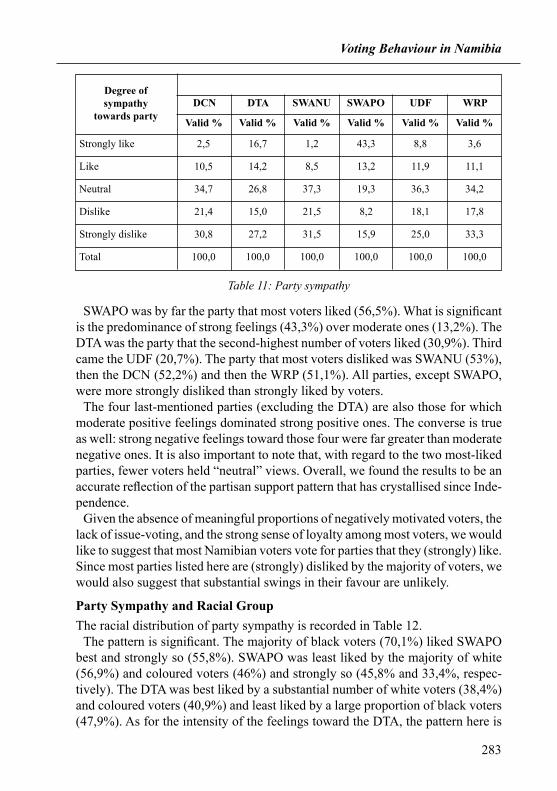
SWAPO was by far the party that most voters liked (56,5%). What is significant is the predominance of strong feelings (43,3%) over moderate ones (13,2%). The DTA was the party that the second-highest number of voters liked (30,9%). Third came the UDF (20,7%). The party that most voters disliked was SWANU (53%), then the DCN (52,2%) and then the WRP (51,1%). All parties, except SWAPO, were more strongly disliked than strongly liked by voters.
The four last-mentioned parties (excluding the DTA) are also those for which moderate positive feelings dominated strong positive ones. The converse is true as well: strong negative feelings toward those four were far greater than moderate negative ones. It is also important to note that, with regard to the two most-liked parties, fewer voters held “neutral” views. Overall, we found the results to be anaccurate reflection of the partisan support pattern that has crystallised since Inde-pendence.
Given the absence of meaningful proportions of negatively motivated voters, the lack of issue-voting, and the strong sense of loyalty among most voters, we would like to suggest that most Namibian voters vote for parties that they (strongly) like. Since most parties listed here are (strongly) disliked by the majority of voters, we would also suggest that substantial swings in their favour are unlikely.
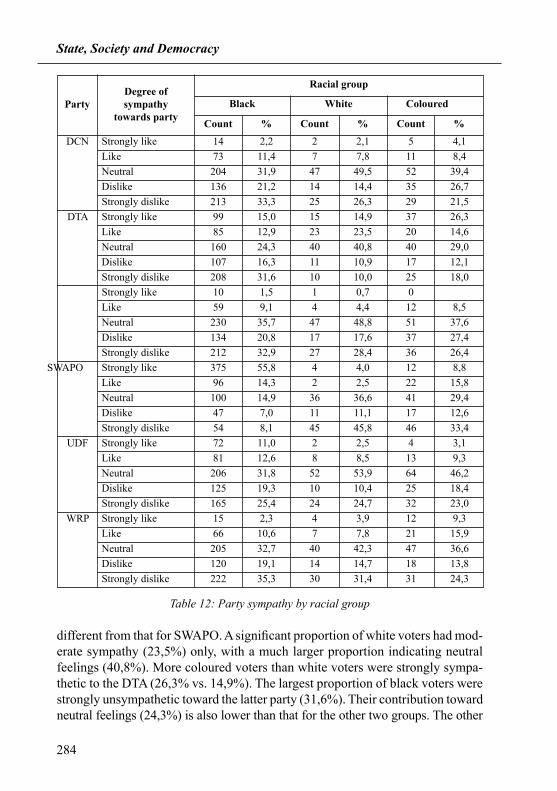
Party Sympathy and Racial Group
The racial distribution of party sympathy is recorded in Table 12.The pattern is significant. The majority of black voters (70,1%) liked SWAPO
best and strongly so (55,8%). SWAPO was least liked by the majority of white (56,9%) and coloured voters (46%) and strongly so (45,8% and 33,4%, respec-tively). The DTA was best liked by a substantial number of white voters (38,4%) and coloured voters (40,9%) and least liked by a large proportion of black voters (47,9%). As for the intensity of the feelings toward the DTA, the pattern here is
Table 11: Party sympathy
Degree ofsympathy
towards partyValid %Valid %
Strongly like 2,5 43,316,7 1,2 3,68,8
Valid % Valid %Valid % Valid %
DCN WRPSWANU
Like 10,5 13,214,2 8,5 11,111,9
Neutral 34,7 19,326,8 37,3 34,236,3
Dislike 21,4 8,215,0 21,5 17,818,1
Strongly dislike 30,8 15,927,2 31,5 33,325,0
DTA SWAPO UDF
Total 100,0 100,0100,0 100,0 100,0100,0
State, Society and Democracy
284
Degree ofsympathy
towards partyCount%Count %Count %
Racial group
Black White ColouredParty
Strongly like 14 2,12,2 2 4,15DCN
Like 73 7,811,4 7 8,411
Neutral 204 49,531,9 47 39,452
Dislike 136 14,421,2 14 26,735
Strongly dislike 213 26,333,3 25 21,529
Strongly like 99 14,915,0 15 26,337DTA
Like 85 23,512,9 23 14,620
Neutral 160 40,824,3 40 29,040
Dislike 107 10,916,3 11 12,117
Strongly dislike 208 10,031,6 10 18,025
Strongly like 10 0,71,5 1 0
Like 59 4,49,1 4 8,512
Neutral 230 48,835,7 47 37,651
Dislike 134 17,620,8 17 27,437
Strongly dislike 212 28,432,9 27 26,436
Strongly like 375 4,055,8 4 8,812SWAPO
Like 96 2,514,3 2 15,822
Neutral 100 36,614,9 36 29,441
Dislike 47 11,17,0 11 12,617
Strongly dislike 54 45,88,1 45 33,446
Strongly like 72 2,511,0 2 3,14UDF
Like 81 8,512,6 8 9,313
Neutral 206 53,931,8 52 46,264
Dislike 125 10,419,3 10 18,425
Strongly dislike 165 24,725,4 24 23,032
Strongly like 15 3,92,3 4 9,312WRP
Like 66 7,810,6 7 15,921
Neutral 205 42,332,7 40 36,647
Dislike 120 14,719,1 14 13,818
Strongly dislike 222 31,435,3 30 24,331
Table 12: Party sympathy by racial group
different from that for SWAPO. A significant proportion of white voters had mod-erate sympathy (23,5%) only, with a much larger proportion indicating neutral feelings (40,8%). More coloured voters than white voters were strongly sympa-thetic to the DTA (26,3% vs. 14,9%). The largest proportion of black voters were strongly unsympathetic toward the latter party (31,6%). Their contribution towardneutral feelings (24,3%) is also lower than that for the other two groups. The other
Voting Behaviour in Namibia
285
Degree ofsympathy
towards party
%%% %% %
Language group
Khoe-khoe-gowab
(Damara)
Oshi-wambo
Silozi
Party
Strongly like 12,4 21,826,4 3,3 52,026,5DTA
Like 25,6 17,323,0 7,0 13,611,8
Neutral 33,8 33,020,9 24,2 17,514,7
Dislike 13,0 12,46,2 20,7 5,225,8
Strongly dislike 15,2 15,523,5 44,7 11,721,1
Strongly like 20,3 6,926,3 81,2 18,458,2SWAPO
Like 13,4 12,722,1 9,7 30,04,7
Neutral 32,2 31,922,0 7,6 17,610,6
Dislike 16,3 10,88,8 0,4 17,811,8
Strongly dislike 17,9 37,720,8 1,1 16,214,7
Strongly like 48,7 3,812,4 1,9 6,40,0UDF
Like 12,2 9,228,4 9,0 20,417,7
Neutral 25,0 46,933,0 30,5 39,422,4
Dislike 6,7 16,77,2 23,3 18,632,9
Strongly dislike 7,5 23,419,1 35,3 15,227,0
Table 13: Party sympathy by language
Afri-kaans
Otji-herero
Khoe-khoe-gowab(Nama)
24 Language is, of course, not always an accurate indicator of ethnicity. However, in the past, re- spondents have reacted negatively to direct questions on their ethnic affiliation. 25 The results for the other parties have been omitted here because they showed uniformity in voters’
level of dislike towards the parties concerned. We have also left out the language groups for which we recorded numerically insufficient responses.
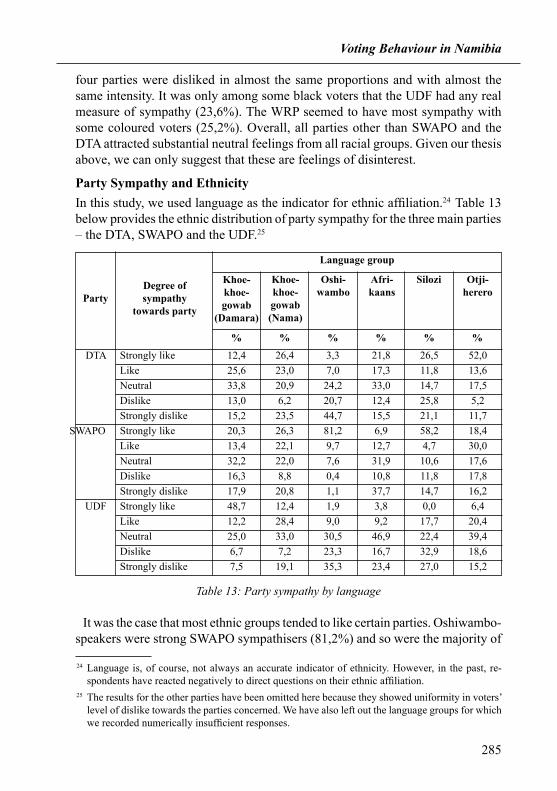
It was the case that most ethnic groups tended to like certain parties. Oshiwambo-speakers were strong SWAPO sympathisers (81,2%) and so were the majority of
four parties were disliked in almost the same proportions and with almost the same intensity. It was only among some black voters that the UDF had any real measure of sympathy (23,6%). The WRP seemed to have most sympathy with some coloured voters (25,2%). Overall, all parties other than SWAPO and the DTA attracted substantial neutral feelings from all racial groups. Given our thesisabove, we can only suggest that these are feelings of disinterest.
Party Sympathy and Ethnicity
In this study, we used language as the indicator for ethnic affiliation.24 Table 13 below provides the ethnic distribution of party sympathy for the three main parties– the DTA, SWAPO and the UDF.25
State, Society and Democracy
286
26 This suggests a swing towards SWAPO in this former DTA stronghold. Here our findings are a true reflection of the overall outcome of the elections in Katima Mulilo. However, at this stage at least, it is not possible to say whether rural voters will continue the trend, or if the swing can be ascribed to better campaigning by SWAPO and a larger stay-away by DTA supporters in and around Katima Mulilo.
27 This category is not a racial one, but most likely consists of whites, coloureds and the Rehoboth people.
28 We have used the “two-thirds” criterion to determine whether or not parties can be considered non-racial or multi-ethnic (see Mattes & Gouws 1998). For a party to be considered a racial or
ethnic one, two-thirds or more of its support must come from a single racial or ethnic group.
Silozi-speakers (58,2%).26 Nama Khoekhoegowab-speakers were the only group without any single strong preference. Their liking for SWAPO and the DTA wasalmost equal in proportion and intensity (48,4% and 49,4%, respectively).Otjiherero-speakers were the only group with a strong preference for the DTA (52%). A substantial proportion of Afrikaans-speakers27 (39,1%) had a prefer-
ence for the DTA. The UDF was best liked by Damara Khoekhoegowab-speakers (60,9%), and strongly so by most members of this group (48,7%).
If we consider the ethnic and racial distribution of party sympathy, the followingtrends emerge. Firstly, all parties except the DTA drew their sympathy almost exclusively from one racial group. This means that only the DTA can, on the strength of its support base, make any substantiated claims toward being a non-racial party.28 Secondly, none of the Namibian parties are ethnic parties. It is true that SWAPO receives almost all Oshiwambo votes, but it also draws enough sup-port from other ethnic groups to be called multi-ethnic.
Ethnicity as a political force in Namibia has yet to be subjected to rigorous re-search. We know relatively little of its impact on voter behaviour. Some analysts (see e.g. Potgieter 1991) border on primordialism when explaining the ethnic dis-tribution of party support, whilst others (see Lindeke et al. 1992) are quick toreject any trace of ethnic support for SWAPO in favour of the more acceptable“national consciousness” argument. However, both these arguments focus on eth-nicity as an independent variable when explaining voter behaviour.
Our data suggest that as far as voter motivation is concerned, ethnicity plays nomeaningful part in bringing voters to the polls. Furthermore, as far as party selec-tion is concerned, our data also refute many of the core assumptions of the ethnic vote model. Yet, we found that the various ethnic groups all had strong party preferences. If ethnicity is not the independent variable by means of which party selection can be explained, it should then be treated as an intervening variable. Itsimpact is, therefore, much the same as that of party loyalty. Voters no longer con-sider party identification or ethnicity as reasons for voting; but both these vari-ables work together to solidify party preference. We have stated before that party identification in Namibia is part of voters’ self-image. The same is true for ethnic affiliation. When these two intervening variables, party identification and ethnic
Voting Behaviour in Namibia
287
affiliation, are combined and linked to a single party, the voter’s choice of party isa predetermined one, and he or she no longer considers other options. The only dynamic entity in this equation is the motivation to vote. This, our data suggest, embodies the voter’s message to his or her party. Ethnicity and party loyalty pre-vent the voter from sending his or her message to a few or all parties in the hope offinding a sympathetic ear. Instead, the variables ensure that the message is sent toone party only. If that party fails to respond, the voter has little choice but to abstain from voting. Therefore, given the strong sympathies attached to certain parties by certain language groups, it is unlikely that opposition parties would make inroads here.29
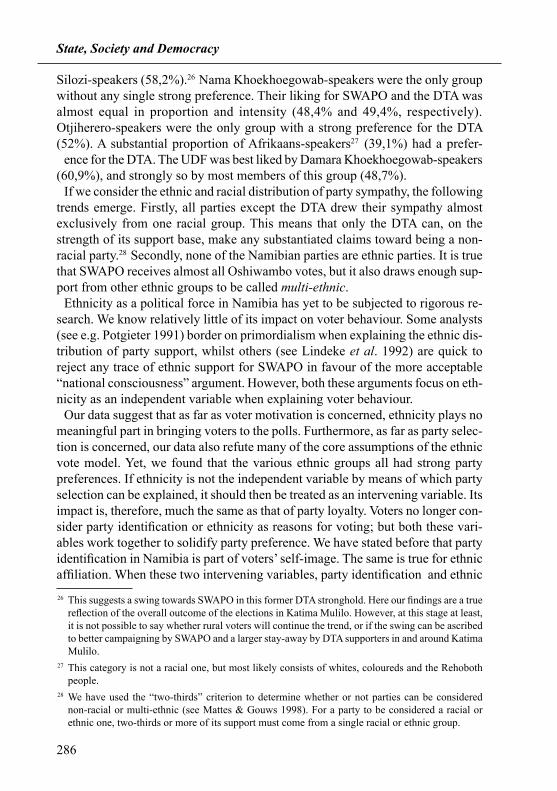
The Independent Associations The Local Authority Elec-tions of 1998 were differ-ent from the previous ones,also because of the in-crease in the number of independent associations that contested the elections(and some did so very suc-cessfully). We included aquestion to measure sym-pathy levels for independ-ent associations, but only in those towns where such associations were a factor in the choice of candidates. Hence, the sample here is limited to voters in five towns.30
Table 14 suggests that these associations, given their recent emergence onto the political scene, received substantial sympathy from voters (41,3%). Only 24,7% of voters disliked the associations. Their supporters were all voters that “floated” from one political party or another. Mostly, the independent associations provided a home to voters committed to the act of voting but disillusioned with the existing parties and/or party politics in general. Table 15 gives an indication of where such associations’ support lies.
29 The Silozi case is also interesting and no doubt can be used to contest our thesis. However, as we suggested above, we cannot come to a final conclusion on what happened to DTA supporters. Hence, we are hesitant to suggest that Silozi-speakers changed their parties. It is possible that the
swing could be the result of a stay-away by DTA supporters. 30 Our sample towns were Gobabis, Keetmanshoop, Okahandja, Rehoboth, Swakopmund and Windhoek.
Degree of sympathy Frequency Valid %
Strongly like 153 20,0
Like 163 21,3
Neutral 261 34,1
Dislike 92 12,0
Strongly dislike 97 12,7
Total 767 100,0
Missing 220 -
Table 14: Sympathy towardsindependent associations
State, Society and Democracy
288
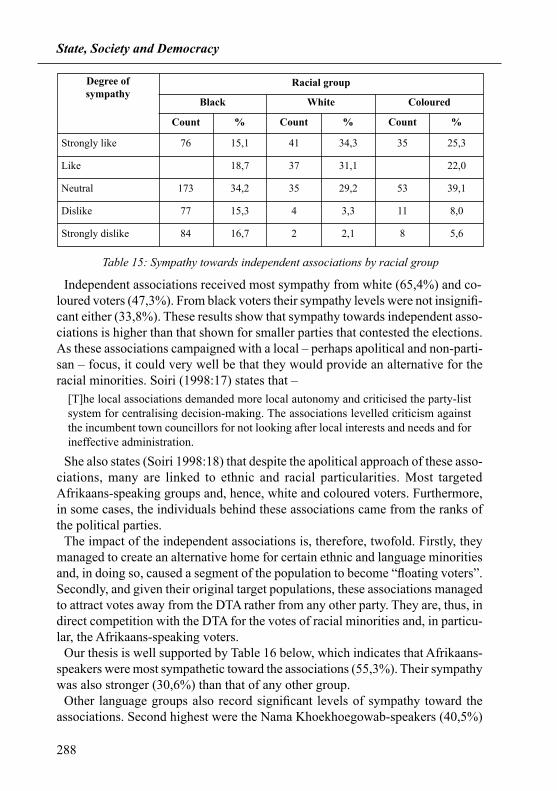
Table 15: Sympathy towards independent associations by racial group
Degree ofsympathy
Count%
Strongly like 76 34,315,1 41 25,335
Count %Count %
Black Coloured
Racial group
White
Like 31,118,7 37 22,0
Neutral 173 29,234,2 35 39,153
Dislike 77 3,315,3 4 8,011
Strongly dislike 84 2,116,7 2 5,68
Independent associations received most sympathy from white (65,4%) and co-loured voters (47,3%). From black voters their sympathy levels were not insignifi-cant either (33,8%). These results show that sympathy towards independent asso-ciations is higher than that shown for smaller parties that contested the elections. As these associations campaigned with a local – perhaps apolitical and non-parti-san – focus, it could very well be that they would provide an alternative for the racial minorities. Soiri (1998:17) states that –
[T]he local associations demanded more local autonomy and criticised the party-list system for centralising decision-making. The associations levelled criticism against the incumbent town councillors for not looking after local interests and needs and for ineffective administration.
She also states (Soiri 1998:18) that despite the apolitical approach of these asso-ciations, many are linked to ethnic and racial particularities. Most targeted Afrikaans-speaking groups and, hence, white and coloured voters. Furthermore, in some cases, the individuals behind these associations came from the ranks of the political parties.
The impact of the independent associations is, therefore, twofold. Firstly, they managed to create an alternative home for certain ethnic and language minorities and, in doing so, caused a segment of the population to become “floating voters”. Secondly, and given their original target populations, these associations managed to attract votes away from the DTA rather from any other party. They are, thus, in direct competition with the DTA for the votes of racial minorities and, in particu-lar, the Afrikaans-speaking voters.
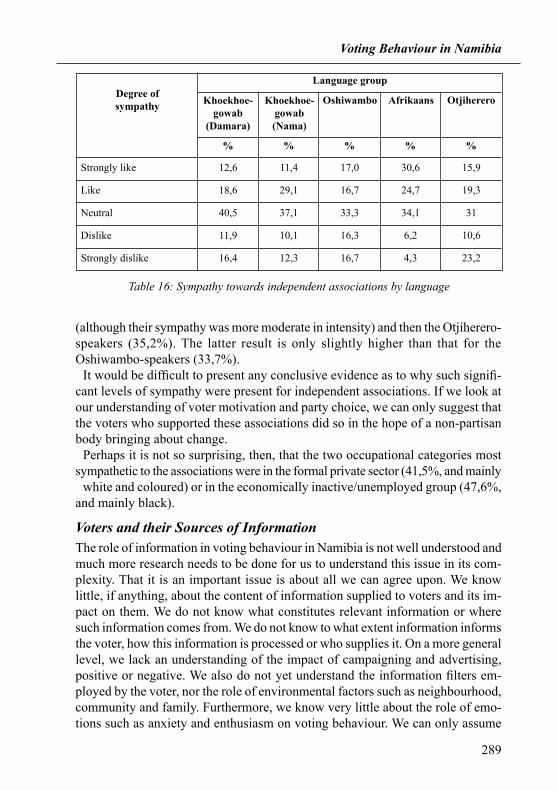
Our thesis is well supported by Table 16 below, which indicates that Afrikaans-speakers were most sympathetic toward the associations (55,3%). Their sympathy was also stronger (30,6%) than that of any other group.
Other language groups also record significant levels of sympathy toward the associations. Second highest were the Nama Khoekhoegowab-speakers (40,5%)
Voting Behaviour in Namibia
289
Table 16: Sympathy towards independent associations by language
Degree ofsympathy
%%% % %
Language group
Khoekhoe-gowab
(Damara)
Oshiwambo Otjiherero
Strongly like 12,6 30,611,4 17,0 15,9
AfrikaansKhoekhoe-gowab(Nama)
Like 18,6 24,729,1 16,7 19,3
Neutral 40,5 34,137,1 33,3 31
Dislike 11,9 6,210,1 16,3 10,6
Strongly dislike 16,4 4,312,3 16,7 23,2
(although their sympathy was more moderate in intensity) and then the Otjiherero-speakers (35,2%). The latter result is only slightly higher than that for theOshiwambo-speakers (33,7%).
It would be difficult to present any conclusive evidence as to why such signifi-cant levels of sympathy were present for independent associations. If we look at our understanding of voter motivation and party choice, we can only suggest that the voters who supported these associations did so in the hope of a non-partisan body bringing about change.
Perhaps it is not so surprising, then, that the two occupational categories most sympathetic to the associations were in the formal private sector (41,5%, and mainly
white and coloured) or in the economically inactive/unemployed group (47,6%, and mainly black).
Voters and their Sources of InformationThe role of information in voting behaviour in Namibia is not well understood andmuch more research needs to be done for us to understand this issue in its com-plexity. That it is an important issue is about all we can agree upon. We knowlittle, if anything, about the content of information supplied to voters and its im-pact on them. We do not know what constitutes relevant information or wheresuch information comes from. We do not know to what extent information informs the voter, how this information is processed or who supplies it. On a more general level, we lack an understanding of the impact of campaigning and advertising, positive or negative. We also do not yet understand the information filters em-ployed by the voter, nor the role of environmental factors such as neighbourhood, community and family. Furthermore, we know very little about the role of emo-tions such as anxiety and enthusiasm on voting behaviour. We can only assume
State, Society and Democracy
290
31 This finding is different from that of the previous two surveys (Pendleton et al. 1993, Weiland 1996) mainly because it arose from a study on a Local Authority Election only, and most towns
and urban centres have access to television broadcasting. This does not mean that most voters own television sets; it only means that they have access to one.
that information is important for generating such emotions, but we are uninformed as to how this is done and to what effect. We suggested previously, however, that party identification and ethnicity might combine to establish a perceptual filter through which information is percolated. It is, therefore, quite possible that only information which supports these two variables would be internalised and acted upon. If this is true, it would mean that Namibian voters do not require the same type or level of information required by voters in societies where issue-voting takes place.
Issue-based voters require much more information and information of a different nature than ethnic voters. The former might require information about economic trends, party policies, and party programmes to make their choice, whilst ethnic voters might only require information about whether or not their party is contest-ing, when the elections will take place, and where to vote. Party identification or loyalty voters might require the same basic information as ethnic voters but they might also be interested in whether or not their party is sufficiently threatened by opposing parties. The information relevant to ethnic and loyal voters is needed,not to facilitate party choice as such (as is the case with issue-voters), but to deter-mine whether or not there is a need to vote at all.
Given the high levels of party loyalty, Namibian voters might only need informa-tion of the latter kind. The fact that most voters vote for change does not require special input to inform their choice of parties. From this it follows that the major-ity of Namibian voters might require more information about the election process (how to register, when and where to register, when and where to vote, etc.) than about the parties, their policies or their programmes. Given our analysis thus far, we expect the different racial groups and perhaps some of the language groups to have slightly different information needs.
Information Sources
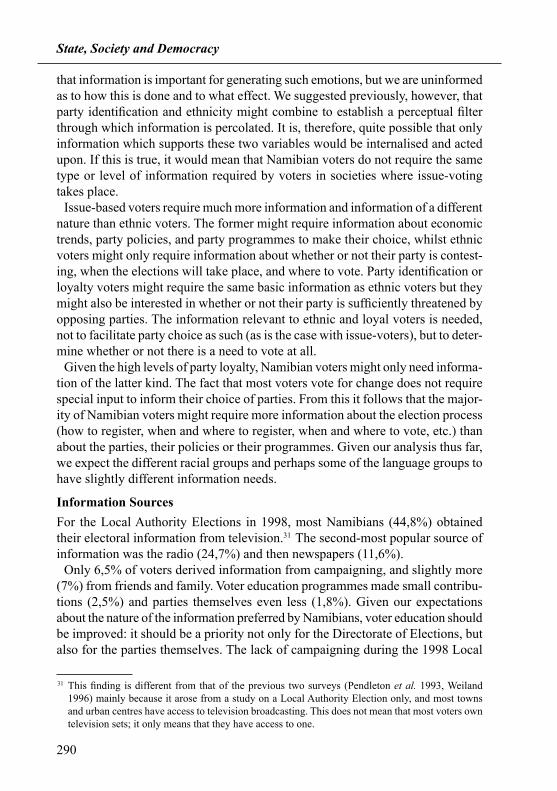
For the Local Authority Elections in 1998, most Namibians (44,8%) obtained their electoral information from television.31 The second-most popular source of information was the radio (24,7%) and then newspapers (11,6%).
Only 6,5% of voters derived information from campaigning, and slightly more (7%) from friends and family. Voter education programmes made small contribu-tions (2,5%) and parties themselves even less (1,8%). Given our expectationsabout the nature of the information preferred by Namibians, voter education should be improved: it should be a priority not only for the Directorate of Elections, but also for the parties themselves. The lack of campaigning during the 1998 Local
Voting Behaviour in Namibia
291
Source of information Frequency Valid %
Television 438 44,8
Newspaper 114 11,6
Radio 242 24,7
Campaign events and materials 63 6,5
Family and friends 69 7,0
Voter education by the Directorate of Elections 10 1,0
Voter education by NGOs 15 1,5
Party officials and organisers 17 1,8
Other 10 1,0
Total 978 100,0
Missing 9 -
Table 17: Main sources of information
Authority Elections was evident, and here the parties were guilty of not perform-ing.32
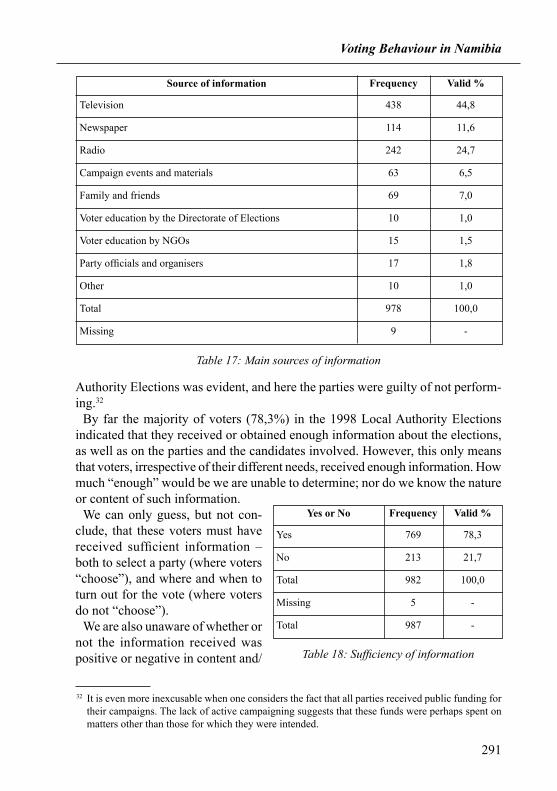
By far the majority of voters (78,3%) in the 1998 Local Authority Elections indicated that they received or obtained enough information about the elections, as well as on the parties and the candidates involved. However, this only means that voters, irrespective of their different needs, received enough information. Howmuch “enough” would be we are unable to determine; nor do we know the nature or content of such information.
We can only guess, but not con-clude, that these voters must have received sufficient information – both to select a party (where voters “choose”), and where and when to turn out for the vote (where voters do not “choose”).
We are also unaware of whether ornot the information received was positive or negative in content and/
32 It is even more inexcusable when one considers the fact that all parties received public funding for their campaigns. The lack of active campaigning suggests that these funds were perhaps spent on matters other than those for which they were intended.
Table 18: Sufficiency of information
Yes or No Frequency Valid %
Yes 769 78,3
No 213 21,7
Total 982 100,0
Missing 5 -
Total 987 -
State, Society and Democracy
292
or direction, and whether or not such information provoked emotions such as fear,enthusiasm or anxiety.
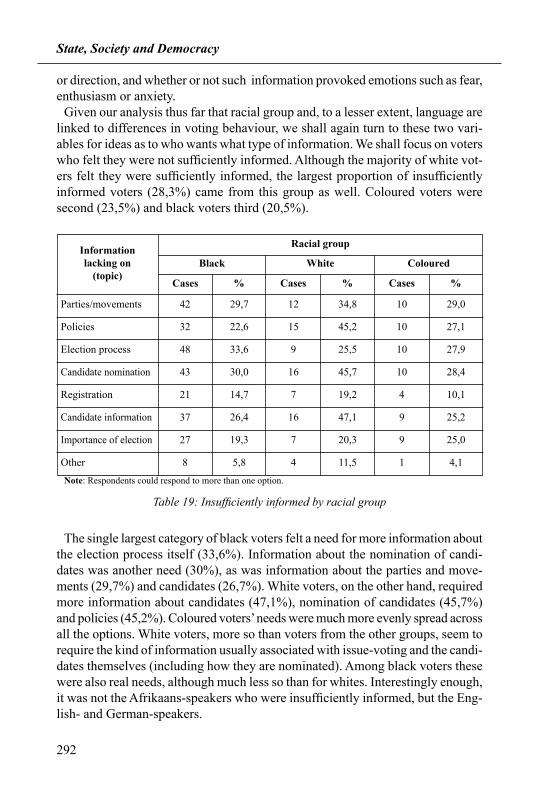
Given our analysis thus far that racial group and, to a lesser extent, language are linked to differences in voting behaviour, we shall again turn to these two vari-ables for ideas as to who wants what type of information. We shall focus on voterswho felt they were not sufficiently informed. Although the majority of white vot-ers felt they were sufficiently informed, the largest proportion of insufficiently informed voters (28,3%) came from this group as well. Coloured voters were second (23,5%) and black voters third (20,5%).
Table 19: Insufficiently informed by racial group
Informationlacking on
(topic)Cases%
Parties/movements 42 34,829,7 12 29,010
Cases %Cases %
Black Coloured
Racial group
White
Policies 32 45,222,6 15 27,110
Election process 48 25,533,6 9 27,910
Candidate nomination 43 45,730,0 16 28,410
Registration 21 19,214,7 7 10,14
Candidate information 37 47,126,4 16 25,29
Importance of election 27 20,319,3 7 25,09
Other 8 11,55,8 4 4,11
Note: Respondents could respond to more than one option.
The single largest category of black voters felt a need for more information about the election process itself (33,6%). Information about the nomination of candi-dates was another need (30%), as was information about the parties and move-ments (29,7%) and candidates (26,7%). White voters, on the other hand, required more information about candidates (47,1%), nomination of candidates (45,7%)and policies (45,2%). Coloured voters’ needs were much more evenly spread across all the options. White voters, more so than voters from the other groups, seem torequire the kind of information usually associated with issue-voting and the candi-dates themselves (including how they are nominated). Among black voters these were also real needs, although much less so than for whites. Interestingly enough, it was not the Afrikaans-speakers who were insufficiently informed, but the Eng-lish- and German-speakers.
Voting Behaviour in Namibia
293
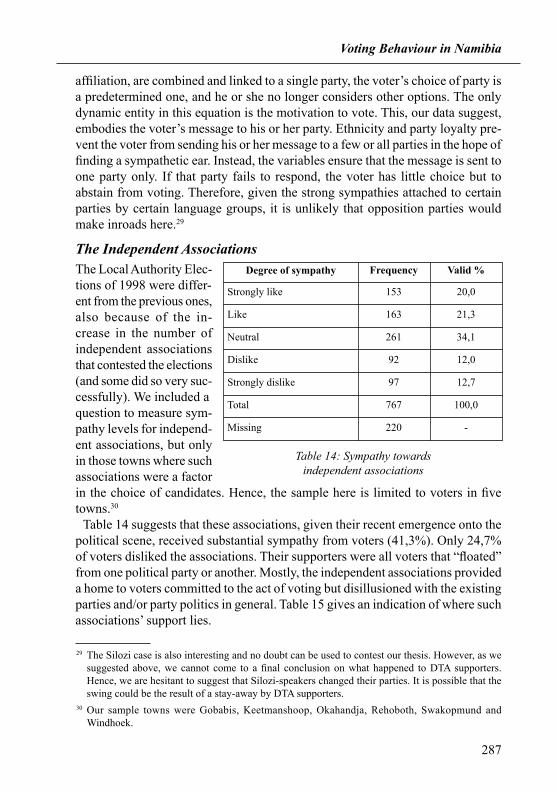
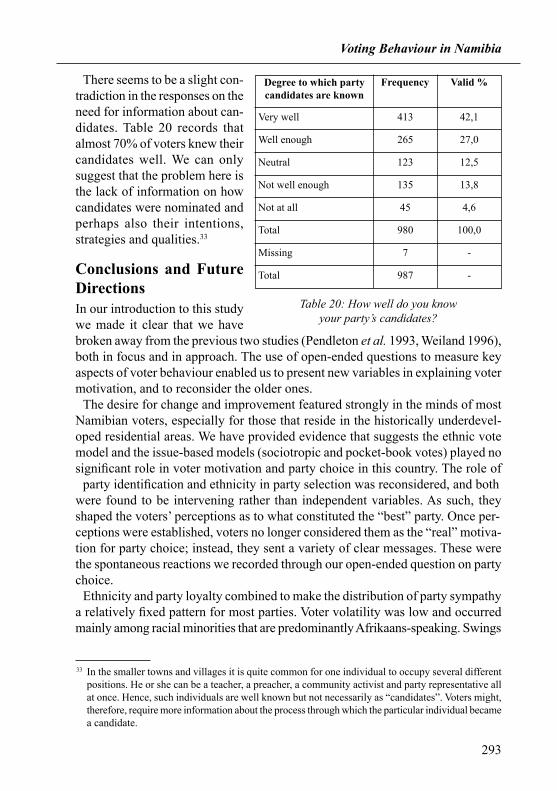
There seems to be a slight con-tradiction in the responses on theneed for information about can-didates. Table 20 records that almost 70% of voters knew their candidates well. We can only suggest that the problem here is the lack of information on how candidates were nominated and perhaps also their intentions, strategies and qualities.33
Conclusions and Future DirectionsIn our introduction to this study we made it clear that we have broken away from the previous two studies (Pendleton et al. 1993, Weiland 1996), both in focus and in approach. The use of open-ended questions to measure key aspects of voter behaviour enabled us to present new variables in explaining voter motivation, and to reconsider the older ones.
The desire for change and improvement featured strongly in the minds of most Namibian voters, especially for those that reside in the historically underdevel-oped residential areas. We have provided evidence that suggests the ethnic vote model and the issue-based models (sociotropic and pocket-book votes) played no significant role in voter motivation and party choice in this country. The role of
party identification and ethnicity in party selection was reconsidered, and bothwere found to be intervening rather than independent variables. As such, they shaped the voters’ perceptions as to what constituted the “best” party. Once per-ceptions were established, voters no longer considered them as the “real” motiva-tion for party choice; instead, they sent a variety of clear messages. These were the spontaneous reactions we recorded through our open-ended question on party choice.
Ethnicity and party loyalty combined to make the distribution of party sympathy a relatively fixed pattern for most parties. Voter volatility was low and occurred mainly among racial minorities that are predominantly Afrikaans-speaking. Swings
Well enough
Degree to which party candidates are known
Frequency Valid %
Very well 413 42,1
265 27,0
Neutral 123 12,5
Not well enough 135 13,8
Not at all 45 4,6
Total 980 100,0
Missing 7 -
Table 20: How well do you knowyour party’s candidates?
Total 987 -
33 In the smaller towns and villages it is quite common for one individual to occupy several different positions. He or she can be a teacher, a preacher, a community activist and party representative all at once. Hence, such individuals are well known but not necessarily as “candidates”. Voters might, therefore, require more information about the process through which the particular individual became a candidate.
State, Society and Democracy
294
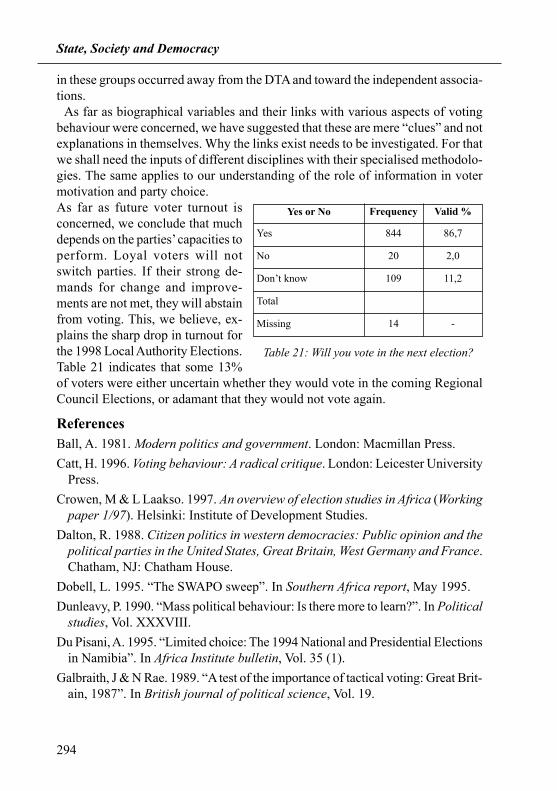
in these groups occurred away from the DTA and toward the independent associa-tions.
As far as biographical variables and their links with various aspects of voting behaviour were concerned, we have suggested that these are mere “clues” and not explanations in themselves. Why the links exist needs to be investigated. For that we shall need the inputs of different disciplines with their specialised methodolo-gies. The same applies to our understanding of the role of information in voter motivation and party choice.As far as future voter turnout is concerned, we conclude that much depends on the parties’ capacities toperform. Loyal voters will not switch parties. If their strong de-mands for change and improve-ments are not met, they will abstain from voting. This, we believe, ex-plains the sharp drop in turnout for the 1998 Local Authority Elections. Table 21 indicates that some 13% of voters were either uncertain whether they would vote in the coming Regional Council Elections, or adamant that they would not vote again.
ReferencesBall, A. 1981. Modern politics and government. London: Macmillan Press.
Catt, H. 1996. Voting behaviour: A radical critique. London: Leicester University Press.
Crowen, M & L Laakso. 1997. An overview of election studies in Africa (Working paper 1/97). Helsinki: Institute of Development Studies.
Dalton, R. 1988. Citizen politics in western democracies: Public opinion and the political parties in the United States, Great Britain, West Germany and France. Chatham, NJ: Chatham House.
Dobell, L. 1995. “The SWAPO sweep”. In Southern Africa report, May 1995.
Dunleavy, P. 1990. “Mass political behaviour: Is there more to learn?”. In Political studies, Vol. XXXVIII.
Du Pisani, A. 1995. “Limited choice: The 1994 National and Presidential Elections in Namibia”. In Africa Institute bulletin, Vol. 35 (1).
Galbraith, J & N Rae. 1989. “A test of the importance of tactical voting: Great Brit- ain, 1987”. In British journal of political science, Vol. 19.
Table 21: Will you vote in the next election?
Yes or No Frequency Valid %
Yes 844 86,7
No 20 2,0
Don’t know 109 11,2
Total
Missing 14 -
Voting Behaviour in Namibia
295
Gidengil, E. 1992. “Canada votes: A quarter century of Canadian national election studies”. In Canadian journal of political science, Vol. XXV:2.
Horowitz, D. 1985. Ethnic groups in conflict. Berkeley: University of California Press.
Keulder, C. 1998. Voting behaviour in Namibia: Local Authority Elections 1998. Windhoek: USAID and Friedrich-Ebert-Stiftung.
Kinder, D & R Kiewiet. 1981. “Sociotropic politics: The American case”. In British journal of political science, Vol. 11.
Lindeke, W et al. 1992. “Namibia’s election revisited”. In Politikon, Vol. 18 (2).
Lipset, SM. 1984. “Social conflict, legitimacy and democracy”. In Connolly, W (Ed.). Legitimacy and the State. Oxford: Basil Blackwell.
Mafeje, A. 1971. “The ideology of tribalism”. In Journal of modern African studies, Vol. 9 (2).
Mafeje, A. 1991. The theory and ethnography of African social formations: The case of the interacustrine kingdoms. Dakar: CODESRIA.
Mafeje, A. 1996. “Anthropology and independent Africans: Suicide or end of an era?”. In CODESRIA monograph series 4/96. Dakar: CODESRIA.
Marcus, G & M MacKuen. 1993. “Anxiety, enthusiasm and the vote: The emotional underpinnings of learning and involvement during presidential campaigns”. In American political science review, Vol. 87 (3), September 1993.
Mattes, R & A Gouws. 1998. “Race, ethnicity and voting behaviour: Lessons from South Africa”. In Sisk, TD & A Reynolds (Eds.). Elections and conflict resolution
in Africa. Washington, DC: United States Institute of Peace.
Niemi, R & H Weisberg (Eds.). 1978. Controversies in voting behavior. Washington, DC: Congressional Quarterly Press.
Pendleton, W et al. 1993. A study of voting behaviour in the 1992 Namibian Re- gional and Local Government Elections plus election statistics. Windhoek: Uni- versity of Namibia.
Pinkleton, B. 1997. “The effects of negative comparative political advertising on candidate evaluations and advertising evaluations: An exploration”. In Journal of
advertising, Vol. XXVI (1), Spring 1997.
Potgieter, P. 1991. “The Resolution 435 election in Namibia”. In Politikon, Vol. 18 (2).
Ranney, A. 1966. The governing of men. New York: Holt, Rinehart & Winston Inc.
Sartori, G. 1995. “How far can free government travel?”. In Journal of democracy, Vol. 6 (3), July 1995.
State, Society and Democracy
296
Saward, M. 1994. “Democratic theory and the indices of democratization”. In Beetham, D (Ed.). Defining and measuring democracy. London: Sage Publishers.
Soiri, I. 1998. Why the 1997 Local Authority Elections in Namibia were postponed (Working paper 1/98). Helsinki: Institute of Development Studies, University of
Helsinki.
Tötemeyer, G et al. (Eds.). 1996. Elections in Namibia. Windhoek: Gamsberg Macmillan.
Weiland, H. 1996. “The 1994 exit poll survey”. In Tötemeyer, G et al. (Eds.). Elec- tions in Namibia. Windhoek: Gamsberg Macmillan.