Embed Size (px)
Citation preview
Voluntary Support of EducationKey findings from data collected for the 2019–20 academic fiscal year for U.S. higher education institutions
COUNCIL FOR ADVANCEMENT AND SUPPORT OF EDUCATION
case.orgLondon Mexico City Singapore Washington, D.C.
© 2021 Council for Advancement and Support of EducationOriginal publication date: February 2021
All rights reserved. No part of the material protected by this copyright may be reproduced or used in any form, electronic or mechanical, including photocopying, recording, or by any information storage and retrieval system, without written permission from the Council for Advancement and Support of Education.
Limit of Liability/Disclaimer: While the publisher has used its best efforts in preparing this document, it makes no representations or warranties in respect to the accuracy or completeness of its contents. No liability or responsibility of any kind (to extent permitted by law), including responsibility for negligence is accepted by the Council for Advancement and Support of Education, its servants or agents. All information gathered is believed correct at publication date. Neither the publisher nor the author is engaged in rendering legal, accounting or other professional services. If legal advice or other expert assistance is required, the services of a competent professional should be sought.
AUTHOR
Ann E. Kaplan, Senior Director, Voluntary Support of Education Survey, CASE
COVER ART CREDIT
© aelitta / iStock / Getty Images Plus
FOR MORE INFORMATION, CONTACT:
Ann E. Kaplan Senior Director, Voluntary Support of Education Survey [email protected] +1-917-979-4827
Introduction . . . . . . . . . . . . . . . . . . . . . . . . . . . . . . . . . . . . . . . . . . . . . . . . . . . . . . . . . . . . . . . . . . . . . . . . . . . . . . . . . . . . . . . . . . . . . 4
Charitable Giving to U.S. Colleges and Universities Virtually Unchanged . . . . . . . . . . . . . . . . . . . . . . 4
The Largest Increase in Contributions Was from Other Organizations . . . . . . . . . . . . . . . . . . . . . . . . . 4
Current Operations Gifts Rose. Gifts for Capital Purposes Declined. . . . . . . . . . . . . . . . . . . . . . . . . . . . . 5
Covid-19 Enters in Early 2020, Sharply Dividing the Climate of The Fiscal Year . . . . . . . . . . . . . . . . . 7
Results Differed by Type of Institution and Within Types of Institutions . . . . . . . . . . . . . . . . . . . . . . . . 9
Seven Gifts of $100 Million . . . . . . . . . . . . . . . . . . . . . . . . . . . . . . . . . . . . . . . . . . . . . . . . . . . . . . . . . . . . . . . . . . . 9
Looking Ahead . . . . . . . . . . . . . . . . . . . . . . . . . . . . . . . . . . . . . . . . . . . . . . . . . . . . . . . . . . . . . . . . . . . . . . . . . . . . . . 9
Fundraising Inputs . . . . . . . . . . . . . . . . . . . . . . . . . . . . . . . . . . . . . . . . . . . . . . . . . . . . . . . . . . . . . . . . . . . . . . . . . . 10
Endnotes . . . . . . . . . . . . . . . . . . . . . . . . . . . . . . . . . . . . . . . . . . . . . . . . . . . . . . . . . . . . . . . . . . . . . . . . . . . . . . . . . . . 10
Methodology . . . . . . . . . . . . . . . . . . . . . . . . . . . . . . . . . . . . . . . . . . . . . . . . . . . . . . . . . . . . . . . . . . . . . . . . . . . . . . . . . . . . . . . . . . . 11
CONTENTS

Introduction
Since 1957, the Voluntary Support of Education (VSE) annual survey has collected data on fundraising outcomes in higher education institutions in the United States. It is regarded as the definitive source of information on philanthropic support of those institutions.
Data from the survey are used to estimate total charitable support of all institutions of higher education in the nation, including nonrespondents. Survey respondents must adhere to the Reporting Standards and Management Guidelines, first published jointly with the National Association of College and University Business Officers (NACUBO) in 1982. CASE updated the standards in 1996, 2004, and 2009.
In March 2021, CASE will publish the CASE Global Reporting Standards, 1st Edition. This is an update to the CASE Reporting Standards and Management Guidelines. The VSE survey will adopt these standards for the 2022 survey. They will not greatly affect what is counted, but they will clarify how to value certain transactions.
The new standards are anchored by the following principle: Educational Philanthropy is the voluntary act of providing private financial support to nonprofit educational institutions. To be categorized as philanthropy in keeping with CASE standards, such financial support must be provided for the sole purpose of benefiting the institution’s mission and its social impact, without the expressed or implied expectation that the donor will receive anything more than recog nition and stewardship as the result of such support.1
A summary of the key findings from the 2019–2020 academic fiscal year follows. The raw survey data are available in Data Miner, the online benchmarking program, which is a CASE member benefit and is available to noneducational institutions by subscription.
CHARITABLE GIVING TO U.S. COLLEGES AND UNIVERSITIES VIRTUALLY UNCHANGEDAccording to the VSE survey, voluntary support of higher education institutions in the United States was essentially flat in the fiscal year that, for most institutions, ended June 30, 2020. While support edged down twotenths of a percent, at $49.50 billion, nearly half—48.6%—of responding institutions reported giving rose in 2020.
In addition, in 2019, Michael Bloomberg’s charities and foundation gave $1.8 billion to Johns Hopkins University. If that contribution were removed from 2019 results, giving in 2020 would have increased 3.6%.
A CASE analysis of institutions that responded for the past four reporting cycles reveals that varying frequencies of rising and falling gift receipts are the norm. Indeed, even an institution that posts lower levels of giving in a particular year may have had a good year. Sometimes a very large gift the previous year results in a percentage decline that is not really a negative event.
THE LARGEST INCREASE IN CONTRIBUTIONS WAS FROM OTHER ORGANIZATIONSThe largest increase—7%—came from “other organizations.” This category of donors, while smaller than others, has grown the most in the past decade. Giving from other organizations rose 53.2% since 2011. In 2020, other organization giving surpassed corporate support for the first time. (See Figure 2.)
Much of this funding is due to donoradvised funds (DAFs). A subset of 400 institutions reported on support from DAFs. Those entities represented 73.9% of the funds contributed from “other organizations” in that sample.
Giving from nonalumni individuals rose 4% in 2020. All other sources reduced giving in the aggregate. The relative significance of types of donors was unchanged, however, with foundations and alumni together supplying 55.5% of total support. (See
Due to rounding, dollar totals in tables and figures may not add up and percentages may not equal 100.
CASE VSE Key Findings, 2019–20
4

Figure 1 and Figure 2.) A subset of 564 institutions supplied data on types of foundations. They reported that 43.3% of foundation support was from family foundations, which are often conduits of personal intentions to contribute.
CURRENT OPERATIONS GIFTS ROSE. GIFTS FOR CAPITAL PURPOSES DECLINED.Gifts for current operations increased 7%, and gifts to capital purposes declined 10% in 2020. Capital
purpose contributions include gifts to endowments, those for or of property, buildings, and equipment, and gifts to loan funds. They also include newly established charitable remainder trusts, charitable gift annuities, and pooled income funds. (See Figure 1.)
However, the specific targets of types of gifts did not change much. Student financial aid remains the largest purpose to which gifts to endowment are restricted by donors. Current operations gifts tend
Due to rounding, dollar totals in tables and figures may not add up and percentages may not equal 100.
Percentage Change 2019 2020 2019 to 2020
Amount Percentage Amount Percentage Adj. for Raised ofTotal Raised ofTotal Current$ Inflation
Total Voluntary Support $49,600 100.0 $49,500 100.0 -0.2 -1.1
Source Alumni $11,200 22.6 $11,060 22.3 -1.3 -2.1 Nonalumni Individuals 8,300 16.7 8,630 17.4 4.0 3.0 Corporations 6,800 13.7 6,630 13.4 -2.5 -3.4 Foundations 17,000 34.3 16,440 33.2 -3.3 -4.2 OtherOrganizations 6,300 12.7 6,740 13.6 7.0 6.0
Purpose CurrentOperations $28,500 57.5 $30,500 61.6 7.0 6.0 CapitalPurposes $21,100 42.5 $19,000 38.4 -10.0 -10.8
Figure 1: Estimated Voluntary Support of Higher Education by Source and Purpose, 2019 and 2020(Dollars in Millions)
Other Organiza�ons
Corpora�ons
NonalumniIndividuals
Founda�onsAlumni
0%
5%
10%
15%
20%
25%
30%
35%
40%
1990 1993 1996 1999 2002 2005 2008 2011 2014 2017 2020
Figure 2: Voluntary Support by Source as a Percentage of Total Voluntary Support, 1990–2020
CASE VSE Key Findings, 2019–20
5
Public Operation& Student Other Number Academic Faculty&Staff Service& Maintenance Financial RestrictedTypeofInstitution Reporting Divisions Compensation Research Extension Library ofPlant Aid Athletics Purposes Total
Multiple CampusesPublic 13 12.4 19.6 10.3 1.0 0.5 0.1 39.3 0.5 16.3 100.0Research/DoctoralPrivate 74 19.2 15.5 8.3 0.3 0.4 0.9 35.0 2.0 18.3 100.0Public 113 23.6 14.8 4.5 0.8 1.0 0.5 39.6 2.1 13.2 100.0Master’sPrivate 48 10.3 5.3 0.5 0.4 0.3 2.1 57.9 1.2 22.0 100.0Public 77 14.2 3.8 4.3 1.6 1.2 0.9 54.2 0.7 19.0 100.0BaccalaureatePrivate 113 6.8 9.7 2.7 0.4 0.6 1.1 57.1 1.5 20.1 100.0Public 14 49.8 2.8 0.0 8.5 0.2 0.2 35.8 1.5 1.3 100.0SpecializedPrivate 6 2.0 10.3 6.1 2.9 0.0 0.5 59.9 0.0 18.3 100.0Public 13 27.2 19.5 20.7 0.5 0.0 7.3 20.5 0.0 4.2 100.0Associate’s Private 0 Public 43 1.6 3.4 0.0 2.8 0.0 0.0 73.4 0.1 18.7 100.0All Institutions 514 18.6 14.7 6.9 0.6 0.6 0.9 39.7 1.7 16.4 100.0
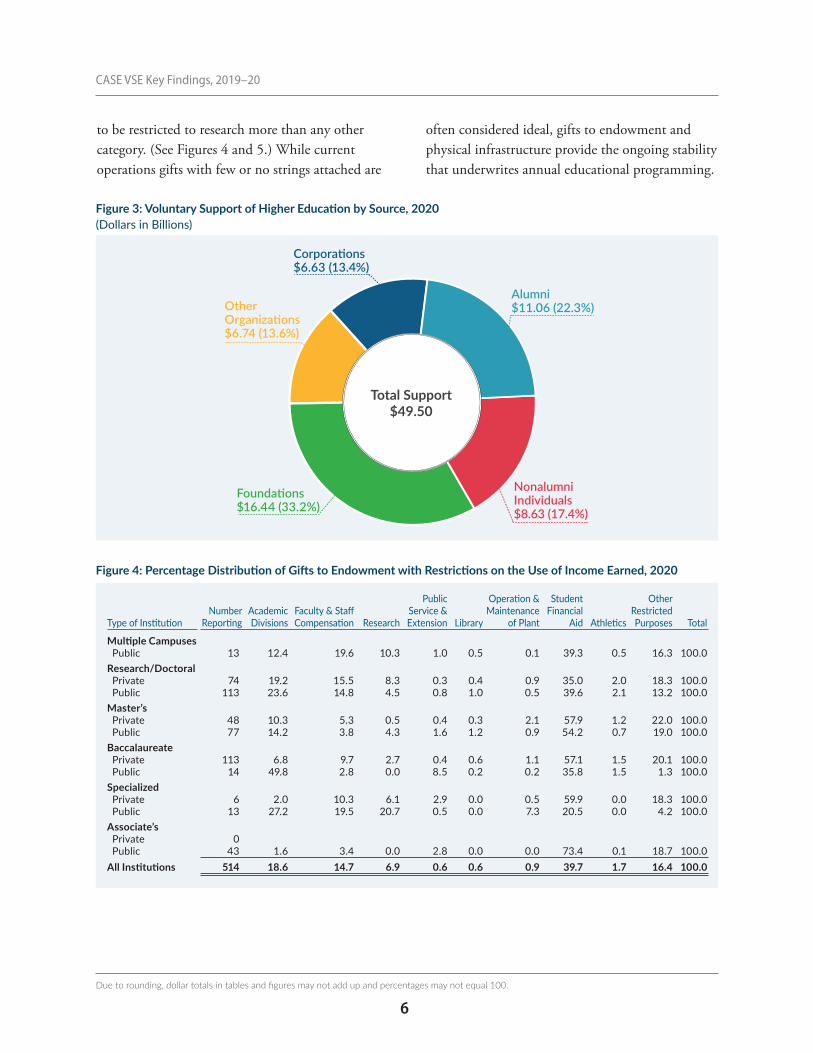
Figure 4: Percentage Distribution of Gifts to Endowment with Restrictions on the Use of Income Earned, 2020
Due to rounding, dollar totals in tables and figures may not add up and percentages may not equal 100.
to be restricted to research more than any other category. (See Figures 4 and 5.) While current operations gifts with few or no strings attached are
often considered ideal, gifts to endowment and physical infrastructure provide the ongoing stability that underwrites annual educational programming.
Nonalumni Individuals $8.63 (17.4%)
Corpora�ons $6.63 (13.4%)
Other Organiza�ons $6.74 (13.6%)
Founda�ons $16.44 (33.2%)
Alumni $11.06 (22.3%)
Total Support$49.50
Figure 3: Voluntary Support of Higher Education by Source, 2020(Dollars in Billions)
CASE VSE Key Findings, 2019–20
6

COVID-19 ENTERS IN EARLY 2020, SHARPLY DIVIDING THE CLIMATE OF THE FISCAL YEARThe two most important periods of fundraising activity—calendaryearend and fiscalyearend—fell in markedly different economic and social atmospheres. In February 2020, the National Bureau of Economic Research (NBER) declared the nation was in a recession.2 In contrast, 2019 was part of
the longest economic expansion in U.S. history.Between July 1, 2019—the beginning of the
fiscal year— and December 31, 2019—the end of the calendar year and typically a period of robust fundraising activity—all four major stock market indexes had increased. (See Figure 6.) By the end of the fiscal year—June 30, 2020, the market was mixed, and it had dropped earlier in the calendar year, causing uncertainty.3 (See Figure 7.)
Due to rounding, dollar totals in tables and figures may not add up and percentages may not equal 100.
Dow Jones New York Industrial NASDAQ StockExchange Standard& Average Composite Composite Poor’s500
1-Jul-19 26,805.86 8,145.85 13,049.71 2,971.4130-Jun-20 25,812.88 10,058.77 11,893.78 3,100.29PercentageChange -3.7% 23.5% -8.9% 4.3%
Figure 7: Value of Stock Indexes from Beginning to End of the 2020 Fiscal Year
Public Operation& Student Other Number Academic Faculty&Staff Service& Maintenance Financial RestrictedTypeofInstitution Reporting Divisions Compensation Research Extension Library ofPlant Aid Athletics Purposes Total
Multiple CampusesPublic 15 12.3 1.4 35.4 5.8 0.5 7.7 6.9 5.0 25.0 100.0Research/Doctoral Private 77 21.8 1.4 36.4 1.6 0.6 2.4 8.9 3.9 23.0 100.0Public 132 22.6 1.7 31.7 5.0 0.7 2.9 10.5 11.0 13.9 100.0Master’sPrivate 63 14.7 0.8 1.8 5.2 1.7 19.3 20.6 11.3 24.6 100.0 Public 88 29.2 0.6 4.9 8.6 2.4 3.1 22.3 10.1 18.7 100.0Baccalaureate Private 134 12.4 3.1 2.8 2.6 0.7 3.0 32.9 7.8 34.7 100.0Public 16 26.5 2.7 2.5 2.7 0.3 8.0 24.8 7.6 24.9 100.0SpecializedPrivate 8 15.2 1.8 2.5 0.6 0.1 13.3 29.0 2.0 35.4 100.0Public 14 41.6 1.6 42.4 2.0 0.0 0.4 2.4 0.0 9.5 100.0Associate’s Private 0Public 43 12.7 0.2 0.0 6.3 0.2 1.1 51.2 0.9 27.5 100.0All Institutions 590 21.6 1.5 32.6 3.8 0.6 3.6 10.1 6.8 19.5 100.0
Figure 5: Percentage Distribution of Gifts for Current Operations with Restrictions on Use, 2020
Dow Jones New York Industrial NASDAQ StockExchange Standard& Average Composite Composite Poor’s500
1-Jul-19 26,805.86 8,145.85 13,049.71 2,971.4131-Dec-19 28,538.44 8,972.60 13,913.03 3,230.78PercentageChange 6.5% 10.1% 6.6% 8.7%
Figure 6: Value of Stock Indexes from Beginning of Fiscal Year to End of Calendar Year 2019
CASE VSE Key Findings, 2019–20
7
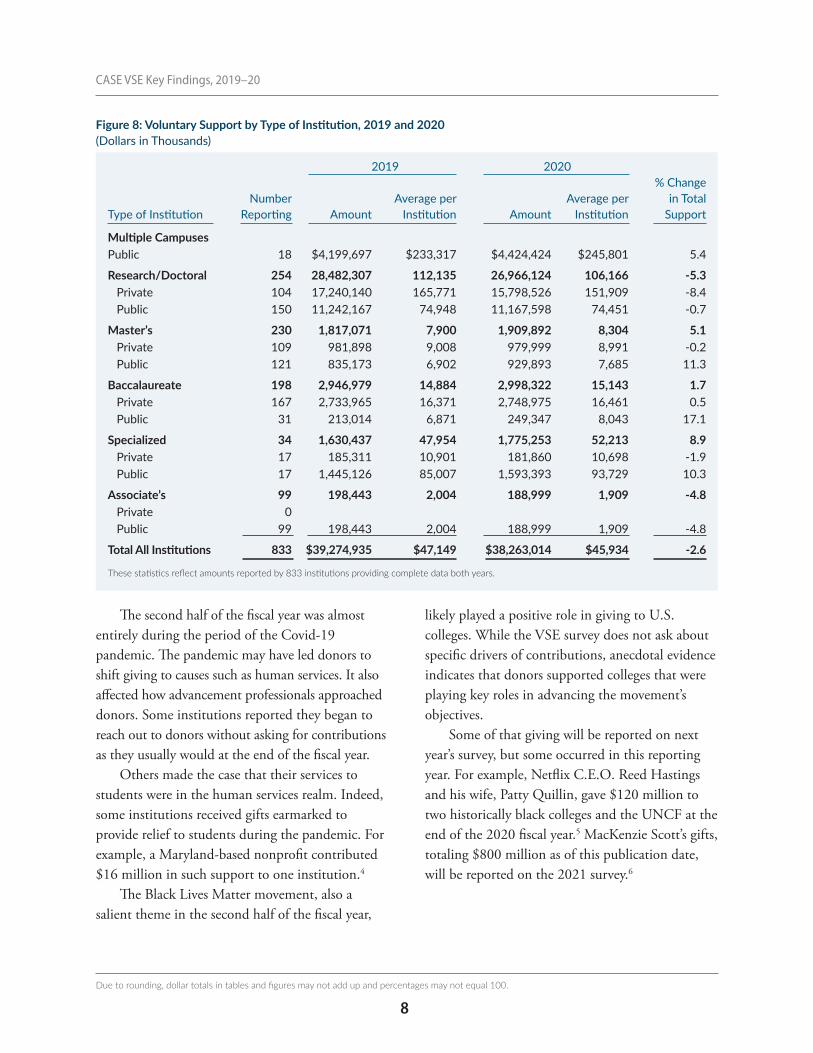
The second half of the fiscal year was almost entirely during the period of the Covid19 pandemic. The pandemic may have led donors to shift giving to causes such as human services. It also affected how advancement professionals approached donors. Some institutions reported they began to reach out to donors without asking for contributions as they usually would at the end of the fiscal year.
Others made the case that their services to students were in the human services realm. Indeed, some institutions received gifts earmarked to provide relief to students during the pandemic. For example, a Marylandbased nonprofit contributed $16 million in such support to one institution.4
The Black Lives Matter movement, also a salient theme in the second half of the fiscal year,
likely played a positive role in giving to U.S. colleges. While the VSE survey does not ask about specific drivers of contributions, anecdotal evidence indicates that donors supported colleges that were playing key roles in advancing the movement’s objectives.
Some of that giving will be reported on next year’s survey, but some occurred in this reporting year. For example, Netflix C.E.O. Reed Hastings and his wife, Patty Quillin, gave $120 million to two historically black colleges and the UNCF at the end of the 2020 fiscal year.5 MacKenzie Scott’s gifts, totaling $800 million as of this publication date, will be reported on the 2021 survey.6
Due to rounding, dollar totals in tables and figures may not add up and percentages may not equal 100.
Figure 8: Voluntary Support by Type of Institution, 2019 and 2020(Dollars in Thousands)
2019 2020 % Change Number Average per Average per in TotalTypeofInstitution Reporting Amount Institution Amount Institution Support
Multiple CampusesPublic 18 $4,199,697 $233,317 $4,424,424 $245,801 5.4
Research/Doctoral 254 28,482,307 112,135 26,966,124 106,166 -5.3 Private 104 17,240,140 165,771 15,798,526 151,909 -8.4 Public 150 11,242,167 74,948 11,167,598 74,451 -0.7
Master’s 230 1,817,071 7,900 1,909,892 8,304 5.1 Private 109 981,898 9,008 979,999 8,991 -0.2 Public 121 835,173 6,902 929,893 7,685 11.3
Baccalaureate 198 2,946,979 14,884 2,998,322 15,143 1.7 Private 167 2,733,965 16,371 2,748,975 16,461 0.5 Public 31 213,014 6,871 249,347 8,043 17.1
Specialized 34 1,630,437 47,954 1,775,253 52,213 8.9 Private 17 185,311 10,901 181,860 10,698 -1.9 Public 17 1,445,126 85,007 1,593,393 93,729 10.3
Associate’s 99 198,443 2,004 188,999 1,909 -4.8 Private 0 Public 99 198,443 2,004 188,999 1,909 -4.8
Total All Institutions 833 $39,274,935 $47,149 $38,263,014 $45,934 -2.6
These statistics reflect amounts reported by 833 institutions providing complete data both years.
CASE VSE Key Findings, 2019–20
8
Due to rounding, dollar totals in tables and figures may not add up and percentages may not equal 100.
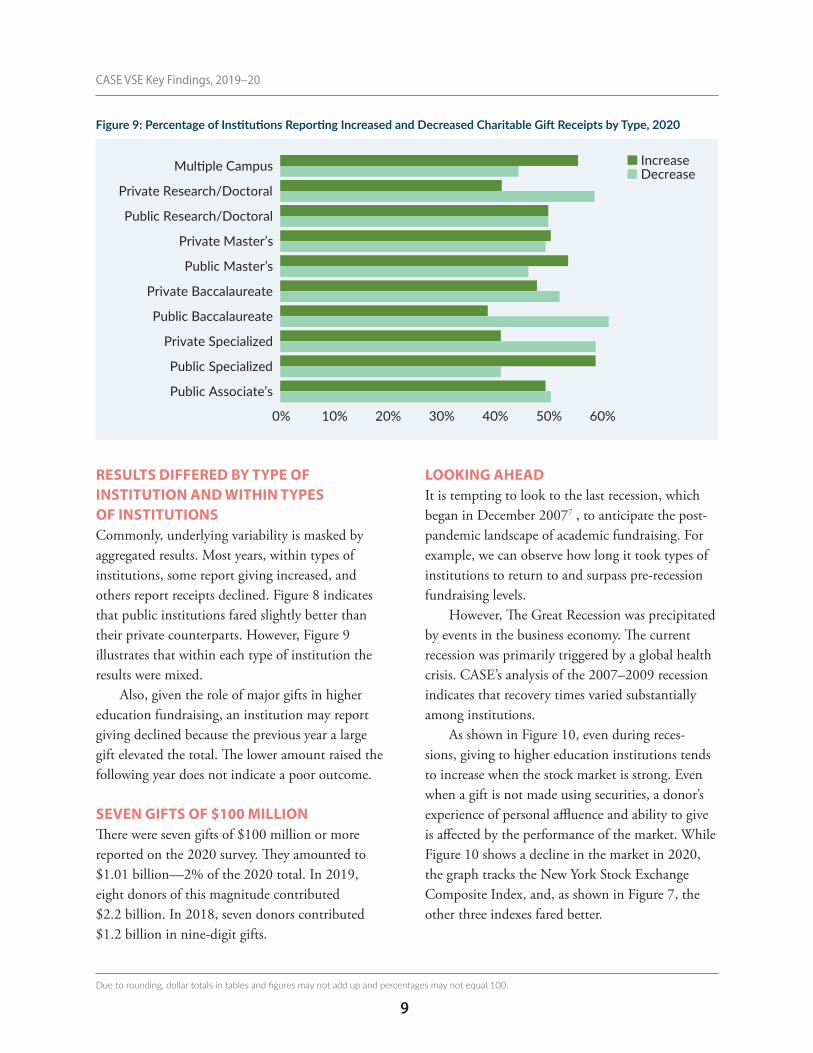
Figure 9: Percentage of Institutions Reporting Increased and Decreased Charitable Gift Receipts by Type, 2020
IncreaseDecrease
0% 10% 20% 30% 40% 50% 60%
Mul�ple Campus
Private Research/Doctoral
Public Research/Doctoral
Private Master’s
Public Master’s
Private Baccalaureate
Public Baccalaureate
Private Specialized
Public Specialized
Public Associate’s
RESULTS DIFFERED BY TYPE OF INSTITUTION AND WITHIN TYPES OF INSTITUTIONSCommonly, underlying variability is masked by aggregated results. Most years, within types of institutions, some report giving increased, and others report receipts declined. Figure 8 indicates that public institutions fared slightly better than their private counterparts. However, Figure 9 illustrates that within each type of institution the results were mixed.
Also, given the role of major gifts in higher education fundraising, an institution may report giving declined because the previous year a large gift elevated the total. The lower amount raised the following year does not indicate a poor outcome.
SEVEN GIFTS OF $100 MILLIONThere were seven gifts of $100 million or more reported on the 2020 survey. They amounted to $1.01 billion—2% of the 2020 total. In 2019, eight donors of this magnitude contributed $2.2 billion. In 2018, seven donors contributed $1.2 billion in ninedigit gifts.
LOOKING AHEADIt is tempting to look to the last recession, which began in December 20077 , to anticipate the postpandemic landscape of academic fundraising. For example, we can observe how long it took types of institutions to return to and surpass prerecession fundraising levels.
However, The Great Recession was precipitated by events in the business economy. The current recession was primarily triggered by a global health crisis. CASE’s analysis of the 2007–2009 recession indicates that recovery times varied substantially among institutions.
As shown in Figure 10, even during recessions, giving to higher education institutions tends to increase when the stock market is strong. Even when a gift is not made using securities, a donor’s experience of personal affluence and ability to give is affected by the performance of the market. While Figure 10 shows a decline in the market in 2020, the graph tracks the New York Stock Exchange Composite Index, and, as shown in Figure 7, the other three indexes fared better.
CASE VSE Key Findings, 2019–20
9

Figure 10: Changes in Voluntary Support of Higher Education Institutions Related to the Stock Market and Recessions, 1982–2020
New York Stock Exchange Composite Index Voluntary Support of Higher Educa�onRecessions
-30%
-20%
-10%
0%
10%
20%
30%
40%
1982
1984
1986
1988
1990
1992
1994
1996
1998
20002002
20042006
20082010
20122014
20162018
2020Pere
rcen
tage
Cha
nge
Adj
uste
d fo
r Infl
a�on
FUNDRAISING INPUTSData about fundraising outcomes do not account for the fundraising inputs that greatly affect those results. CASE’s Alumni Engagement Metrics survey and an optional section of the VSE survey do ask about investments of dollars and FTEs in advancement functions. Still, much specific evidence of good leadership and successful programming remains anecdotal. Such evidence, while not the topic of this brief, greatly matters. CASE is committed to engaging advancement professionals in forums that enable them to share such expertise.
ENDNOTES1. CASE Global Reporting Standards, 1st ed.,
Washington, DC: Council for Advancement and Support of Education, 2021, Appendix B.
2. https://www.nber.org/research/businesscycledating. Downloaded January 6, 2021.
3. https://finance.yahoo.com. Downloaded December 15, 2020.
4. https://globalmedia.umgc.edu/2020/04/27/record16milliongiftdoublesumgc endowmentseedsstudentemergencyfundatcriticaltime/. Downloaded January 6, 2021.
5. https://www.nytimes.com/2020/06/17/ business/netflixreedhastingshbcus.html.Downloaded January 6, 2021.
6. https://www.washingtonpost.com/local/ education/mackenziescotthbcudonations/2020/12/17/0ce9ef5a406f11eb8db8395dedaaa036_story.html. Downloaded January 6, 2021.
7. In graphs depicting recessions in VSE materials, the recession is labeled in 2008, since most of 2007 was during an expansion.
CASE VSE Key Findings, 2019–20
10
Methodology
The 2020 survey collected data on charitable gifts and grants raised from private sources for the fiscal year beginning July 1, 2019, and ending June 30, 2020 (with a few institutions reporting on different fiscal calendars).
Participation varied considerably by type of institution. The number of U.S. higher education participants in 2020 was 873. They represent about 27.5% of colleges and universities in the U.S. but raised 78% of total voluntary support of U.S. higher education institutions in the 2019–2020 academic fiscal year. Note there are key differences between the amounts reported as national estimates and those that summarize survey responses, from which the national estimates are derived.
By developing national estimates each year, CASE can correct for annual differences in participation. CASE approaches the estimation process in two ways. First, CASE considers the percentage change in support by source group and by major purpose category among institutions that participate for two consecutive years—the core group of institutions. Since the core group’s gift income typically represents more than 90% of all reported gift income, the group’s data provide a robust set of
benchmarks on yeartoyear changes, which can be applied to the previous year’s national estimates.
However, because the coregroup results may be more positive than those we would get were the survey to achieve full participation, CASE adjusts the degree of change in the national estimates downward as appropriate by comparison with the core group. Second, CASE looks at participation by Carnegie classification, which groups higher education institutions into basic types. The average total support per type of nonparticipating institution varies from 15% to 30% of what was reported on average by participating institutions. Nonparticipants tend to be smaller, and there is a tendency not to participate after a weak year. In addition, the response rate varies by Carnegie classification. Participation is highest among research/doctoral institutions and lowest among associate’s (twoyear) institutions.
CASE derives estimates of support among nonparticipants by Carnegie classification. The sum of these estimates and the survey results are generally close to the national estimates arrived at by the first method described. If not, CASE reviews and adjusts factors and weights until there is reasonable consistency across the entire model.
CASE VSE Key Findings, 2019–20
11

w
The Council for Advancement and Support of Education (CASE) is the professional organization for advancement professionals at all levels who work in alumni relations, communications and marketing, development and advancement services.CASE’s membership includes nearly 3,600 colleges, universities, and independent elementary and secondary schools in more than 82 countries. This makes CASE one of the largest nonprofit education associations in the world in terms of institutional membership. CASE serves more than 90,000 advancement professionals on the staffs of member institutions.CASE has offices in Washington, D.C., London, Singapore and Mexico City. The association produces high-quality and timely content, publications, conferences, institutes and workshops that assist advancement professionals in performing more effectively and serving their institutions.
AMAtlassm is a global resource for educational advancement-related metrics, benchmarks, and analytics, providing a data-rich resource for schools, universities, and colleges.
case.org/amAtlas


![Voluntary Medical Support of a State Police Agency.ppt€¦ · Hurricane Escorts ... Voluntary Medical Support of a State Police Agency.ppt [Compatibility Mode] Author: bonga](https://img.pdfslide.us/doc/110x75/5ade62fe7f8b9a8f298b8a51/voluntary-medical-support-of-a-state-police-hurricane-escorts-voluntary-medical.jpg)