Embed Size (px)
Citation preview
Volumes 105, Number 1 - 3 Spring 2003, ISSN: 0273–2289
HUMANA PRESS
AppliedBiochemistry andBiotechnology
AppliedBiochemistry andBiotechnologyExecutive Editor: David R. Walt
Biotechnologyfor Fuels and Chemicals
The Twenty-Fourth Symposium
Editors
Brian H. DavisonJames W. Lee
James D. McMillanMark Finkelstein
Dilute–H2SO4 Pretreatment of Corn Stover 69
Applied Biochemistry and Biotechnology Vol. 105–108, 2003
Copyright © 2003 by Humana Press Inc.All rights of any nature whatsoever reserved.0273-2289/03/105-108/0069/$20.00
69
*Author to whom all correspondence and reprint requests should be addressed.
Dilute–Sulfuric Acid Pretreatmentof Corn Stover in Pilot-Scale Reactor
Investigation of Yields, Kinetics,and Enzymatic Digestibilities of Solids
DANIEL J. SCHELL,* JODY FARMER, MILLIE NEWMAN,AND JAMES D. MCMILLAN
National Bioenergy Center, National Renewable Energy Laboratory,1617 Cole Boulevard, Golden, CO 80401, E-mail: [email protected]
Abstract
Corn stover is a domestic feedstock that has potential to produce signifi-cant quantities of fuel ethanol and other bioenergy and biobased products.However, comprehensive yield and carbon mass balance information andvalidated kinetic models for dilute–sulfuric acid (H2SO4) pretreatment ofcorn stover have not been available. This has hindered the estimation ofprocess economics and also limited the ability to perform technoeconomicmodeling to guide research. To better characterize pretreatment and assessits kinetics, we pretreated corn stover in a continuous 1 t/d reactor. Cornstover was pretreated at 20% (w/w) solids concentration over a range ofconditions encompassing residence times of 3–12 min, temperatures of 165–195°C, and H2SO4 concentrations of 0.5–1.4% (w/w). Xylan conversion yieldand carbon mass balance data were collected at each run condition. Perfor-mance results were used to estimate kinetic model parameters assumingbiphasic hemicellulose hydrolysis and a hydrolysis mechanism incorpo-rating formation of intermediate xylo-oligomers. In addition, some of thepretreated solids were tested in a simultaneous saccharification and fer-mentation (SSF) process to measure the reactivity of their cellulose compo-nent to enzymatic digestion by cellulase enzymes. Monomeric xylose yieldsof 69–71% and total xylose yields (monomers and oligomers) of 70–77%were achieved with performance level depending on pretreatment sever-ity. Cellulose conversion yields in SSF of 80–87% were obtained for some ofthe most digestible pretreated solids.
Index Entries: Pretreatment; dilute–sulfuric acid; enzymatic conversion;corn stover; xylan conversion; kinetics; pilot scale.
70 Schell et al.
Applied Biochemistry and Biotechnology Vol. 105–108, 2003
Introduction
The potential of biomass-derived ethanol for use as a transportationfuel has been previously documented (1,2). One promising technology forconversion of biomass to ethanol is an enzyme-based process utilizing apretreatment process to enhance the enzymatic conversion of cellulose tosoluble glucose. A variety of pretreatment processes utilizing mechanical,thermomechanical, and thermochemical processing have been developedto alter the structural and chemical composition of biomass to improveenzymatic conversion (3,4). One pretreatment that has been extensivelyexplored is a high temperature, dilute–sulfuric acid (H2SO4) process, whichalso effectively hydrolyzes the hemicellulosic portion of the biomass tosoluble sugars.
Extensive work has been done on dilute–H2SO4 pretreatment of avariety of feedstocks (3), however, relatively little work has been doneusing corn stover. Corn stover, which includes the leaves, stalks, and cobsof the corn plant, may be available in quantities that could support signifi-cant production of ethanol and other bioenergy and biobased products.Several groups have investigated dilute–H2SO4 pretreatment of corn sto-ver at low solids concentrations in batch, bench-scale reactors (5,6), butlittle information on xylan hydrolysis is reported. The primary focus ofprevious work has been on obtaining good enzymatic conversion of thepretreated solids.
More recently, Esteghlalian et al. (7) performed dilute–H2SO4 pre-treatments at 10% solids concentration in a Parr reactor at conditions of140–180°C, 0.6–1.2% (w/w) H2SO4, and estimated residence times span-ning 1–60 min. They modeled biphasic xylan hydrolysis and determinedthe rate constants using Arrhenius-type expressions with preexponentialfactors dependent on the effective acid concentration (i.e., acid concentra-tion after neutralization by ash contained in the feedstock) to determinethe rate constants. The model-predicted monomeric yields of 80–90%could be achieved at temperatures of 170–180°C with effective acid con-centrations >1.0%.
Chen et al. (8) determined the kinetic parameters for dilute–H2SO4
xylan hydrolysis modeled with biphasic xylan hydrolysis and formation ofintermediate xylo-oligomers. Pretreatments were performed in a Parr reac-tor at 6% solids concentration using temperature conditions of 120–150°C,acid concentrations of 0.44–1.9%, and residence times of 2–90 min. Theseinvestigators calculated that maximum xylose yields were about 89%regardless of reaction temperature.
The goal of the present work was to investigate dilute–H2SO4 pretreat-ment of corn stover in a pilot-scale (1 dry t of biomass/d) continuous reac-tor at high solids concentrations (20% [w/w]). We wished to work atconditions and with equipment that would generate more commerciallyrelevant results than have been reported previously. The results producedduring our study were xylan yields with carbon mass balance closure data

Dilute–H2SO4 Pretreatment of Corn Stover 71
Applied Biochemistry and Biotechnology Vol. 105–108, 2003
and enzymatic cellulose digestibilities at a variety of pretreatment condi-tions. In addition, rate parameters were determined from the data for akinetic model based on biphasic xylan hydrolysis that incorporates inter-mediate xylo-oligomer formation.
Calculating carbon mass balance across the pretreatment process isa useful technique for assessing the accuracy of performance measure-ments. Obtaining good carbon mass balance closure indicates internaldata consistency and provides a higher level of confidence in the accuracyof the underlying data. This is increasingly important as technologymoves toward commercialization, because confidence in performancedata is essential for engineering companies to commit to guaranteeingprocess performance. If carbon mass balance closures near 100% cannotbe obtained, then process stoichiometry or the accuracy of measuring oneor more of the carbon-containing process streams is suspect.
Materials and MethodsCorn Stover
Corn stover was obtained directly from Biomass AgriProducts(Harlan, IA). The tub-ground material was approx 9 mo old (harvested infall 1999) when received at National Renewable Energy Laboratory (NREL)(summer 2000) and was then used over a period of 9 mo. As received, cornstover was washed by mixing with water in an agitated 6000-L conical tankto remove dirt and other foreign matter. The washed corn stover was thendried to approx 10% moisture before use. The composition of the washedcorn stover (on a dry basis) from an average of five randomly selectedsamples from the lot was 37.1% cellulose, 19.8% xylan, 2.5% arabinan, 1.6%galactan, 1.4% mannan, 20.7 % lignin (acid soluble and insoluble), 7.8%protein, 5.2% ash, and 2.4% acetate.
Pretreatment System
Dilute–H2SO4 pretreatments were conducted in a continuous pilot-scale reactor operating at a feed rate of approx 32 kg (dry basis)/h. Theprocess flow diagram of the pretreatment system is shown in Fig. 1 andSchell et al. (9) describe in more detail the pilot plant and the data acquisi-tion and control system. Biomass is conveyed to the pretreatment systemfrom a feed hopper via a weigh belt and belt conveyor. The continuouspretreatment system consists of acid supply tanks; a biomass mixer; a high-temperature, high-pressure reactor system; and a flash tank. The pretreat-ment reactor system is a vertical pulp digester supplied by SundsDefibrator, (now Metso Paper USA, Norcross, GA) and includes the reactorand material feed (plug feeder) and discharge (reciprocating popet valves)systems. The reactor is steam heated and can operate at temperatures of150–200°C, and residence times of 3–20 min can be achieved by controllingfeedstock level in the reactor. A gamma-ray level sensor measures the levelof biomass in the pretreatment reactor. The acid delivery system consists of

72 Schell et al.
Applied Biochemistry and Biotechnology Vol. 105–108, 2003
two fiberglass-reinforced plastic tanks (only feeding from one tank at atime) and associated pumps. Acid is diluted to 5–12% (w/w) in the acidtank, and a calibrated conductivity probe measures acid concentration.
Continuous operation of the pretreatment system begins at the feedhopper. Washed and dried corn stover in totes is dumped into the feedhopper. Feedstock is continuously metered from the hopper onto a weighbelt that controls feed rate. A signal from the weigh belt provides feedbackcontrol to the screw on the bottom of the hopper that controls weigh beltloading. The feed rate is also used to control other additions of material(e.g., acid and water). The corn stover then exits the weigh belt onto a beltconveyor that delivers it to the pug mill mixer for mixing with dilute acidand water. Water is added as needed to adjust the solids concentration inthe pretreatment reactor. The wetted feedstock is screw conveyed to a plugfeeder that compresses the material into an impermeable plug that is thenforced into the pretreatment reactor. Liquid pressed out of the materialby the plug feeder is pumped into the pretreatment reactor to maintaindesired acid and water concentrations. The corn stover enters the side of thereactor and is conveyed by twin screws to the top of the reactor, where itflows over a weir and enters the main body of the reactor. There is nomixing in the main reactor body and the material essentially moves by pluggravity flow to the reactor discharge port at the bottom of the reactor. Arotating scraper on the bottom of the reactor facilitates movement of mate-
Fig. 1. Diagram of pilot-scale dilute-H2SO4 pretreatment system.
Dilute–H2SO4 Pretreatment of Corn Stover 73
Applied Biochemistry and Biotechnology Vol. 105–108, 2003
rial to the discharge port. Two reciprocating popet valves operating as apressure lock direct the pretreatment material into the flash tank. The reac-tor is vented to remove non-condensables and this stream is sent to a con-denser. The flash tank is a conical screw mixer, and vapor exiting from thetop of the tank is also sent to a condenser. The noncondensable fractionfrom both of these streams is sent to a scrubber. The pretreated feedstockexits the bottom of the flash tank.
Pretreatment Experimental ProtocolPretreatments were performed by first establishing steady-state con-
ditions in the pretreatment reactor, i.e., ensuring that the feed rates of bio-mass, acid, water, and steam were all stable for at least 10–15 min after achange in operating set points. After steady-state conditions were estab-lished, the reactor was emptied and then allowed to fill to establish a levelvs residence time calibration. The reactor residence time was then set to thedesired value and the system was again allowed to come to steady state.After approximately three residence times, the flash tank was reemptiedand pretreated material was collected over a period of three (or more)residence times. During this collection period, the corn stover was sampledbefore entering the pretreatment reactor, and its moisture content wasmeasured using a Denver Instruments (Arvada, CO) Model IR-100 Infra-red Moisture Balance. Additionally, samples of the vent streams from thereactor and the flash tank were condensed and collected. At the end of thecollection period, the flash tank was emptied and a sample of the pretreatedslurry was obtained. The data acquisition and control system collected dataon flow rates, pressures, temperatures, and level every 30 s. These datawere averaged and used to define operating conditions and calculate yieldand mass balance results.
A total of 41 pretreatment runs were completed, including somereplicates, as summarized in Table 1. Conditions were varied from tem-peratures of 165–183°C, residence times of 3–12 min, and acid concentra-tions in the liquid phase of 0.5–1.41% (w/w). All runs were conductedusing a 20% total solids concentration in the pretreatment reactor on anunhydrolyzed feed solids basis. Five of the runs (nos. 37–41) were carriedout at conditions outside of these ranges and are discussed separately.Table 1 shows the nominal acid concentration, which is different from theeffective acid concentration. Variability in the effective acid concentra-tion may occur because the neutralizing capacity of the stover may not beconstant within a batch of material. The final pH of the post-pretreatmentliquor was used in this work rather than the effective acid concentrationbecause pH inherently accounts for the feedstock’s neutralizing capacity.
Chemical AnalysisThe composition of raw and pretreated corn stover was measured using
methods reported by NREL for determining biomass carbohydrates (10),acid insoluble lignin (11), acid soluble lignin (12), ash (13), and acetate con-
74Schell et al.
Applied B
iochemistry and B
iotechnologyV
ol. 105–108, 2003
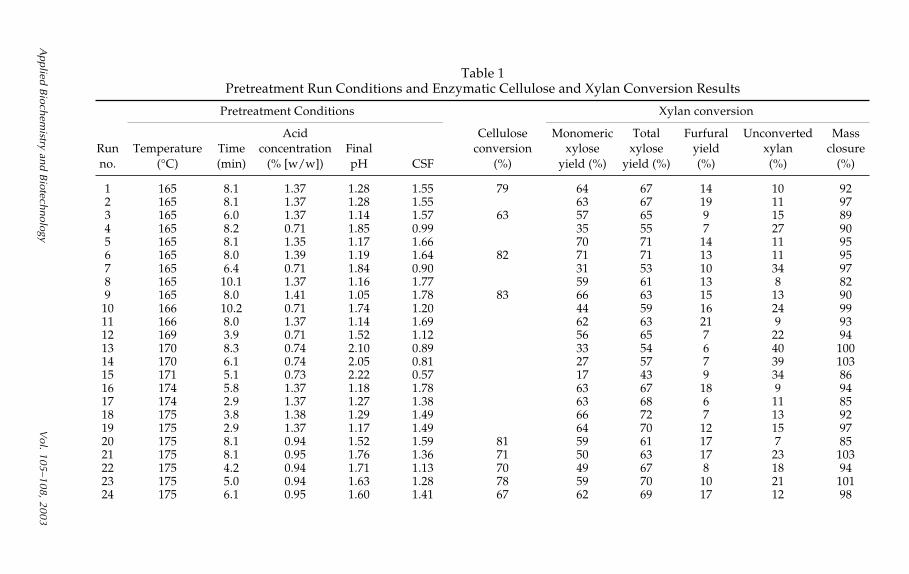
Table 1Pretreatment Run Conditions and Enzymatic Cellulose and Xylan Conversion Results
Pretreatment Conditions Xylan conversion
Acid Cellulose Monomeric Total Furfural Unconverted MassRun Temperature Time concentration Final conversion xylose xylose yield xylan closureno. (°C) (min) (% [w/w]) pH CSF (%) yield (%) yield (%) (%) (%) (%)
1 165 8.1 1.37 1.28 1.55 79 64 67 14 10 922 165 8.1 1.37 1.28 1.55 63 67 19 11 973 165 6.0 1.37 1.14 1.57 63 57 65 9 15 894 165 8.2 0.71 1.85 0.99 35 55 7 27 905 165 8.1 1.35 1.17 1.66 70 71 14 11 956 165 8.0 1.39 1.19 1.64 82 71 71 13 11 957 165 6.4 0.71 1.84 0.90 31 53 10 34 978 165 10.1 1.37 1.16 1.77 59 61 13 8 829 165 8.0 1.41 1.05 1.78 83 66 63 15 13 90
10 166 10.2 0.71 1.74 1.20 44 59 16 24 9911 166 8.0 1.37 1.14 1.69 62 63 21 9 9312 169 3.9 0.71 1.52 1.12 56 65 7 22 9413 170 8.3 0.74 2.10 0.89 33 54 6 40 10014 170 6.1 0.74 2.05 0.81 27 57 7 39 10315 171 5.1 0.73 2.22 0.57 17 43 9 34 8616 174 5.8 1.37 1.18 1.78 63 67 18 9 9417 174 2.9 1.37 1.27 1.38 63 68 6 11 8518 175 3.8 1.38 1.29 1.49 66 72 7 13 9219 175 2.9 1.37 1.17 1.49 64 70 12 15 9720 175 8.1 0.94 1.52 1.59 81 59 61 17 7 8521 175 8.1 0.95 1.76 1.36 71 50 63 17 23 10322 175 4.2 0.94 1.71 1.13 70 49 67 8 18 9423 175 5.0 0.94 1.63 1.28 78 59 70 10 21 10124 175 6.1 0.95 1.60 1.41 67 62 69 17 12 98
Dilute–H
2 SO4 Pretreatm
ent of Corn Stover
75
Applied B
iochemistry and B
iotechnologyV
ol. 105–108, 2003
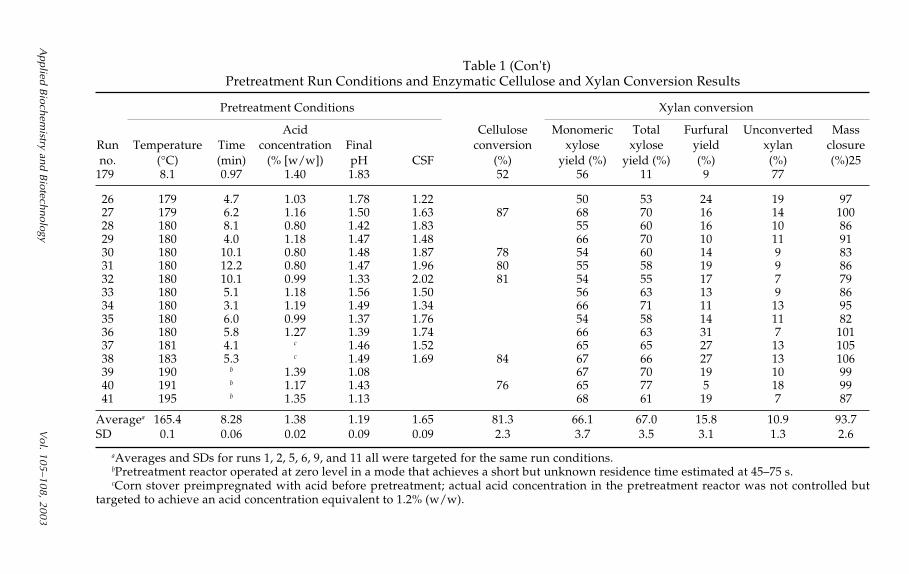
Table 1 (Con't)Pretreatment Run Conditions and Enzymatic Cellulose and Xylan Conversion Results
Pretreatment Conditions Xylan conversion
Acid Cellulose Monomeric Total Furfural Unconverted MassRun Temperature Time concentration Final conversion xylose xylose yield xylan closureno. (°C) (min) (% [w/w]) pH CSF (%) yield (%) yield (%) (%) (%) (%)25
179 8.1 0.97 1.40 1.83 52 56 11 9 77
26 179 4.7 1.03 1.78 1.22 50 53 24 19 9727 179 6.2 1.16 1.50 1.63 87 68 70 16 14 10028 180 8.1 0.80 1.42 1.83 55 60 16 10 8629 180 4.0 1.18 1.47 1.48 66 70 10 11 9130 180 10.1 0.80 1.48 1.87 78 54 60 14 9 8331 180 12.2 0.80 1.47 1.96 80 55 58 19 9 8632 180 10.1 0.99 1.33 2.02 81 54 55 17 7 7933 180 5.1 1.18 1.56 1.50 56 63 13 9 8634 180 3.1 1.19 1.49 1.34 66 71 11 13 9535 180 6.0 0.99 1.37 1.76 54 58 14 11 8236 180 5.8 1.27 1.39 1.74 66 63 31 7 10137 181 4.1 c 1.46 1.52 65 65 27 13 10538 183 5.3 c 1.49 1.69 84 67 66 27 13 10639 190 b 1.39 1.08 67 70 19 10 9940 191 b 1.17 1.43 76 65 77 5 18 9941 195 b 1.35 1.13 68 61 19 7 87
Averagea 165.4 8.28 1.38 1.19 1.65 81.3 66.1 67.0 15.8 10.9 93.7SD 0.1 0.06 0.02 0.09 0.09 2.3 3.7 3.5 3.1 1.3 2.6
aAverages and SDs for runs 1, 2, 5, 6, 9, and 11 all were targeted for the same run conditions.bPretreatment reactor operated at zero level in a mode that achieves a short but unknown residence time estimated at 45–75 s.cCorn stover preimpregnated with acid before pretreatment; actual acid concentration in the pretreatment reactor was not controlled but
targeted to achieve an acid concentration equivalent to 1.2% (w/w).
76 Schell et al.
Applied Biochemistry and Biotechnology Vol. 105–108, 2003
tent (14). Protein content was calculated as 6.25 times the nitrogen content,which was measured using a Perkin-Elmer Series 2400 CHNS/O ElementalAnalyzer (Norwalk, CT).
Concentrations of soluble components in the hydrolysate liquors(monomeric and oligomeric sugars, acetic acid, 5-hydroxymethanol fur-fural, and furfural) were measured using techniques previously reported(9). Total xylose is defined as the sum of monomeric and oligomericxylose. Measurements of hydrolysate liquor pH were made the followingday with the liquor at ambient temperature (approx 25°C). The amount ofinsoluble solids in the hydrolysate was measured using a technique (pro-cedure A) reported by NREL (15).
Enzymatic DigestibilityEnzymatic digestibility or cellulose conversion was determined by
hydrolyzing the cellulose contained in washed pretreated solids using asimultaneous saccharification and fermentation (SSF) process. The washedsolids were produced by the aforementioned procedure for measuring in-soluble solids. SSF was conducted in a laboratory-shaking incubator (150rpm) at a working volume of 100 mL in 250-mL baffled flasks with watertraps. The washed solids were loaded to a level of 6% (w/w) cellulose (cel-lulose measured as discussed above) and Iogen (Ottawa, Canada) cellulaseenzyme (lot no. BRC 191095) was added to a level of 15 filter paper units(FPU)/g of cellulose. The medium consisted of yeast extract (1% [w/v]),peptone (2% [w/v]), and citrate buffer (0.05 M). The initial pH was adjustedto 5.2 using NaOH, and then the culture was inoculated with the yeast, Sac-charomyces cerevisiae D5A, to achieve an initial optical density (at 600 nm) of0.5. The flask was maintained at 32oC for 7 days and sampled daily. Ethanolconcentration was measured by high-performance liquid chromatographyusing a Bio-rad (Richmond, CA) HPX-87H column operating at 65°C with a0.01 N H2SO4 solution mobile phase and a refractive index detector. Ethanolyield was calculated based on the theoretical ethanol concentration fromcellulose after subtracting the ethanol added from the inoculum. The theo-retical ethanol yield number is assumed to be a conservative estimate ofcellulose conversion but is also a number that represents realistic conversionresults, since the SSF test is done at conditions roughly similar to those thatmight be encountered in an actual process (i.e., 6% cellulose concentration,32°C, and a low enzyme loading of 15 FPU/g of cellulose).
Xylan Conversion Yields and Mass Balance CalculationsCalculation of xylan conversion yields (i.e., monomeric xylose, oligo-
meric xylose, furfural, and unconverted xylan) and carbon mass balancesfollowed a previously reported methodology (16) and relies on accuratemeasurements of flow rates and component concentrations in the inlet andoutlet streams. We measured flow rates for corn stover (weigh belt), acid,and water to the pug mill mixer (Magnetic flowmeter and Coriolis massflowmeter, respectively), and the pretreatment-reactor vent stream
Dilute–H2SO4 Pretreatment of Corn Stover 77
Applied Biochemistry and Biotechnology Vol. 105–108, 2003
(Coriolis mass flowmeter). The flash-tank vapor flow rate was calculatedfrom an energy balance around the pretreatment reactor and flash tank.The hydrolysate slurry flow rate was calculated from an overall massbalance. Component concentrations were measured for corn stover (mois-ture and composition), vapor vent streams (furfural and acetic acid), andthe hydrolysate (fraction insoluble solids, solids composition, liquor com-position). Components yields based on the amount of xylan contained inthe corn stover and xylan mass balance closure are reported as the mass ofoutput xylan products (monomeric xylose, oligomeric xylose, furfural,and unconverted xylan) over the mass of input xylan.
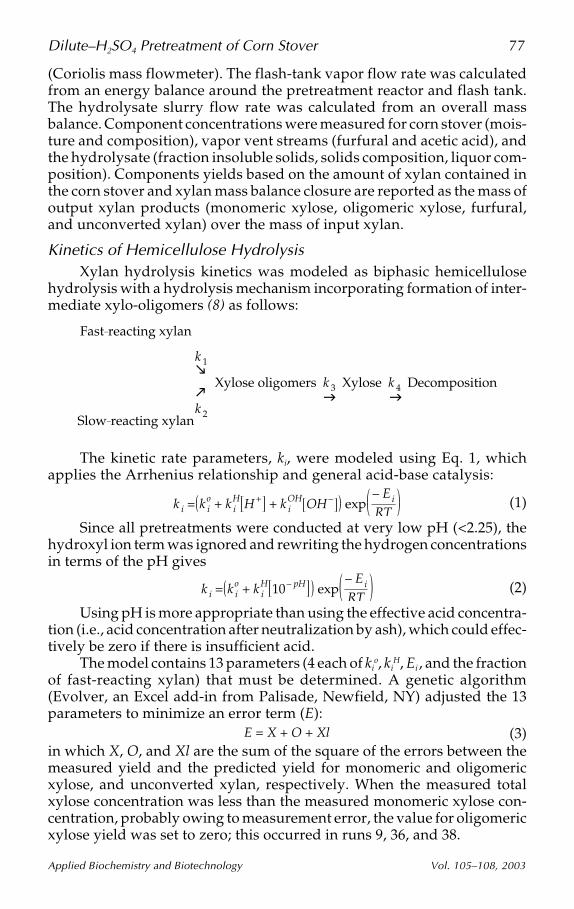
Kinetics of Hemicellulose HydrolysisXylan hydrolysis kinetics was modeled as biphasic hemicellulose
hydrolysis with a hydrolysis mechanism incorporating formation of inter-mediate xylo-oligomers (8) as follows:
Fast–reacting xylan
Slow–reacting xylan
k 1
k 2
Xylose oligomers k 3 Xylose k 4 Decomposition
The kinetic rate parameters, ki, were modeled using Eq. 1, whichapplies the Arrhenius relationship and general acid-base catalysis:
k i = k io + k i
H H+ + k iOH OH– exp
– Ei
RT(1)
Since all pretreatments were conducted at very low pH (<2.25), thehydroxyl ion term was ignored and rewriting the hydrogen concentrationsin terms of the pH gives
k i = k io + k i
H 10– pH exp– Ei
RT(2)
Using pH is more appropriate than using the effective acid concentra-tion (i.e., acid concentration after neutralization by ash), which could effec-tively be zero if there is insufficient acid.
The model contains 13 parameters (4 each of kio, ki
H, Ei , and the fractionof fast-reacting xylan) that must be determined. A genetic algorithm(Evolver, an Excel add-in from Palisade, Newfield, NY) adjusted the 13parameters to minimize an error term (E):
E = X + O + Xl (3)in which X, O, and Xl are the sum of the square of the errors between themeasured yield and the predicted yield for monomeric and oligomericxylose, and unconverted xylan, respectively. When the measured totalxylose concentration was less than the measured monomeric xylose con-centration, probably owing to measurement error, the value for oligomericxylose yield was set to zero; this occurred in runs 9, 36, and 38.
�
���
78 Schell et al.
Applied Biochemistry and Biotechnology Vol. 105–108, 2003
Results
Table 1 summarizes run conditions and key results from each of the41 runs. It presents the pretreatment run conditions (temperature, time,and acid concentration), the final pH of the hydrolysate liquors, the com-bined severity factor (CSF), cellulose conversion determined by SSF test-ing, and xylan conversion results. The CSF is defined as (17,18)
CSF = log10 t × exp T – 10014.75
– pH (4)
in which t and T are pretreatment residence time (min) and temperature(°C), respectively. The CSF provides a method for consolidating the effectsof pretreatment temperature, residence time, and acid concentration into asingle parameter, which can be useful for analyzing results.
Replicate runs at the same targeted operating conditions were per-formed to assess reproducibility. At the bottom of Table 1, averages and SDsare given for six runs (1, 2, 5, 6, 9, and 11) that were all targeted for the samepretreatment conditions (165°C, 8 min, 1.4% [w/w] acid concentration). Theruns were performed on four different days spanning a period of 6 mo withtwo runs performed on the same day for two of the different dates. Althoughthere is little variability in the operating conditions, there is more variabilityin the yields, cellulose conversion, and carbon mass balance results. One SDwas approx 5% of the average value for many of these results, except forfurfural and unconverted xylan yields, for which the value of the SD wasmuch higher (up to 20%). This information is useful for accessing the overallreproducibility of results from our pretreatment system.
As noted in Table 1, runs 37 and 38 were performed with acid pre-impregnated corn stover using an impregnation device previouslydescribed (18). After acid soaking, the stover was dried to approx 10%moisture. This material was fed to the pretreatment reactor but no addi-tional acid was added at the pug mill mixer. The acid-impregnated stoverwas used to test the hypothesis that mass transfer of acid into the feedstockmay limit performance. These runs were performed at conditions close tothose of runs 29 and achieved similar xylan conversion yields, which sug-gests that acid mass transfer was not limiting performance.
Runs 39–41 were performed without a detectable level in the pretreat-ment reactor in a “flowthrough” mode that achieves a short but unknownresidence time estimated to be 45–75 s. This operating mode was achieved bycycling the reciprocating popet valves at a high frequency so that no solidsbuilt up within the reactor. The short residence time required us to conductpretreatments at higher temperatures (190–195°C) than were used in theother experiments in order to achieve high yields. In general, the celluloseand xylan conversion results obtained under these conditions are similar tothose achieved in the lower-temperature pretreatments. However, a particu-larly high total xylose yield of 77% was achieved in run 40, which was per-formed at 191°C and 1.17% (w/w) acid. This result is intriguing, but
Dilute–H2SO4 Pretreatment of Corn Stover 79
Applied Biochemistry and Biotechnology Vol. 105–108, 2003
additional work needs to be performed to confirm that better performancecan be obtained at this higher temperature and shorter residence time.
Xylan Conversion
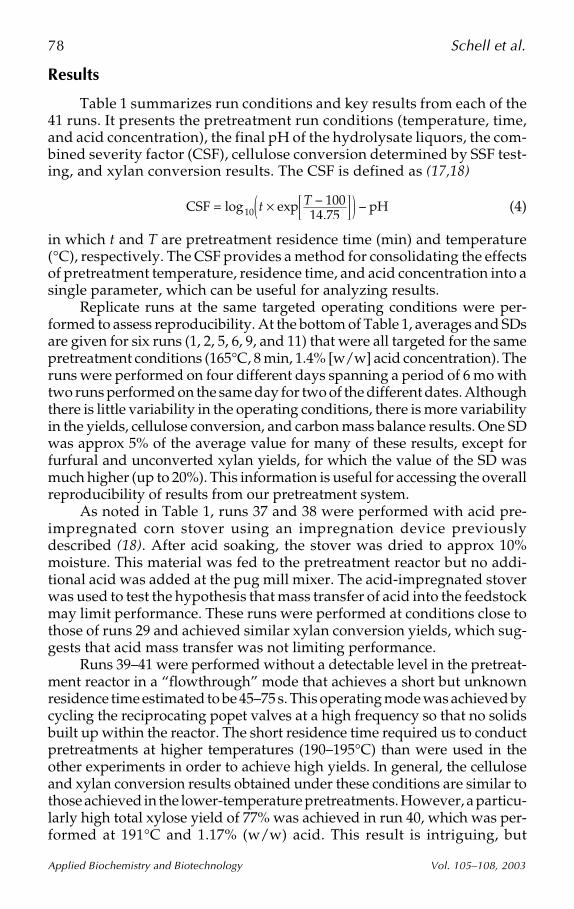
Figure 2 presents monomeric and total xylose yields as a function ofthe CSF. The results show peaks in monomeric xylose yield at CSF ( 1.6–1.7and total xylose yield at CSF ( 1.4–1.5, with both yields reaching highs of 70to 71%. At lower severities, total xylose yields were much greater thanmonomeric xylose yields, but the two values were nearly equal above a CSFof 1.6. In addition, above a CSF of 1.7, both monomeric and total xyloseyields declined, presumably because the harsher pretreatment conditionsat these higher severities degraded more of the xylose to furfural and otherdegradation products.
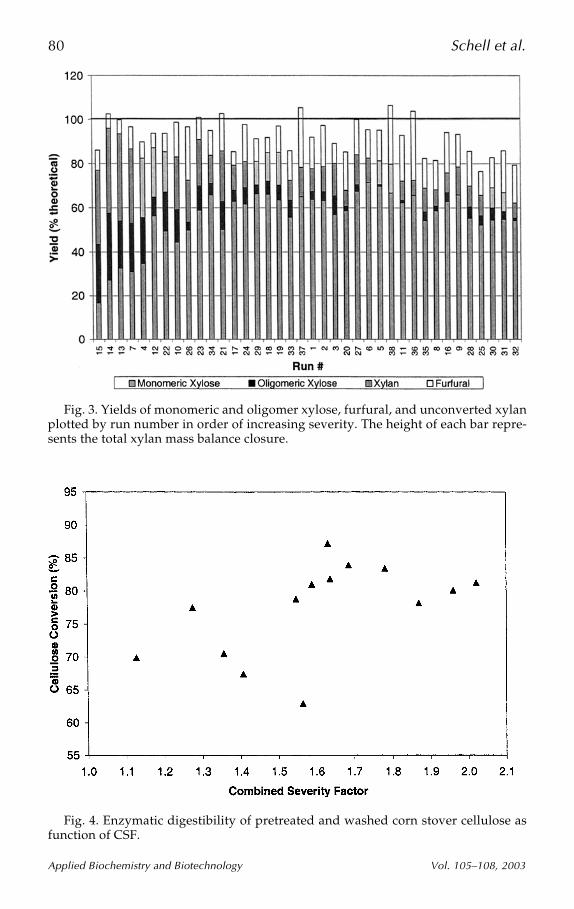
The fractionation of xylan into monomeric and oligomeric xylose,furfural, and unconverted xylan, as well as the overall xylan mass balanceis shown in bar chart form in Fig. 3, which plots run numbers in order ofincreasing pretreatment severity. In addition to the trends just discussed,Fig. 3 shows the predicted trend of increasing furfural and decreasingxylan with increasing pretreatment severity. The top of the bar shows theoverall mass balance closure for xylan, which is usually in the range of 90–100%, except at the higher pretreatment severities, where mass balancebegins to drop below 90%. We believe that other unmeasured degradationproducts are being produced under these conditions that are not includedin the mass balance calculation.
Fig. 2. Monomeric and total xylose yields of pretreated corn stover as function of CSF.
80 Schell et al.
Applied Biochemistry and Biotechnology Vol. 105–108, 2003
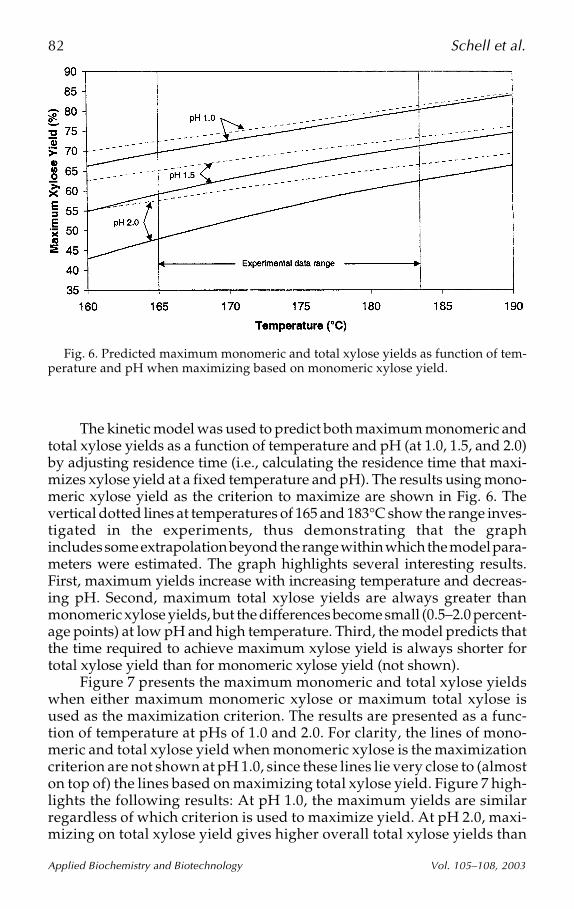
Fig. 4. Enzymatic digestibility of pretreated and washed corn stover cellulose asfunction of CSF.
Fig. 3. Yields of monomeric and oligomer xylose, furfural, and unconverted xylanplotted by run number in order of increasing severity. The height of each bar repre-sents the total xylan mass balance closure.

Dilute–H2SO4 Pretreatment of Corn Stover 81
Applied Biochemistry and Biotechnology Vol. 105–108, 2003
Cellulose ConversionFigure 4 shows cellulose conversion or enzymatic digestibility of the
pretreated solids plotted against the CSF. In general, there appears to be atrend of increasing cellulose digestibility with increasing pretreatmentseverity, particularly at CSFs <1.6. At CSFs >1.6, digestibilities >80% wereroutinely obtained, and the highest value obtained was 87%. The typicalcomposition (dry basis) of well-pretreated corn stover was 55–60% cellu-lose, 3–7% residual xylan, and 27–31% lignin.
Pretreatment KineticsKinetic parameters were estimated using data from runs 1–38 and are
shown in Table 2. The ability of the kinetic model to fit the xylan hydrolysisdata is presented in Fig. 5, which shows that the model predicts xylanhydrolysis performance across the data set fairly well. The best fit esti-mated value of the fast-reacting xylan fraction was 0.72, slightly higherthan previous estimates (7, 8).
Fig 5. Predicted (kinetic model) vs measured values of monomeric and oligomericxylose and unconverted xylan.
Table 2Estimated kinetic parameters
k1 k2 k3 k4
kio (min–1) 2.61 × 1025 1.00 × 10¹⁵ 1.03 × 1028 1.00 × 10¹⁵
kiH (min–1 · M–1) 8.54 × 1029 4.59 × 1029 1.00 × 1030 1.00 × 10¹⁵
Ei (kcal/g mol) 57.4 59.9 58.6 33.4
82 Schell et al.
Applied Biochemistry and Biotechnology Vol. 105–108, 2003
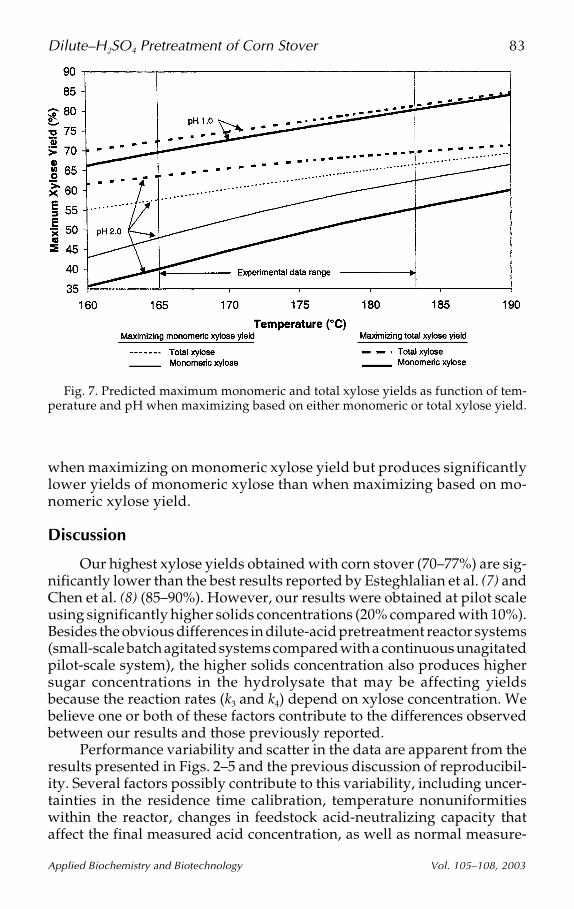
The kinetic model was used to predict both maximum monomeric andtotal xylose yields as a function of temperature and pH (at 1.0, 1.5, and 2.0)by adjusting residence time (i.e., calculating the residence time that maxi-mizes xylose yield at a fixed temperature and pH). The results using mono-meric xylose yield as the criterion to maximize are shown in Fig. 6. Thevertical dotted lines at temperatures of 165 and 183°C show the range inves-tigated in the experiments, thus demonstrating that the graphincludes some extrapolation beyond the range within which the model para-meters were estimated. The graph highlights several interesting results.First, maximum yields increase with increasing temperature and decreas-ing pH. Second, maximum total xylose yields are always greater thanmonomeric xylose yields, but the differences become small (0.5–2.0 percent-age points) at low pH and high temperature. Third, the model predicts thatthe time required to achieve maximum xylose yield is always shorter fortotal xylose yield than for monomeric xylose yield (not shown).
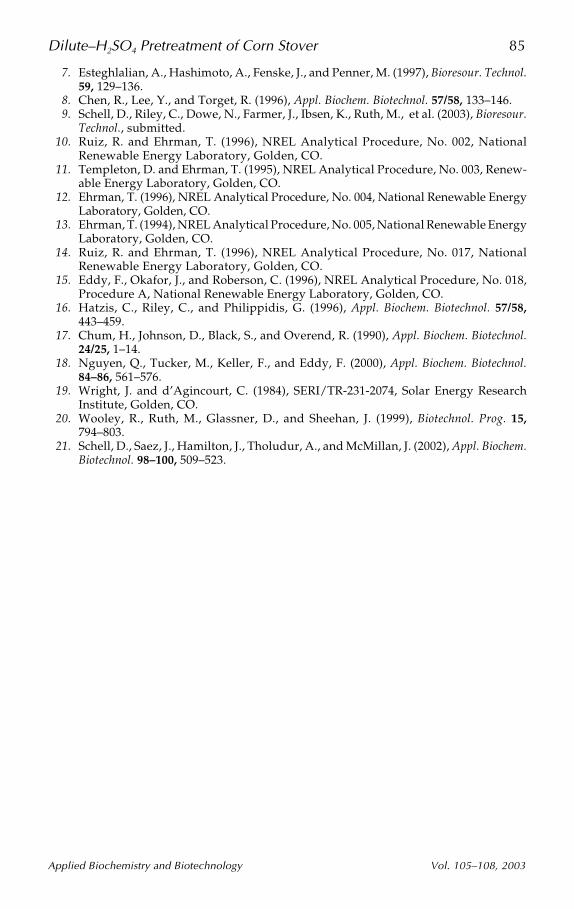
Figure 7 presents the maximum monomeric and total xylose yieldswhen either maximum monomeric xylose or maximum total xylose isused as the maximization criterion. The results are presented as a func-tion of temperature at pHs of 1.0 and 2.0. For clarity, the lines of mono-meric and total xylose yield when monomeric xylose is the maximizationcriterion are not shown at pH 1.0, since these lines lie very close to (almoston top of) the lines based on maximizing total xylose yield. Figure 7 high-lights the following results: At pH 1.0, the maximum yields are similarregardless of which criterion is used to maximize yield. At pH 2.0, maxi-mizing on total xylose yield gives higher overall total xylose yields than
Fig. 6. Predicted maximum monomeric and total xylose yields as function of tem-perature and pH when maximizing based on monomeric xylose yield.
Dilute–H2SO4 Pretreatment of Corn Stover 83
Applied Biochemistry and Biotechnology Vol. 105–108, 2003
when maximizing on monomeric xylose yield but produces significantlylower yields of monomeric xylose than when maximizing based on mo-nomeric xylose yield.
Discussion
Our highest xylose yields obtained with corn stover (70–77%) are sig-nificantly lower than the best results reported by Esteghlalian et al. (7) andChen et al. (8) (85–90%). However, our results were obtained at pilot scaleusing significantly higher solids concentrations (20% compared with 10%).Besides the obvious differences in dilute-acid pretreatment reactor systems(small-scale batch agitated systems compared with a continuous unagitatedpilot-scale system), the higher solids concentration also produces highersugar concentrations in the hydrolysate that may be affecting yieldsbecause the reaction rates (k3 and k4) depend on xylose concentration. Webelieve one or both of these factors contribute to the differences observedbetween our results and those previously reported.
Performance variability and scatter in the data are apparent from theresults presented in Figs. 2–5 and the previous discussion of reproducibil-ity. Several factors possibly contribute to this variability, including uncer-tainties in the residence time calibration, temperature nonuniformitieswithin the reactor, changes in feedstock acid-neutralizing capacity thataffect the final measured acid concentration, as well as normal measure-
Fig. 7. Predicted maximum monomeric and total xylose yields as function of tem-perature and pH when maximizing based on either monomeric or total xylose yield.

84 Schell et al.
Applied Biochemistry and Biotechnology Vol. 105–108, 2003
ment and control errors associated with operating continuous pilot-scaleequipment. The high degree of scatter in the performance results reflects acombination of these factors. Kinetic modeling was used to develop anoverall representation of performance trends.
The most important predictions from the kinetic modeling are thatlow pHs are required to achieve the highest xylose yields and that yieldsimprove at higher temperatures (although shorter residence times arerequired). Esteghlalian et al. (7) reported similar kinetic behavior, althoughother investigators have reported that temperature has little effect on maxi-mum xylose yields (8,19). Differences in reactor systems, solids concentra-tions, and accounting for acid neutralization, as well as measurementuncertainties may explain some of the discrepancies. The highest totalxylose yield, 77% achieved in run 40, was obtained using a higher tempera-ture (190°C). However, this was only a single run and additional work isneeded to confirm this finding. Although, it is outside the scope of thisarticle, we are also seeing significant corn stover compositional variabil-ity, which may also be affecting both pretreatment and enzymatic hy-drolysis kinetics (unpublished results).
Demonstrating effective pretreatment technology at pilot scale usingeconomically attractive conditions is required to move lignocellulosic con-version technology toward commercialization. The work reported here, inwhich performance data were obtained with component mass balance clo-sures near 100%, represents an initial effort to generate accurate and reliablepilot-scale performance data that can be used to more rigorously analyzeprocess economics than have been performed in the past (20). Future workwill examine the impact that compositional variability of corn stover has onperformance and will apply measurement uncertainty analysis (21) to assessthe accuracy of pretreatment yield and mass balance results.
Acknowledgments
We gratefully acknowledge the technical assistance of Bob Lyonsand Bryan Rohrback with pilot plant operation, Raymond Ruiz, DavidTempleton, Amie Sluiter, and Bonnie Hames with chemical analysis ofprocess samples, and David Templeton with procurement of the cornstover. The Biochemical Conversion Element of the Office of Fuels Devel-opment of the US Department of Energy funded this work.
References
1. Lugar, R. and Woolsey, R. (1999), Foreign Affairs 78, 88–102.2. Lynd, L., Cushman, J., Nichols, R., and Wyman, C. (1991), Science 251, 1318–1323.3. Hsu, T. (1996), in Handbook on Bioethanol: Production and Utilization, Wyman, C., ed.,
Taylor & Francis, Washington, DC, pp. 179–212.4. Chang, V. and Holtzapple, M. (2000), Appl. Biochem. Biotechnol. 84–86, 5–37.5. Knappert, D., Grethlein, H., and Converse, A. (1980), Biotechnol. Bioeng. 22, 1449–1463.6. Torget, R., Walter, P., Himmel, M., and Grohmann, K. (1991), Appl. Biochem. Biotechnol.
28/29, 75–86.
Dilute–H2SO4 Pretreatment of Corn Stover 85
Applied Biochemistry and Biotechnology Vol. 105–108, 2003
7. Esteghlalian, A., Hashimoto, A., Fenske, J., and Penner, M. (1997), Bioresour. Technol.59, 129–136.
8. Chen, R., Lee, Y., and Torget, R. (1996), Appl. Biochem. Biotechnol. 57/58, 133–146.9. Schell, D., Riley, C., Dowe, N., Farmer, J., Ibsen, K., Ruth, M., et al. (2003), Bioresour.
Technol., submitted.10. Ruiz, R. and Ehrman, T. (1996), NREL Analytical Procedure, No. 002, National
Renewable Energy Laboratory, Golden, CO.11. Templeton, D. and Ehrman, T. (1995), NREL Analytical Procedure, No. 003, Renew-
able Energy Laboratory, Golden, CO.12. Ehrman, T. (1996), NREL Analytical Procedure, No. 004, National Renewable Energy
Laboratory, Golden, CO.13. Ehrman, T. (1994), NREL Analytical Procedure, No. 005, National Renewable Energy
Laboratory, Golden, CO.14. Ruiz, R. and Ehrman, T. (1996), NREL Analytical Procedure, No. 017, National
Renewable Energy Laboratory, Golden, CO.15. Eddy, F., Okafor, J., and Roberson, C. (1996), NREL Analytical Procedure, No. 018,
Procedure A, National Renewable Energy Laboratory, Golden, CO.16. Hatzis, C., Riley, C., and Philippidis, G. (1996), Appl. Biochem. Biotechnol. 57/58,
443–459.17. Chum, H., Johnson, D., Black, S., and Overend, R. (1990), Appl. Biochem. Biotechnol.
24/25, 1–14.18. Nguyen, Q., Tucker, M., Keller, F., and Eddy, F. (2000), Appl. Biochem. Biotechnol.
84–86, 561–576.19. Wright, J. and d’Agincourt, C. (1984), SERI/TR-231-2074, Solar Energy Research
Institute, Golden, CO.20. Wooley, R., Ruth, M., Glassner, D., and Sheehan, J. (1999), Biotechnol. Prog. 15,
794–803.21. Schell, D., Saez, J., Hamilton, J., Tholudur, A., and McMillan, J. (2002), Appl. Biochem.
Biotechnol. 98–100, 509–523.