Embed Size (px)
Citation preview
A Meta-Analysis of Cost ofCommunity Service Studies
Matthew J. KotchenUniversity of California, Santa Barbara and NBER,
e-mail: [email protected]
Stacey L. SchulteUniversity of Colorado,
e-mail: [email protected]
Cost of community service (CCS) studies, which compare the ratio of expenditures-to-
revenues for different land uses, are increasingly influential in debates about municipal
land-use planning. In this article, we conduct a quantitative meta-analysis of 125 CCS
studies that focus on three land-use categories: residential, commercial/industrial, and
agricultural/open-space. We estimate models to investigate underlying patterns
regarding the effect of different methodological assumptions and of geographic and
financial characteristics of communities. Many of the results have implications for the
conduct and interpretation of CCS studies in particular and the fiscal impacts of land
use in general. Key findings include the following: residential ratios of expenditures-
to-revenues increase with population but decrease with school budget as a proportion
of total budget; commercial/industrial ratios increase with density but decrease with
population, home value, and school budget; agricultural/open space ratios increase
with density. Ratios are affected little by municipality type or population change.
Ratios for all land uses decrease as their share of property tax increases. Two key
methodological decisions have a large impact on study results: inclusion of school
budget in the analysis and of farmhouses in the agricultural/open space category.
Finally, the type of sponsoring agency has little affect, with the exception of
government studies, which find higher residential ratios and lower commercial/
industrial ratios than the American Farmland Trust.
I. Introduction
Land use largely determines the revenues and expenditures of municipal govern-
ments. Different land uses—including residential, commercial, industrial,
Authors’ Note: This article was written in honor of Roger Bolton and presented at the colloquium
‘‘Understanding Place and the Economics of Space: The Career of Roger Bolton’’ at Williams College in
April 2008. We are grateful to colloquium participants and an anonymous reviewer for many helpful
comments. We are also grateful to Elizabeth Brabec for useful feedback at the early stages of this project and
to Michael Hinke for creating the map of study locations.
International
Regional Science Review
Volume 32 Number 3
July 2009 376-399
# 2009 SAGE Publications
10.1177/0160017609336082
http://irsr.sagepub.com
hosted at
http://online.sagepub.com
376
at UNIV CALIFORNIA SANTA BARBARA on August 10, 2009 http://irx.sagepub.comDownloaded from
agricultural, and open space—generate different amounts of revenue because they
are taxed at different rates and are responsible for different amounts of intergovern-
mental aid. They also demand different expenditures for municipal services ranging
from public education, police protection, roads, and other forms of infrastructure.
When land uses change, therefore, the balance of municipal revenues and expendi-
tures changes as well. Recognizing these relationships, municipalities, planners and
land-use advocates are becoming increasingly concerned with the long-term finan-
cial implications of land-use decisions.
Cost of Community Service (CCS) studies are a well-known methodology for
estimating the fiscal impact of different land uses within a municipality. Local gov-
ernments, land-use planners, and advocacy groups frequently use CCS studies to
quantify the fiscal costs and benefits of existing land uses. The studies are also used,
albeit with some controversy, as an indicator of how land-use change is likely to
affect municipal budgets. The American Farmland Trust (AFT) first developed the
CCS methodology in the mid-1980s, following two seminal publications, The Fiscal
Impact Handbook (Burchell and Listokin 1978) and Cost of Sprawl (Real Estate
Research Corporation 1974), which demonstrate the importance of cost-effective-
ness for land-use planning.
The basic methodology of CCS studies is to first partition land uses into three
classes: residential, commercial/industrial, and agricultural/open-space. Expendi-
tures and revenues from the municipal budget are then allocated to the three different
land-use categories. Although the specific methodology for fiscal allocations differs
among CCS studies, the final result is always a ratio of expenditures over revenues
for each of the three land uses. For example, a residential ratio of 1.2 means that for
every U.S.$1.00 of revenue raised from residential land uses, U.S.$1.20 of expendi-
tures is spent on residential land uses. Studies then report a separate ratio for residen-
tial, commercial/industrial, and agricultural/open-space land uses.
A general finding of CCS studies is that commercial/industrial and agricultural/
open-space ratios are less than one while residential ratios are greater than one. This
is often interpreted to mean that commercial/industrial and agricultural/open-space
land uses ‘‘pay their own way’’ while residential land uses do not. AFT and other
land conservation advocates use these ratios to argue against the common perception
that further residential development will decrease the property tax burden for current
residents. The results are also used to argue that open lands provide fiscal benefits
and that current use valuation, rather than potential development value, is justified
for tax purposes.
One reason for the popularity of CCS studies is the relative ease of conducting
them and understanding the results, but their simplicity also exposes them to criti-
cism and calls for caution with interpretation. The main concerns are the following:
partitioning land uses into only three classes obscures potentially important variation
within a given class (Crompton 2000; Deller 2002). CCS studies measure demand for
services rather than benefits, which often include public goods for the greater
Kotchen, Schulte / Cost of Community Service Studies 377
at UNIV CALIFORNIA SANTA BARBARA on August 10, 2009 http://irx.sagepub.comDownloaded from
community, and land-use decisions should account for public benefits (Kelsey 1996;
Deller 1999). The use of ratios does not reflect the magnitudes of surplus or deficit
for a given land use (Kelsey 1996; Deller 1999). The fact that CCS studies are based
on average expenditures, and revenues is problematic because understanding the
impacts of land-use change requires information about marginal costs and benefits
(Deller 1999; Staley 1999; Crompton 2000).
Despite these concerns, CCS studies have become increasingly popular and influ-
ential in debates about municipal land-use decision making. CCS studies are fre-
quently cited in land-use planning documents, government reports, academic
research, and advocacy materials. Although in the past, land-use debates have
focused on social, aesthetic, environmental, and legal concerns, CCS studied have
promoted greater emphasis on economic considerations. The increased emphasis
on economic arguments through CCS studies has been particularly apparent among
supporters of open-space/farmland conservation and in efforts to limit urban sprawl.
Although CCS studies often frame municipal land-use debates, the results of these
studies have not been rigorously evaluated to determine the factors that contribute to
differing results. How important are different methodological assumptions? In what
ways do the geographic and financial characteristics of a community affect CCS
ratios? Are there general insights that can be learned from CCS studies about local
public finance? In order to answer these questions, we conduct a meta-analysis of
existing CCS studies. We structure the methodology according to standard protocol
for conducting quantitative meta-analysis. According to Stanley (2001), the method
involves five fundamental steps: (1) include all relevant studies, (2) choose a sum-
mary statistic and reduce the evidence to a common metric, (3) choose explanatory
variables that are thought to be consequential, (4) conduct a meta-regression analy-
sis, and (5) subject the meta-regression analysis to specification testing.
Our final dataset consists of 125 studies that took place in communities across the
United States. Using the studies themselves, along with U.S. Census data, we create
explanatory variables for different methodological assumptions, geographic charac-
teristics of each study area, and financial details of the local community. One con-
tribution of the article, therefore, is simply the collection of CCS studies. We
report citation information for all studies included in the analysis, and the simple
descriptive statistics provide a general sense of patterns within the CCS literature.
The meta-analysis is then based on a system of multivariate regression equations
to examine how the different variables affect the expenditure-to-revenue ratios
within each land-use class. The meta-analysis takes advantage of information among
all studies to investigate underlying patterns regarding the effect of methodological
assumptions, as well as the geographic and financial characteristics of communities.
The remainder of the article is organized as follows. In the next section, we
describe our data collection and preparation. Section III reports the details of the
meta-regression analysis, namely our approach for estimating a system of seemingly
unrelated regression (SUR) equations. Section IV reports the results. Section V
378 International Regional Science Review
at UNIV CALIFORNIA SANTA BARBARA on August 10, 2009 http://irx.sagepub.comDownloaded from
concludes with a discussion of the main results and their implications for the conduct
of CCS studies in particular and the fiscal implications of land use in general.
II. Data Collection and Preparation
We attempted to compile all CCS studies that were conducted through 2007. We
searched for studies using AFT references, citations in journal articles and CCS
reports, references from CCS study authors, technical reports, and Web searches.
We identified CCS studies for 168 different locations. The report for forty-three
of these locations could not be obtained or did not include sufficient data. Hence, the
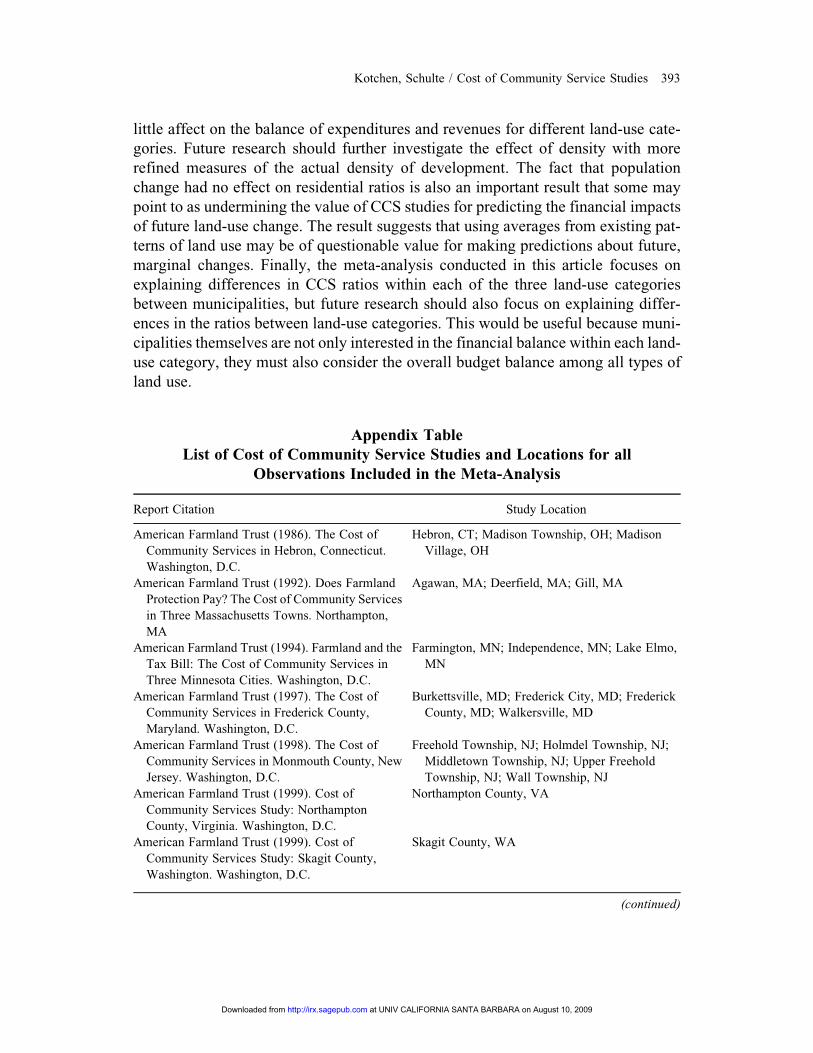
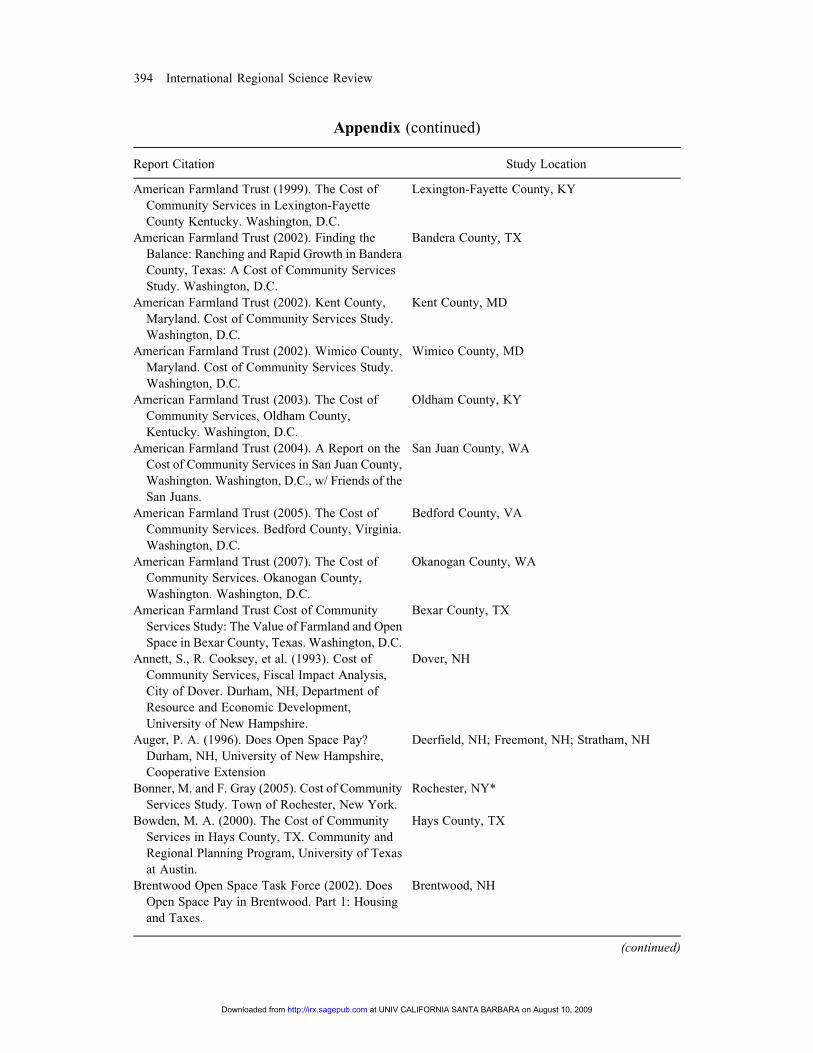
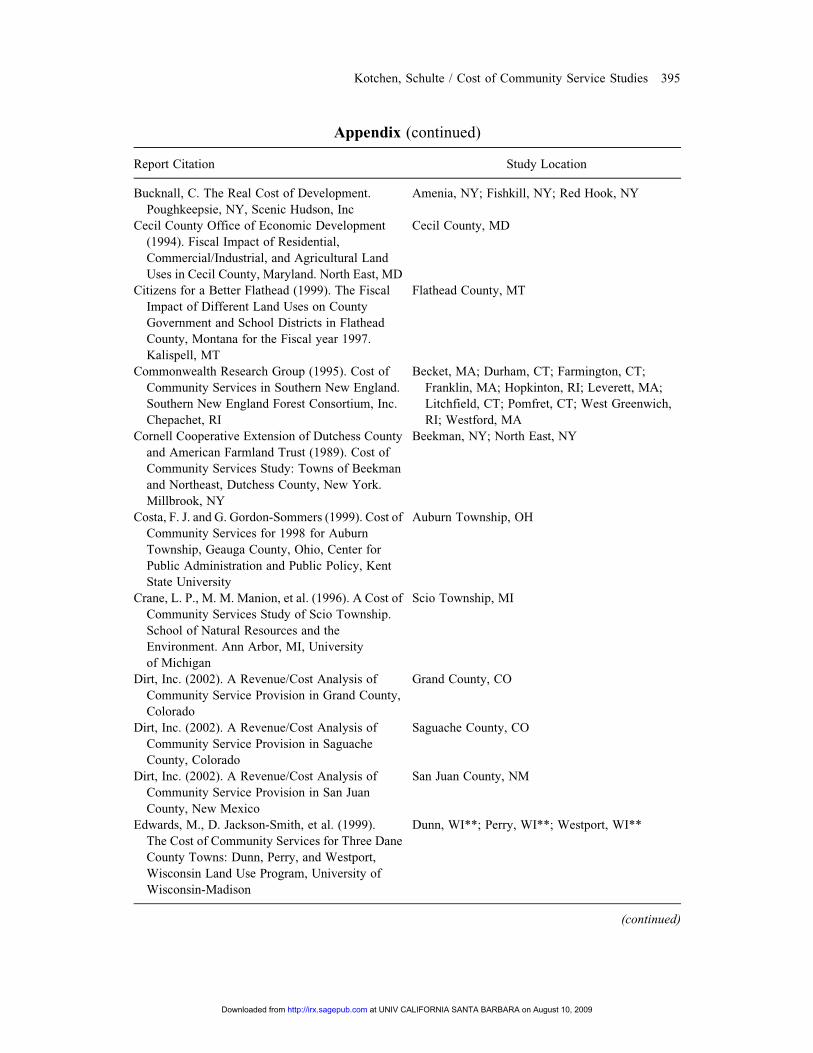
final dataset used in our analysis consists of 125 observations. The Appendix Table
includes a list of all 125 CCS locations with a complete citation for each.
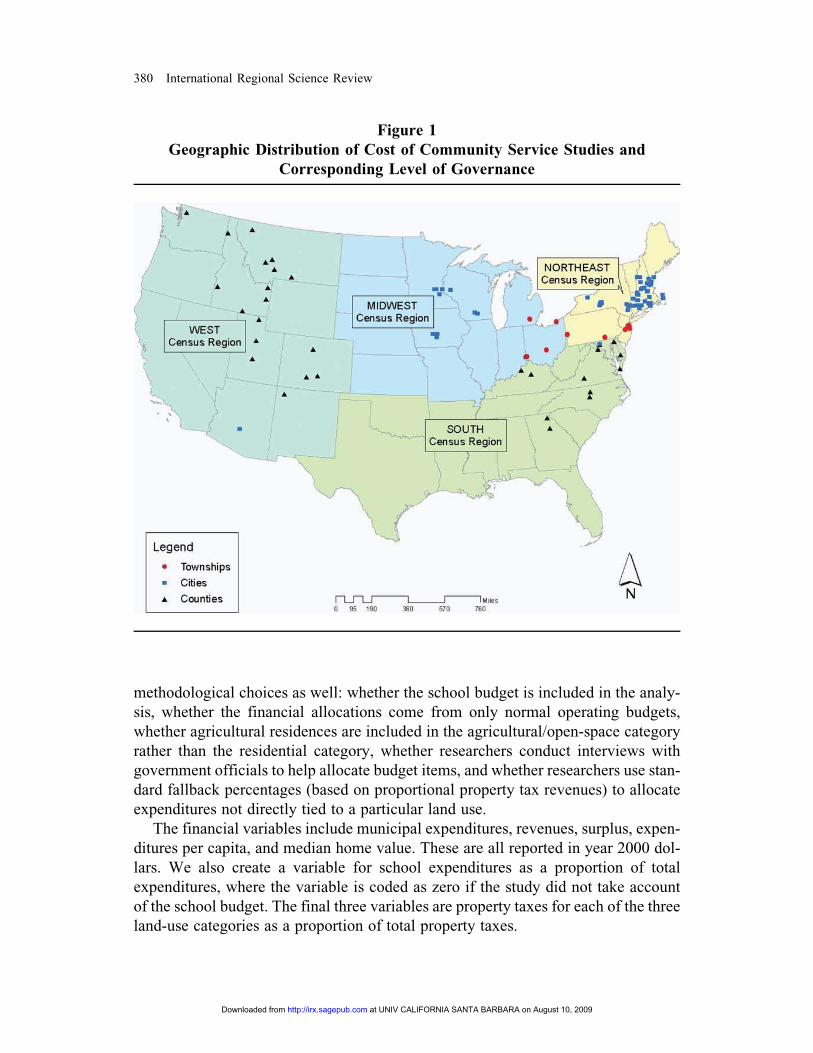
The studies show variation in location and results. Figure 1 shows the geographic
distribution of studies across the United States. The vast majority of studies take
place in the northeast and the mountain west, with fewer in the mid-west and mid-
Atlantic regions. The figure also shows the corresponding level of governance for
each study, which we discuss below. Figure 2 shows the frequency distributions of
the CCS ratios for each of the three land-use categories. Consistent with the general
perception that comes from these studies, we find that nearly all residential ratios
exceed one, meaning that residential expenditures exceed revenues. One residential
ratio, an outlier at 3.25 for Broadwater County in Montana, is not included in figure 2
or any of the subsequent analysis. Also consistent with expectation is the finding that
the vast majority of commercial/industrial and agricultural/open-space ratios are less
than one, meaning that expenditures for these land uses are less than revenues.
Within all three land-use categories, the ratios indicate substantial variation. In what
follows, we aim to identify variables that explain the variation in results among
studies.
We collected data from the CCS studies themselves and the U.S. Census to create
variables is three broad categories: geographic, methodological, and financial. Table 1
lists and defines all variables. Among the geographic variables, we categorize studies
based on the corresponding level of governance: city, county, and township level.
Figure 1 shows the geographic distribution of studies that take place at each level
of governance. We do not create variables for geographic location, such as census
regions, because they are highly correlated with the variables on level of municipal
governance. When creating the variable for county-level governance, we also distin-
guish between studies that exclude subset municipal finances (countyonly) and stud-
ies that include them (countyall). Other geographic variables include population,
population growth, total land area, and population density.
The methodological variables include categories for different types of sponsoring
organizations, including the AFT, other nongovernmental organizations, government
agencies, and academic institutions. We create dummy variables for several other
Kotchen, Schulte / Cost of Community Service Studies 379
at UNIV CALIFORNIA SANTA BARBARA on August 10, 2009 http://irx.sagepub.comDownloaded from
methodological choices as well: whether the school budget is included in the analy-
sis, whether the financial allocations come from only normal operating budgets,
whether agricultural residences are included in the agricultural/open-space category
rather than the residential category, whether researchers conduct interviews with
government officials to help allocate budget items, and whether researchers use stan-
dard fallback percentages (based on proportional property tax revenues) to allocate
expenditures not directly tied to a particular land use.
The financial variables include municipal expenditures, revenues, surplus, expen-
ditures per capita, and median home value. These are all reported in year 2000 dol-
lars. We also create a variable for school expenditures as a proportion of total
expenditures, where the variable is coded as zero if the study did not take account
of the school budget. The final three variables are property taxes for each of the three
land-use categories as a proportion of total property taxes.
Figure 1
Geographic Distribution of Cost of Community Service Studies and
Corresponding Level of Governance
380 International Regional Science Review
at UNIV CALIFORNIA SANTA BARBARA on August 10, 2009 http://irx.sagepub.comDownloaded from
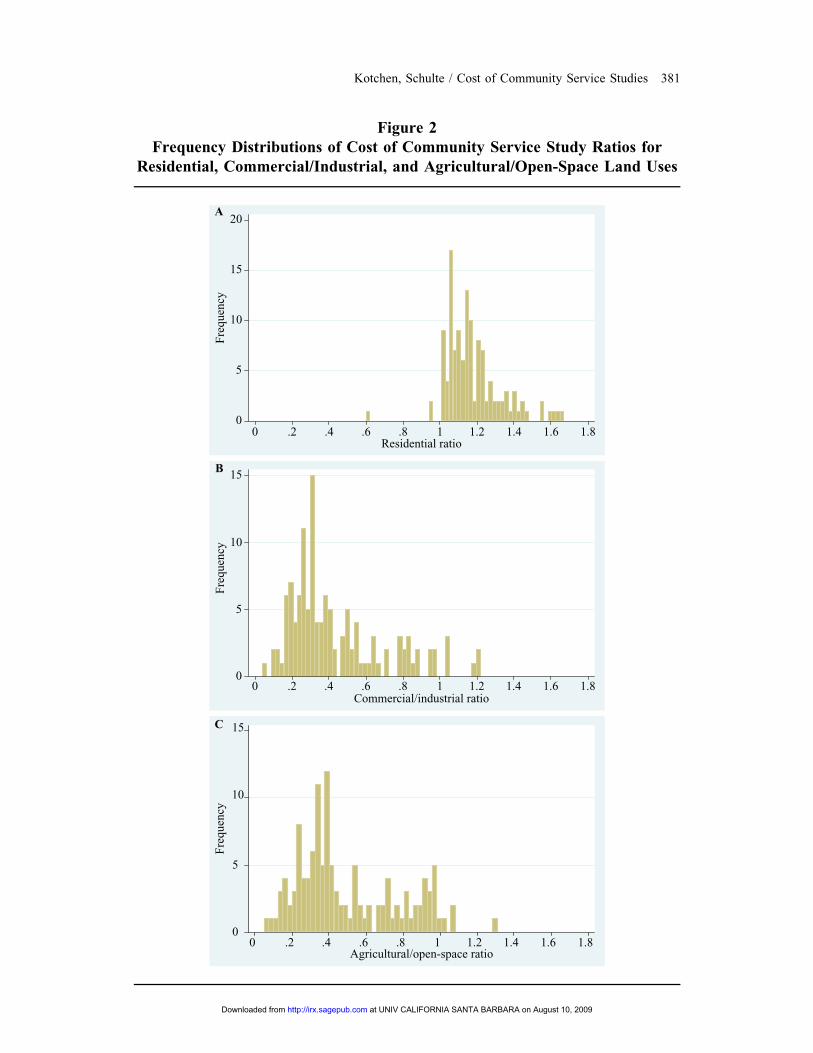
Figure 2
Frequency Distributions of Cost of Community Service Study Ratios for
Residential, Commercial/Industrial, and Agricultural/Open-Space Land Uses
0
5
10
15
20A
Fre
qu
ency
0 .2 .4 .6 .8 1 1.2 1.4 1.6 1.8Residential ratio
0
5
10
15
Fre
qu
ency
0 .2 .4 .6 .8 1 1.2 1.4 1.6 1.8Commercial/industrial ratio
0
5
10
15
Fre
qu
ency
0 .2 .4 .6 .8 1 1.2 1.4 1.6 1.8Agricultural/open-space ratio
C
B
Kotchen, Schulte / Cost of Community Service Studies 381
at UNIV CALIFORNIA SANTA BARBARA on August 10, 2009 http://irx.sagepub.comDownloaded from
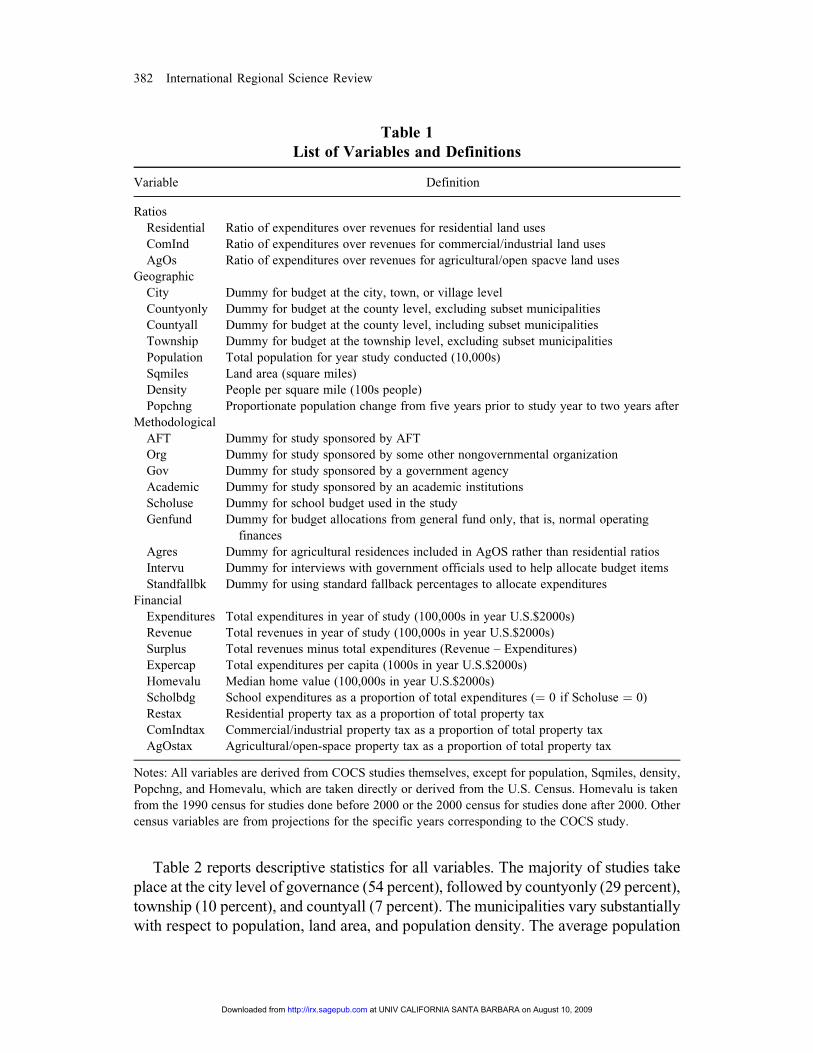
Table 2 reports descriptive statistics for all variables. The majority of studies take
place at the city level of governance (54 percent), followed by countyonly (29 percent),
township (10 percent), and countyall (7 percent). The municipalities vary substantially
with respect to population, land area, and population density. The average population
Table 1
List of Variables and Definitions
Variable Definition
Ratios
Residential Ratio of expenditures over revenues for residential land uses
ComInd Ratio of expenditures over revenues for commercial/industrial land uses
AgOs Ratio of expenditures over revenues for agricultural/open spacve land uses
Geographic
City Dummy for budget at the city, town, or village level
Countyonly Dummy for budget at the county level, excluding subset municipalities
Countyall Dummy for budget at the county level, including subset municipalities
Township Dummy for budget at the township level, excluding subset municipalities
Population Total population for year study conducted (10,000s)
Sqmiles Land area (square miles)
Density People per square mile (100s people)
Popchng Proportionate population change from five years prior to study year to two years after
Methodological
AFT Dummy for study sponsored by AFT
Org Dummy for study sponsored by some other nongovernmental organization
Gov Dummy for study sponsored by a government agency
Academic Dummy for study sponsored by an academic institutions
Scholuse Dummy for school budget used in the study
Genfund Dummy for budget allocations from general fund only, that is, normal operating
finances
Agres Dummy for agricultural residences included in AgOS rather than residential ratios
Intervu Dummy for interviews with government officials used to help allocate budget items
Standfallbk Dummy for using standard fallback percentages to allocate expenditures
Financial
Expenditures Total expenditures in year of study (100,000s in year U.S.$2000s)
Revenue Total revenues in year of study (100,000s in year U.S.$2000s)
Surplus Total revenues minus total expenditures (Revenue – Expenditures)
Expercap Total expenditures per capita (1000s in year U.S.$2000s)
Homevalu Median home value (100,000s in year U.S.$2000s)
Scholbdg School expenditures as a proportion of total expenditures (¼ 0 if Scholuse ¼ 0)
Restax Residential property tax as a proportion of total property tax
ComIndtax Commercial/industrial property tax as a proportion of total property tax
AgOstax Agricultural/open-space property tax as a proportion of total property tax
Notes: All variables are derived from COCS studies themselves, except for population, Sqmiles, density,
Popchng, and Homevalu, which are taken directly or derived from the U.S. Census. Homevalu is taken
from the 1990 census for studies done before 2000 or the 2000 census for studies done after 2000. Other
census variables are from projections for the specific years corresponding to the COCS study.
382 International Regional Science Review
at UNIV CALIFORNIA SANTA BARBARA on August 10, 2009 http://irx.sagepub.comDownloaded from
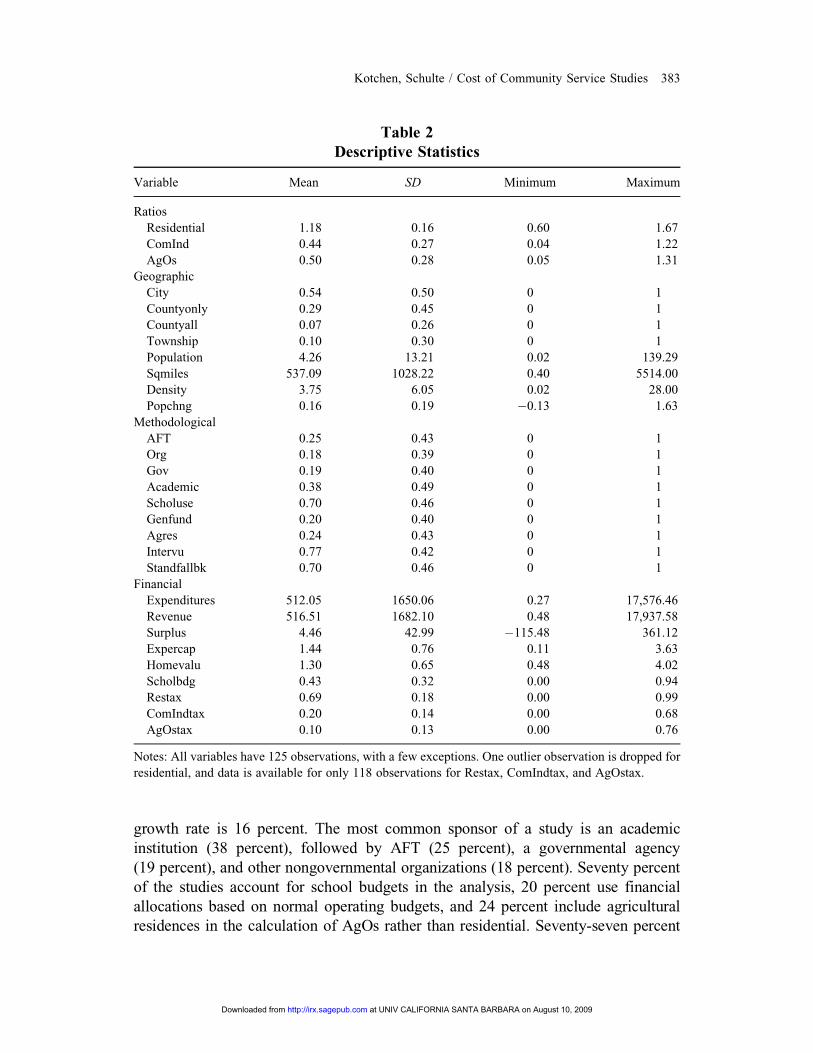
growth rate is 16 percent. The most common sponsor of a study is an academic
institution (38 percent), followed by AFT (25 percent), a governmental agency
(19 percent), and other nongovernmental organizations (18 percent). Seventy percent
of the studies account for school budgets in the analysis, 20 percent use financial
allocations based on normal operating budgets, and 24 percent include agricultural
residences in the calculation of AgOs rather than residential. Seventy-seven percent
Table 2
Descriptive Statistics
Variable Mean SD Minimum Maximum
Ratios
Residential 1.18 0.16 0.60 1.67
ComInd 0.44 0.27 0.04 1.22
AgOs 0.50 0.28 0.05 1.31
Geographic
City 0.54 0.50 0 1
Countyonly 0.29 0.45 0 1
Countyall 0.07 0.26 0 1
Township 0.10 0.30 0 1
Population 4.26 13.21 0.02 139.29
Sqmiles 537.09 1028.22 0.40 5514.00
Density 3.75 6.05 0.02 28.00
Popchng 0.16 0.19 ÿ0.13 1.63
Methodological
AFT 0.25 0.43 0 1
Org 0.18 0.39 0 1
Gov 0.19 0.40 0 1
Academic 0.38 0.49 0 1
Scholuse 0.70 0.46 0 1
Genfund 0.20 0.40 0 1
Agres 0.24 0.43 0 1
Intervu 0.77 0.42 0 1
Standfallbk 0.70 0.46 0 1
Financial
Expenditures 512.05 1650.06 0.27 17,576.46
Revenue 516.51 1682.10 0.48 17,937.58
Surplus 4.46 42.99 ÿ115.48 361.12
Expercap 1.44 0.76 0.11 3.63
Homevalu 1.30 0.65 0.48 4.02
Scholbdg 0.43 0.32 0.00 0.94
Restax 0.69 0.18 0.00 0.99
ComIndtax 0.20 0.14 0.00 0.68
AgOstax 0.10 0.13 0.00 0.76
Notes: All variables have 125 observations, with a few exceptions. One outlier observation is dropped for
residential, and data is available for only 118 observations for Restax, ComIndtax, and AgOstax.
Kotchen, Schulte / Cost of Community Service Studies 383
at UNIV CALIFORNIA SANTA BARBARA on August 10, 2009 http://irx.sagepub.comDownloaded from
of the studies report using interviews with government officials to help allocate bud-
get items, and 70 percent report using standard fallback percentages. The municipa-
lities are highly variable with respect to expenditures, revenues, expenditures per
capita, and median home value. Although the mean for Scholbdg reported in table
2 includes all the zeros for studies that did not consider the school budget, the mean
among those that did consider the school budget is 0.62, meaning that for these muni-
cipalities the school budget accounts for 62 percent of total expenditures. Finally, the
average proportion of property tax attributable to each of the land-use categories of
residential, commercial/industrial, and agricultural/open-space is 69 percent, 20 per-
cent, and 10 percent, respectively.
We can make predictions based on the existing literature about the effect of some
variables on the results of CCS studies. A wide body of research finds that greater
density of development is associated with lower costs of providing community ser-
vices (Knaap and Nelson 1992; Altshuler et al. 1993; Ladd 1994; Duncan and Nelson
1995; Pendall 1999; Edwards et al. 2000 Carruthers and Ulfarsson 2003). In the
context of CCS studies, researchers have compared residential results in two differ-
ent communities and found that density has a negative impact on ratios (Edwards
et al. 2000). Although population density is a coarse and sometimes difficult variable
to interpret, it follows that in a meta-analysis one might expect density to have a
negative affect on residential ratios and possibly ComInd ratios as well.
Two of the methodological variables generate priors about how they might be
associated with CCS ratios. The first is Scholuse. Although property taxes from all
land uses typically contribute to the revenues used in school budgets, CCS studies
that account for the school budget allocate school expenditures solely to the residen-
tial category. Moreover, because educational expenses are such a large portion of
many budgets, residential ratios are primarily a reflection of the school budget when
they are accounted for in CCS studies (Kelsey 1996; Crompton 2000; Edwards et al.
2000). Not surprisingly, therefore, researchers find that the inclusion of a school bud-
get in the analysis tends to increase residential ratios (Kelsey 1996; Edwards et al.
2000). We expect a similar finding in our analysis here; that is, we expect Scholuse
to have a positive affect on residential ratios. At the same time, because only school
revenues are counted against the other land uses, we expect Scholuse to have a neg-
ative affect, if any, on ComInd and AgOs ratios.
The second methodological variable thought to be important is Agres, which indi-
cates that agricultural residences are included in the calculation of AgOs rather than
residential ratios. Two studies find that including farmhouses in the agricultural/
open-space category increases AgOs ratios (American Farmland Trust 1993; Pied-
mont Environmental Council 1993). Two factors in combination help explain this
result: residential ratios tend to be greater than one and agricultural residences are
likely to comprise a large proportion of the agricultural/open-space category. For
these reasons, we expect that Agres will have a positive affect on AgOs ratios in the
meta-analysis. However, because agricultural residences are likely to be a relatively
384 International Regional Science Review
at UNIV CALIFORNIA SANTA BARBARA on August 10, 2009 http://irx.sagepub.comDownloaded from
small proportion of all residences, we expect that Agres will have no affect on resi-
dential ratios.
Among the financial variables, median home value is expected to have a negative
effect on residential ratios and possibly the others as well. Although we have seen
that residential land uses tend to not ‘‘pay their own way,’’ more detailed studies find
that high-value homes are more likely to pay for the services they receive (Englehart
1997; Dorfman et al. 2002). This suggests that with higher home values, revenues
tend to increase faster than expenditures. Hence, the prediction here is that Homevalu
will have a negative effect on residential ratios. Furthermore, to the extent that higher
home values are positively correlated with other property values, and revenues
increase faster than expenditures for other land uses as well, we expect Homevalu
to have a negative effect on ComInd and AgOs ratios.
Many of the other variables are thought to be consequential, although prior expec-
tations about the directional effects are less clear. Whether a study takes place at the
city, county, or township level may matter because different levels of governance
tend to provide different services, and there are no established trends about how this
affects the balance of expenditures and revenues for different land uses (Snyder and
Ferguson 1994; DeBoer and Zhou 1997). Population might capture diseconomies of
scale, and Popchng might capture the affect of recent land-use change primarily in
the residential and commercial/industrial categories. We test explicitly for effects
of the methodological variables Intervu, Standfallbk, and type of study sponsor
(AFT, Org, Gov, Academic). The type of study sponsor is included to investigate
potential bias beyond that attributable to the other methodological assumptions for
which there are controls (Bunnell 1997, 1998;Deller 1999). Although we examine
the effects on CCS ratios of the remaining explanatory variables, we have no clear
prior expectations about the potential consequences.
III. Statistical Model
The meta-regression analysis aims to investigate the effects of different explana-
tory variables on CCS ratios for the three different land-use categories. We estimate a
system of regression equations with the following general specification:
Residentiali ¼ f MethodologyiR;GeographiciR;FinancialiR; bRð Þ þ �iR
ComIndi ¼ f MethodologyiC ;GeographiciC ;FinancialiC ; bCð Þ þ �iC
AgOsi ¼ f MethodologyiA;GeographiciA;FinancialiA; bAð Þ þ �iA;
where the subscript i denotes an observation, and subscripts R, C, and A correspond
with the residential, commercial/industrial, and agricultural/open-space land uses,
respectively. Methodology, Geography, and Financial denote vectors of the corre-
sponding variables that may differ among equations. The betas are coefficients to
Kotchen, Schulte / Cost of Community Service Studies 385
at UNIV CALIFORNIA SANTA BARBARA on August 10, 2009 http://irx.sagepub.comDownloaded from
be estimated, and the epsilons are error terms. Throughout the analysis, we consider
both linear and log-linear functional form specifications.
We began with ordinary least squares (OLS) estimation of each equation sepa-
rately with different sets of explanatory variables. The goal of this first step is to
reduce the number of explanatory variables, given the relatively small number of
observations in the dataset. We estimate each equation with different combinations
of the Methodology, Geographic, and Financial variables: each set separately, each
combination of two sets, and all three sets. The only exceptions are the property tax
variables of Restax, ComIndtax, and AgOstax, which were always included in the
equations for the corresponding land-use equation. Another exception in the omis-
sion of Sqmiles to avoid colinearity with density and population. If a variable never
came through as statistically significant at the 90-percent level in any of the runs, we
conclude that it has no significant effect on the CCS ratios for that particular land-use
category and thus drop it from further analysis. We do not report these results here,
but they, along the complete data, are available upon request.
With the remaining set of explanatory variables for each equation, we estimate a
system of SUR (Zellner 1962). Compared to OLS estimation, the SUR estimator has
the advantage of increased efficiency when the explanatory variables differ among
the equations. The reason is that correlation across the errors in different equations
provides a link that is exploited in estimation (see Wooldridge 2002), and given that
the cross-equation ratios come from the same municipalities and studies, correlation
may exist and be meaningful. Table 3 reports the SUR estimates for the linear and
log-linear specifications for all three land-use categories. We do not report OLS esti-
mates of these same equations because they do not differ in any substantial way. We
also estimate OLS models with standard errors (and therefore t statistics) that are
robust to cross-equation correlation, heteroskedasticity, and clustering to account for
cases in which a CCS study reported more than one set of ratios (see the Appendix
Table). We ran these models as a robustness check of the statistical inference, as the
standard errors account for the fact that not all studies are published separately and
therefore may not be entirely independent observations. However, we do not report
these results either, as accounting for this feature of the data has no qualitative effect.
All the equations reported in table 3 include 117 observations. Seven observations
are dropped because of missing data for the property tax variables, which are impor-
tant to the analysis. We also ran models without these variables and including the
dropped observations, but the pattern of results was very similar. One remaining
observation is dropped because its residential ratio is an outlier, as discussed previ-
ously. All the equations fit reasonably well, with R2 values ranging from .29 to .37.
AFT is the omitted category for the sponsoring organization, meaning that the coef-
ficients on the other categories are interpreted relative to the AFT baseline. City is
the omitted category and therefore the baseline for interpreting coefficients on the
level of governance variables. Overall, the qualitative results, in terms of statistical
significance, are similar between the linear and log-linear specifications.
386 International Regional Science Review
at UNIV CALIFORNIA SANTA BARBARA on August 10, 2009 http://irx.sagepub.comDownloaded from
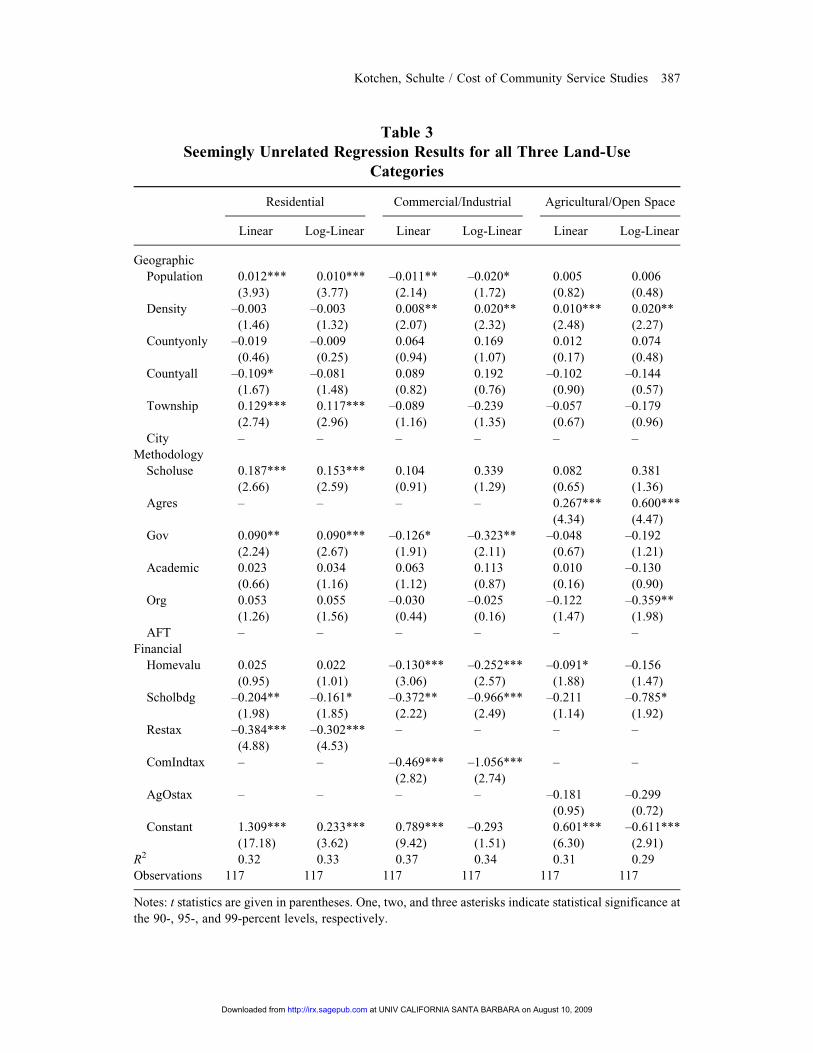
Table 3
Seemingly Unrelated Regression Results for all Three Land-Use
Categories
Residential Commercial/Industrial Agricultural/Open Space
Linear Log-Linear Linear Log-Linear Linear Log-Linear
Geographic
Population 0.012***
(3.93)
0.010***
(3.77)
–0.011**
(2.14)
–0.020*
(1.72)
0.005
(0.82)
0.006
(0.48)
Density –0.003
(1.46)
–0.003
(1.32)
0.008**
(2.07)
0.020**
(2.32)
0.010***
(2.48)
0.020**
(2.27)
Countyonly –0.019
(0.46)
–0.009
(0.25)
0.064
(0.94)
0.169
(1.07)
0.012
(0.17)
0.074
(0.48)
Countyall –0.109*
(1.67)
–0.081
(1.48)
0.089
(0.82)
0.192
(0.76)
–0.102
(0.90)
–0.144
(0.57)
Township 0.129***
(2.74)
0.117***
(2.96)
–0.089
(1.16)
–0.239
(1.35)
–0.057
(0.67)
–0.179
(0.96)
City – – – – – –
Methodology
Scholuse 0.187***
(2.66)
0.153***
(2.59)
0.104
(0.91)
0.339
(1.29)
0.082
(0.65)
0.381
(1.36)
Agres – – – – 0.267***
(4.34)
0.600***
(4.47)
Gov 0.090**
(2.24)
0.090***
(2.67)
–0.126*
(1.91)
–0.323**
(2.11)
–0.048
(0.67)
–0.192
(1.21)
Academic 0.023
(0.66)
0.034
(1.16)
0.063
(1.12)
0.113
(0.87)
0.010
(0.16)
–0.130
(0.90)
Org 0.053
(1.26)
0.055
(1.56)
–0.030
(0.44)
–0.025
(0.16)
–0.122
(1.47)
–0.359**
(1.98)
AFT – – – – – –
Financial
Homevalu 0.025
(0.95)
0.022
(1.01)
–0.130***
(3.06)
–0.252***
(2.57)
–0.091*
(1.88)
–0.156
(1.47)
Scholbdg –0.204**
(1.98)
–0.161*
(1.85)
–0.372**
(2.22)
–0.966***
(2.49)
–0.211
(1.14)
–0.785*
(1.92)
Restax –0.384***
(4.88)
–0.302***
(4.53)
– – – –
ComIndtax – – –0.469***
(2.82)
–1.056***
(2.74)
– –
AgOstax – – – – –0.181
(0.95)
–0.299
(0.72)
Constant 1.309***
(17.18)
0.233***
(3.62)
0.789***
(9.42)
–0.293
(1.51)
0.601***
(6.30)
–0.611***
(2.91)
R2 0.32 0.33 0.37 0.34 0.31 0.29
Observations 117 117 117 117 117 117
Notes: t statistics are given in parentheses. One, two, and three asterisks indicate statistical significance at
the 90-, 95-, and 99-percent levels, respectively.
Kotchen, Schulte / Cost of Community Service Studies 387
at UNIV CALIFORNIA SANTA BARBARA on August 10, 2009 http://irx.sagepub.comDownloaded from
IV. Results
Let us first consider results for the geographic variables. We find that population
has a statistically significant effect on the residential and ComInd ratios, but the two
effects have opposite signs. An increase in population increases residential ratios but
decreases commercial/industrial ratios. In discussing magnitudes, here and through-
out, we focus on the log-linear specifications, which are intuitive because marginal
effects are interpreted as percentage changes in the CCS ratios. We find that an
increase of 10,000 people increases residential by 1 percent and decreases ComInd
by 2 percent. These results suggest that, with respect to the ratio of expenditures-to-
revenues, population exhibits decreasing returns to scale for residential land uses, but
increasing returns to scale for commercial/industrial land uses. A possible explanation
for the latter result is that larger populations are associated with greater density of
commercial districts, which may have smaller expenditure-to-revenue ratios.
Population density has a positive and statistically significant effect on both the
ComInd and the AgOs ratios. The magnitude of the effect in terms of a percentage
change is similar between the two land-use categories: an increase of 100 people per
square mile increases both ratios by 2 percent. We have no obvious explanation for
the ComInd result, but the effect of density on AgOs ratios may be due to the fact that
open spaces in higher density areas tend to be smaller, more urban parks. Although
parks of this type do not generate revenue, they tend to require sizable expenses for
routine upkeep, resulting in higher ratios.
Somewhat surprisingly, we find no statistically significant effect of density on the
residential ratios, although the coefficient is negative. Recall that the existing liter-
ature provides evidence that greater density tends to decrease the expenditure-to-
revenue ratio of residential land use and that a significant emphasis in planning
literature and policy is to promote density for economic and other concerns. One
general concern, however, is that our measure of density is crude, despite its frequent
use in research. Population divided by total land area is an estimate of aggregate
population density, but it may not provide a good proxy for the actual density of
development in different areas.
Among the categorical variables for different levels of governance, the most gen-
eral result is that they seem to not matter very much. Although different levels of
governance manage different categories of expenditures and revenues, the break-
down in terms of ratios for different land uses is relatively constant and/or is esti-
mated with little precision for ComInd and AgOs. We do, however, find some
statistically significant differences in the residential equation. Most notably, town-
ship is associated with greater residential ratios than city, by a magnitude of nearly
12 percent. Although it is difficult to provide a clear interpretation, one possible
explanation is once again related to the density of development. To the extent that
townships have less dense residential development, the result can be interpreted as
388 International Regional Science Review
at UNIV CALIFORNIA SANTA BARBARA on August 10, 2009 http://irx.sagepub.comDownloaded from
consistent with the existing literature. Another possible explanation is that townships
are able to defer provision of services to overlapping municipalities like cities and
counties. This may be especially true for townships in or near more urban areas,
as seems to be the case with many of those in the dataset being located in New Jersey.
A further observation about the level of governance variables is that the sign of all
coefficients for the residential and ComInd equations have the opposite sign,
although most of the estimates are not statistically distinguishable from zero.
The remaining geographic variables that are not statistically significant in any of
our specifications are square miles of the municipality and population change. The
later result is particularly interesting, given that CCS studies are most frequently used
to affect decision making about growth management. It is surprising, therefore, that
Popchng is not a significant determinant of CCS ratios, especially for residential
land uses. The finding of no effect may lend support to critics of CCS studies who
question whether the average ratios are useful for making inferences about marginal
effects. Although the residential ratios, which are based on an overall average,
indicate the residential land uses do not ‘‘pay their own way,’’ we find that marginal
changes in population growth have no effect on the ratio of expenditures-to-
revenues.
Let us now turn to the methodological variables. As expected, CCS studies that
include the school budget in the analysis report higher residential ratios. The coeffi-
cients on Scholuse in the residential models are positive and highly statistically sig-
nificant. In terms of the magnitude, we find that inclusion of the school budget
increases ratios by an average of more than 15 percent. As explained previously, this
is due to the fact that school expenditures are allocated solely to residential land uses,
while the revenues come from all land uses. The implication, regardless of whether
one believes the budget should be included, is that including the school budget in a
CCS analysis causes residential land uses to appear less likely to ‘‘pay their own
way.’’ We also find, as expected, that Scholuse has an insignificant effect on the
other land-use categories.
The methodological decision to include expenses and revenues associated with
farmhouses in the AgOs category, rather than the residential category, has a large
effect on the AgOs ratios. In both models, the coefficient on Agres is positive and
highly statically significant. In the log-liner model, the magnitude is substantial: the
variable increases AgOs ratios by an average of 60 percent. As described above,
this result is expected because residential ratios tend to be greater than agricultural/
open-space ratios and farm houses are likely to comprise a large faction of AgOs land
uses in terms of revenues and expenditures. In contrast, farm houses are less likely to
comprise a large faction of overall residential land uses if included in the residential
category. This explains why we found no significant results of Agres on residential
ratios.
Among the categorical variables for the organization that sponsored each study,
we find significant differences between Gov and AFT (the omitted category).
Kotchen, Schulte / Cost of Community Service Studies 389
at UNIV CALIFORNIA SANTA BARBARA on August 10, 2009 http://irx.sagepub.comDownloaded from
Government sponsored studies have higher residential ratios and lower ComInd
ratios. The pattern is of interest though it is difficult to determine whether these
results reflect a bias in the CCS studies, omitted variables in the regression equation,
or sample selection of the sponsoring organization. Nevertheless, to the extent that
local governments seek to promote development, perhaps with the idea of increasing
the tax base, they appear to find more favorable results for commercial and industrial
land uses. This may also reflect sample selection bias of governments that carry out
CCS studies. Municipalities that conduct a CCS study may be those that know they
serve current residents better by restricting residential growth and encouraging com-
mercial and industrial land uses.
The more surprising result, however, is that AFT finds lower residential ratios than
Gov and the other sponsoring organizations. If anything, one might expect that AFT, as
a conservation organization, would find larger ratios for residential land uses to show
that residential development does not ‘‘pay its own way,’’ thereby providing an argu-
ment against further residential development. However, this appears not to be the case.
We also find that AFT does not significantly differ from Gov and Academic with
respect to the AgOs ratios. AFT is, however, associated with higher ratios than Org,
meaning that other nongovernmental organizations tend to produce more favorable
agricultural and open-space results than AFT. The difference is close to 30 percent,
which is substantial. Because the other nongovernmental organizations that tend to car-
ryout CCS studies advocate open-space conservation, it is perhaps not surprising that
they find more favorable AgOs results than other sponsoring organizations. However,
the fact that AFT is so different may lend support to the credibility of AFT studies.
Several of the other methodological variables did not produce statistically signif-
icant results in any of the specifications and, therefore, are not included in the models
reported in table 3. Specifically, we find conducting interviews with government
officials to help allocate budget items (Intervu) has no effect; whether researchers
use standard fallback percentages (based on proportional property tax revenues) to
allocate expenditures not directly tied to a particular land use (Standfallbk) or
whether the financial allocations come from only normal operating budgets (Gen-
fund). Thus, these methodological differences appear to be unimportant in terms
of reported ratios.
Turning now to the financial variables, we find that median home value does not
have a statistically significant effect on residential ratios. This result appears contrary
to the expectation that higher home values would cause residential land uses to be
more likely to ‘‘pay their own way’’ (e.g., Englehart 1997; Dorfman et al. 2002), but
it may point instead to the fact that an overall community median might be too broad
to capture the effect. We do, however, find statistically significant results for Home-
valu on the ComInd and AgOs ratios, although those for the former result are more
robust. Even still, the magnitude is quite small: a U.S.$10,000 increase in median
home value is associated with a 0.25 percent decrease in the commercial/industrial
land-use ratios.
390 International Regional Science Review
at UNIV CALIFORNIA SANTA BARBARA on August 10, 2009 http://irx.sagepub.comDownloaded from
School expenditures as a proportion of total expenditures have a negative effect
on ratios for all three land-use categories. The result for residential is somewhat sur-
prising. Our prior was that when the school budget comprises are larger fraction of
the overall budget, it would push up residential ratios because of larger expenditures
begin allocated to that land use. However, the result here suggests that as school bud-
gets increase, proportionally more revenue is being allocated to the residential sector,
possibly through property taxes, state aid, or other funding sources earmarked for
education as a result of state equalization in many states. The results for AgOs and
ComInd are more intuitive: as the school budget comprises a larger share of the over-
all budget, more revenue is likely to be reallocated from these land uses toward the
residential category.
A consistent set of results is that when a particular land use generates a larger pro-
portion of total property taxes, it is more likely to ‘‘pay its own way.’’ The results are
particularly strong for the residential and ComInd models. In terms of the magni-
tudes, a 10-percent increase in the proportion of total property tax that comes from
residential land uses is associated with a 3-percent decrease in the residential ratios.
A potential driver of this result may be Tiebout-type sorting or Fischel’s (2001)
‘‘home voter’’ perspective, meaning that when greater property tax burden falls on
the residential sector, it is because voters that live in this sector demand services
they can pay for. The result for commercial/industrial land uses is even bigger: a
10-percent increase in the proportion of total property tax is associated with
a 10-percent decrease in the ComInd ratios. Together these results suggest that as the
property-tax burden increases for a particular land use, the land use appears to not
receive a proportional increase in expenditures.
Finally, several of the financial variables were never statistically significant in
any of the estimated equations. We had no prior expectations about Expenditures,
Revenue and Surplus, and they appear to make little difference on reported ratios for
each land-use category. The same holds for Expercap, but one might nevertheless
expect this variable to play an important role. For instance, with greater expenditures
per capita, it would be reasonable to expect that certain land uses would benefit more
or less. Although we find no evidence for this based on differences in ratios between
studies, it may still be the case that it explains differences among the ratios for land
uses within a municipality.
V. Conclusion
Quantitative meta-analysis is a statistical technique that is useful for summarizing
and reviewing the results of existing research. In this article, we conduct a meta-
analysis of CCS studies. Using 125 studies, along with U.S. Census data, we create
explanatory variables to investigate underlying patterns regarding the effect of
methodological assumptions, as well as the geographic and financial characteristics
Kotchen, Schulte / Cost of Community Service Studies 391
at UNIV CALIFORNIA SANTA BARBARA on August 10, 2009 http://irx.sagepub.comDownloaded from
of communities. The overall objective is to exploit variation across studies to explain
differences in reported ratios of expenditures-to-revenues within the three land-use
categories of residential, commercial/industrial, and agricultural/open-space. Under-
standing what drives differences is important because CCS studies are increasingly
popular and influential in debates about municipal land-use decision making. In
particular, arguments are made in favor of land uses associated with lower ratios,
which are interpreted to mean that the land use is more likely to ‘‘pay its own way.’’
The main findings of our analysis are the following. We find clear support for the
common perception that residential land uses tend to have ratios greater than one,
while commercial/industrial and agricultural/open-space land uses tend to have
ratios less than one. Recent population growth has no effect on CCS ratios for all
land-use categories. The level of governance—city, county, or township—is also
of little consequence to CCS results. Among the methodological decisions that CCS
researchers must make, two have particularly large effects. Including the school bud-
get in a CCS study increases residential ratios by more than 15 percent, and including
farm houses in the agricultural/open-space category, rather than the residential cate-
gory, increases agricultural/open-space ratios as much as 60 percent. After control-
ling for different methodological assumptions, differences remain for the effect of
the type of organization that sponsored the study. CCS studies carried out by local
governments find less favorable residential ratios and more favorable commercial/
industrial ratios than studies carried out by the AFT. Furthermore, when other non-
governmental organizations conduct a study, they find more favorable agricultural/
open-space ratios than the AFT. Median home values have no effect on the residen-
tial ratios, but they do tend to decrease the ratios for other land uses. Finally, when a
particular land-use accounts for a greater share of overall municipal property tax rev-
enue, that land use has a lower expenditure-to-revenue ratio.
In terms of guidance for the conduct and interpretation of CCS studies, we find
that several methodological assumptions make little difference. In particular,
researchers may want to simply take the least costly approach when deciding
whether to conduct interviews, use standard fallback percentages, or analyze only the
general fund. The important methodological decisions are whether to include the
school budget and whether to include farm houses in the agricultural/open-space
land-use category. CCS researchers should make these assumptions transparent and
perhaps provide sensitivity analysis. Those transferring the results of CCS studies
from one municipality to another should also be aware of the substantial effect that
these methodological decisions have on the results. Users of CCS studies should also
be aware of potential bias, although we find somewhat surprising results in this
regard.
A more general implication follows from our findings that density and median
home value have no effect on residential ratios. Although many planning decisions
about residential development tend to focus on density and factors that affect home
values, the results here suggest that these planning dimensions may have relatively
392 International Regional Science Review
at UNIV CALIFORNIA SANTA BARBARA on August 10, 2009 http://irx.sagepub.comDownloaded from
little affect on the balance of expenditures and revenues for different land-use cate-
gories. Future research should further investigate the effect of density with more
refined measures of the actual density of development. The fact that population
change had no effect on residential ratios is also an important result that some may
point to as undermining the value of CCS studies for predicting the financial impacts
of future land-use change. The result suggests that using averages from existing pat-
terns of land use may be of questionable value for making predictions about future,
marginal changes. Finally, the meta-analysis conducted in this article focuses on
explaining differences in CCS ratios within each of the three land-use categories
between municipalities, but future research should also focus on explaining differ-
ences in the ratios between land-use categories. This would be useful because muni-
cipalities themselves are not only interested in the financial balance within each land-
use category, they must also consider the overall budget balance among all types of
land use.
Appendix Table
List of Cost of Community Service Studies and Locations for all
Observations Included in the Meta-Analysis
Report Citation Study Location
American Farmland Trust (1986). The Cost of
Community Services in Hebron, Connecticut.
Washington, D.C.
Hebron, CT; Madison Township, OH; Madison
Village, OH
American Farmland Trust (1992). Does Farmland
Protection Pay? The Cost of Community Services
in Three Massachusetts Towns. Northampton,
MA
Agawan, MA; Deerfield, MA; Gill, MA
American Farmland Trust (1994). Farmland and the
Tax Bill: The Cost of Community Services in
Three Minnesota Cities. Washington, D.C.
Farmington, MN; Independence, MN; Lake Elmo,
MN
American Farmland Trust (1997). The Cost of
Community Services in Frederick County,
Maryland. Washington, D.C.
Burkettsville, MD; Frederick City, MD; Frederick
County, MD; Walkersville, MD
American Farmland Trust (1998). The Cost of
Community Services in Monmouth County, New
Jersey. Washington, D.C.
Freehold Township, NJ; Holmdel Township, NJ;
Middletown Township, NJ; Upper Freehold
Township, NJ; Wall Township, NJ
American Farmland Trust (1999). Cost of
Community Services Study: Northampton
County, Virginia. Washington, D.C.
Northampton County, VA
American Farmland Trust (1999). Cost of
Community Services Study: Skagit County,
Washington. Washington, D.C.
Skagit County, WA
(continued)
Kotchen, Schulte / Cost of Community Service Studies 393
at UNIV CALIFORNIA SANTA BARBARA on August 10, 2009 http://irx.sagepub.comDownloaded from
Appendix (continued)
Report Citation Study Location
American Farmland Trust (1999). The Cost of
Community Services in Lexington-Fayette
County Kentucky. Washington, D.C.
Lexington-Fayette County, KY
American Farmland Trust (2002). Finding the
Balance: Ranching and Rapid Growth in Bandera
County, Texas: A Cost of Community Services
Study. Washington, D.C.
Bandera County, TX
American Farmland Trust (2002). Kent County,
Maryland. Cost of Community Services Study.
Washington, D.C.
Kent County, MD
American Farmland Trust (2002). Wimico County,
Maryland. Cost of Community Services Study.
Washington, D.C.
Wimico County, MD
American Farmland Trust (2003). The Cost of
Community Services, Oldham County,
Kentucky. Washington, D.C.
Oldham County, KY
American Farmland Trust (2004). A Report on the
Cost of Community Services in San Juan County,
Washington. Washington, D.C., w/ Friends of the
San Juans.
San Juan County, WA
American Farmland Trust (2005). The Cost of
Community Services. Bedford County, Virginia.
Washington, D.C.
Bedford County, VA
American Farmland Trust (2007). The Cost of
Community Services. Okanogan County,
Washington. Washington, D.C.
Okanogan County, WA
American Farmland Trust Cost of Community
Services Study: The Value of Farmland and Open
Space in Bexar County, Texas. Washington, D.C.
Bexar County, TX
Annett, S., R. Cooksey, et al. (1993). Cost of
Community Services, Fiscal Impact Analysis,
City of Dover. Durham, NH, Department of
Resource and Economic Development,
University of New Hampshire.
Dover, NH
Auger, P. A. (1996). Does Open Space Pay?
Durham, NH, University of New Hampshire,
Cooperative Extension
Deerfield, NH; Freemont, NH; Stratham, NH
Bonner, M. and F. Gray (2005). Cost of Community
Services Study. Town of Rochester, New York.
Rochester, NY*
Bowden, M. A. (2000). The Cost of Community
Services in Hays County, TX. Community and
Regional Planning Program, University of Texas
at Austin.
Hays County, TX
Brentwood Open Space Task Force (2002). Does
Open Space Pay in Brentwood. Part 1: Housing
and Taxes.
Brentwood, NH
(continued)
394 International Regional Science Review
at UNIV CALIFORNIA SANTA BARBARA on August 10, 2009 http://irx.sagepub.comDownloaded from
Appendix (continued)
Report Citation Study Location
Bucknall, C. The Real Cost of Development.
Poughkeepsie, NY, Scenic Hudson, Inc
Amenia, NY; Fishkill, NY; Red Hook, NY
Cecil County Office of Economic Development
(1994). Fiscal Impact of Residential,
Commercial/Industrial, and Agricultural Land
Uses in Cecil County, Maryland. North East, MD
Cecil County, MD
Citizens for a Better Flathead (1999). The Fiscal
Impact of Different Land Uses on County
Government and School Districts in Flathead
County, Montana for the Fiscal year 1997.
Kalispell, MT
Flathead County, MT
Commonwealth Research Group (1995). Cost of
Community Services in Southern New England.
Southern New England Forest Consortium, Inc.
Chepachet, RI
Becket, MA; Durham, CT; Farmington, CT;
Franklin, MA; Hopkinton, RI; Leverett, MA;
Litchfield, CT; Pomfret, CT; West Greenwich,
RI; Westford, MA
Cornell Cooperative Extension of Dutchess County
and American Farmland Trust (1989). Cost of
Community Services Study: Towns of Beekman
and Northeast, Dutchess County, New York.
Millbrook, NY
Beekman, NY; North East, NY
Costa, F. J. and G. Gordon-Sommers (1999). Cost of
Community Services for 1998 for Auburn
Township, Geauga County, Ohio, Center for
Public Administration and Public Policy, Kent
State University
Auburn Township, OH
Crane, L. P., M. M. Manion, et al. (1996). A Cost of
Community Services Study of Scio Township.
School of Natural Resources and the
Environment. Ann Arbor, MI, University
of Michigan
Scio Township, MI
Dirt, Inc. (2002). A Revenue/Cost Analysis of
Community Service Provision in Grand County,
Colorado
Grand County, CO
Dirt, Inc. (2002). A Revenue/Cost Analysis of
Community Service Provision in Saguache
County, Colorado
Saguache County, CO
Dirt, Inc. (2002). A Revenue/Cost Analysis of
Community Service Provision in San Juan
County, New Mexico
San Juan County, NM
Edwards, M., D. Jackson-Smith, et al. (1999).
The Cost of Community Services for Three Dane
County Towns: Dunn, Perry, and Westport,
Wisconsin Land Use Program, University of
Wisconsin-Madison
Dunn, WI**; Perry, WI**; Westport, WI**
(continued)
Kotchen, Schulte / Cost of Community Service Studies 395
at UNIV CALIFORNIA SANTA BARBARA on August 10, 2009 http://irx.sagepub.comDownloaded from
Appendix (continued)
Report Citation Study Location
Fallon, Ed, Office of Iowa State Representative.
(1998). The Cost of Community Services in
Three Central Iowa Cities
Altoona, IA; Indianola, IA; Waukee, IA
Haggerty, M. (1997). Fiscal Impacts of Alternative
Development Patterns: Broadwater and Gallatin
Counties. Bozeman, MT, Local Government
Center, Montana State University
Broadwater County, MT; Gallatin County, MT
Haggerty, M. (2000). The Cost of Community
Services in Custer County, Colorado. Sonoran
Institute, Bozeman, MT
Custer County, CO
Hartmans, M. and N. Meyer (1997). Financing
Services for Residential, Commercial and
Agricultural Parcels: The Cases of Canyon and
Cassia Counties. Moscow, ID, Department of
Agricultural Economics and Rural Sociology,
College of Agriculture, University of Idaho
Canyon County, ID*; Cassia County, ID*
Innovative Natural Resource Solutions LLC
(undated) Cost of Community Services Study.
Town of Mont Vernon, New Hampshire
Mont Vernon, NH
Innovative Natural Resource Solutions LLC (2005).
Cost of Community Services Study. Town of
Milton, New Hampshire
Milton, NH
Innovative natural Resource Solutions LLC (2005).
Cost of Community Services Study. Town of
Jaffrey, New Hampshire
Jaffrey, NH
Johnson, R. J. (1997). The Cost of Community
Services in Portsmouth, Rhode Island.
Narragansett, RI, The Aquidneck Island
Partnership, Coastal Resources Center,
University of Rhode Island
Portsmouth, RI
Leighton, M. and N. Meyer (1999). Financing
Services for Residential, Commercial and
Agricultural Parcels: The Cases of Kootenia and
Booneville Counties. Moscow, ID, Department
of Agricultural Economics and Rural Sociology,
College of Agriculture, University of Idaho
Bonneville County, ID*; Kootenia County, ID*
Littleton Planning Board (2002). Littleton Master
Plan. Fiscal Impacts
Littleton, MA
MacFadden, S. (1997). Cost of Community
Services Study: Town of Peterborough, New
Hampshire, Antioch New England, Peterborough
Conservation Commission, SPACE
Peterborough, NH
Murphy, B. (2001). Cost of Community Services in
Jefferson County, Montana. Boulder, MT,
Jefferson County Planning Board
Jefferson County, MT
(continued)
396 International Regional Science Review
at UNIV CALIFORNIA SANTA BARBARA on August 10, 2009 http://irx.sagepub.comDownloaded from
Appendix (continued)
Report Citation Study Location
Neibling, C. R. (1997). Town of Exeter, New
Hampshire: Cost of Community Services Study.
Concord, NH, Innovative Resource Solutions,
Submitted to Exeter Conservation Commission:
17
Exeter, NH
Nellis, L. (1998). Cost of Community Services
Study. Freemont County, Idaho, Freemont
County Planning and Zoning Commission.
Freemont County Planning and Zoning
Commission
Freemont County, ID
Nelson, N. and J. H. Dorfman (2000). Cost of
Community Services for Habersham and Oconee
Counties, Georgia. Athens, GA., Center for
Agribusiness and Economic Development.
The University of Georgia
Habersham County, GA; Oconee County, GA
Pickard, C. (2000). 1998 Cost of Community
Services Study: Town of Lyme, New Hampshire,
The Lyme Hill and Valley Association
Lyme, NH
Piedmont Environmental Council (1993). Financial
Analysis of the 1991 Loudoun County Budget.
Charlottesville, Virginia
Loudoun County, VA*
Prindle, A. M. (2002). Fairfield County
Development Strategy and Land Use Plan,
Fiscal Impacts Chapter. Fairfield, OH
Hocking Township, OH; Liberty Township, OH
Prinzing, K. (1999). The Cost of Providing
Community Services: Carbon County, Montana.
Red Lodge, MT, Carbon County Commissioners
Carbon County, MT
Renkow, M. (1998). The Cost of Community
Services in Chatham County: A Report to the
Chatham County Planning Department. Raleigh,
NC, Department of Agricultural and Resource
Economics, North Carolina State University
Chatham County, NC
Renkow, M. (2006). The Cost of Community
Services in Orange County. Raleigh, NC,
Department of Agricultural and Resource
Economics, North Carolina State University
Orange County, NC
San Martin, I. (1998). Town of Gilbert: The Cost of
Community Services. Tempe, AZ, Herberger
Center for Design Excellence, College of
Architecture and Environmental Design,
Arizona State University
Gilbert, AZ
Smith, L. J. and P. Henderson (2001). Cost of
Community Services Study for Truro,
Massachusetts: A Report on the Fiscal
Implications of Different Land Uses, Association
for the Preservation of Cape Cod
Truro, MA
(continued)
Kotchen, Schulte / Cost of Community Service Studies 397
at UNIV CALIFORNIA SANTA BARBARA on August 10, 2009 http://irx.sagepub.comDownloaded from
Appendix (continued)
Report Citation Study Location
Smith, L. J. and P. Henderson. (2001). Cost of
Community Services Study for Brewster
Massachusetts: A Report on the Fiscal
Implications of Different Land Uses. Association
for the Preservation of Cape Cod
Brewster, MA
Snyder, D. L. and G. Ferguson (1994). Cost of
Community Services Study: Cache, Sevier and
Utah Counties. Logan, UT, Economics
Department, Utah State University
Cache County, UT*; Sevier County, UT*; Utah
County, UT*
South Central Assembly for Effective Governance
(2002). Cost of Community Services: Hopewell
Township, York County Pennsylvania
Hopewell Township, PA
South Central Assembly for Effective Governance
(2002). Cost of Community Services:
Shrewsbury Township, York County
Pennsylvania
Shrewsbury Township, PA
Sutton Cost of Community Services Study Ad Hoc
Committee (1998). Town of Sutton, New
Hampshire: Cost of Community Services Study
Sutton, NH
Taylor, D. T. (2000). 1997 Cost of Community
Services Study: Groton, New Hampshire.
Concord, NH, New Hampshire Wildlife
Federation
Groton, NH
Tompkins County Agriculture & Farmland
Protection Board (1996). Study of Tompkins
County Agriculture, Phase I Tompkins County
Agriculture & Farmland Protection Plan
Caroline, NY; Danby, NY; Dryden, NY; Enfield,
NY; Groton, NY; Ithaca, NY; Lansing, NY;
Newfield, NY; Tompkins County, NY; Ulysses,
NY
Wintersteen, J. (1996). Economics of Land
Conservation, Scarbourough, Maine
Scarborough, ME
Notes: Study locations with one or two asterisks report two or three sets of ratios, respectively. All other
study locations report one set of ratios.
References
Altshuler, A. A., J. A. Gomez-Ibanez, et al. 1993. Regulation for revenue: The political economy of land
use exactions. Lincoln Institute for Land Policy.
American Farmland Trust. 1993. Is farmland protection a community investment? How to Do a Cost of
Community Services Report, Northampton, MA.
Bunnell, G. 1997. Fiscal impact studies as advocacy and story telling. Journal of Planning Literature
12:136-51.
———. 1998. Analyzing the fiscal impacts of development: Lessons for building successful communities.
Journal of the Community Development Society 29:38-57.
398 International Regional Science Review
at UNIV CALIFORNIA SANTA BARBARA on August 10, 2009 http://irx.sagepub.comDownloaded from
Burchell, R. W., and D. Listokin. 1978. The fiscal impact handbook: Projecting the local costs and rev-
enues related to growth. New Brunswick, NJ: Center for Urban Policy Research.
Carruthers, J. I., and G. F. Ulfarsson. 2003. Urban sprawl and the cost of public services. Environment And
Planning B-Planning & Design 30:503-22.
Crompton, J. L. 2000. The impact of parks and open space on property values and the property tax base.
Ashburn, VA: Division of Professional Services, National Recreation and Park Association.
DeBoer, L., and L. Zhou. 1997. The fiscal impact of residential development in unincorporated Wabash
Township. West Lafayette, Indiana: Department of Agricultural Economics, Purdue University.
Deller, S. C. 1999. The limitations to cost of community services studies. Community Economics News-
letter, Center for Community Economic Development, University of Wisconsin Extension.
Dorfman, J. H., D. L. Black, et al. 2002. The economic costs of development for local governments.
Athens, GA: The University of Georgia.
Duncan, J., and A. Nelson. 1995. Growth management principles and practices. APA Planners Press.
Edwards, M., D. Jackson-Smith, et al. 2000. Paying for local services: The cost of community services for
nine Wisconsin municipalities. Madison, WI: Wisconsin Land Use Research Program, Program on
Agricultural Technology Studies, College of Agricultural and Life Sciences, University of Wiscon-
sin-Madison.
Englehart, J. 1997. Palm Beach County relied on faulty figures for cost of growth, experts say. The Palm
Beach Post (Palm Beach, FL), 10.
Fischel, W. A. 2001. The homevoter hypothesis: How home values influence local government taxation,
school finance, and land-use policies. Harvard University Press. .
Johnson County Planning and Zoning Department and University of Iowa Urban and Regional Planning
Program Development Impact Study. Iowa City, IA.
Kelsey, T. W. 1996. The fiscal impacts of alternative land uses: What do cost of community services stud-
ies really tell us? Journal of the Community Development Society 27:78-89.
Knaap, G., and A. C. Nelson. 1992. The regulated landscape: Lessons on state land use planning from
Oregon. Lincoln Institute for Land Policy.
Ladd, H. 1994. Fiscal impacts of local population growth: A conceptual and empirical analysis. Regional
Science and Urban Economics 24:661-86.
Pendall, R. 1999. Do land-use controls cause sprawl? Environment and Planning B: Planning and Design
26:555-71.
Piedmont Environmental Council. 1993. Financial analysis of the 1991 Loudoun County Budget. Char-
lottesville, Virginia.
Real Estate Research Corporation. 1974. The costs of sprawl: Environmental and economic costs of alter-
native residential development patterns at the urban fringe: Detailed cost analysis. Washington, DC:
Council on Environmental Quality; Department of Housing and Urban Development; Environmental
Protection Agency.
Snyder, D. L., and G. Ferguson. 1994. Cost of community services study: Cache, Sevier and Utah Coun-
ties. Logan, UT: Economics Department, Utah State University.
Stanley, T. D. 2001. Wheat from Chaff: Meta-analysis as quantitative literature review. Journal of Eco-
nomic Perspectives Summer 15:131-50.
Wooldridge, J. M. 2002. Econometric analysis of cross section and panel data. Cambridge, MA: The MIT
Press.
Zellner, A. 1962. An efficient method of estimating seemingly unrelated regressions and tests for aggre-
gation bias. Journal of the American Statistical Association 57:348-68.
Kotchen, Schulte / Cost of Community Service Studies 399
at UNIV CALIFORNIA SANTA BARBARA on August 10, 2009 http://irx.sagepub.comDownloaded from


![META [DADOS] / META [DATA]](https://img.pdfslide.us/doc/110x75/5790780b1a28ab6874c09b8f/meta-dados-meta-data.jpg)