Embed Size (px)
Citation preview
Integrating Coastal Vulnerability and Community-BasedSubsistence Resource Mapping in Northwest Alaska
Yuri Gorokhovich†, Anthony Leiserowitz‡, and Darcy Dugan§
†Department of Earth, Environmental, andGeospatial Sciences
Lehman College, City University of New York(CUNY)
West Bronx, NY 10468, [email protected]
‡Yale UniversitySchool of Forestry & Environmental StudiesNew Haven, CT 06405, U.S.A.
§AlaskaOcean Observing System
Anchorage, AK 99501, U.S.A.
ABSTRACT
Gorokhovich, Y.; Leiserowitz, A., and Dugan, D., 2014. Integrating Coastal Vulnerability and Community-BasedSubsistence Resource Mapping in Northwest Alaska. Journal of Coastal Research, 30(1), 158–169. Coconut Creek(Florida), ISSN 0749-0208.
Subsistence resources are critical for indigenous communities in the Kotzebue Sound region of NW Alaska. Global sea-level rise (SLR) and coastal erosion are likely to create unfavorable and hazardous conditions for coastal and estuarinesettlements. It is unclear how SLR and erosion might affect coastal subsistence resources because of highly complexecological interactions. This study integrates physical, anthropological, and survey data to assess coastal vulnerabilityand to identify areas of concern for local and regional planning and environmental protection. This study analyzes andintegrates historical and projected physical coastal changes within the Kotzebue Sound region with (1) a coastalvulnerability index (CVI); (2) community-based participatory GIS maps of community subsistence resources; and (3)representative surveys of local communities to determine the importance of each type of resource. The results identifyKivalina and Deering as particularly vulnerable coastal locations among four studied villages. While the CVI is high inthese locations, low erosion rates will not likely have any negative impact on fish and caribou—two of the most importantsubsistence resource species for these communities. Because of the higher number of identified subsistence resourcespecies, Deering is more resilient than Kivalina to any potential negative coastal impacts. This methodology can beuseful in other coastal areas where subsistence resources play a major part in people’s lives.
ADDITIONAL INDEX WORDS: Coastal, subsistence resources, vulnerability, community-based GIS, spatial analysis,sea-level rise.
INTRODUCTIONOne of the tools that can help identify vulnerable coastal
areas is the coastal vulnerability index (CVI) developed by
Thieler and Hammar-Klose (1999, 2000a, b). This is a combined
index of six physical parameters related to the coast. Diez,
Perillo, and Piccolo (2007) noted that the lack of socioeconomic
indicators restricts CVI application; however, few studies have
made an attempt to include socioeconomic indicators in the
method. Hegde and Reju (2007) used a modified CVI expression
by including population as one of the variables; Ozyurt and
Ergin (2009) ranked several factors of human activity (such as
land degradation, river flow regulation, etc.) and added them to
the standard CVI equation; and Boruff, Emrich, and Cutter
(2005) combined county-based socioeconomic characteristics
with the CVI for the conterminous U.S. coast.
Using Geographic Information Systems (GIS), we combined
the CVI with community-based participatory maps of subsis-
tence resources. This study demonstrates a new integrated
methodology that can be developed and employed in coastal
areas where subsistence resources are a large part of people’s
lives and that interact with natural climate related hazards
such as sea-level rise (SLR), flooding, and coastal erosion. This
situation is particularly relevant in the Arctic.
Climate-related changes in the Northwest Arctic Borough
(NAB) (located in NW Alaska) have been summarized in
several previous reports and articles, including documentation
of the impacts on the native Inupiaq way of life (Hinzman et al.,
2005; Huntington and Fox, 2005; Whiting, 2006). These
impacts affect subsistence resources used by native Inupiaq
people for food, ethnic traditions, and education. Poppel (2006)
found that among Arctic Inuit, Alaska has a majority of
households that depend on traditional food. A similar situation
exists along the coasts of Chukotka and the Arctic Ocean in
Russia, Canada, and Greenland, where any impact on
subsistence resources from climate change directly affects the
lives of many indigenous communities.
Significant areas of employment in the NAB are located
within the public sector and seasonal work. Other important
economic activity is associated with the Red Dog Zinc Mine
located 130 km north of Kotzebue in the De Long Mountains of
the western Brooks Range; however, the majority of the
population is involved in subsistence activities. As Wolfe and
DOI: 10.2112/JCOASTRES-D-13-00001.1 received 2 January 2013;accepted in revision 19 March 2013; corrected proofs received2 May 2013.Published Pre-print online 29 May 2013.� Coastal Education & Research Foundation 2014
Coconut Creek, Florida January 2014Journal of Coastal Research 30 1 158–169
Walker (1987) state, ‘‘. . . it is a relatively hidden component of
Alaska’s economy, unmeasured in the state’s indices of
economic growth or social welfare and neglected in the state’s
economic development policy’’ (p.56).
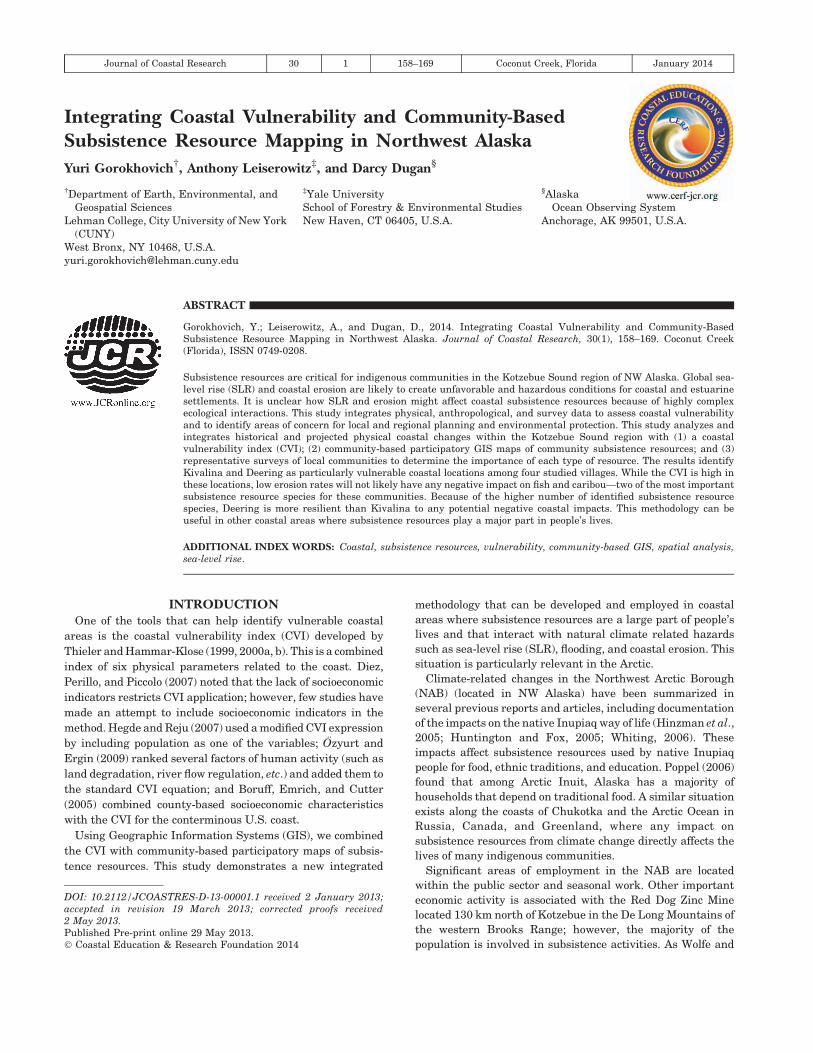
SLR, flooding, and coastal erosion have been identified as
particularly important concerns because they have direct
impacts on the coastal settlements located on Kotzebue Sound
(Figure 1). One village, Kivalina, located on a barrier island,
has experienced especially dramatic impacts. The current cost
of coastal protection in Kivalina has reached US$1.3 million,
and future investments in coastal protection and possibly
relocation could be as high as US$125 million (USACE, 2006)
for this one community. Other vulnerable settlements in the
region include Kotzebue, Selawik, and Deering. Compared to
Kivalina, these communities have experienced relatively minor
coastal erosion and less dramatic impacts on village infra-
structure but nonetheless also depend on a variety of key
subsistence resources located within the coastal zone.
While the direct impacts of coastal dynamics on these
settlements can be assessed relatively easily by engineering
surveys, the impact on subsistence resources is much harder to
assess. Subsistence resources were defined by the Inuit
Circumpolar Conference (1992) as ‘‘a highly complex notion
that includes vital economic, social, cultural and spiritual
dimensions’’ (Poppel, 2006) and are widely distributed along
the coast in both inland and seaward directions. In this paper,
however, we more narrowly refer to subsistence as resources
related to hunting, fishing, and gathering.
Many subsistence resources are seasonal (e.g., caribou,
berries, seals, etc.) and respond rapidly to environmental and
ecological changes. Thus, an assessment of the potential
impacts of SLR and coastal erosion on subsistence resources
requires data on where these resources are geographically
located and, crucially, harvested or gathered by local people,
especially when obtained from community-based research
(Dolan and Walker, 2006). GIS modeling and analysis can be
used to integrate diverse geographic data, including historic
and projected physical changes in coastlines (Gorokhovich and
Leiserowitz, 2012) and the locations of various subsistence
resources to identify potentially vulnerable areas (Mittal,
2009), which can provide valuable information for regional
coastal management and planning (Clark, 1997).
Schroeder, Andersen, and Grant (1987a, b) mapped subsis-
tence resources in the region in 1985–86. These subsistence
maps, however, are not in GIS format and are now more than
25 years old. Braund and Associates (2008) conducted a more
recent subsistence resources survey for the village of Kivalina
as part of the Environmental Impact Statement related to the
nearby Red Dog Mine.
Mixed scales, temporal intervals, and data sources create
challenges for any spatial analysis. Because the purpose of the
proposed study was to integrate coastal vulnerability with
subsistence resources, the available data had to be ‘‘normal-
ized’’ or ‘‘homogenized.’’ In GIS analysis, this technique is
called resampling; related techniques are interpolation and
extrapolation, depending on data condition and type. While
this method creates uncertainty within the selected smallest
spatial units because of the data aggregation (Goodchild, 1998),
it is applicable to large areas as long as these areas reveal the
spatial variability of studied attributes for spatial analysis.
This study developed a GIS-based index of coastal vulnera-
bility (CVI) to SLR and coastal erosion along Kotzebue Sound
and investigated its interaction with subsistence resources
using map overlays. The CVI was created by resampling and
combining various GIS data as an input to the model.
Subsistence resources were mapped using community-based
participatory GIS mapping in each of four studied settlements:
Kivalina, Kotzebue, Selawik, and Deering.
Participatory mapping has become increasingly used to
engage local communities in scientific research and local
planning. The process involves researchers working closely
with local community members in workshops or individual
interviews to map important aspects of the community.
Participatory mapping includes sketch mapping, scale map-
ping, and transect walking (Chambers, 2006). Participatory
mapping can be designed to meet the practical needs of local
people as well as to assist in planning by governments,
agencies, or others (Rambaldi et al., 2006; Sieber, 2006). This
framework allows residents to participate both as contributors
and as users of the knowledge (Shrestha, 2006; Tripathi and
Bhattarya, 2004).
To identify the relative importance of subsistence resources
categories (e.g., caribou, berries, fish, etc.) for each community,
representative surveys of each community were conducted.
These survey results were subsequently used to develop value-
based weighting in the GIS model to identify those areas
where projected impacts of SLR and coastal erosion over-
lapped with highly valued subsistence resources. This combi-
Figure 1. Area of study.
Journal of Coastal Research, Vol. 30, No. 1, 2014
Coastal Vulnerability and Subsistence Resources Mapping 159
nation of coastal and subsistence resources mapping in GIS
provides an example that can be replicated in other geographic
areas where the speed of analysis, simplicity, and low cost
matters.
METHODS AND DATADeveloping an integrated set of GIS-based vulnerability
maps for this region, however, is complicated because of the
heterogeneity of available data (i.e. in terms of scale and
temporal and spatial resolution). The NAB is a remote region
that has received little attention from federal and state geologic
and cartographic organizations. Traditional quadrangle maps
by the United States Geological Survey (USGS) exist for this
region only at a 1:63,360 scale, compared to a 1:24,000 scale for
the lower 48 states. Available bathymetric maps for Kotzebue
Sound produced by the National Oceanographic and Atmo-
spheric Agency (NOAA) were compiled between 1944 and 1976
at a scale of 1:500,000 and 1:100,000,000. More recent
bathymetric maps were compiled in 1986 at a 1:250,000 scale
(NOAA, 2011a). The same situation occurs with digital
elevation models (DEM).
Coastal geomorphology, critical for any analysis of
vulnerability to SLR and coastal erosion, is available at
the coarse scale of 1:250,000 (NOAA, 2011a). The only
data available for temporal analysis of coastline changes
at a scale less than 1:63,360 were aerial photos from the
1950s, 1980s, and 2003, which were recently released by
National Park Service (NPS); however, these data have
different scales and sources that make temporal analysis
uncertain and difficult as well (Gorokhovich and Leiser-
owitz, 2012).
GIS ApproachGIS techniques depend on available data and their quality.
GIS data might be collected or produced by modeling. This
presents challenges to the analytical process and selection of
criteria for analysis unless all data are homogeneous in terms
of their origin and scale.
The choice of GIS technique in this study was dictated by two
factors: (1) use of an index model (i.e. CVI) and (2) the
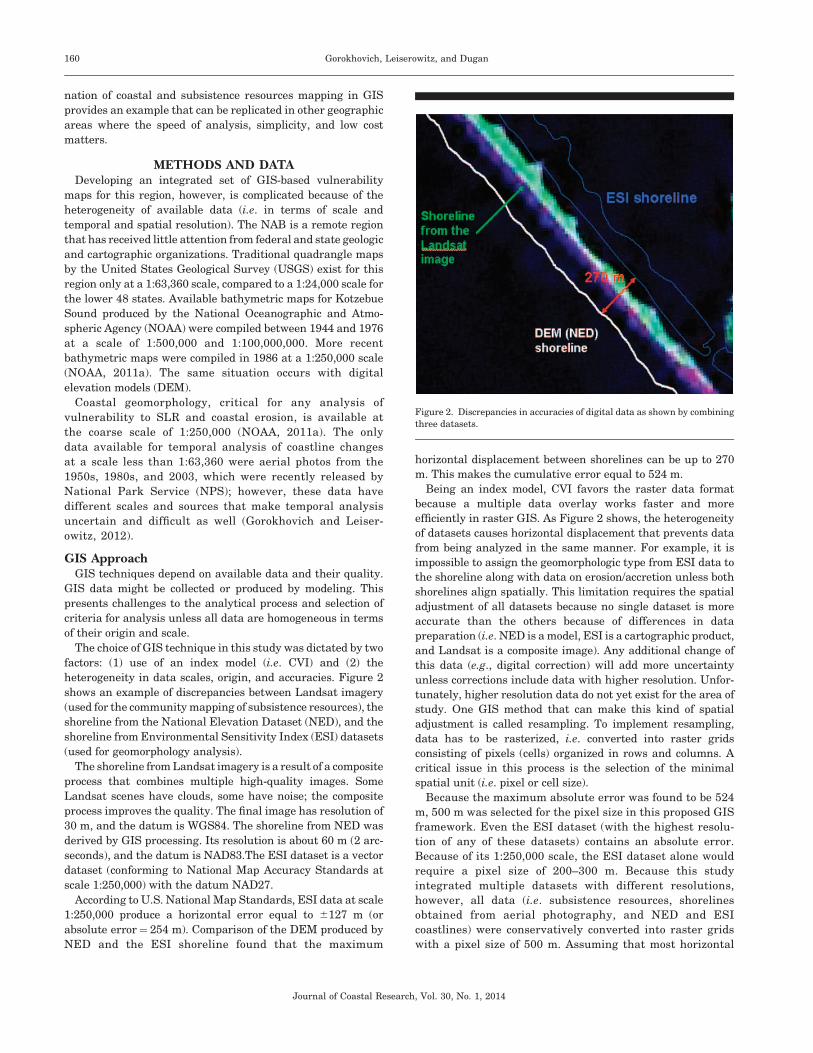
heterogeneity in data scales, origin, and accuracies. Figure 2
shows an example of discrepancies between Landsat imagery
(used for the community mapping of subsistence resources), the
shoreline from the National Elevation Dataset (NED), and the
shoreline from Environmental Sensitivity Index (ESI) datasets
(used for geomorphology analysis).
The shoreline from Landsat imagery is a result of a composite
process that combines multiple high-quality images. Some
Landsat scenes have clouds, some have noise; the composite
process improves the quality. The final image has resolution of
30 m, and the datum is WGS84. The shoreline from NED was
derived by GIS processing. Its resolution is about 60 m (2 arc-
seconds), and the datum is NAD83.The ESI dataset is a vector
dataset (conforming to National Map Accuracy Standards at
scale 1:250,000) with the datum NAD27.
According to U.S. National Map Standards, ESI data at scale
1:250,000 produce a horizontal error equal to 6127 m (or
absolute error¼ 254 m). Comparison of the DEM produced by
NED and the ESI shoreline found that the maximum
horizontal displacement between shorelines can be up to 270
m. This makes the cumulative error equal to 524 m.
Being an index model, CVI favors the raster data format
because a multiple data overlay works faster and more
efficiently in raster GIS. As Figure 2 shows, the heterogeneity
of datasets causes horizontal displacement that prevents data
from being analyzed in the same manner. For example, it is
impossible to assign the geomorphologic type from ESI data to
the shoreline along with data on erosion/accretion unless both
shorelines align spatially. This limitation requires the spatial
adjustment of all datasets because no single dataset is more
accurate than the others because of differences in data
preparation (i.e. NED is a model, ESI is a cartographic product,
and Landsat is a composite image). Any additional change of
this data (e.g., digital correction) will add more uncertainty
unless corrections include data with higher resolution. Unfor-
tunately, higher resolution data do not yet exist for the area of
study. One GIS method that can make this kind of spatial
adjustment is called resampling. To implement resampling,
data has to be rasterized, i.e. converted into raster grids
consisting of pixels (cells) organized in rows and columns. A
critical issue in this process is the selection of the minimal
spatial unit (i.e. pixel or cell size).
Because the maximum absolute error was found to be 524
m, 500 m was selected for the pixel size in this proposed GIS
framework. Even the ESI dataset (with the highest resolu-
tion of any of these datasets) contains an absolute error.
Because of its 1:250,000 scale, the ESI dataset alone would
require a pixel size of 200–300 m. Because this study
integrated multiple datasets with different resolutions,
however, all data (i.e. subsistence resources, shorelines
obtained from aerial photography, and NED and ESI
coastlines) were conservatively converted into raster grids
with a pixel size of 500 m. Assuming that most horizontal
Figure 2. Discrepancies in accuracies of digital data as shown by combining
three datasets.
Journal of Coastal Research, Vol. 30, No. 1, 2014
160 Gorokhovich, Leiserowitz, and Dugan
displacement and variability occurs within 500 m, pixels of
this size can be considered a uniform unit with known spatial
uncertainty.
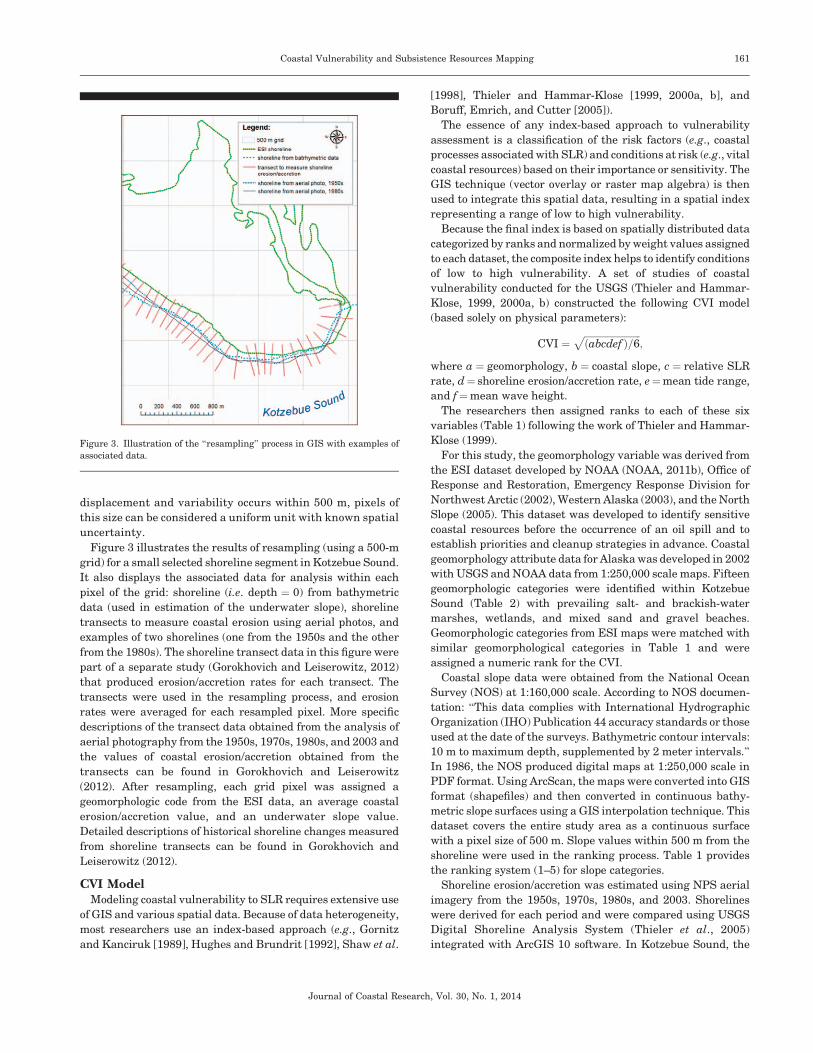
Figure 3 illustrates the results of resampling (using a 500-m
grid) for a small selected shoreline segment in Kotzebue Sound.
It also displays the associated data for analysis within each
pixel of the grid: shoreline (i.e. depth ¼ 0) from bathymetric
data (used in estimation of the underwater slope), shoreline
transects to measure coastal erosion using aerial photos, and
examples of two shorelines (one from the 1950s and the other
from the 1980s). The shoreline transect data in this figure were
part of a separate study (Gorokhovich and Leiserowitz, 2012)
that produced erosion/accretion rates for each transect. The
transects were used in the resampling process, and erosion
rates were averaged for each resampled pixel. More specific
descriptions of the transect data obtained from the analysis of
aerial photography from the 1950s, 1970s, 1980s, and 2003 and
the values of coastal erosion/accretion obtained from the
transects can be found in Gorokhovich and Leiserowitz
(2012). After resampling, each grid pixel was assigned a
geomorphologic code from the ESI data, an average coastal
erosion/accretion value, and an underwater slope value.
Detailed descriptions of historical shoreline changes measured
from shoreline transects can be found in Gorokhovich and
Leiserowitz (2012).
CVI ModelModeling coastal vulnerability to SLR requires extensive use
of GIS and various spatial data. Because of data heterogeneity,
most researchers use an index-based approach (e.g., Gornitz
and Kanciruk [1989], Hughes and Brundrit [1992], Shaw et al.
[1998], Thieler and Hammar-Klose [1999, 2000a, b], and
Boruff, Emrich, and Cutter [2005]).
The essence of any index-based approach to vulnerability
assessment is a classification of the risk factors (e.g., coastal
processes associated with SLR) and conditions at risk (e.g., vital
coastal resources) based on their importance or sensitivity. The
GIS technique (vector overlay or raster map algebra) is then
used to integrate this spatial data, resulting in a spatial index
representing a range of low to high vulnerability.
Because the final index is based on spatially distributed data
categorized by ranks and normalized by weight values assigned
to each dataset, the composite index helps to identify conditions
of low to high vulnerability. A set of studies of coastal
vulnerability conducted for the USGS (Thieler and Hammar-
Klose, 1999, 2000a, b) constructed the following CVI model
(based solely on physical parameters):
CVI ¼ffiffiffiffiffiffiffiffiffiffiffiffiffiffiffiffiffiffiffiffiffiffiffiffiðabcdef Þ=6
p;
where a ¼ geomorphology, b ¼ coastal slope, c ¼ relative SLR
rate, d¼ shoreline erosion/accretion rate, e¼mean tide range,
and f¼mean wave height.
The researchers then assigned ranks to each of these six
variables (Table 1) following the work of Thieler and Hammar-
Klose (1999).
For this study, the geomorphology variable was derived from
the ESI dataset developed by NOAA (NOAA, 2011b), Office of
Response and Restoration, Emergency Response Division for
Northwest Arctic (2002), Western Alaska (2003), and the North
Slope (2005). This dataset was developed to identify sensitive
coastal resources before the occurrence of an oil spill and to
establish priorities and cleanup strategies in advance. Coastal
geomorphology attribute data for Alaska was developed in 2002
with USGS and NOAA data from 1:250,000 scale maps. Fifteen
geomorphologic categories were identified within Kotzebue
Sound (Table 2) with prevailing salt- and brackish-water
marshes, wetlands, and mixed sand and gravel beaches.
Geomorphologic categories from ESI maps were matched with
similar geomorphological categories in Table 1 and were
assigned a numeric rank for the CVI.
Coastal slope data were obtained from the National Ocean
Survey (NOS) at 1:160,000 scale. According to NOS documen-
tation: ‘‘This data complies with International Hydrographic
Organization (IHO) Publication 44 accuracy standards or those
used at the date of the surveys. Bathymetric contour intervals:
10 m to maximum depth, supplemented by 2 meter intervals.’’
In 1986, the NOS produced digital maps at 1:250,000 scale in
PDF format. Using ArcScan, the maps were converted into GIS
format (shapefiles) and then converted in continuous bathy-
metric slope surfaces using a GIS interpolation technique. This
dataset covers the entire study area as a continuous surface
with a pixel size of 500 m. Slope values within 500 m from the
shoreline were used in the ranking process. Table 1 provides
the ranking system (1–5) for slope categories.
Shoreline erosion/accretion was estimated using NPS aerial
imagery from the 1950s, 1970s, 1980s, and 2003. Shorelines
were derived for each period and were compared using USGS
Digital Shoreline Analysis System (Thieler et al., 2005)
integrated with ArcGIS 10 software. In Kotzebue Sound, the
Figure 3. Illustration of the ‘‘resampling’’ process in GIS with examples of
associated data.
Journal of Coastal Research, Vol. 30, No. 1, 2014
Coastal Vulnerability and Subsistence Resources Mapping 161
study by Gorokhovich and Leiserowitz (2012) found mean
erosion rates of�0.12 to�0.08 m/y from 1950 to 2003. During
the resampling process, transect values for each pixel were
averaged using ArcGIS function Zonal Statistics (ESRI,
ArcGIS Resource Center, 2013). Obtained values of erosion/
accretion were assigned ranks according to Table 1.
Three CVI variables, SLR, wave height, and tidal range were
not used in the model because they were considered constant,
considering their miniscule spatial variability within a rela-
tively small area of Kotzebue Sound and the lack of spatially
distributed data showing spatial and temporal variability of
these parameters along the Kotzebue Sound shoreline; there-
fore, the CVI index was calculated as
CVI ¼ffiffiffiffiffiffiffiffiffiffiffiffiffiffiffiffiffiffiðabdÞ=3
p;
where a¼ geomorphology, b¼ coastal slope, and d¼ shoreline
erosion/accretion rate (m/y). After all three datasets were
assigned CVI ranks, they were converted into 500-m grids and
combined in GIS as raster layers.
Community-Based Participatory GIS Mapping ofSubsistence Resources
Our subsistence resources maps were constructed in collab-
oration with local experts, including community elders,
hunters, fishers, and gatherers using interactive GIS tools.
Public workshops in Deering, Kivalina, Kotzebue, and Selawik
were conducted to (1) identify key climate change concerns and
community-reported vulnerabilities; (2) map village infrastruc-
ture, subsistence-use areas, transportation routes, cultural
sites, observed climate change impacts, and community-
identified vulnerabilities; and (3) educate community members
about the current and projected climate change impacts in the
Arctic, Alaska, and NAB.
An early study by Schroeder et al. (1987a) documented
subsistence areas specific to the Kotzebue Sound region of
Alaska. More recent studies in the region include the
production and distribution of subsistence food in several
villages (Magdanz, Utermole, and Wolfe, 2002) and an update
to the Kotzebue Sound harvest areas (Whiting, 2006) and the
Kivalina area (Braund and Associates, 2008). The Alaska
Department of Fish and Game also completed a statewide
subsistence survey assessment, looking at subsistence in
Alaska over the past 25 years (Wolfe, 2004).
Groundwork for the participatory mapping workshops began
with a visit to each village in the summer of 2008. This first trip
established local connections, introduced the project to the
community, and developed a study plan in cooperation with
local leaders, including exploration of whether the research
process or final products could assist with other community
projects. Researchers were also taken by local residents in
boats along the coastline in Kivalina and through part of the
river and lake system near Selawik to collect GIS data points
for georeferencing and to document coastal erosion. GIS data
points were collected with a Trimble ProXH receiver and later
processed with differential correction to be used for georefer-
encing of the aerial images of the area. Coastal erosion was
documented by digital video and photography.
The organization of the mapping workshops was discussed,
including the optimal scale of the maps, the extent of coverage
around the village needed to capture subsistence areas, and
whom to invite. We found that participants (predominantly
Inupiaq Eskimo) greatly preferred false-color Landsat imagery
to USGS 1:24,000 quadrangles and cartographic maps by the
U.S. Fish and Wildlife Service. In fact, participants were
universally delighted with these images, had no difficulties
interpreting false color, and found them far more intuitive as a
representation of the landscapes that they knew intimately
through years of personal experience.
The research team returned in January 2009 to conduct the
mapping workshops. This timing was chosen to maximize
participant attendance, as local residents—particularly hunt-
ers—are often out on the land hunting and fishing during other
times of year. Participants were identified and invited by local
leaders in the tribal or city government or by the environmen-
tal coordinator in each village. Some of these names had been
assembled through conversations with other hunters and
Table 1. Ranking of coastal vulnerability index in the USGS model (Thieler and Hammar-Klose, 1999).
Ranking of Coastal Vulnerability Index (CVI)
Variable 1, Very low 2, Low 3, Moderate 4, High 5, Very High
Geomorphology Rocky, cliffed
coasts
Medium cliffs Low cliffs,
glacial drift
Cobble beaches,
estuary, lagoon
Barrier beaches, sand beaches,
salt marshes, mud flats, deltas
Coastal slope (%) .0.115 0.115–0.055 0.055–0.035 0.035–0.022 ,0.022
Relative sea-level change (mm/y) ,1.8 1.8–2.5 2.5–3.0 3.0–3.4 .3.4
Shoreline erosion/accretion (m/y) .2.0 1.0–2.0 �1.0–þ1.0 �1.1–�2.0 ,�2.0
Mean tide range (m) .6.0 4.1–6.0 2.0–4.0 1.0–1.9 ,1.0
Mean wave height (m) ,0.55 0.55–0.85 0.85–1.05 1.05–1.25 .1.25
Table 2. Coastal geomorphologic categories within Kotzebue Sound
(summarized from ESI data) and associated ranks.
ESI Category
Total Length along
the Coast (m)
CVI
Rank
Salt- and brackish-water marshes, wetlands 1,402,744.8 5
Mixed sand and gravel beaches 645,942.5 5
Gravel beaches 142,871.4 3
Sheltered rocky shores 103,181.3 2
Tundra cliffs 80,478.8 2
Exposed tidal flats 71,465.5 5
Exposed scarps and steep slopes in clay 44,807.5 2
Fine- to medium-grained sand beaches 37,848.4 5
Sheltered tidal flats 23,513.8 3
Exposed rocky shore 11,132.3 2
Coarse-grained sand beaches 5210.3 3
Scarps and steep slopes in sand 4539.2 3
Exposed wave-cut platforms in bedrock 4112.3 2
Exposed solid man-made structures 952.6 2
Journal of Coastal Research, Vol. 30, No. 1, 2014
162 Gorokhovich, Leiserowitz, and Dugan
elders during the June trip to villages. Invitations were issued
by local contacts—by phone in Selawik, by paper flyer delivered
to the home in Kivalina, and by VHF radio in Deering. Eight to
10 hunters and elders were invited to each workshop, which
was held in the city building, tribal council building, or school.
Participants were all male except in the village of Deering,
where two women participated.
Workshops were structured with an introduction to the
project and a brief overview of climate change science, followed
by the group mapping session. Mapping categories included
transportation routes by snow machine and all-terrain vehicles
(ATV), subsistence areas (usually the six to eight most
harvested species depending on the village), cultural sites such
as ancestral graveyards or cultural camps, and observed
climate change impacts. Workshops lasted 1.5 to 2 hours.
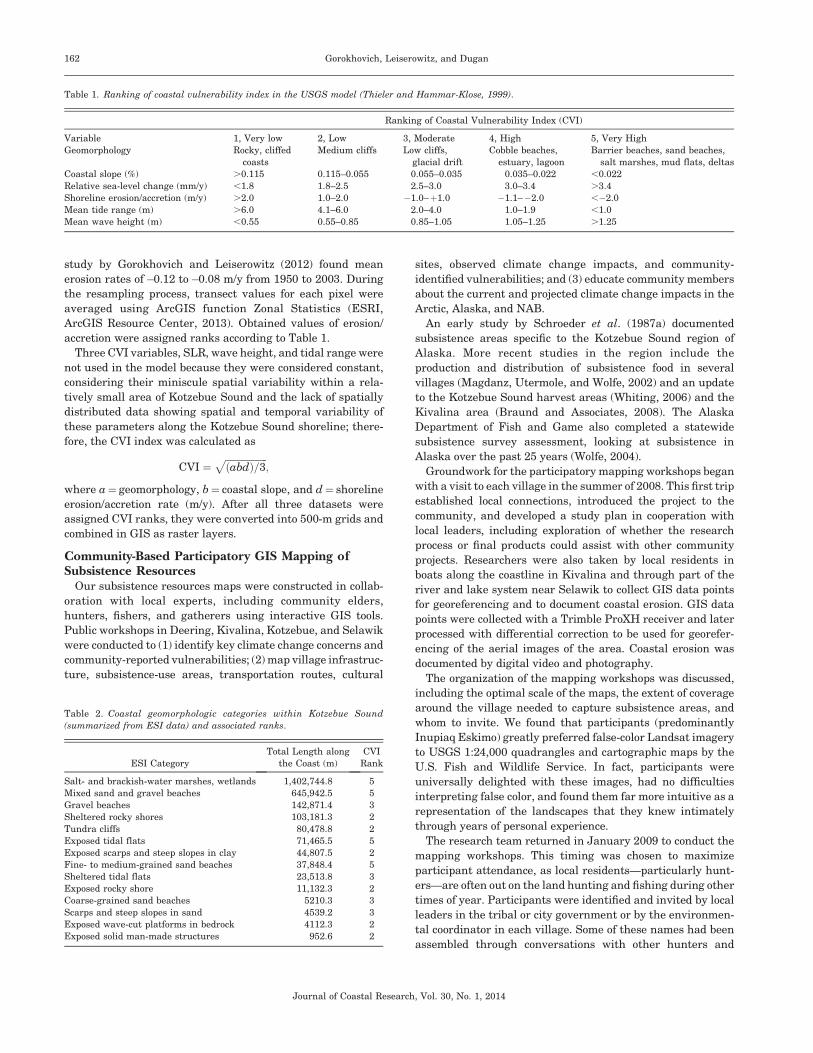
For data collection, the project tested a new GIS technology,
which employed a laptop on which participants could draw
directly onto the screen with a special digital pen. These marks
were instantaneously digitized and saved as ‘‘layers’’ in GIS.
Because only one person could use the pen at a time and not
everyone felt comfortable marking on the laptop screen, the
image was projected onto the wall at a large scale so that
everyone in the room could follow along. As participants
described use areas, they often stood next to the screen and
pointed to specific areas on the projected map as researchers
followed along with the stylus (Figure 4). Mistakes were easily
erased and redrawn. It was also possible to zoom in and out if
precision required a smaller or larger scale. This function was
utilized frequently.
Cultural sites were typically depicted in points, transporta-
tion routes in lines, and subsistence areas with polygons.
Researchers usually started discussion with open-ended
questions such as ‘‘Where do you usually go to hunt caribou?’’
and asked participants to indicate the extent of their typical
hunting area over the past decade. Final drawings were stored
in ArcGIS shapefile format.
The group setting of the mapping exercise provided an
opportunity for consensus, stimulated discussion, and often
prompted memories of additional locations that did not emerge
during the first period of meetings. There were very few
instances in which participants had differing opinions; these
were resolved quickly and smoothly. During the course of the
workshops, there were occasionally individuals that observed,
but did not participate, but this was rare. All attendees at the
workshops were compensated with US$100 (cash).
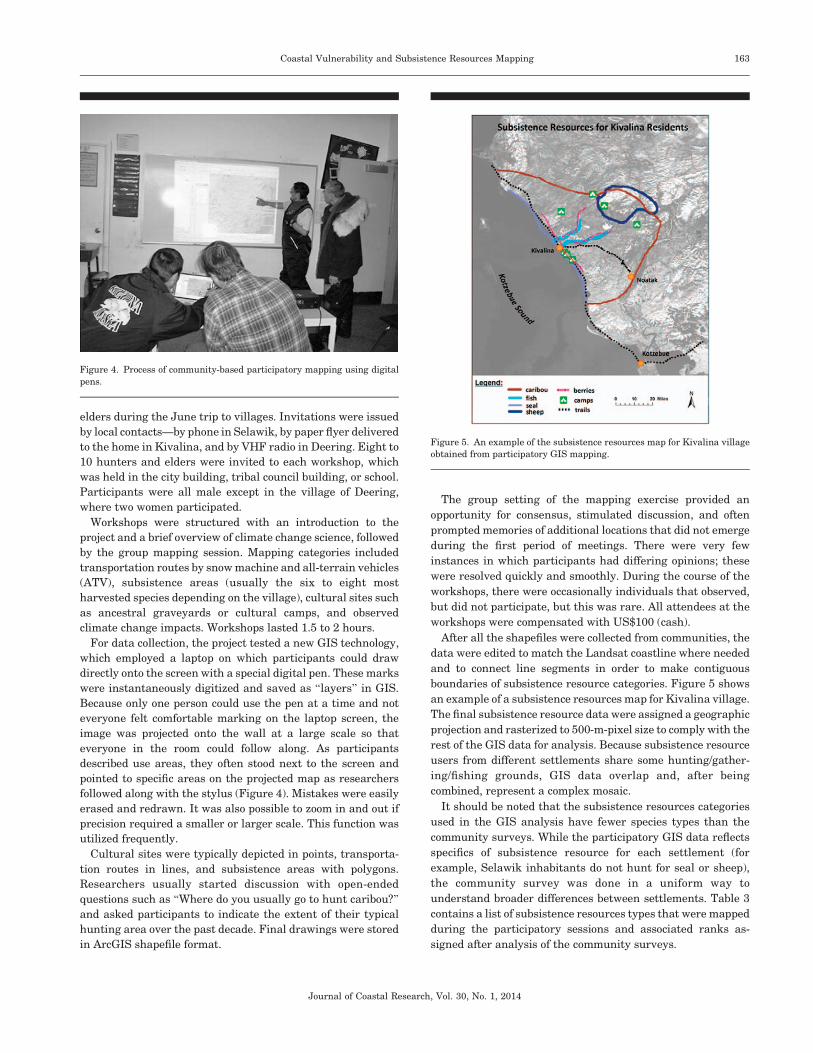
After all the shapefiles were collected from communities, the
data were edited to match the Landsat coastline where needed
and to connect line segments in order to make contiguous
boundaries of subsistence resource categories. Figure 5 shows
an example of a subsistence resources map for Kivalina village.
The final subsistence resource data were assigned a geographic
projection and rasterized to 500-m-pixel size to comply with the
rest of the GIS data for analysis. Because subsistence resource
users from different settlements share some hunting/gather-
ing/fishing grounds, GIS data overlap and, after being
combined, represent a complex mosaic.
It should be noted that the subsistence resources categories
used in the GIS analysis have fewer species types than the
community surveys. While the participatory GIS data reflects
specifics of subsistence resource for each settlement (for
example, Selawik inhabitants do not hunt for seal or sheep),
the community survey was done in a uniform way to
understand broader differences between settlements. Table 3
contains a list of subsistence resources types that were mapped
during the participatory sessions and associated ranks as-
signed after analysis of the community surveys.
Figure 4. Process of community-based participatory mapping using digital
pens.
Figure 5. An example of the subsistence resources map for Kivalina village
obtained from participatory GIS mapping.
Journal of Coastal Research, Vol. 30, No. 1, 2014
Coastal Vulnerability and Subsistence Resources Mapping 163
Ranking Subsistence Resources via Community SurveysWe then conducted a representative survey of all four
communities to assess public observations of local environ-
mental change, climate change awareness, risk perceptions,
policy preferences, and self-assessed importance of specific
village infrastructure, cultural sites, and local subsistence
resources. Telephone interviews (n¼163) were conducted from
11 June to 28 June 2010 by Craciun Research, using
professional interviewers speaking one or more local languag-
es, though most interviews were conducted in English. The
remaining interviews (n ¼ 223) were conducted in person by
Craciun Research interviewers who traveled to Kotzebue,
Selawik, Kivalina, and Deering. One-on-one interviews were
conducted during the period from 26 October to 3 November
2010 with individuals who were not originally contacted at
home by telephone.
Specific QuestionsFirst, to assess the importance of different subsistence
resources potentially at risk because of SLR and coastal
erosion, respondents were asked the following (randomized)
questions: ‘‘Rising sea levels and coastal erosion could make
subsistence hunting, fishing, and gathering more difficult. How
big of a loss would it be to your family if your village no longer
had access to each of the following—very big, big, medium,
small, or no loss at all?’’ (The access questions referred to
caribou, moose, seals, beluga or other whales, fur-bearing
animals, fish, birds, bird eggs, berries.)
Second, to assess the importance of different village
infrastructure and facilities potentially at risk because of
SLR and coastal erosion, respondents were asked the
following (randomized) questions: ‘‘Rising sea levels and
coastal erosion could also damage some villages. How big of a
loss would each of the following be to your family—very big,
big, medium, small, or no loss at all?’’ (The loss questions
referred to the medical clinic, school, airstrip, graveyard,
store, shoreline road, barge dock, electricity, fuel tanks, and
their personal fishing camp.)
Ranking ProcessThe subsistence resource data were subsequently assigned
ranks and were combined in GIS for each studied village (i.e.
Kivalina, Kotzebue, Deering, and Selawik). Ranks were
constructed by calculating the mean value of each subsistence
resource (not including a few ‘‘don’t know’’ responses), then
calculating the range from the most important to least
important resource for each village. The range was then
divided into five equal ranks, and the species assigned a
ranking corresponding with their location in the range. Table 3
shows subsistence resource categories and associated ranks.
For example, in Kivalina, whales were considered the most
important resource and moose the least important resource,
with means ranging from 1.44 (whales) to 2.05 (moose) on a
scale ranging from 1 (very big loss) to 4 (no loss). Thus, the
range between the most and least important resource was 0.61.
Divided by five, the ranks were constructed in 0.12 increments.
As a result, in Kivalina, rank 1 included whales, caribou, and
fish; rank 2 included seals, berries, and birds; rank 3 included
eggs and fur-bearing animals; rank 4 was empty; and rank 5
included only moose. The same process was used to calculate
rankings for subsistence species and village infrastructure
independently for each village—each village was assigned
importance rankings based solely on their own preferences.
Thus, in Kivalina, rank 1 resources were whales, caribou, and
fish. By contrast, in Kotzebue, rank 1 resources were fish and
berries.
Integration of CVI with Highly Important SubsistenceResources
Using GIS, we integrated CVI index and subsistence
resources data to identify critical coastal areas that will be
affected by erosion because of SLR. Results of a previous study
by Gorokhovich and Leiserowitz (2012) concluded that ‘‘future
erosion rates may be as high as�0.16–0.6 m/yr for the period
2000–2049 and �0.42–1.65 m/yr for the period 2050–2100.’’
These erosion rates correspond to CVI . 3 (i.e. high and highest
vulnerability). Therefore, potentially vulnerable areas of
subsistence resources will be at coastal locations where critical
CVIs and highly important subsistence resource overlap. In
this analysis, we omitted such subsistence resources as trails,
camp, and wood-gathering locations, concentrating only on
food-related categories. Table 3 shows the subsistence catego-
ries that were used in the GIS analysis and associated ranks.
Ranks of ‘‘importance’’ for subsistence resources for each
area of the four villages were combined to identify areas with
high and low ‘‘importance.’’ Each surveyed village identified a
different number of resources and ranks. For example,
Kivalina residents identified five resources (seal, fish, caribou,
berries, sheep) with ranks from one to four while Selawik
identified only three types of resources (fish, caribou, bird eggs)
with ranks from one to three, etc. Using the GIS tool Raster
Calculator, we selected areas with a CVI greater than three
(high and very high vulnerability) and areas where subsistence
resources were ranked 1 and 2 (two highest ranks of
importance). After the selection in GIS, the resulting map
showed areas where high to very high vulnerable coastal
segments coincide with ‘‘important’’ subsistence resources.
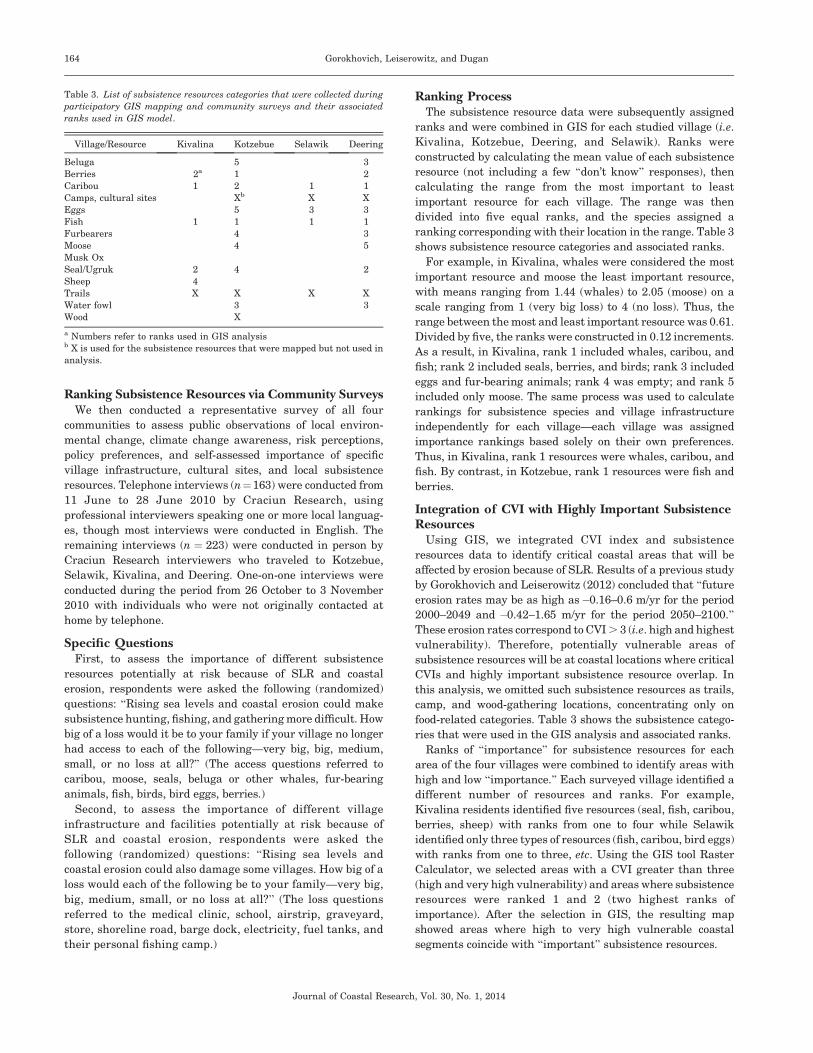
Table 3. List of subsistence resources categories that were collected during
participatory GIS mapping and community surveys and their associated
ranks used in GIS model.
Village/Resource Kivalina Kotzebue Selawik Deering
Beluga 5 3
Berries 2a 1 2
Caribou 1 2 1 1
Camps, cultural sites Xb X X
Eggs 5 3 3
Fish 1 1 1 1
Furbearers 4 3
Moose 4 5
Musk Ox
Seal/Ugruk 2 4 2
Sheep 4
Trails X X X X
Water fowl 3 3
Wood X
a Numbers refer to ranks used in GIS analysisb X is used for the subsistence resources that were mapped but not used in
analysis.
Journal of Coastal Research, Vol. 30, No. 1, 2014
164 Gorokhovich, Leiserowitz, and Dugan
RESULTS AND DISCUSSIONCommunity-Based Participatory GIS Mapping
The list of various subsistence resources that were mapped
by community-based GIS method are in Table 4. Data differ in
terms of number of species per each coastal community and
reflects the results of discussions and meetings with local
hunters and village representatives; therefore, boundaries are
not exact. Because the participatory GIS mapping was
conducted in groups, each boundary was discussed by the
participants and thus has limited, but at least somewhat
controlled, uncertainty. Because hunters/fishermen/gatherers
from different settlements share subsistence resources, the
GIS data have multiple overlaps between shapefiles. In such
cases where these overlaps occur between subsistence resourc-
es categories of the same rank, they ‘‘double’’ the importance of
the subsistence area because they are utilized by people from
two or more settlements.
Ranking of Subsistence Resources and CommunitySurveys
From a census of all available households, 389 (n ¼ 389)
residents were interviewed by telephone or in-person (Table 5).
The Council of American Survey Research Organizations
response rate for the telephone interviews was 63%.
Overall, subsistence resources remain very important to all
four communities, where large proportions of local diets are
still harvested directly from the local environment (Table 5).
Fish was the highest rated subsistence resource in all
communities, except Kivalina, which rated the potential loss
of caribou as ‘‘very big.’’ Kotzebue and Selawik rated fish,
berries, and caribou as their most important resources. Deering
rated fish, caribou, berries, and seals as most important, while
Kivalina rated caribou, then whales, fish, berries, and seals as
most important (a ‘‘very big loss’’). After reflecting on the
geographic, ecological, and cultural differences between these
communities, however, some species were considered more
important by some villages than others. For example, seals and
whales were rated as a more important subsistence species in
Deering and Kivalina (located closer to the ocean) than in
Selawik (located inside a broad delta wetland), which alone
gave a high rating to moose.
Kotzebue considered the airstrip, which provides access to
the outside world, as the single most important facility (a ‘‘very
big loss’’) (Table 6), followed by fuel tanks and electricity.
Selawik considered electricity, fuel tanks, and the airstrip as
their most important facilities. Deering considered electricity,
fuel tanks, the store, the shoreline road, and the school as their
most important facilities (.75% saying these would be ‘‘a very
big loss’’). Finally, Kivalina considered the airstrip, electricity,
and fuel tanks as most important. A crucial point is that all of
these communities are accessible only by airplane, boat, four-
wheel ATVs, or snowmobile, where roads provide limited
access to only the villages or the immediate environs. Access to
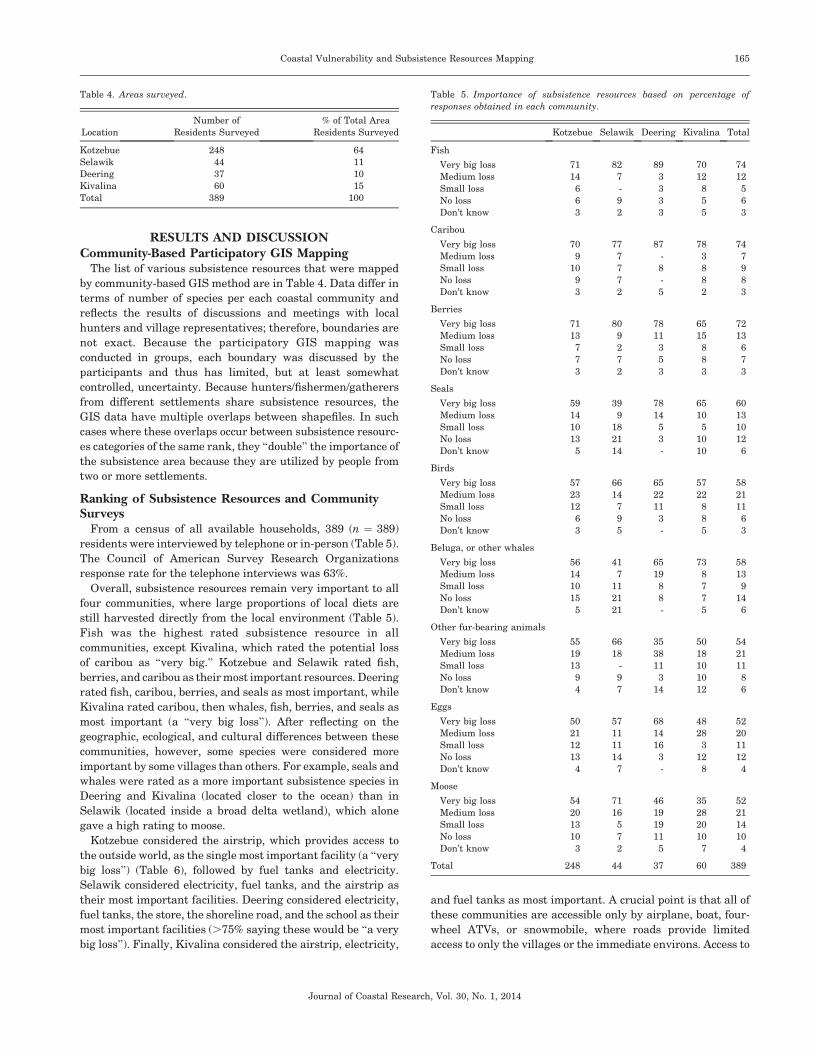
Table 4. Areas surveyed.
Location
Number of
Residents Surveyed
% of Total Area
Residents Surveyed
Kotzebue 248 64
Selawik 44 11
Deering 37 10
Kivalina 60 15
Total 389 100
Table 5. Importance of subsistence resources based on percentage of
responses obtained in each community.
Kotzebue Selawik Deering Kivalina Total
Fish
Very big loss 71 82 89 70 74
Medium loss 14 7 3 12 12
Small loss 6 - 3 8 5
No loss 6 9 3 5 6
Don’t know 3 2 3 5 3
Caribou
Very big loss 70 77 87 78 74
Medium loss 9 7 - 3 7
Small loss 10 7 8 8 9
No loss 9 7 - 8 8
Don’t know 3 2 5 2 3
Berries
Very big loss 71 80 78 65 72
Medium loss 13 9 11 15 13
Small loss 7 2 3 8 6
No loss 7 7 5 8 7
Don’t know 3 2 3 3 3
Seals
Very big loss 59 39 78 65 60
Medium loss 14 9 14 10 13
Small loss 10 18 5 5 10
No loss 13 21 3 10 12
Don’t know 5 14 - 10 6
Birds
Very big loss 57 66 65 57 58
Medium loss 23 14 22 22 21
Small loss 12 7 11 8 11
No loss 6 9 3 8 6
Don’t know 3 5 - 5 3
Beluga, or other whales
Very big loss 56 41 65 73 58
Medium loss 14 7 19 8 13
Small loss 10 11 8 7 9
No loss 15 21 8 7 14
Don’t know 5 21 - 5 6
Other fur-bearing animals
Very big loss 55 66 35 50 54
Medium loss 19 18 38 18 21
Small loss 13 - 11 10 11
No loss 9 9 3 10 8
Don’t know 4 7 14 12 6
Eggs
Very big loss 50 57 68 48 52
Medium loss 21 11 14 28 20
Small loss 12 11 16 3 11
No loss 13 14 3 12 12
Don’t know 4 7 - 8 4
Moose
Very big loss 54 71 46 35 52
Medium loss 20 16 19 28 21
Small loss 13 5 19 20 14
No loss 10 7 11 10 10
Don’t know 3 2 5 7 4
Total 248 44 37 60 389
Journal of Coastal Research, Vol. 30, No. 1, 2014
Coastal Vulnerability and Subsistence Resources Mapping 165
energy, as represented by the local fuel tanks and electricity,
were consistently rated highly.
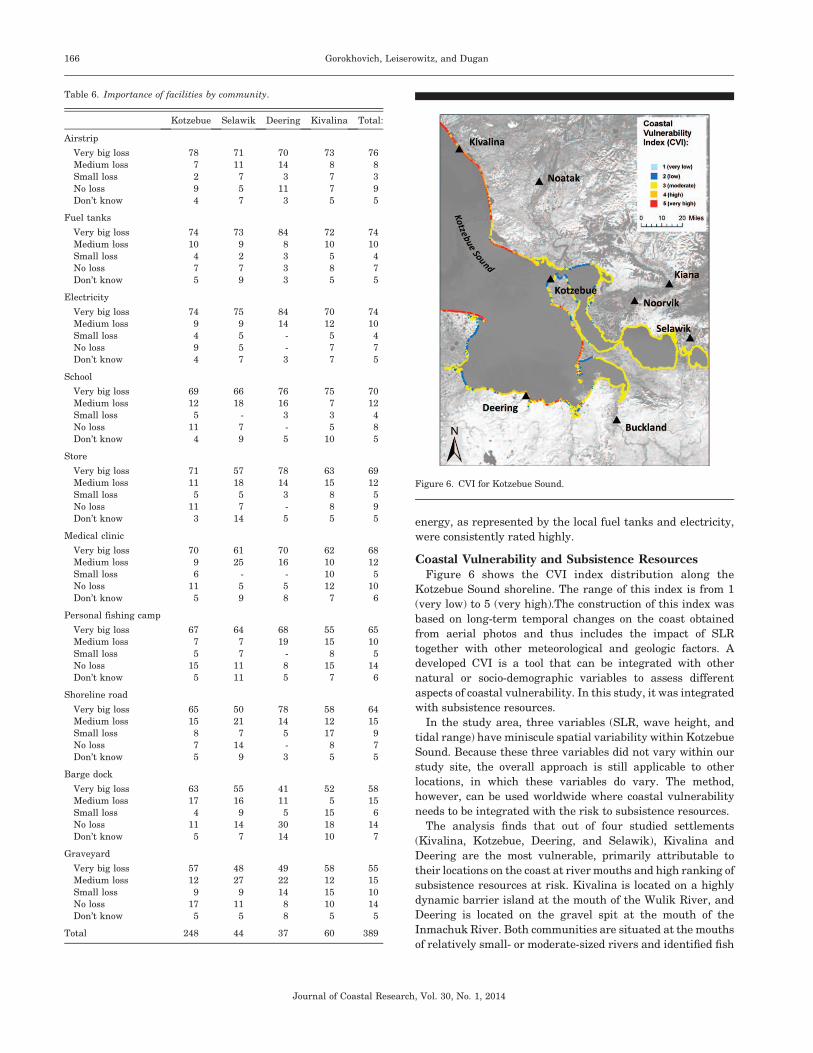
Coastal Vulnerability and Subsistence ResourcesFigure 6 shows the CVI index distribution along the
Kotzebue Sound shoreline. The range of this index is from 1
(very low) to 5 (very high).The construction of this index was
based on long-term temporal changes on the coast obtained
from aerial photos and thus includes the impact of SLR
together with other meteorological and geologic factors. A
developed CVI is a tool that can be integrated with other
natural or socio-demographic variables to assess different
aspects of coastal vulnerability. In this study, it was integrated
with subsistence resources.
In the study area, three variables (SLR, wave height, and
tidal range) have miniscule spatial variability within Kotzebue
Sound. Because these three variables did not vary within our
study site, the overall approach is still applicable to other
locations, in which these variables do vary. The method,
however, can be used worldwide where coastal vulnerability
needs to be integrated with the risk to subsistence resources.
The analysis finds that out of four studied settlements
(Kivalina, Kotzebue, Deering, and Selawik), Kivalina and
Deering are the most vulnerable, primarily attributable to
their locations on the coast at river mouths and high ranking of
subsistence resources at risk. Kivalina is located on a highly
dynamic barrier island at the mouth of the Wulik River, and
Deering is located on the gravel spit at the mouth of the
Inmachuk River. Both communities are situated at the mouths
of relatively small- or moderate-sized rivers and identified fish
Table 6. Importance of facilities by community.
Kotzebue Selawik Deering Kivalina Total:
Airstrip
Very big loss 78 71 70 73 76
Medium loss 7 11 14 8 8
Small loss 2 7 3 7 3
No loss 9 5 11 7 9
Don’t know 4 7 3 5 5
Fuel tanks
Very big loss 74 73 84 72 74
Medium loss 10 9 8 10 10
Small loss 4 2 3 5 4
No loss 7 7 3 8 7
Don’t know 5 9 3 5 5
Electricity
Very big loss 74 75 84 70 74
Medium loss 9 9 14 12 10
Small loss 4 5 - 5 4
No loss 9 5 - 7 7
Don’t know 4 7 3 7 5
School
Very big loss 69 66 76 75 70
Medium loss 12 18 16 7 12
Small loss 5 - 3 3 4
No loss 11 7 - 5 8
Don’t know 4 9 5 10 5
Store
Very big loss 71 57 78 63 69
Medium loss 11 18 14 15 12
Small loss 5 5 3 8 5
No loss 11 7 - 8 9
Don’t know 3 14 5 5 5
Medical clinic
Very big loss 70 61 70 62 68
Medium loss 9 25 16 10 12
Small loss 6 - - 10 5
No loss 11 5 5 12 10
Don’t know 5 9 8 7 6
Personal fishing camp
Very big loss 67 64 68 55 65
Medium loss 7 7 19 15 10
Small loss 5 7 - 8 5
No loss 15 11 8 15 14
Don’t know 5 11 5 7 6
Shoreline road
Very big loss 65 50 78 58 64
Medium loss 15 21 14 12 15
Small loss 8 7 5 17 9
No loss 7 14 - 8 7
Don’t know 5 9 3 5 5
Barge dock
Very big loss 63 55 41 52 58
Medium loss 17 16 11 5 15
Small loss 4 9 5 15 6
No loss 11 14 30 18 14
Don’t know 5 7 14 10 7
Graveyard
Very big loss 57 48 49 58 55
Medium loss 12 27 22 12 15
Small loss 9 9 14 15 10
No loss 17 11 8 10 14
Don’t know 5 5 8 5 5
Total 248 44 37 60 389
Figure 6. CVI for Kotzebue Sound.
Journal of Coastal Research, Vol. 30, No. 1, 2014
166 Gorokhovich, Leiserowitz, and Dugan
and caribou as their primary subsistence resource (Table 6).
Future coastal dynamics in both locations will most likely lead
to substantial ecological changes. While the exact times and
places where these changes will occur and how ecosystems and
key subsistence resources will respond are difficult to predict,
the changes will undoubtedly occur.
The combination of the number of subsistence resources
species from surveys for each village can serve only as a proxy
of the ‘‘richness’’ or ‘‘abundance’’ of subsistence resources.
There are many other scientifically based ecological indicators
such as vegetation density, spatial distribution of species,
fragmentation, etc. Moreover, subsistence resource data were
used in the analysis as ‘‘thematic maps’’ that lack spatial
variability. Spatial variability is difficult to collect with highly
dynamic and changing subsistence resources, especially fish
and caribou. GIS analysis, however, can provide useful
information for the preliminary interpretation of results by
combining maps of critical CVI and subsistence resources.
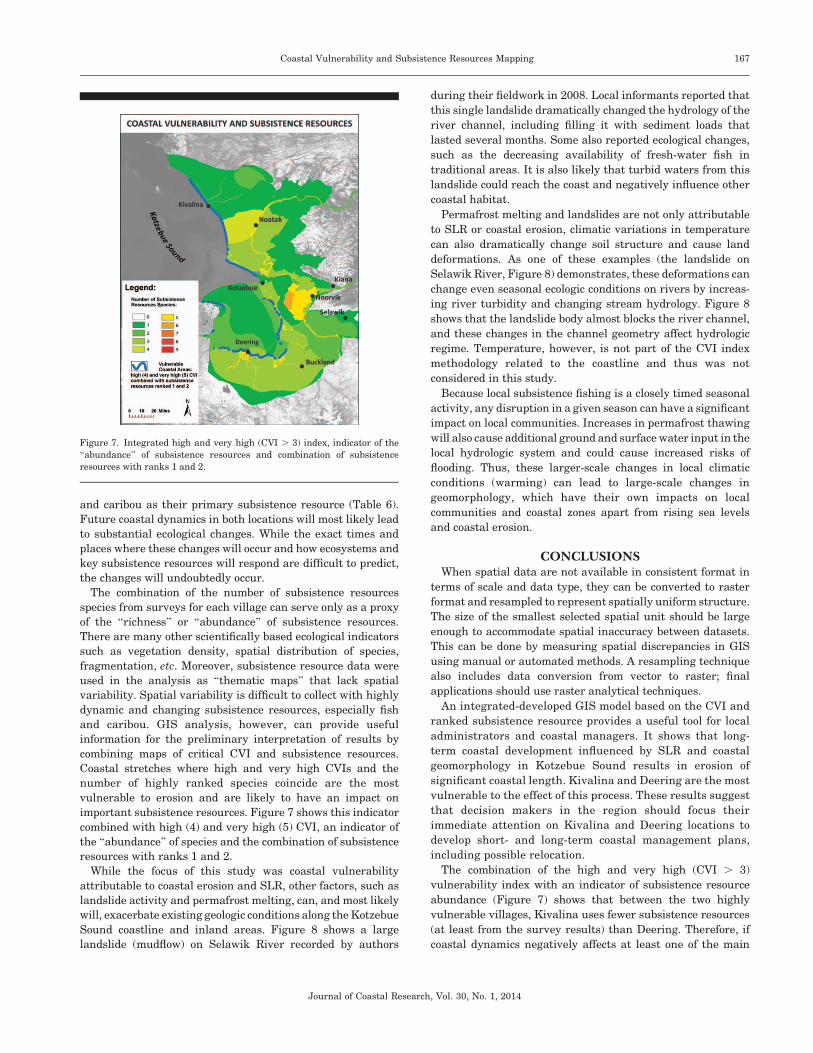
Coastal stretches where high and very high CVIs and the
number of highly ranked species coincide are the most
vulnerable to erosion and are likely to have an impact on
important subsistence resources. Figure 7 shows this indicator
combined with high (4) and very high (5) CVI, an indicator of
the ‘‘abundance’’ of species and the combination of subsistence
resources with ranks 1 and 2.
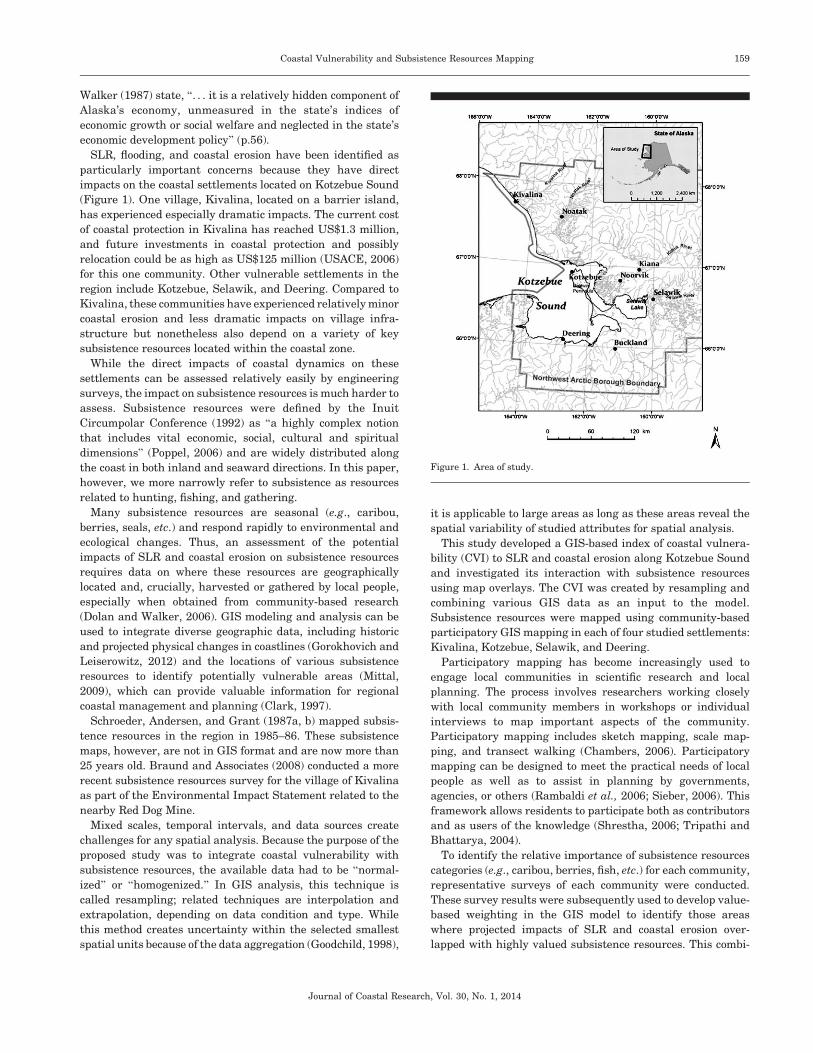
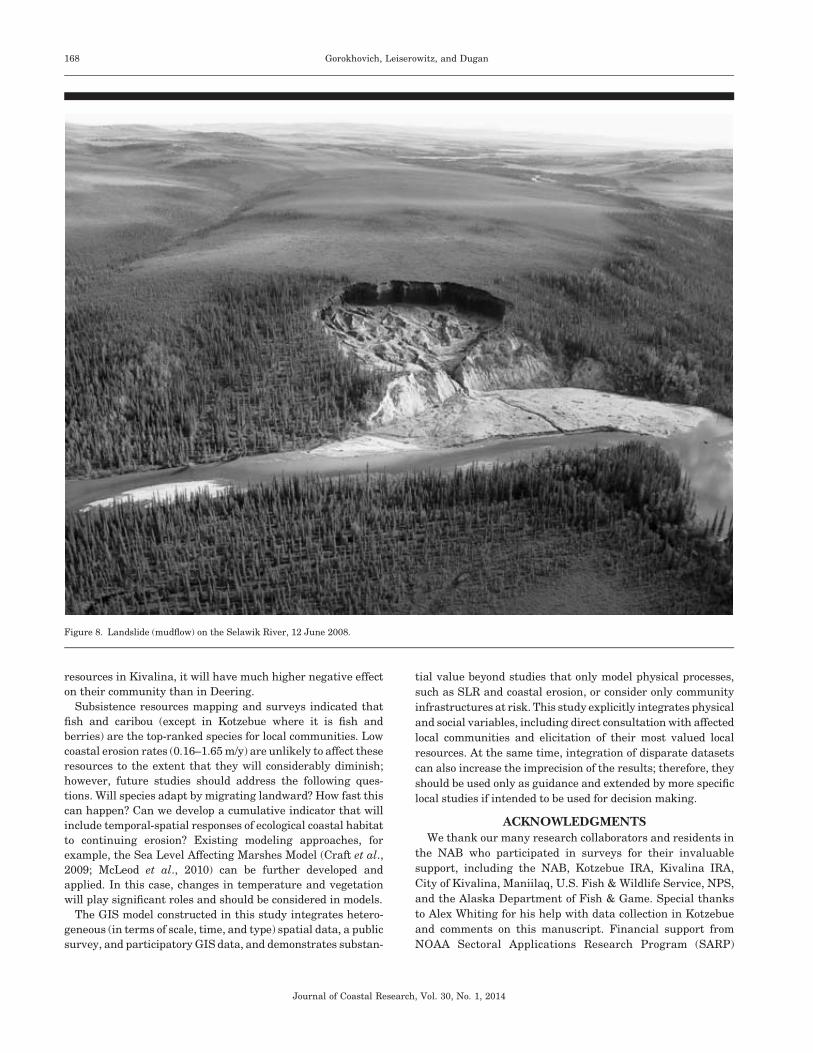
While the focus of this study was coastal vulnerability
attributable to coastal erosion and SLR, other factors, such as
landslide activity and permafrost melting, can, and most likely
will, exacerbate existing geologic conditions along the Kotzebue
Sound coastline and inland areas. Figure 8 shows a large
landslide (mudflow) on Selawik River recorded by authors
during their fieldwork in 2008. Local informants reported that
this single landslide dramatically changed the hydrology of the
river channel, including filling it with sediment loads that
lasted several months. Some also reported ecological changes,
such as the decreasing availability of fresh-water fish in
traditional areas. It is also likely that turbid waters from this
landslide could reach the coast and negatively influence other
coastal habitat.
Permafrost melting and landslides are not only attributable
to SLR or coastal erosion, climatic variations in temperature
can also dramatically change soil structure and cause land
deformations. As one of these examples (the landslide on
Selawik River, Figure 8) demonstrates, these deformations can
change even seasonal ecologic conditions on rivers by increas-
ing river turbidity and changing stream hydrology. Figure 8
shows that the landslide body almost blocks the river channel,
and these changes in the channel geometry affect hydrologic
regime. Temperature, however, is not part of the CVI index
methodology related to the coastline and thus was not
considered in this study.
Because local subsistence fishing is a closely timed seasonal
activity, any disruption in a given season can have a significant
impact on local communities. Increases in permafrost thawing
will also cause additional ground and surface water input in the
local hydrologic system and could cause increased risks of
flooding. Thus, these larger-scale changes in local climatic
conditions (warming) can lead to large-scale changes in
geomorphology, which have their own impacts on local
communities and coastal zones apart from rising sea levels
and coastal erosion.
CONCLUSIONSWhen spatial data are not available in consistent format in
terms of scale and data type, they can be converted to raster
format and resampled to represent spatially uniform structure.
The size of the smallest selected spatial unit should be large
enough to accommodate spatial inaccuracy between datasets.
This can be done by measuring spatial discrepancies in GIS
using manual or automated methods. A resampling technique
also includes data conversion from vector to raster; final
applications should use raster analytical techniques.
An integrated-developed GIS model based on the CVI and
ranked subsistence resource provides a useful tool for local
administrators and coastal managers. It shows that long-
term coastal development influenced by SLR and coastal
geomorphology in Kotzebue Sound results in erosion of
significant coastal length. Kivalina and Deering are the most
vulnerable to the effect of this process. These results suggest
that decision makers in the region should focus their
immediate attention on Kivalina and Deering locations to
develop short- and long-term coastal management plans,
including possible relocation.
The combination of the high and very high (CVI . 3)
vulnerability index with an indicator of subsistence resource
abundance (Figure 7) shows that between the two highly
vulnerable villages, Kivalina uses fewer subsistence resources
(at least from the survey results) than Deering. Therefore, if
coastal dynamics negatively affects at least one of the main
Figure 7. Integrated high and very high (CVI . 3) index, indicator of the
‘‘abundance’’ of subsistence resources and combination of subsistence
resources with ranks 1 and 2.
Journal of Coastal Research, Vol. 30, No. 1, 2014
Coastal Vulnerability and Subsistence Resources Mapping 167
resources in Kivalina, it will have much higher negative effect
on their community than in Deering.
Subsistence resources mapping and surveys indicated that
fish and caribou (except in Kotzebue where it is fish and
berries) are the top-ranked species for local communities. Low
coastal erosion rates (0.16–1.65 m/y) are unlikely to affect these
resources to the extent that they will considerably diminish;
however, future studies should address the following ques-
tions. Will species adapt by migrating landward? How fast this
can happen? Can we develop a cumulative indicator that will
include temporal-spatial responses of ecological coastal habitat
to continuing erosion? Existing modeling approaches, for
example, the Sea Level Affecting Marshes Model (Craft et al.,
2009; McLeod et al., 2010) can be further developed and
applied. In this case, changes in temperature and vegetation
will play significant roles and should be considered in models.
The GIS model constructed in this study integrates hetero-
geneous (in terms of scale, time, and type) spatial data, a public
survey, and participatory GIS data, and demonstrates substan-
tial value beyond studies that only model physical processes,
such as SLR and coastal erosion, or consider only community
infrastructures at risk. This study explicitly integrates physical
and social variables, including direct consultation with affected
local communities and elicitation of their most valued local
resources. At the same time, integration of disparate datasets
can also increase the imprecision of the results; therefore, they
should be used only as guidance and extended by more specific
local studies if intended to be used for decision making.
ACKNOWLEDGMENTSWe thank our many research collaborators and residents in
the NAB who participated in surveys for their invaluable
support, including the NAB, Kotzebue IRA, Kivalina IRA,
City of Kivalina, Maniilaq, U.S. Fish & Wildlife Service, NPS,
and the Alaska Department of Fish & Game. Special thanks
to Alex Whiting for his help with data collection in Kotzebue
and comments on this manuscript. Financial support from
NOAA Sectoral Applications Research Program (SARP)
Figure 8. Landslide (mudflow) on the Selawik River, 12 June 2008.
Journal of Coastal Research, Vol. 30, No. 1, 2014
168 Gorokhovich, Leiserowitz, and Dugan
helped in the collection, analysis, and interpretation of data.
Three anonymous reviewers made considerable improve-
ments to the final manuscript.
LITERATURE CITEDBoruff, B.J.; Emrich, C., and Cutter, S., 2005. Erosion hazard
vulnerability of US coastal counties. Journal of Coastal Research,21(5), 932–942.
Braund, R. and Associates, 2008. Pre-mine subsistence use areasKivalina. Maps 1–17. In: Red Dog Mine Extension, Aqqaluk Project,Draft Supplemental Environmental Impact Statement, Vol. 2,Appendices.
Chambers, R., 2006. Participatory mapping and Geographic Infor-mation Systems: Whose map? Who is empowered and whodisempowered? Who gains and who loses? Electronic Journal onInformation Systems in Developing Countries, 25(2).
Clark, J.R., 1997. Coastal zone management for the new century.Ocean and Coastal Management, 37(2), 191–216.
Craft, C.; Clough, J.; Ehman, J.; Joye, S.; Park, R.; Pennings, S.; Guo,H., and Machmuller, M., 2009. Forecasting the effects of acceler-ated sea-level rise on tidal marsh ecosystem services. Frontiers inEcology and the Environment, 7(2009), 73–78.
Diez, P.G.; Perillo, G.M.E., and Piccolo, M.C., 2007. Vulnerability tosea-level rise on the coast of the Buenos Aires Province. Journal ofCoastal Research, 23(1), 119–126.
Dolan, A.H. and Walker, I.J., 2006.Understanding vulnerability ofcoastal communities to climate change related risks. In: Klein,A.H.F. and Finkl, C.W. (eds.), Proceedings of the 8th InternationalCoastal Symposium, Journal of Coastal Research, Special Issue No.39, pp. 1316–1323.
ESRI. ArcGIS Resource Center, 2013. http://help.arcgis.com/en/arcg isdesktop /10 .0 /he lp / index .html#/Zonal_Stat is t i cs /009z000000w7000000/.
Goodchild, M.F., 1998. Uncertainty: the Achilles heel of GIS? Geo InfoSystems, 8(11), 40–42.
Gornitz, V. and Kanciruk, P., 1989. Assessment of global coastalhazards from sea-level rise. In: Proceedings of the Sixth Sympo-sium on Coastal and Ocean Management ASCE (Charleston, SC,ASCE), pp. 1345–1359.
Gorokhovich, Y. and Leiserowitz, A., 2012. Historical and futurecoastal changes in Northwest Alaska. Journal of Coastal Research,28(1A), 174–186.
Hegde, A.V. and Reju, V.R., 2007. Development of coastal vulnera-bility index for Mangalore Coast, India. Journal of CoastalResearch, 23(5), 1106–1111.
Hinzman, L.; Bettez, N.; Bolton, W.; Chapin, F.; Dyurgerov, M., andFastie, C., 2005. Evidence and implications of recent climatechange in northern Alaska and other arctic regions. ClimaticChange, 72(3), 251–298.
Hughes, P. and Brundrit, G.B., 1992. An index to assess SouthAfrica’s vulnerability to sea-level rise. South African Journal ofScience, 88(6), 308–311.
Huntington, H. and Fox, S., 2005. The changing Arctic: Indigenousperspectives. In: A. M. a. A. Program (ed.), Impacts of a WarmingClimate—Arctic Climate Impact Assessment. Cambridge: Cam-bridge University, pp. 61–98.
Inuit Circumpolar Council, 1992. Principles and Elements for aComprehensive Arctic Policy. Proceedings of the Inuit CircumpolarConference (Inuvik, Canada), 185p.
Magdanz, J.; Utermole, C., and Wolfe, R., 2002. The Production andDistribution of Wild Food in Wales and Deering Alaska (No. 259).Juneau, Alaska: Alaska Department of Fish and Game: Division ofSubsistence, 128p.
McLeod, E.; Poulter, B.; Hinkel, J.; Reyes, E., and Salm, R., 2010. Sea-level rise impact models and environmental conservation: a reviewof models and their applications. Ocean & Coastal Management,53(9), 507–517.
Mittal, A.K., 2009. Alaska Native Villages: Limited Progress HasBeen Made on Relocating Villages Threatened by Flooding andErosion. Report to Congressional Requesters. GAO-09-551.
National Oceanic and Atmospheric Administration (NOAA),2011a.http://www.ngdc.noaa.gov/mgg/bathymetry/maps/maptypes.html. NOAA, 2011b. http://response.restoration.noaa.gov/esi.
Ozyurt, G. and Ergin, A., 2009. Application of sea level risevulnerability assessment model to selected coastal areas of Turkey.Proceedings of the 10th International Coastal Symposium ICS2009. Journal of Coastal Research, Special Issue No. 56, pp. 248–251.
Poppel, B., 2006. Interdependency of subsistence and marketeconomies in the Arctic. In: Glomsrd, S. and Aslaksen, J. (eds.),The Economy of the North. Statistics Norway, pp. 65–80.
Rambaldi, G.; Chambers, R.; McCall, M., and Fox, J., 2006. Practicalethics for PGIS practitioners, facilitators, technology intermediar-ies and researchers. Participatory Learning Action, 54, 106.
Schroeder, R.; Andersen, D.B., and Grant, H., 1987a. Subsistence usearea mapping in ten Kotzebue Sound communities (No. 130).Kotzebue: Alaska Department of Fish and Game, Division ofSubsistence and Maniilaq Association.
Schroeder, R.; Andersen, D.B., and Grant, H., 1987b. Subsistence usearea map atlas for ten Kotzebue Sound communities. ManiilaqAssociation and Division of Subsistence, Alaska Department of Fishand Game, Juneau, Alaska.
Shaw, J.; Taylor, R.B.; Forbes, D.L.; Ruz, M.H., and Solomon, S.,1998. Sensitivity of the Canadian coast to sea-level rise. GeologicalSurvey of Canada Bulletin, 505, 1–114.
Shrestha, H.L., 2006. Using global positioning systems (GPS) andgeographic information systems (GIS) in participatory mapping ofcommunity forest in Nepal. Electronic Journal on InformationSystems in Developing Countries, 25(5), 1–11.
Sieber, R., 2006. Public participation geographic information systems:a literature review and framework. Annals of the Association ofAmerican Geographers, 93(3), 491.
Thieler, E.R. and Hammar-Klose, E.S., 1999. National Assessment ofCoastal Vulnerability to Future Sea-Level Rise: PreliminaryResults for the U.S. Atlantic Coast. U.S. Geological Survey,Open-File Report 99-593.
Thieler, E.R. and Hammar-Klose, E.S., 2000a. National Assessmentof Coastal Vulnerability to Future Sea-Level Rise: PreliminaryResults for the U.S. Pacific Coast. U.S. Geological Survey, Open-File Report 00–178.
Thieler, E.R. and Hammar-Klose, E.S., 2000b. National Assessmentof Coastal Vulnerability to Future Sea-Level Rise: PreliminaryResults for the U.S. Gulf of Mexico Coast. U.S. Geological Survey,Open-File Report 00–179.
Thieler, E.R.; Himmelstoss, E.A.; Zichichi, J.L., and Miller, T.L.,2005. Digital Shoreline Analysis System (DSAS) version 3.0: AnArcGIS� extension for calculating shoreline change. U.S. Geolog-ical Survey Open-File Report 2005-1304.
Tripathi, N. and Bhattarya, S., 2004. Integrating indigenousknowledge and GIS for participatory natural resource manage-ment: state-of-the-practice. Journal on Information Systems inDeveloping Countries, 17(3), 1–13.
U.S. Army Corps of Engineers (USACE). 2006. Alaska Village ErosionTechnical Assistance Program. An Examination of Erosion Issuesin the Communities of Bethel, Dillingham, Kaktovik, Kivalina,Newtok, Shishmaref, and Unalakleet. Alaska District.
Whiting, A., 2006. Native Village of Kotzebue Harvest Survey Program2002–2003–2004: Results of Three Consecutive Years Cooperatingwith Qikiqtagrugmiut to Understand their Annual Catch ofSelected Fish and Wildlife. Kotzebue: Native Village of Kotzebue.
Wolfe, R., 2004. Local Traditions and Subsistence: A Synopsis of 25Years of Research by the State of Alaska (No. 284). Juneau, Alaska:Alaska Department of Fish and Game: Division of Subsistence, pp.1–81.
Wolfe, R.J. and Walker, R.J., 1987. Subsistence economies in Alaska:productivity, geography, and development impacts. Arctic Anthro-pology, 24(2), 56–81.
Journal of Coastal Research, Vol. 30, No. 1, 2014
Coastal Vulnerability and Subsistence Resources Mapping 169