Embed Size (px)
Citation preview

AGRICULTURAL MECHANIZATION IN ASIA, AFRICA, AND LATIN AMERICA 2016 VOL.47 NO.4
VO
L.48, NO
.4, AU
TUM
N 2017
VOL.48, No.4, AUTUMN 2017
ISSN 0084-5841

AGRICULTURAL MECHANIZATION IN ASIA, AFRICA, AND LATIN AMERICA 2017 VOL.48 NO.4

VOL.48, No.4, AUTUMN 2017

Yoshisuke Kishida, Publisher & Chief EditorContributing Editors and Cooperators
EDITORIAL STAFF(Tel.+81-(0)3-3291-3674)
Yoshisuke Kishida, Chief EditorHaruna Iwase, Managing Editor
R. Lal Kushwaha, Editorial Consultant
ADVERTISING(Tel.+81-(0)3-3291-3674)
Yuki Komori, Director (Head Office)Advertising Rate: 300 thousand yen per page
CIRCULATION(Tel.+81-(0)3-3291-3674)(Fax.+81-(0)3-3291-5717)
Editorial, Advertising and Circulation Headquarters1-12-3, Kanda Nishikicho, Chiyoda-ku, Tokyo 101-0054, Japan
URL: http://www.shin-norin.co.jp/english/E-Mail: [email protected]
Copylight © 2017 byFARM MACHINERY INDUSTRIAL RESEACH CORP.
in SHIN-NORINSHA Co., LtdPrinted in Japan
This is the 173th issue since its maiden issue in the Spring of 1971
AFRICAKayombo, Benedict (Botswana)Fonteh, Fru Mathias (Cameroon)Ndindeng, Sali Atanga (Cote d’Ivoire)Abdallah, Said Elshahat (Egypt)El Behery, A. A. K. (Egypt)Addo, Ahmad (Ghana)Bani, Richard Jinks (Ghana)Djokoto, Israel Kofi (Ghana)Some, D. Kimutaiarap (Kenya)Gitau, Ayub N. (Kenya)Houmy, Karim (Morocco)Oyelade, O. A. (Nigeria)Bindir, Umar B. (Nigeria)Igbeka, Joseph C. (Nigeria)Odigboh, E. U. (Nigeria)Oni, Kayode C. (Nigeria)Opara, U. L. (South Africa)Kuyembeh, N. G. (Sierra Leone)Abdoun, Abdien Hassan (Sudan)Saeed, Amir Bakheit (Sudan)Khatibu, Abdisalam I. (Tanzania)Tembo, Solomon (Zimbabwe)
AMERICASCetrangolo, Hugo Alfredo (Argentina)Nääs, Irenilza de Alencar (Brazil)Ghaly, Abdelkader E. (Canada)Hetz, Edmundo J. (Chile)Roudergue, Marco Antonio Lopez (Chile) Aguirre, Roberto (Colombia)Ulloa-Torres, Omar (Costa Rica)Mesa, Yanoy Morejón (Cuba)Rondon, Pedro Paneque (Cuba)Luna-Maldonado, A. I. (Mexico)Magaña, S. G. Campos (Mexico)Ortiz-Laurel, H. (Mexico)Bora, C. Ganesh (U.S.A.)Goyal, Megh Raj (U.S.A.)Mahapatra, Ajit K. (U.S.A.)
ASIA and OCEANIAFarouk, Shah M. (Bangladesh)Hussain, Daulat (Bangladesh)Mazed, M. A. (Bangladesh)Ali, Rostom (Bangladesh)Wangchen, Chetem (Bhutan)Basunia, M. A. (Brunei)Shujun, Li (China)Ilyas, S. M. (India)Kulkarni, S. D. (India)Mani Indra (India)
Mehta, C. R. (India)Michael, A. M. (India)Nath, Surya (U.S.A.)Pathak, B. S. (India)Salokhe, Vilas M. (India)Singh, Gajendra (India)Verma, S. R. (India)Abdullah, Kamaruddin (Indonesia)Behroozi-Lar, Mansoor (Iran)3Minaei, Saeid (Iran)Abdul-Munaim, Ali Mazin (Iraq)Hasegawa, Hideo (Japan)Snobar, Bassam A. (Jordan)Chung, Jong Hoon (Korea)Lee, In-Bok (Korea)Bardaie, Muhamad Zohadie (Malaysia)Gonchigdorj, Enkhbayar (Mongolia)Pariyar, Madan P. (Nepal)Jayasuriya, Hemanatha P. W. (Oman)Khan, Alamgir A. (Pakistan)Mughal, A. Q. A. (Pakistan)Mirjat, Muhammad Saffar (Pakistan)Abu-Khalaf, Nawaf A. (Palestine)Lantin, Reynaldo M. (Philippines)Venturina, Ricardo P. (Philippines)Al-suhaibani, Saleh Abdulrahman (Saudi Arabia)Al-Amri, Ali Mufarreh Saleh (Saudi Arabia)Illangantileke, S. G. (Sri Lanka)Chang, Sen-Fuh (Taiwan)Chen, Suming (Taiwan) Krishnasreni, Suraweth (Thailand)Phongsupasamit, Surin (Thailand)Senanarong, Akkapol (Thailand)Soni, Peeyush (Thailand)Ertekin, Can (Turkey)Haffar, Imad (United Arab Emirates)Hay, Nguyen (Viet Nam)Lang, Pham Van (Viet Nam)
EUROPEKatardjiev, Tihomir Hristov (Bulgaria)Kic, Pavel (Czech)Müller, Joachim (Germany)Ferentinos, Konstantinos P. (Greece)Sigrimis, Nick (Greece)Gasparertto, Ettore (Itaty)Hoogmoed, W. B. (Netherlands)Pawlak, Jan (Poland)Marchenko, Oleg S. (Russia)Martinov, Milan (Serbia)Jaime, Ortiz-Cañavate (Spain)Sims, Brain G. (U.K.)

EDITORIAL
Yoshisuke KishidaChief EditorOctober, 2017
According to the latest estimation by United Nation, the world population will amount to 9.7 billion by 2050. In that case, we have to increase food production by 0.5 times. We did it by 3 times in 50 years during 1960-2012. This was enabled by new technology, genetic engineering, use of fertilizer, development of agricultural machinery, wide spread of irriga-tion etc. Farmland has increased by 49 ha, but woodland has decreased by 50% in 20 years from 1997. This means 0.1 billion ha of woodland was lost. We can’t expand farmland any more to increase food production. If we sacrifice woodland for farmland, it would cause depletion of water resource and climate change. Besides, it would severely affect life sys-tem including microorganisms. Currently 70% of total use of fresh water is for agriculture. A number of regions, such as a part of China, suffer a decrease of water volume in rivers. There’re cases in which a river dries up during certain season.
Furthermore, we have to increase food production by more than 110% in the region of Africa to the south of the Sahara Desert and South Asia. Renewal energy is in high demand all over the world nowadays. Especially biomass energy is getting to be an essential energy source. Sugar cane and corn got to be a new renewable energy as well as wood. Limited amount of agricultural production is now sought for both energy use and food use. There could transpire the need to regulate the amount of biomass energy use in the long run. Ac-cording to the latest estimation, average temperature in the world could increase by 4.5°C at the worst. As it was 2.0°C in the past, the situation is getting worse. A part of permafrost dissolved that resulted in forming a big hole in Siberia. Methane gas started to leak from this hole. It increases in speeding up the global warming. To increase food production in such situations, it is necessary to advance the genetic engineered plant tolerant to global warming, further spread of irrigation system and development of agricultural machinery which enables precision farming in volatile weather. Due to adaption of new technology, it can be presumed that robotization would rapidly advance in the field of agricultural ma-chinery. Like smartphones are commonly used by people in the developing countries, agri-cultural robots must be used by farmers in the developing countries.

Yoshisuke Kishida
R. K. Tiwari, S. K. Chauhan
Joseph C. Adama
J. C. Adama, C. O. Akubuo
K. P. Singh, Rahul R. Potdar, K. N. Agrawal, P. S. Tiwari, Smrutilipi Hota
ME Haque, RW Bell, AKMS IslamKD Sayre, MM Hossain
V. Eyarkai Nambi, R.K.GuptaR. K. Viswakarma, R. A. Kausik
R. C. Solanki, S. N. Naik, S. SantoshA. P. Srivastava, S. P. Singh
Olaoye, Joshua OlanrewajuOlotu, Funke Bosede
V P Chaudhary, Monalisha Parmanik, Anurag Patel
Smrutilipi Hota, J. N. MishraS. K. Mohanty, Abhijit Khadatkar
T. Seerangurayar, B. ShridarR. Kavitha, A. Manickavasagan
M. Alam, A. KunduM. A. Haque, M. S. Huda
5
7
13
18
24
33
38
45
52
62
71
76
82
88
Editorial
Farm Mechanization Strategy for Promotion of Animal Drawn Im-proved Farm Equipment in Nagaland State of India
Available Resources for Farm Mechanization in Two Urban Areas of Enugu State of Nigeria
A Cost Analysis Model for Agricultural Bush Clearing Machinery
Effect of Moisture Content on Physical Properties of Finger (Ele-usine coracana) Millet
An Innovative Versatile Multi-crop Planter for Crop Establishment Using Two-wheel Tractors
Development of Pneumatic Assisted Electronically Controlled Au-tomatic Custard Apple Pulper
Design, Development and Evaluation of Neem Depulper
Development of A Hydro-Separating Cowpea Dehuller
Effect of Conservation Tillage and Crop Residue Management on Soil Physical Properties and Crop Productivity of Wheat
Design and Development of Pedal Operated Ragi Thresher for Tribal Region of Odisha, India
Performance Evaluation of Power Weeders for Paddy Cultivation in South India
Design and Development of A Pull Type Four Row Urea Super Granule Applicator
ABSTRACTS
CONTENTSAGRICULTURAL MECHANIZATION IN ASIA, AFRICA AND LATIN AMERICA
Vol.48, No.4, Autumn 2017
News ....................................................................92New Co-operating Editors ............................ 61, 70Event Calendar ....................................................92
Subscription Information .................................100Co-operating Editors .................................... 93-96Instructions to AMA Contributors .....................99
★ ★ ★

VOL.48 NO.4 2017 AGRICULTURAL MECHANIZATION IN ASIA, AFRICA AND LATIN AMERICA 7
Farm Mechanization Strategy for Promotion of Animal Drawn Improved Farm Equipment in Nagaland State of India
byR. K. TiwariResearch EngineerAICRP on UAECollege of Agricultural Engineering and Post Har-vest Technology (CAEPHT), [email protected]
S. K. ChauhanAssistant Agril. EngineerAICRP on UAECollege of Agricultural Engineering and Post Har-vest Technology (CAEPHT), [email protected]
AbstractAgriculture is the most important
economic activity in Nagaland. Principal crops include rice, corn, millets, pulses, tobacco, oilseeds and sugarcane. It provides liveli-hood to around 70% population of the state. It has total cultivable are of 721,924 hectares out of which 70% is in the hilly region (up to 2,500) meters and the rest 30% is in the foot hills symbolizing as the rice bowl of the state. Rice is the staple food for most of the people and occupies about 70% of the total cultivated area contributing to about 75% of total food grain output in the state. About 90% land of the state belongs to individuals and the land is divided into small sizes and scattered in different locations. The total livestock were 1.41 million in the Nagaland state of the country. The package of improved equipment can reduce the human drudgery and there will be savings of input under animal based farming system both under terrace farming and jhum cultivation. The cost of package of improved equipment for jhum culti-vation was US$ 291.06. Under ter-race farming without rice, the pack-
age cost of equipment was worked out as $ 783.70 under animal based farming in hills in Nagaland. The equipment package for rainfed rice cultivation in hills was estimated as $ 1,165.227. The requirement of total packages (14,256 no.) will cost $ 9.99 million for mechanizing 5% cultivated area in the hill state un-der animal based farming system through selective mechanization. The total benefits from adoption of improved equipment package in 5% of cultivated area were estimated as $ 6.76 million.
Keywords: Cultivable, Jhum, hu-man drudgery, terrace farming, se-lective mechanization.
IntroductionEleven districts of Nagaland lie
between 93°201 to 95°151 E longi-tude and 25°601 to 26°401 N latitude in the extreme North Eastern end of India and its topography is mostly mountainous. Nagaland encom-passed a total area of 16,579.0 sq km comprising 6.32% area of North East and 0.5% of the total land area of the country. The altitude varies from 25 m at Dimapur to 3,840 m
MSL at Saramati peak (Twensang distr ict). The average height of the hilly terrains is 900-1,200 m MSL. The slope levels of the hilly terrain vary from 40 to 60%. The annual average rainfall of the state is 2,000-3,000 mm with the high-est during June to mid October and the relative humidity from 65 to 90%. The economy of the state is predominantly agriculture-based, 68% population engaged in agricul-ture and allied activities. The total population of the state is 1,980,602 comprising of 1,025,707 males and 954,895 females with sex ratio of 909 and population density of 120 per sq km. The rural population numbering 1,406,861 comprises of 724,595 males and 682,266 females. The agriculture and soil map of Nagaland are shown in Fig. 1 which indicate coverage of rice and other crops and four types of soils (Anon., 2013).
The Gross State Domestic Prod-uct (GSDP) of Nagaland was about ₨ 120.65 billion (US$ 2.0 billion) in 2011-12. Nagaland's GSDP grew at 9.9% compounded annually for a decade, thus more than doubling the per capita income.
Livestock sector contributed 4.8-

AGRICULTURAL MECHANIZATION IN ASIA, AFRICA AND LATIN AMERICA 2017 VOL.48 NO.48
6.6% of the total gross domestic product of India during last decade. The total livestock in north eastern region were 25.138 million. In north eastern region of country there is tremendous scope of organic farm-ing due to availability of 7.33 mil-lion tonnes of dung annually from 3 million cattle, 0.16 million buffaloes and 16,000 horses, ponies and yaks (Census, 2011).
Farmers practice two forms of diversified traditional agriculture, viz. the Jhum (Shifting Cultivation) System and Terrace Rice Cultiva-tion (TRC). The jhum cultivation is a traditional method of cultivation pursued by farmers. The jhum cycle normally ranges between six and
ten years depending upon the area held by farmers. Area under jhum cultivation was 90,940 hectares as compared to 83,330 hectares under TRC in 2009. There are four distinct agro climatic zones, viz. High hills, Low hills, Foot hills and Plain ar-eas, each having specific cropping patterns. By and large, rice is the principal crop grown in all zones, mostly as single crop and some-times with other crops viz. maize, millets and vegetables. Farmers raise a number of crops, viz. i. Cere-als (rice, maize, sorghum, millets, wheat, barley and oat), ii. Pulses (ar-har, urad, cowpea, beans, rajmah, horse gram, pea and lentil), iii. Oil seeds (groundnut, soybean, castor, sesamum, sunflower, rapeseed and mustard), and iv. Commercial crops (sugarcane, cotton, jute, mesta, potato, tea, tapioca and colocossia) during the Kharif and Rabi seasons. While 90% of cereals and com-mercial crops are raised during the Kharif season about 55% of pulses and oilseed crops are raised during the Rabi season. The productivity of crops grown in Kharif is higher than that in Rabi (Yojana, 2012).
During the last decade, the crop-ping intensity remained constant at about 110%. The maximum num-bers of farmers (19,668) were found in Kohima district and maximum total land holding area was found in Phek district among all eleven dis-tricts of Nagaland.
The mechanization of agriculture has been poor because of the nature of the terrain in the state and the low purchasing power of the farm-ers. The consumption of fertilizers and pesticide has not been uniform
and almost negligible. Farm opera-tions like ploughing to harvesting are done with local farm tools like dao, spade etc. People are less aware of the improved implements for various farm operations. Some parts of the district like Kikruma Village use power tiller as a main imple-ment for ploughing. Post harvest management for storage of grains and pulses are practiced tradition-ally in locally made bamboo mat bin with one side hollow wooden plank. Paddy is the main crop and tradi-tionally after harvesting of paddy, it is dried and kept in a Local bamboo storage bin, one end sealed hollow wooden storage bin and gunny bags. Local Bamboo storage bins made up of bamboo mat weaved cylindri-cal and conical opening on the top with a separate cover are made from thick wooden trunk with a diameter of 1 to 1.30 m and a length of 1 to 1.5 m.
Materials and MethodsThe traditional form of shifting
cultivation i.e. jhum, is the method of cultivation that is widely prac-ticed across Nagaland. Jhum oc-cupies about 90% of the area under agriculture. Terraced cultivation is confined largely to the districts of Kohima, Dimapur, Tuensang, Peren, Phek and Wokha. The single crop-ping system is prevalent in the state resulting in low cropping intensity.
The total farm power available in the state is 0.336 kW/ha against required power of 1.5 kW/ha. Most of the agriculture operations are performed by using animate power
Fig. 1 Agriculture and soil map of Nagaland (Source: Deptt. of
Agriculture, Govt of Sikkim-India)
Crop Area Production YieldCereals 264.40 531.86 2011Pulses 34.43 36.46 1058Oilseeds 65.84 67.53 1025Commercial crops 29.40 392.17 13339Department of Agriculture, Government of Nagaland
Table 1 Area, Production and Yield of Cereals, Pulses, Oilseeds and Commercial crops during 2010-11 (Area in ‘000 hectares, Production in ‘000 metric tons and
Yield in kg/ha)

VOL.48 NO.4 2017 AGRICULTURAL MECHANIZATION IN ASIA, AFRICA AND LATIN AMERICA 9
sources. The stationary farm power sources, viz irrigation pump and electric motor are commonly used in irrigated area and use of me-chanical mobile farm power sources is negligible. The availability of human power, animal power and mechanical power is 53.1%, 45.9% and 1.0% respectively. Since most of the farm operations in Nagaland are done using animal power; hence, there is a great scope for selective mechanizing in the tribal belt where small hand tools are being used re-sulting in human drudgery (Singh et al., 1996).
About 86% of the cultivable area in Nagaland is under the traditional Jhum and Terrace Rice cultivation system and rest under commercial and other crops. Jhum, is a tradi-tional process that involves clearing a patch of forest land by slash and burn method but retaining useful trees and plant varieties, cultivating it for two to three years and then moving on to the next patch of land. The previously cultivated land is abandoned for 10-20 years to allow the natural forest to grow back and the soil to regain its fertility. The cycle of cultivation, leaving it fallow and coming back to it for cultiva-tion, is called the Jhum cycle.
The crop based data (2010-11) on area and yield of major crops were collected from Department of Ag-riculture, Nagaland which revealed the production of cereal, oilseeds and pulses in Nagaland state. The information on district-wise number of farmers and total area of land-holdings (Census: 2006-07) in each district obtained from NABARD office located at Nagaland was in-strumental to chalk out futuristic approach on package of improved equipment . The cropping pat-tern and problems associated with mechanization were addressed dur-ing interaction meet held at NRC on Mithun, Jharnapani (Nagaland) and strategies were f inalized to mechanize different agricultural operations. For existing practices
being used by farmers were seen by visiting farmers fields in Dimapur and Kohima districts. The improved equipment for rice and maize crop-ping pattern under rainfed farming system were introduced through frontline demonstrations at Krishi Vigyan Kendra. The unit price, out-put capacity, cost of cultivation and command area for improved equip-ment was worked out to calculate the cost of total package. The num-bers of packages for mechanizing 5% of net sown area were worked out considering the actual data col-lected during farm test trials and frontline demonstrations of some improved equipment in the north eastern region in terrace farming for major crops.
The select ive mechanizat ion for potential crops based on ani-mate power sources has scope for introducing suitable small, light weight, higher work rate and low cost equipment. Considering farm mechanization of 5% of the culti-vated area using available proven designs, for potential crops would be enough through development of skill for adoption of improved equipment. Consider ing 1.5 ha command area using animal drawn improved equipment and 1 ha com-mand area for manually operated improved equipment, the benefits to be accrued on the basis of savings in labour, time, cost of operations, inputs savings and reduction in hu-man drudgery were worked out for different agricultural operations in the eight districts of Nagaland which can increase yield from 7 to 10% (Pandey et al., 2006).
Since women in rural region of state constitutes 48.49%, so women friendly improved small hand oper-ated and light weight animal drawn equipment can also be effective to mechanize different agricultural operations. The seedbed prepara-tion requires common equipment for ploughing, puddling, leveling, ridge making etc for all crops sown in the hills under terrace cultivation.
The package of animal based farm-ing for terrace conditions consists of animal drawn improved equip-ment and few manually operated equipment for interculture, harvest-ing and maize shelling operations. Similarly for jhum cultivation, light weight, simple, low cost improved equipment have been incorporated which can be operated by tribals and especially women operators for reducing human drudgery. The package for jhum may be made available individually but package for animal based farming will need skill development of users for their use in terrace condition.
Results and DiscussionIn Nagaland state, the main crops
are rice, millet, maize, and pulses. Cash crops, like sugarcane and po-tato, are also grown in some parts. Plantation crops such as premium coffee, cardamom, and tea are grown in hilly areas in small quantities, but a large growth potential. Most people cultivate rice as the main staple diet of the people. About 80% of the cropped area is dedicated to rice. Oilseeds are another, higher income crop gaining ground in Na-galand. The farm productivity for all crops is low, compared to other Indian states, suggesting significant opportunity for enhancing farmer income. Currently, the Jhum to Ter-raced cultivation ratio is 4:3; where Jhum is local name for cut-and-burn shift farming. Jhum farming is ancient, causes a lot of pollution and soil damage, yet accounts for major-ity of cultivated area. The state does not produce enough food, and de-pends on trade of food from others states of India (Annon., 2011).
The soil manipulation for land preparation and sowing is mini-mum. Generally, no ploughing is done to prepare the field for sowing of the next crop either manually or by any mechanical means. In upland jhum paddy areas, the tillage op-

AGRICULTURAL MECHANIZATION IN ASIA, AFRICA AND LATIN AMERICA 2017 VOL.48 NO.410
erations are adopted in the form of highly reduced, energy saving form of zero tillage. Field preparation and other soil manipulation operations for creation of suitable tilth are not in practice. Land clearing is done by burning of crop residues and other woody and herbaceous plants. The only tillage operation which is be-ing done is during sowing of the crop. In sowing operation, tilling is not done by any plough but by a very indigenous implement known as alluppi or Naga khuraphi. By al-luppi, a small shallow pit is dug at irregular space to make the area for sowing of the seed of upland paddy (Annon., 2013).
The most prevalent method of sowing under upland jhum cultiva-tion is the direct sowing of pre-soaked seed or after some sort of seed priming. As the germination under direct sowing is not up to the desired level, it necessitates go-ing for pre-sowing treatment. The purpose of priming is to reduce the germination time and improve stand and germination percentage. In most of the rice ecosystem of the state, the weeding is mainly done by
manual means. Other than weeding generally no intercultural operation is being done in the paddy field. Ir-rigation management is only done in the wet terrace and Pani Kheti areas and generally no water management is usually done in jhum paddy which depends entirely on natural course of rain water. The cultivars so se-lected are of long duration and crop sown in June-July becomes ready for harvest in month of December -January. Harvesting is done by picking up of mature panicles and leaving straw in the field itself in jhum paddy and in most of the TRC/WTRC field.
As soon as paddy is harvested, deep ploughing is done in the ter-race along with whatever residue weeds and straws present in the field. As the field gets a little dry, soil clods are broken and prepara-tions are made to sow seed potato. Potato is harvested just before the time to puddle and the owner gets some cash income by selling the potatoes. Not only that, the first nor-mal ploughing is averted and also cleaning of the risers and embank-ment operations are done while giv-
ing cultural operations to the potato crop. Residual moisture from paddy crop and a shower that comes in March is sufficient to have a bumper harvest of potato. Tomato seed is broadcasted in the month of Sep-tember as water level in the terraces begins to recede. Paddy stalks are utilized as mulch, as well as support to tomato stems. As the farmer car-ry out the first ploughing operation in the month of February, tomato is harvested. The cost of cultivation for maize, pea, wheat and mustard were US$ 146.153/ha, $ 161.153/ha, $ 156.923/ha and $ 115.384/ha re-spectively under traditional system.
The package of animal based farming system of improved equip-ment consisted of 18 equipment of proven designs suitable for terrace cultivation in Nagaland (Table 2). The command areas of manually operated and animal drawn im-proved equipment were considered as 1 and 1.5 ha, respectively. The command area for motorized wire-loop paddy thresher and multi-crop thresher was taken as 1.5 ha. The effective field capacity of improved equipment for seedbed prepara-
Improved equipment Unit price,US$
Effective field capacity, ha/h
Cost of operation,$/ha
Command area,ha/season
Animal drawn wing plough (size: 200 mm) 15.384 0.02 28.923 1.5Animal drawn improved clod crusher-leveler-planker-puddler (size: 700 mm) 76.923 0.06 27.692 1.5
Animal drawn improved wedge plough (size: 230 mm) 15.384 0.025 24.615 1.5Animal drawn two row improved seed drill (size: 950 mm) 38.461 0.06 8.07 1.5Animal drawn improved potato digger (size:600 mm) 40.769 0.065 18.923 1.5Manual wheel hand hoe (size:210 mm) 15.384 0.01 39.23 1Manual knapsack sprayer 5.384 0.05 23.076 1Manual cono weeder (size: 210 mm) 27.692 0.01 30.769 1Improved sickle 0.923 0.005 73.846 1Tubular maize sheller 0.923 20 kg/h 19.692 1Animal drawn multi-crop planter 100 0.07 11.538 1Motorized wire-loop thresher 153.846 150 kg/h 21.538 1.5Manual 4 row rice transplanter 100 0.02 20.769 1Manual 4 row paddy drum seeder 100 0.03 14.615 11Multi-crop plot thresher (Single phase electric motor, 1 hp) 538.461 125 kg/h 9.23 1.5Manual double screen cleaner 38.461 150 kg/h 7.692 1Grubber weeder with handle 5.384 0.005 73.846 1Naveen dibbler 10 0.028 12.307 1Total 1,165.23
Table 2 Package of improved equipment for animal based farming system under terrace cultivation in Nagaland

VOL.48 NO.4 2017 AGRICULTURAL MECHANIZATION IN ASIA, AFRICA AND LATIN AMERICA 11
tion ranged 0.020-0.060 ha/h. The animal drawn two row improved seed drill, manual rice transplanter and manual rice seeders will serve the purpose in sowing and plant-ing operation and the work output of such equipment ranged 0.020-0.065 ha/h in terrace condition. The intercultural operations can be performed by manual wheel hoe and cono weeders which are capable to perform work ensuring average field capacity of 0.01 ha/h. For potato harvesting, animal drawn potato digger of 600 mm size will fulfill the need of digging tubers showing average work rate of 0.065 ha/h. The number of equipment package for rainfed rice cultivation in hills was estimated 2,778 no. costing $ 3.237 million needed for animal based farming system if mechanized in 5% of rice cultivated area. Package of improved equipment for selective mechanization of Jhum cultiva-tion will require $ 1.323 million for introducing the package which has combination of manually and
animal drawn equipment for the po-tential crops (Table 4). The package of 10 improved equipment suitable for Jhum cultivation can reduce the hardships of tribal people in the re-gion. The tillage operation in Jhum cultivation can be performed by ani-mal drawn improved wedge plough and hand ridger which give output of 0.033 ha/h and 0.025 ha/h respec-tively. The manually operated two row paddy seeder (work rate of 0.02 ha/h) and cono weeder (work rate of 0.008 ha/h) are important improved equipment which can eliminate drudgery in rice cultivation under Jhum system. The pedal operated wire-loop thresher with work rate of 70 kg/h is the viable option to re-duce requirement of labour and cost of operation without any seed loss. The shelling operation of maize requires manual hand maize sheller delivering output capacity of 20 kg/h. The suitable improved equipment for harvesting all major crops of region is improved sickle requir-ing 200 h/ha in the Jhum cultiva-
tion of Nagaland. The requirement of total packages (14,256 no.) will cost $ 9.99 million for mechanizing 5% cultivated area in the hill state through selective mechanization as indicated in Table 5. The rice crop needs 4,547 packages of improved equipment costing $ 1.323 million under Jhum cultivation in mecha-nizing 5% cultivated area of rice. The package of improved equipment to mechanize 5% cultivated area of rice under terrace cultivation will need 2,778 no. of improved equip-ment costing $ 3.237 million.
ConclusionsThe following conclusions can be
drawn from the study.i.) The package of animal drawn im-
proved equipment can be adopted in agriculturally backward Na-galand state for mechanization of different agricultural operations for potential crops.
ii.) The cost of package for jhum
Name of the equipment Unit price,US$
Effective field capacity, ha/h
Cost of operation,$/ha
Command area,ha/season
Hand ridger 5.384 0.033 23.84 1Naveen dibbler 10 0.028 28.46 1Grubber weeder 10 0.005 69.23 1Improved sickle 0.923 0.005 61.53 1Tubular maize sheller 0.923 20 kg/h 13.84 1Pedal operated paddy drum thresher 38.461 70 kg/h 11.53 1.5 Manual wheel hoe 5.384 0.01 39.23 1 Manual cono weeder 27.692 0.008 30.76Animal drawn improved wedge plough 15.384 0.025 24.61 1.5Manual paddy drum seeder (2 row) 38.461 0.02 19.23 1
Table 3 Package of improved equipment for selective mechanization under jhum cultivation
Crop Area, ha Area to be mechanized through animal based farming system equipment (5%), ha
Number of packages of improved equipment
Cost of package,million, US$
PaddyJhum system 90,940 4,547 4,547 1.323Terrace system 83,330 4,166.50 2,778 3.237Maize 66,420 3,321 2,214 1.735Pulses 34,430 1,721.50 1,148 0.899Oilseeds 65,840 3,392 2,262 1.772Commercial crops 29,400 1,470 1,307 1.024Total 370,360 18618 14,256 9.99
Table 4 Total package requirement for selective mechanization in Nagaland

AGRICULTURAL MECHANIZATION IN ASIA, AFRICA AND LATIN AMERICA 2017 VOL.48 NO.412
cultivation was worked out as US$ 291.06.
iii.) Under terrace farming, without rice equipment the package cost was worked out as US$ 783.70 un-der animal based farming in hills in Nagaland.
iv.) The cost of each package of equipment for rainfed rice cultiva-tion in hills was estimated at US$ 1165.23.
v.) The requirement of total pack-ages (14,256) will cost US$ 9.99 million for mechanizing 5% cul-tivated area in the hill state under animal based farming system through selective mechanization.
vi.) The total annual benefits from each package was estimated at US$ 781.754 and benefits from single package wi l l be US$ 596.76/ha.
vii.) For mechanizing 5% cultivated
area in Nagaland-India the esti-mated investment on package of improved equipment would be US$ 6.76 million.
REFERENCES
Annonymous. 2011. Vision 2030. National Research Centre on Mit-hun, Jharnapani, India.
Annonymous. 2013. Souvenir 2013. Central Agricultural University, Imphal-India. pp12-14
Census, Government of India, 2011.Pandey, M. M., S. Ganesan and R.
K. Tiwari. 2006. Improved Farm Tools and Equipment for North Eastern Hills Region, Techni-cal Bulletin No. CIAE/2006/121. Central Institute of Agricultural Engineering, Bhopal, India.
Singh, G., R. S. Devnani, K. L. Ma-
jumdar and M. M. Pandey. 1996. Farm machinery Research Digest. Central Institute of Agricultural Engineering, Bhopal, India.
Yojana. 2012. Vol. 3(6-7)■■
Improved equipment Annual benefits per unit, US$
Annual benefit per unit command area,
US$/ha5% of the
cultivated area, haTotal benefit considering
5% of cultivated area, million US$
Animal drawn wing plough (size: 200 mm) 34.61 23.076 18518 0.427Animal drawn improved clod crusher-leveler-planker-puddler (size: 700 mm) 46.153 30.769 18518 0.569
Animal drawn improved wedge plough (size: 230 mm) 29.538 19.692 18518 0.364
Animal drawn two row improved seed drill (size: 700 × 950 × 740 mm) 10.769 10.769 13971 0.15
Animal drawn improved potato digger(size: 600 mm) 38.076 25.384 1470 0.037
Manual wheel hand hoe (size: 210 mm) 53.076 53.076 13971 0.741Manual knapsack sprayer 30.769 30.769 18518 0.569Manual cono weeder (size: 210 mm) 33.846 33.846 8713.5 0.294Improved sickle 15.384 15.384 18518 0.284Tubular maize sheller 17.23 17.23 3321 0.057Animal drawn multi-crop planter 38.461 19.23 9804.5 0.188Motorized wire-loop thresher 64.615 43.076 8713.5 0.375Manual 4 row rice transplanter 38.461 38.461 8713.5 0.335Manual 4 row paddy drum seeder 53.846 53.846 8713.5 0.469Multi-crop plot thresher (Single phase electric motor, 1 hp) 27.692 18.461 5042.5 0.093
Manual double screen cleaner (size 900 × 600 × 140 mm) 30.769 30.769 18518 0.569
Grubber weeder with handle (size: 1750 × 240 × 1060 mm) 27.692 27.692 9804.5 0.271
Naveen dibbler (size: 280 × 260 × 1060 mm) 12.307 12.307 8334.5 0.102Hand ridger 55.384 18.461 9804.5 0.181Pedal operated wire loop thresher 123.076 74.461 8713.5 0.648Total 781.754 596.759 6.763
Table 5 Estimated benefits of package of improved equipment for mechanizing 5% of the cultivated area

VOL.48 NO.4 2017 AGRICULTURAL MECHANIZATION IN ASIA, AFRICA AND LATIN AMERICA 13
Available Resources for Farm Mechanization in Two Urban Areas of Enugu State of Nigeria
byJoseph C. AdamaAssociate Professor (Farm Power and Machinery Option)Dept. of Agricultural and Bioresouces EngineeringMichael Okpara University of [email protected]
AbstractA study was carried out to as-
sess available resources for mecha-nized farming in two urban areas of Enugu state of Nigeria. The two urban areas used for this study in Enugu state of Nigeria are Enugu and Nsukka. Invest igative sur-vey approach using questionnaire was used to carry out the study. Results obtained showed that the basic resources such as land, water and power needed for mechanized farming are grossly inadequate in the two urban areas. This resulted to near absence of mechanization in these two urban areas. Tractor services are almost nonexistent, the average farm size is less than 0.1 ha and the major source of water is rain. Governments are advised to make new and bold efforts to formulate policies and develop pro-grammes that will improve opera-tions in the sector.
IntroductionOjiako (1984) reported that after
the civil war, governments of Nige-ria laid foundation for sustainable agricultural production and process-ing. These include reactivation of the abandoned farm settlements in the East, supply of 40,000 tons of
fertilizer to farmers by the govern-ment of North Western state, plant-ing of 15,417 hectares of cocoa and 12,000 hectares of oil palm in West-ern state, building and commission-ing of Yakubu Gowon Dam at Tiga, Kano state, etc. Within two years of these efforts, the GNDP, mainly from agriculture, doubled that of projection. But oil has since changed that picture (Ogunleye, 1992). The agricultural share to Nigeria export fell to 3.7% as against oil which was 92% (Odigboh and Onwualu, 1994). This condition was caused by gov-ernment neglect of the agricultural sector which in-turn increased rural to urban migration.
In the urban areas, the expected jobs are not there. Even for those who are working, the salary is poor which is either denied or de-layed. In these areas also, there are abandoned buildings, open spaces, wastes, water from flowing streams, lakes, burst pipes, etc. These re-sources are being harnessed for farming by the residents of urban cities in Nigeria including those who migrated from the rural areas (mostly youths) to seek for jobs and to trade, retired civil servants, low salary earners, etc. (Adama and On-wualu, 2014)
Urban area is defined as a place in which majority of the people are not directly dependent in national
resource base occupation and in-cludes the entire built up non rural area and its population. It is more broadly defined as a town or city having a free standing built up area with a service core and sufficient number and variety of shops and services including perhaps a market, to make it recognizably urban in nature (Bureau of Census, 1990; D. Blife and Mufler 1990). Urban and peri-urban agriculture is perceived as agriculture practices within cit-ies which compete for resources (land, water, energy and labour) that could also serve other purposes to satisfy the requirement of the urban population. The important sectors include horticulture, livestock, fod-der and milk production, forestry, agriculture (FAO, 2004).
Agricultural mechanization is the development, introduction and utilization of mechanical assistance of all forms and at any level of mechanical sophistications in ag-ricultural production (Onwualu et al., 2006). In its widest sense, it en-compasses hand technology, animal drawn technology and mechanical technology (Anazodo, 1980).
Mechanizing farm operations will ensure increased food and fibre pro-duction, create gainful employment, remove drudgery associated with farm operation, restore the dignity of the farmer, protect the farming

AGRICULTURAL MECHANIZATION IN ASIA, AFRICA AND LATIN AMERICA 2017 VOL.48 NO.414
environment, etc (Anazodo, 1980; Odidgoh and Onwualu, 1994; On-wualu, et al., 2006). Most research-ers in the field of agriculture focus attention in the rural areas believ-ing that the rural area is the place where farmers are found. Research has shown that farming takes place in urban areas at various levels and forms (UNDP, 1997; FAO, 2004; Adama and Onwualu, 2014). The objective of this paper is to present the result of a research carried out to assess the availability of the re-sources for mechanizing farm oper-ations in two urban areas of Enugu state of Nigeria.
Materials and MethodsThe Project Area
Enugu State is one of the 36 states in Nigeria. The state has a popula-tion of 3,257,298 million people (2006 Census). It is located in the derived savannah zone of Nigeria. The field survey and data collection were limited to two most important urban areas of the state. The two ur-ban areas involved in the study are Enugu and Nsukka.
Enugu urban area is the capital of Enugu state. It is a scape footed town lying on the plains close to the East facing Enugu-Awgu crest with rich formation known as the lower coal measures with crops at the foot of the escarpment (Ofomata, 1978). The dominant vegetation is the tropical Rainforest and the soils of the area range from low to medium productivity potentials. The mean annual temperature is between 24°C and 26°C (Ofomata, 1975) and the
rainfall ranges between 1,520 mm and 2,030 mm (Idachaba et al., 1991). It consists of three local gov-ernment areas namely; Enugu East, Enugu North, and Enugu South all having a population of 722,664 (FRN, 2007).
Nsukka urban area, on the other hand is the second most important town in Enugu State. It possesses a distinctive physique dominated by a cuesta land scape with a long rain season which lasts from April to October (Ofomata, 1975). The dominant vegetation is the derived Savannah (Anazodo and Onwualu, 1988). The mean annual minimum temperature is between 24°C and 27°C while the maximum tem-perature is between 33°C and 36°C (NIMET, 2011). From October to February, the relative humidity is between 35 to 65% and 60 to 85% during the rest of the year. Annual rainfall ranges from 980 mm to 2,088 mm. The city can grow crops all year round where there is cor-responding supply of water (Inyang, 1978).
The Research InstrumentThis report is a par t of a two
phase study which started in 2007 and ended in 2014. In phase 1, nooks and crannies of the study area as reported by Adama and Onwualu (2014) were visited on foot by the author between 2007 and 2012 to identify the agricultural enterprises being practiced and their exact loca-tions in the cities. This was followed by the use of questionnaire to obtain necessary information and data such as ownership system for resources used in farming, background of the
farmers, factors that make them to farm in the urban areas, and con-straints to farming in the city.
This phase of the study which was conducted in 2008/2009, 2012 and 2014 was divided into two parts (parts I and II). Part I evaluated the extent of availability of the resourc-es and the changes that occurred over the years (2008 to 2014). The resources assessed are power, land and water. The main instrument for this research is the questionnaire designed in a close ended format. The questions contained in the questionnaire were aimed at obtain-ing information on type of power system used, size of land cultivated, sources of water for farming, etc. Part II of this phase which is not part of this report tends to evaluate the need level and awareness index of the farmers in the study area.
Results and DiscussionAvailable Resources
Table 1 presents the yes scores in percent of the extent of availability of the resources needed for mecha-nized farming in Enugu and Nsukka urban areas of Enugu state. From Table 1, 10% of the respondents in 2008/2009 have enough land for farming in Enugu urban area but in Nsukka urban area, the score was 11%. Farmers in Enugu urban area experienced a decline of 1% on availability of land while in Nsukka an increase of 2% was experienced in 2012 but declined to 9% in 2014. The decline on availability of land in the study area may not be un-connected with urbanization with roads, residential houses, churches,
Fig. 1 A vegetable garden between Otikpa roundabout and Artisan
Quarters in Enugu
Resource Percent positive (yes) score Enugu urban area Nsukka urban area
2008/ 2009 2012 2014 2008/ 2009 2012 2014Land 10 9 9 11 11 9Power 70 65 59 80 70 68Water 75 75.9 77 65 66 68Fertilizer 65 75 80 76 87 93
Table 1 Availability of Resources

VOL.48 NO.4 2017 AGRICULTURAL MECHANIZATION IN ASIA, AFRICA AND LATIN AMERICA 15
markets, hotels and other industrial activities to which the farming lands gave way. For instance, in 2008/2009, the empty spaces be-tween Otikpa junction/Con oil and Artisan Quarters in Enugu urban area was used for all season veg-etable production (Fig. 1). By 2014, the area have been cleared, fenced and large quantities of building ma-terials were seen in the site by the time the 2014 survey exercise was conducted.
The availability of power sources for farming activities in Enugu and Nsukka urban areas decreased pro-gressively between 2008 and 2014. In Enugu urban area, the power sources available for farming activi-ties fell by 5% between 2008 and 2012 and further declined by 6% between 2012 and 2014. In Nsukka urban area, power sources avail-able for farming activities declined by 10% within four years (2008 to 2012) and in 2014, the power sourc-es available fell further by 2% (from 70% to 68%) as shown in Table 1. Fig. 2 shows Vegetable and Maize Farm in Artisan Quarters in Enugu tilled and planted using hand pow-ered system.
On water, marginal improvement was recorded. In 2008/2009, 75% of the respondents admitted having enough water for farming in Enugu urban area while in Nsukka urban area, 65% was recorded. In the 2012 survey exercise, records obtained for Enugu urban area increased by 0.9% and by 1% in Nsukka urban area. In the 2014 survey exercise, 77% of farmers in Enugu urban area have enough water for farming activities, recording an increase of
2% from the 2008/2009 survey ex-ercise. In the Nsukka urban area an increase of 3% was recorded in 2014 when compared with the results obtained from 2008/2009 survey exercise.
A not he r i nput eva lu a t ed i n this study was fertilizer. Results obtained showed that f rom the 2008/2009 survey exercise, 65% of the farmers have enough fertilizer for farming activities in Enugu ur-ban area while for the same period covered in Nsukka urban area, 76% of the farmers have enough fertil-izer for farming activities. The two urban areas in the 2012 survey exercise recorded an improvement in the use of fertilizer for farming with a record showing 75% and 87% for Enugu and Nsukka urban areas, respectively. In the 2014 survey exercise, more farmers in the two urban areas had access to fertilizer when compared to the results of 2008/2009 and 2012. For instance, the result of 2014 survey showed an increase of 15% from the 2008/2009 survey and 5% from the 2012 survey in Enugu and in Nsukka urban ar-eas, the results are 87% (an increase of 11%) from the 2008/2009 survey and 93% (an increase of 6%) from 2012 survey. The impressive results recorded in availability of fertilizer in the two urban areas could be as a result of the fertilizer policy of the Federal Government of Nigeria through the Agricultural Transfor-mation Agenda (ATA).
Analysis of Available Power by Source for Field Operation in Enugu and Nsukka, Urban Areas of Enugu State of Nigeria
The power sources available for field operation in the study area was analyzed based on their availability. The sources include manual, animal and mechanical power. Results in Table 2 shows that in the two urban areas in the three survey exercise carried out, manual power is the most dominant with a record show-ing 82% and 100% for Enugu and Nsukka urban areas, respectively, during 2008/2009 survey exercise. In the survey conducted in 2012 and 2014, Enugu urban area recorded 84% and 87%, respectively while in Nsukka urban area manual power recorded 99% each in the 2012 and 2014 survey exercise showing an improvement of 1% in the use of mechanical power. The results of this survey supports the findings of Takeshima and Salau (2010) which stated that many Nigerian farmers still use manual labour and basic hand tools such as hoe, cutlass and matchet and occasionally employ labour saving tools draught animal, ploughs or tractor. Oyedemi and Olajide (2002) had earlier concluded that about 86% of the total agri-cultural land under cultivation in Nigeria is prepared using hand tool technology.
The decline in the number of fa r mers who used mechanical power for field operations in Enugu urban area could be attributed to scarcity of tractors following the auctioning of tractors owned by the Rural Development Department of the Federal Ministry of Agriculture and Rural Development. Another reason for this decline could be as a result of the relocation of the Market Garden in 2010 to Akwuke. At the
Fig. 2 Vegetable and maize farm in Artisan Quarters in Enugu tilled and planted using hand powered system
Power source Percent positive (yes) score Enugu urban area Nsukka urban area
2008/2009 2012 2014 2008/2009 2012 2014Manual 82 84 87 100 99 99Animal 0 0 0 0 0 0Mechanical 18 16 13 0 1 1
Table 2 Types of power available for field operation in Enugu and Nsukka urban area of Nigeria

AGRICULTURAL MECHANIZATION IN ASIA, AFRICA AND LATIN AMERICA 2017 VOL.48 NO.416
Market Garden, which was located near the old Trade Fair ground Enugu, tractors were used to till the land for farmers. Mechanized farm-ing in the area has given way to hotels, offices, residential buildings, etc. The improvement in the utiliza-tion of mechanical power in Nsukka urban area could be due to very few farmers who used tractor to till land around the University of Nigeria, Nsukka Experimental Farm.
No farmer made use of animal traction in the two urban areas used for this study in the three survey exercise carried out. This result is in agreement with the findings of some researchers (Onwualu and Odigboh, 1994; Nwuba, 2009) that animal draught technology is used only in Northern Nigeria where the case of trypanosomiasis caused by tse-tse fly bite is low.
Analysis of Available Land for Farming in Enugu and Nsukka Urban Areas of Enugu State of Nigeria
Analysis of land available by size for farming in Enugu and Nsukka urban areas is presented in Table 3. The 2008/2009 survey showed that
65% of the farmers in Enugu urban area cultivate less than 0.1 ha while for Nsukka urban area the scores obtained was 62%. In the two urban areas, only 1% of the farmers cul-tivate more than 1 ha. Increase in the number of farmers cultivating less than 0.1 ha was witnessed in the subsequent surveys in the two urban areas. In general, the size of land under cultivation in the areas declined over the years from 2008 through 2012 to 2014. A closer examination of the results shows that land fragmentation known as a problem of agricultural mechaniza-tion in Nigeria is worsening by day in spite of government efforts (Igbo-zurike, 1980 and Mabogunje, 2009). It fur ther lends credence to the earlier findings of Anazodo (1982) which concluded that apart from low yields and slow rates of work which are typical of traditional hand powered agriculture in developing countries, small size and fragmenta-tion of farm land is getting worse.
Analysis of Sources of Water for Farming in Enugu and Nsukka Urban Areas of Enugu State of Nigeria
The sources of water available for farming activities in the study area are rain, f lowing stream, artesian well, sewage, water from Enugu State Water Corporation connected to the field using rubber hose and water at burst pipes.
Analysis of water sources avail-able for farming activities in Enugu and Nsukka urban areas of Enugu State is shown in Table 4. From Table 4, in the three survey-exercise carried out rain water ranked high-est as source of water available for farming activities in the two urban areas. In 2014 survey, rain water recorded 62% in Enugu urban area with an increment of 2% over the results obtained in the 2008/2009 survey exercise. In Nsukka urban area, 66.40% was recorded in the 2008/2009 survey exercise carried out. This value later decreased by 0.4% in 2012 and further by 1.4% in 2014. In Enugu urban area, flow-ing streams ranked second after rain water in the three surveys car-ried out with 15%, 18% and 19% recorded for 2008/2009, 2012 and 2014 survey exercise, respectively. In the Nsukka urban area of the State, sewage ranked second record-ing 25.60% in the 2008/2009 survey exercise and 26% in both 2012 and 2014 survey exercise. For borehole connected directly to farms through taps, 7% was recorded for both Enugu and Nsukka urban areas in the 2008/2009 survey exercise. No farmer from the Nsukka urban area used water from burst pipes. In the case of Enugu urban area, 10%, 7% and 5% were recorded for the 2008/2009, 2012 and 2014 survey exercise carried out, respectively. This source was more predominant around Ekulu Primary School areas. However, this source experienced a decrease in the subsequent surveys probably because of rehabilitation works by the government in which old water lines were replaced by modern pipes.
Size of land Percent (yes) score Enugu urban area Nsukka urban area
2008/2009 2012 2014 2008/2009 2012 2014<0.1 ha 65 67 67 62 63 650.1 – 0.5 ha 30 30 21 35 33 320.6 – 1.0 ha 4 3 2 3 4 3>1.0 ha 1 - - 1 - -
Table 3 Size of land under cultivation in Enugu and Nsukka urban areas of Nigeria
Source of waterPercent (yes) score
Enugu urban area Nsukka urban area2008/2009 2012 2014 2008/2009 2012 2014
River 0 0 0 0 0 0Bore hole from water corporate 7 10 10 7 8 9
Water from burst pipes 10 7 5 0 0 0Artisan well 1 0 0 0 0 0Stream/spring 15 18 19 1 0 0Rain 60 59 62 66.4 66 65Sewage 7 6 4 25.6 26 26
Table 4 Sources of water for farming in Enugu and Nsukka urban areas of Nigeria

VOL.48 NO.4 2017 AGRICULTURAL MECHANIZATION IN ASIA, AFRICA AND LATIN AMERICA 17
ConclusionsThere are technical and socio-
polit ical problems facing farm mechanization in the two urban ar-eas of Enugu state. Analyses of data obtained from three survey exercise conducted between 2008 and 2014 showed that these problems include improved power sources, water for irrigation and land for expanded production. These problems have resulted to near absence of farm mechanization in the areas this study was carried out.
Government has no programme to aid farm mechanization in Enugu and Nsukka urban areas of Enugu State of Nigeria. The few resources which had been aiding the farmers to improve their farming operations had been withdrawn by a policy. Such resources include availabil-ity of land at the Market Garden, Enugu, tractor hiring programmes by the state and Federal Govern-ment. As at now, there are no trac-tor hiring services in the area and farm lands available are lesser than 0.1 ha. The major source of water is rain.
In view of the important roles played by urban farming, it is rec-ommended that government of Enugu state should formulate and implement policies that will im-prove operations in the sector. Such policies should give access to tractor services for mechanizing farm oper-ations, guarantee the availability of land, and develop available natural water systems (stream, springs and small rivers) for all year round crop-ping.
REFERENCES
Adama, J. C. and A. P. Onwualu. 2014. Agricultural production in two urban areas of Nigeria: a field evaluation. Journal of Applied Agricultural Research. Published by the Agricultural Research Council, 5(1):87-97.
Anazodo, U. G. N. 1980. Agricul-tural Mechanization as a Catalyst for Rural Development. Paper presented at National Seminar on Achieving Even Development in Nigeria. Economic Development Institute, University of Nigeria Nsukka, Nigeria.
Anazodo, U. G. N. 1982. Mechani-zation of Family Farms in Nigeria: Quantitative Analysis of Problems and Prospects. AMA, 13(3): 59-63.
Anazodo, U. G. N. and A. P. On-wualu. 1988. Field Evaluation and Cost Benef it Analysis of Alternative Tillage Systems for Maize Production in the Derived Savannah Zone of Nigeria. In CIGIR Inter-section Symposium Proceedings, Ilorin-Nigeria. (K. C. Oni edited) Sept. 5-8. pp 157 -169.
Bureau of Census. 1990. roadless.fs.fed.us./documents/feis/glossary/shtml. Downloaded 24/06/2004.
Chukwuemeka, G. 1993. An Oily Stain Special Edition on Econo-my, Newswatch July, 4 Pg 43 - 51.
D. Blife and Muller. 1996. krku.c/icode/clew/courses/course/definitions/zhtml. Downloaded 29/06/04.
FAO. 2004. Food and Agriculture Organization. Report on Urban and Peri-urban Agriculture. http//www.fao.org./unfao/bodies/coag/Coag15/ X 0076e.htm Rome Italy.
FRN. 2007. Federal Republic of Nigeria Official Gazette. Census 2006. Vol. 94, No. 24. Fe d e r a l Government Printer Lagos.
Idachaba, F. S., A. G. Ojanuga, G. S. Ojo, J. A. Ibeawuchi, J. L. C. Ifem, G. S. Ayoola, C. P. O. On-inne, S. A. N. D. Chidebelu, S. Idoga and S. O. Odoemena. 1991. Design and formulation for Agu Ukehe small holder agricultural project. A commissioned study submitted to National Agricultur-al Land Development Authority (NALDA) Abuja, Nigeria.
Igbozurike, U. M. 1980. Land use and Conservation in Niger ia:
Analysis of the Land use Act. University of Nigeria, Press. 146 pages.
Inyang, P. E. B. 1978. The Climate of Nsukka and Environs. In Nsuk-ka Environment, Forth Dimension Publishers, Enugu.
Mabogunje, A. 2009. Land Reforms: National Orientation Agency for Sensitization. Vanguard Newspa-pers Nig. Ltd. Vol. 25, No 60930, September 10.
NIMET. 2011. Nigerian Meteoro-logical Agency. Nigeria Climate Review Bulletin. NIMET- No. 005.33, Pope John Paul II Street off Gana Street Maitama, Abuja-Nigeria.
Nwuba. E. I. U. 2009. Agricultural Mechanization in Nigeria Using Cowpea as a Case Study. Inaugu-ral Lecture Series Nnamdi Aziki-we University Awka, Nigeria.
Odigboh, E. U. and A. P. Onwualu. 1994. Mechanization of Agricul-ture in Nigeria: A Critical Ap-praisal. Journal of Agricultural Technology (2): Published by the National Board for Technical Education (NBTE), 1 ? 58.
Ofomata, G. E. K. 1975. Nigeria in Maps. Ethiope Publisher. Benin City Nigeria.
Ofomata, G. E. K. 1978. The Land Resources of Southeastern Nige-ria. A Need for Conservation. In the Land Use and Conservation in Nigeria. University of Nigeria Press. Uzo M. Igbozuruike edited.
Ogunleye, F. 1992, The Rejected Stone now the Reference Point. Budget Revision (7) Agriculture. In Guardian Newspaper, January 13, pp.8.
Ojiako, J. I. 1984. 13 Years of Mili-tary Rule. Daily Times Publish-ers, Lagos, Nigeria.
Onwualu, A. P., C. O. Akubuo and I. E. Ahaneku. 2006, Fundamentals of Engineering for Agriculture. Immaculate Publications Limited, Enugu, Nigeria.
(Continued on page 23)

AGRICULTURAL MECHANIZATION IN ASIA, AFRICA AND LATIN AMERICA 2017 VOL.48 NO.418
A Cost Analysis Model for Agricultural Bush Clearing Machinery
byJ. C. AdamaAssociate Professor (Farm Power and Machinery Systems Engineering)Dept. of Agricultural and Bioresources EngineeringMichael Okpara University of AgricultureUmudike, P. M. B. 7267, [email protected]
C. O. AkubuoProfessor (Farm Power and Machinery Systems En-gineering)Dept. of Agricultural and Bioresources EngineeringUniversity of Nigeria, [email protected]@yahoo.com
AbstractA model was developed to pre-
dict the cost of agricultural bush clearing machinery. The cost com-ponents modelled include capital, shelter, fuel, oil, repair and main-tenance, mechanical clearing ef-fects and labour costs. The model developed was validated using data from literature, survey and field experiments. Three categories of crawler tractor bulldozers of models D6, D7 and D8 were used to con-duct the field experiments. Results obtained from the developed model showed that the costs of bush clear-ing machinery using crawler tractor bulldozer of models D6, D7 and D8 were $330.02/ha, $296.31/ha and $271.84/ha, respectively. Results from field experiments, gave cost values of $285.28/ha, $257.74/ha and $222.94/ha for using crawler tractor bulldozer of models D6, D7 and D8, respectively.
IntroductionManagement decisions on use of
machinery to carry out farm opera-tions always take into consideration the cost implications. These costs include procurement (purchase or hire) and running or operating costs.
Machinery costs remain a signifi-cant portion of production cost for most food and agricultural crops (Buckmaster, 2003). Among the various inputs to crop production system, power and machinery costs represent the largest single item of expenditure constituting about 60% of the total investment (Dash and Sirohi, 2008). Machinery costs are very important because the success of any mechanized farm enterprise depends to a large extent on them (Adama and Onwualu, 2008). Many researchers have developed and tested models specifically for cost-ing and selecting agricultural ma-chinery. Willett et al. (1972) devel-oped a model for figuring machine costs taking into consideration farm size, hours of use, type of crop, age of machine, etc. McClendon et al. (1987) reviewed several models for machinery selection using simula-tion over multiple years driven by weather data while considering both risk and net returns. Aderoba (1989) developed a generalized model using a linear programming technique to select and cost farm power and ma-chinery for a given cropping system. Witney and Saadoun (1989) used the relationship between the purchase price (Pp) and resale values (Sn) to determine what they referred to as decremented depreciation. Schular
and Frank (1991) estimated the fixed and variable costs as a percentage of remaining value as developed by the American Society of Agricultural Engineers (ASAE). Ismail (1998) combined a number of models such as Hunt (1983) and ASAE Standards (1990) to determine the costs of a set of machinery. Dash and Sirohi (2008) developed a computer - based least-cost model in C-programming language for costing and select-ing optimum size of power and machinery system for paddy-wheat cropping system. Kloub bakht et al. (2008) presented appropriate math-ematical models, based on repair and maintenance costs of MF285 tractor, for predicting tractor costs. Isik and Sabanci (1993) developed a computer model to select optimum size of farm machinery and power for mechanization planning. These models and many others focused on post bush clearing operations. They assume that field operations start from tillage and end at harvesting thereby making models for machin-ery selection and costing limited to those operations that neglecting bush clearing. The cost components of these models and the total cost are expressed per hour. But in some cases, the farmer is interested in knowing the cost of the machinery and hence the cost of operation per
VOL.48 NO.4 2017 AGRICULTURAL MECHANIZATION IN ASIA, AFRICA AND LATIN AMERICA 19
hectare. The objective of this study is to develop a model for predicting cost of agricultural bush clearing machinery.
Materials and MethodsThe cost components modelled in
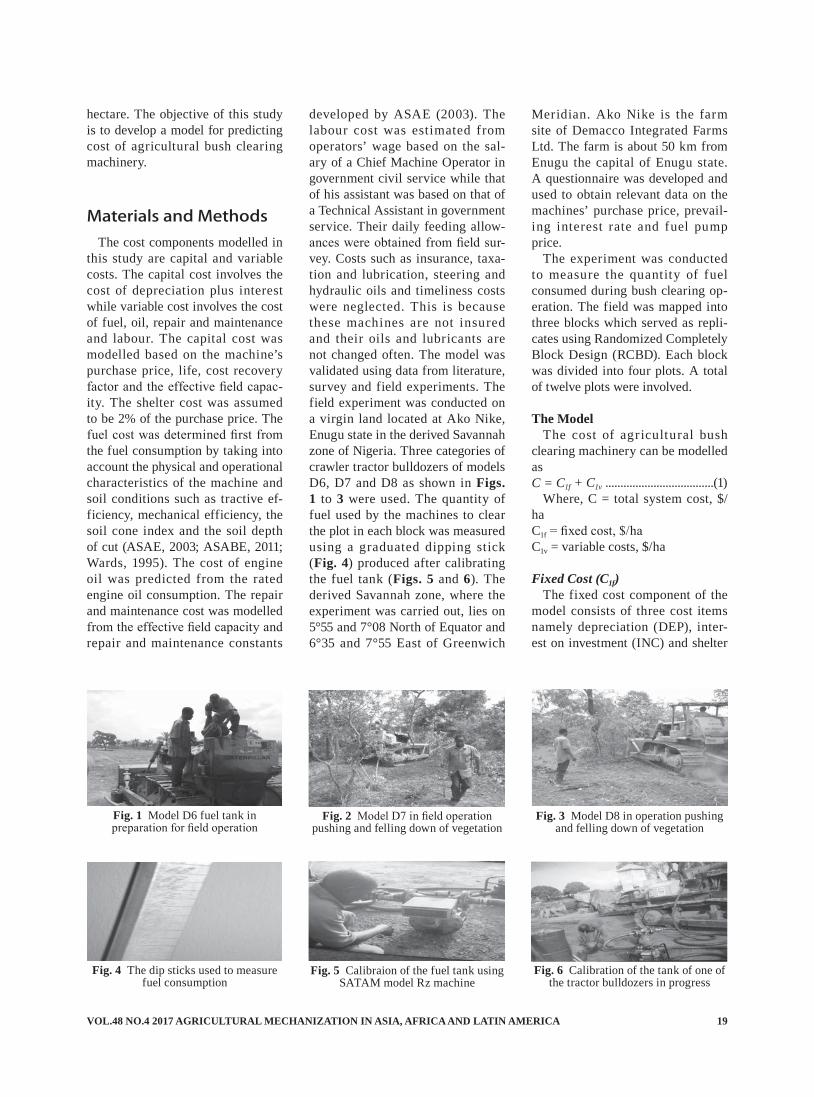
this study are capital and variable costs. The capital cost involves the cost of depreciation plus interest while variable cost involves the cost of fuel, oil, repair and maintenance and labour. The capital cost was modelled based on the machine’s purchase price, life, cost recovery factor and the effective field capac-ity. The shelter cost was assumed to be 2% of the purchase price. The fuel cost was determined first from the fuel consumption by taking into account the physical and operational characteristics of the machine and soil conditions such as tractive ef-ficiency, mechanical efficiency, the soil cone index and the soil depth of cut (ASAE, 2003; ASABE, 2011; Wards, 1995). The cost of engine oil was predicted from the rated engine oil consumption. The repair and maintenance cost was modelled from the effective field capacity and repair and maintenance constants
developed by ASAE (2003). The labour cost was estimated from operators’ wage based on the sal-ary of a Chief Machine Operator in government civil service while that of his assistant was based on that of a Technical Assistant in government service. Their daily feeding allow-ances were obtained from field sur-vey. Costs such as insurance, taxa-tion and lubrication, steering and hydraulic oils and timeliness costs were neglected. This is because these machines are not insured and their oils and lubricants are not changed often. The model was validated using data from literature, survey and field experiments. The field experiment was conducted on a virgin land located at Ako Nike, Enugu state in the derived Savannah zone of Nigeria. Three categories of crawler tractor bulldozers of models D6, D7 and D8 as shown in Figs. 1 to 3 were used. The quantity of fuel used by the machines to clear the plot in each block was measured using a graduated dipping stick (Fig. 4) produced after calibrating the fuel tank (Figs. 5 and 6). The derived Savannah zone, where the experiment was carried out, lies on 5°55 and 7°08 North of Equator and 6°35 and 7°55 East of Greenwich
Meridian. Ako Nike is the farm site of Demacco Integrated Farms Ltd. The farm is about 50 km from Enugu the capital of Enugu state. A questionnaire was developed and used to obtain relevant data on the machines’ purchase price, prevail-ing interest rate and fuel pump price.
The experiment was conducted to measure the quantity of fuel consumed during bush clearing op-eration. The field was mapped into three blocks which served as repli-cates using Randomized Completely Block Design (RCBD). Each block was divided into four plots. A total of twelve plots were involved.
The ModelThe cost of agricultural bush
clearing machinery can be modelled as C = C1f + C1v ....................................(1)
Where, C = total system cost, $/haC1f = fixed cost, $/haC1v = variable costs, $/ha
Fixed Cost (C1f)The fixed cost component of the
model consists of three cost items namely depreciation (DEP), inter-est on investment (INC) and shelter
Fig. 1 Model D6 fuel tank in preparation for field operation
Fig. 2 Model D7 in field operation pushing and felling down of vegetation
Fig. 3 Model D8 in operation pushing and felling down of vegetation
Fig. 4 The dip sticks used to measure fuel consumption
Fig. 5 Calibraion of the fuel tank using SATAM model Rz machine
Fig. 6 Calibration of the tank of one of the tractor bulldozers in progress

AGRICULTURAL MECHANIZATION IN ASIA, AFRICA AND LATIN AMERICA 2017 VOL.48 NO.420
(SHC), while insurance cost (ISC) was neglected. This was expressed as:C1f = DEP + INC + SHC, ($/ha)..(2)
Depreciation and interest costs are jointly determined as capital costs (CAC) by modifying the following models developed by Hunt (1995) which is given as:
......(3)Where, CRF = capital recovery
factor and expressed as:
......(4)where, I, PP, L and SV respective-
ly stands for interest rate in decimal, purchase price in $, life of the ma-chinery in h and salvage value in $.
Equation 3 was modified by in-troducing the terms K0,/K and Keff to take care of the hours devoted to bush clearing within the year and to relate the cost to the size of the farm as follows:
......(5)K0 = number of hours devoted to
mechanized bush clearing within the year, h
K = total number of hours the ma-chinery was used for the year, h
Feff = Effective field capacity, ha/hThe shelter cost cannot be neglect-
ed entirely. Although the machinery is not housed, the owner suffers the cost of increased wear and corrosion due to weather. Therefore, shelter cost is given as: SHC = [(0.02PP × K0) / (L , × Feff × K)], ($/
ha) .................................................(6)The constant 0.02 is the housing
cost assumed to be 2% of the pur-chase price, (PP). This assumption was made because of the high rate of wear due to unfavourable climatic conditions in the tropics.Variable cost (C1v)
The variable cost component in this model consists of fuel (FUC), repair and maintenance (RMC), oil
(OC) and labour (LBC). The vari-able cost was calculated by modify-ing the model equations developed by Witney and Saadoun (1989), Ismail (1998), ASAE (2003) and ASABE (2011) as:C1v =FUC + OC + RMC + LBC, ($/ha) ..........(7)
The Fuel cost FUC was given as:FC = 2.64F + 3.9 - 0.203 (ASAE, 2003) ......(8)
Where,FC = Fuel consumption, lit/kW-hF = power utilization ratio =Maximum power required /
Maximum power availableThe power t ransmit ted to the
blade is always lesser than that de-livered by the engine. This was due to wheel slippage, rolling resistance and frictional losses in the drive train between the engine and the dozer tracks. To account for this, the power required was determined from (Wards, 1995). This was ex-pressed as:Preq = [{z × n × b × (d / Me) × Te} +
W × CRR] V ............................(9)Where,
Preq = maximum power required (kW)
z = resistance to soil cutting, tree felling and windrowing (kN/m2)
n = number of bladesb = width of the blade (m)d = depth of cut (m)Me = mechanical efficiency of the
machine’s transmission system from engine flywheel to the dozer tracks (%)
Te = Tractive efficiency allowing a wheel slip of 25%
W = Weight of the machine (kN)CRR = coefficient of rolling resis-
tance V = speed of operation (m/s)
The available power (Paver) is esti-mated from the net flywheel power under the prevailing soil condition (ASABE, 2011). For bulldozers (track tractors), the power is trans-mitted directly to the blades except for rome ploughing operation. In the case under consideration, the soil is
firm and so the available power is 76% of the flywheel power.
The total fuel consumed TFC is therefore, given as:TFC = FC × Pflyw × T, (L) ............(10)
The fuel cost, FUC is therefore given as: FUC = TFC × PC, ($) ..................(11)
Where, PC = fuel cost per litre, ($/L)
Therefore, the fuel cost per hect-are is given as: FUCh = FUC / S, ($/ha) ...............(12)S = area cleared in hectares intro-
duced in this model to estimate the fuel cost in Dollar per hectare.The oil cost, (OC), includes the
cost of engine oil, hydraulic oil and transmission oil. The hydraulic and transmission oil costs are neglected because these oils are not replaced often.
For diesel engines, the rate of en-gine oil consumption is given as:OC = 0.00059Z + 0.02169 (ASAE,
2003) ...........................................(13)Where,
OC = the rate of engine oil con-sumed (L/h)
Z = rated engine power obtained from the machine operational manual (kW)The total oil consumed is given
as:SC = (0.00059Z + 0.02196)T, (L) ..............(14)
Where, T is the time taken to ac-complish the clearing operation.
Therefore the oil cost:OC = (SC × T) Co / S, ($/ha) .....(15)Co = oil cost per litre, ($/L)Repair and maintenance cost
Due to variations in age of ma-chinery, vegetation, experience of the operator, soil conditions, etc. the repair and maintenance cost of machinery is difficult to estimate. However, an equation was estab-lished by Rotze and Bowers (1991) for estimating repair and mainte-nance cost. Wittney and Saadoun (1989) and Ismail (1998) modified the equation and used it to estimate repair and maintenance cost of trac-tors and implements. In the same
(PP - SV)CRF + SV × ILCAC = , ($/h)
CRF = I (1 + I)L
(1 + I)L-1 - 1
[(PP - SV)CRF + SV × I] K0
L × Feff × K, ($/ha)
CAC =
√738F + 173
VOL.48 NO.4 2017 AGRICULTURAL MECHANIZATION IN ASIA, AFRICA AND LATIN AMERICA 21
manner, repair and maintenance cost can be modified and used for bush clearing machinery as:RMC = (PP × Ra [K0 / K]Rb / S, ($/
ha) ...............................................(16)Where,
RMC = repair and maintenance cost ($/ha)
PP = machine purchase price ($)Ra = repair constantRb = repair component and K0,/K
are the modifying factors that ac-counts for bush clearingThe model adopted for labour cost
LBC in this study includes the an-nual salary of the operator and his help mate plus their daily feeding cost. This was expressed as:LBC = [(A + a) / y × Feff] + [(P + p)
/ t × Feff], ($/ha) .........................(17)“A” and “a” are annual wages of
the operator and his assistant, re-spectively, in Dollar per year; y is the number of hours the operator
worked in a year; “P” and “p” are daily allowances of the operator and his assistant, respectively, in Dollar per day; and t is the number of hours they worked per day. Data on A, a, P and p were obtained from both sur-vey and field experiment carried out while the data for y were obtained from the information revealed from the survey exercise since both op-erators used for the field experiment worked for one day each.
Generalized ModelThe generalized model for costing
agricultural bush clearing machin-ery is obtained by substituting C1f and C1v with their expressions pro-vided in equations (2), (3) and (7) to give: C = CAC + SHC + FUC + RMC +
LBC, ($/ha) ................................(18)Further substitutions of equations
5, 6, 12, 15, 16 and 17 into equation
(18) gave the generalized model as: C = [{(PP - SV)CRF + SV × I}K0] / (L
× Feff × K) + (0.2PP × K0) / (L × Feff × K) + FUC / S + {(SC × T)C0} / S + {PP × Ra (K0 / K)Rb} / S + (A + a) / (y × Feff) + (P + p) / (t × Feff), ($/ha) ..............................(19)
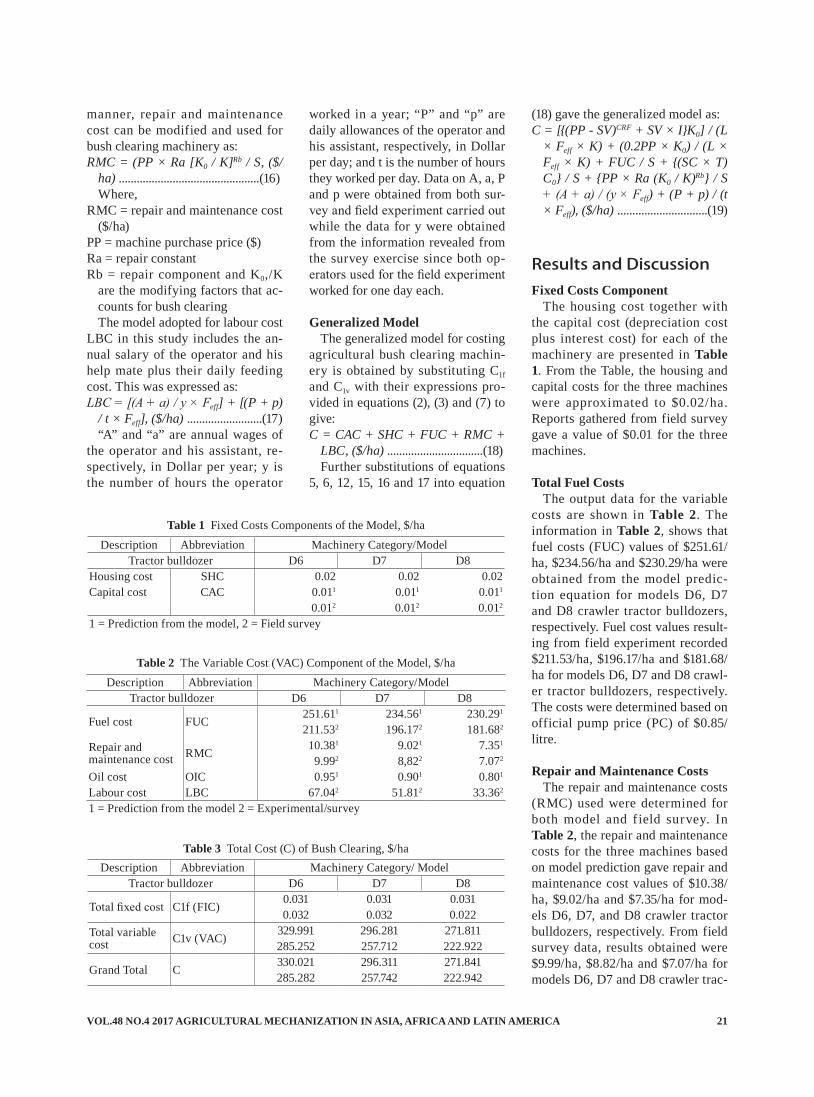
Results and DiscussionFixed Costs Component
The housing cost together with the capital cost (depreciation cost plus interest cost) for each of the machinery are presented in Table 1. From the Table, the housing and capital costs for the three machines were approximated to $0.02/ha. Reports gathered from field survey gave a value of $0.01 for the three machines.
Total Fuel CostsThe output data for the variable
costs are shown in Table 2. The information in Table 2, shows that fuel costs (FUC) values of $251.61/ha, $234.56/ha and $230.29/ha were obtained from the model predic-tion equation for models D6, D7 and D8 crawler tractor bulldozers, respectively. Fuel cost values result-ing from field experiment recorded $211.53/ha, $196.17/ha and $181.68/ha for models D6, D7 and D8 crawl-er tractor bulldozers, respectively. The costs were determined based on official pump price (PC) of $0.85/litre.
Repair and Maintenance CostsThe repair and maintenance costs
(RMC) used were determined for both model and f ield survey. In Table 2, the repair and maintenance costs for the three machines based on model prediction gave repair and maintenance cost values of $10.38/ha, $9.02/ha and $7.35/ha for mod-els D6, D7, and D8 crawler tractor bulldozers, respectively. From field survey data, results obtained were $9.99/ha, $8.82/ha and $7.07/ha for models D6, D7 and D8 crawler trac-
Description Abbreviation Machinery Category/Model Tractor bulldozer D6 D7 D8
Housing cost SHC 0.02 0.02 0.02Capital cost CAC 0.011 0.011 0.011
0.012 0.012 0.012
1 = Prediction from the model, 2 = Field survey
Table 1 Fixed Costs Components of the Model, $/ha
Description Abbreviation Machinery Category/ModelTractor bulldozer D6 D7 D8
Fuel cost FUC 251.611 234.561 230.291
211.532 196.172 181.682
Repair and maintenance cost RMC 10.381 9.021 7.351
9.992 8,822 7.072
Oil cost OIC 0.951 0.901 0.801
Labour cost LBC 67.042 51.812 33.362
1 = Prediction from the model 2 = Experimental/survey
Table 2 The Variable Cost (VAC) Component of the Model, $/ha
Description Abbreviation Machinery Category/ ModelTractor bulldozer D6 D7 D8
Total fixed cost C1f (FIC) 0.031 0.031 0.0310.032 0.032 0.022
Total variable cost C1v (VAC) 329.991 296.281 271.811
285.252 257.712 222.922
Grand Total C 330.021 296.311 271.841285.282 257.742 222.942
Table 3 Total Cost (C) of Bush Clearing, $/ha

AGRICULTURAL MECHANIZATION IN ASIA, AFRICA AND LATIN AMERICA 2017 VOL.48 NO.422
tor bulldozers, respectively.
Total Costs of Oil Consumed The costs of engine oil as pre-
dicted from the model equation are shown in Table 2. Based on pump price of $2.47/litre, the oil costs (OC) values obtained were $0.95/ha, $0.90/ha and $0.80/ha for mod-els D6, D7 and D8 crawler tractor bulldozers, respectively. It was diffi-cult obtaining oil consumption data from the field experiment because users of these machines did not keep record of oil consumption used.
Labour CostThe labour cost (LBC) was vali-
dated using data from both survey and field experiment. The results obtained were presented in Table 2 which gave labour cost values of $67.04/ha, $51.81/ha and $33.36/ha for models D6, D7 and D8 crawler tractor bulldozers, respectively.
Total Cost (C) of Bush ClearingThe total cost of agricultural
bush clearing machinery for both model prediction and field experi-ment is presented in Table 3. For crawler tractor bulldozer of model D6, the total cost values obtained were $330.02/ha and $285.28/ha for model prediction and field experi-ment, respectively. For crawler trac-tor bulldozer of model D7, the total cost values obtained were $296.31/ha and $257.74/ha for model predic-
tion and field experiment, respec-tively. The results for the crawler tractor bulldozer of model D8 gave total cost values of $271.84/ha and $222.94 for model prediction and field experiment, respectively.
The total cost decreases as size of machinery increases. But with respect to hourly cost, (not pro-vided in the tables presented) cost increases with respect to the size of the machinery. The decrease in cost per hectare as the size of the machinery increases could be due to higher effective field capacity of the bigger machinery size (Adama, 2013). However, this cannot be the only basis on which the machinery will be selected as the effect of the machine on the soil is also very im-portant. In all the cases presented, model results were higher than the field (experimental) results. The de-viation values ranged from 13.02% for D7 crawler tractor bulldozer model to 17.99% for D8 crawler tractor bulldozer model with D6 crawler tractor bulldozer account-ing for a deviation value of 13.56%. The deviation could be attributed to uncertainties and uncontrollable factors usually associated with field experiments. The plots of the total cost against machinery size for both model prediction and field experi-ment are shown in Fig. 7. From the Figure, the total cost decreases as machinery size increases up to a point where the total cost starts to
increase as the machinery size in-creases. The equation is of the form
y1 = 7.521x2 - 2275x + 23688 (19) for the model, and
y2 = 6.661x2 - 2003x + 20886 (20) for the field experiment
Where, y1 and y2 are total cost in $/ha and x is machinery size.
The machinery size at its minimal cost is the optimum power for maxi-mizing benefit which is calculated as 147.63 kW using model equation (19) and 150.35 kW using field ex-periment expression shown in equa-tion (20).
ConclusionsThe costs of agricultural bush
clearing machinery have been mod-elled. The cost of agricultural bush clearing per hectare decreases as the size of the machinery increases from models D6 to D8 up to a point and then increases continuously to infinity. The optimum machinery (crawler tractor) size for mecha-nized agricultural bush clearing is between 147.63 kW and 150.35 kW.
REFERENCES
Adama, J. C. 2013. Development of cost components for mecha-nized agricultural bush Clear-ing. Unpublished Ph.D thesis, Department of Agricultural and Bioresoces Engineering, Faculty of Engineering, University of Ni-geria, Nsukka.
Adama, J. C. and A. P. Onwualu. 2008. Farm machinery selection for mechanized tillage operations at Agu Ukehe Enugu State. Pro-ceedings of South East Regional Conference of Nigerian Institu-tion of Agricultural Engineers at Awka. Immaculate Publishers Ltd. 4 Aku St; Ogui N/ Out, Enu-gu. ISBN: 978-036-147-2.Pp 93-98.
Aderoba, A. 1989. Farm power and machinery selection model for Fig. 7 Relationship between Total Cost and Machinery Size
Machinery Size (kW)
Tota
l Cos
t ($/
ha)
y1 = 7.521x2 - 2275x + 23688
y2 = 6.661x2 - 2003x + 20886

VOL.48 NO.4 2017 AGRICULTURAL MECHANIZATION IN ASIA, AFRICA AND LATIN AMERICA 23
mechanized farms in developing countries. Agricultural Mechani-zation in Asia, Africa and Latin America 20(3):69-72.
ASAE EP391.1 1990. American So-ciety of Agricultural Engineers. Agricultural Machinery Manage-ment Data. ASAE Standards. St. Joseph, MI49085.
ASAE. 2003. American Society of Agricultural Engineers. Agricul-tural Machinery Management Data D497.4. FEB. 03.
ASABE. 2011. American Society of Agricultural and Biological En-gineers. Agricultural Machinery Management Data. Francaise. Re-trieved 21/09/08.
Buckmaster, D. R. 2003. Bench-marking tractor costs. Journal of Applied Engineering in Agricul-ture. ASAE. ISSN 08838542
Dash, R. C. and N. P. S. Sirohi. 2008. A computer model to select optimum size of farm power and machinery for paddy- wheat crop rotation in Northern India. Ag-ricultural Engineering, Interna-tional: CIGR Ejournal Manuscript PM08012 Vol. X.
Hunt, D. R. 1983. Farm Power and Machinery Management. 8th Edi-tion. Iowa State University Press, Ames.
Hunt, D. R. 1995. Farm Power and
Machinery Management. 10th Edition. Iowa State University Press. Ames.
Isik, A. and A. Sabanci. 1993. A computer model to select opti-mum size of farm machinery and power for mechanization plan-ning. Agricultural Mechanization in Asia, Africa and Latin Ameri-ca. 24(3):68-72.
Ismail, W. I. W. 1998. Cost analy-sis model for crop production machinery system. Agricultural Mechanization in Asia, Africa and Latin America. 29(4):56-60.
Khoub bakht, G, M., A. Ahmad, A. Akram and M. Karimi. 2008. Re-pair and maintenance cost models for MF285 Tractor: a case study in Central Region of Iran. Ameri-can Eurasian Journal of Agricul-ture and Environmental Science, 4(1):76-80.
McClendon, R. W., M. E. Wetzstein, D. M. Edward and I. H. Clen. 1987. Risk efficiency of mach in-ery selection for double cropping via simulation. Transactions of ASAE, 30(5):1259-1265.
Rotze, C. A. and W. Bowers. 1991. Repair and maintenance cost data for agricultural equipment ASAE Paper No. 91 - 1531.
Schuler, R. T. and G. G. Frank. 1991. Estimating agricultural field ma-
chinery costs. Wisconsin County Extension Office. Cooperative Extension Progamme University of Wisconsin Extension, Madison Wisconsin 53715.
Wards, S. M., P. B. McNulty and M. B. Cunney. 1995. Repair costs of 2 and 4WD tractors. Transactions of the ASAE. 28(4):1074-1076.
Willett, G. S., O. I. Berge and R. N. Weigle. 1972. Costs of farm ma-chinery. Cooperative Extension Programme University of Wis-consin Extension, Madison 53706.
Witney, B. D. and T. Saadoun. 1989. Annual costs of farm machinery ownership, the Agricultural Engi-neer Spring, 44(1):1-11.
AcknowledgementsThe assistance given by the staff
and management of DEMMACO Integrated Resources Ltd Ako Nike, Enugu state in whose farm the experiment was performed, is hereby acknowledged. We also wish to thank the staff and management of ROJEL Nig. Ltd Enugu state for giving us the trac-tor bulldozers used in the bush clearing experiments.
■■
(Continued from page 17)Oyedemi, T. L. and A. Olajide.
2002. Ergonomic evaluation of indigenous tillage tools employed in Nigerian Agriculture Ameri-can Society of Agricultural and Biological Engineers (ASABE). 028001.
Takeshima, H. and S. Salau. 2010. Agricultural mechanization and smallholder farmers in Nigeria.
International Food Policy Re-search Institute NSSP Policy Note 22. htt://www.ifpi.org/sites/de-fault/files/publications/nssp 22_0.pdf.
UNDP. 1997. Second International Colloquim of Mayors on Gover-nance and Equity. New York City. http/www.fao.org/unfaol/bodoes/coag. 15 X 0076e.htm.
■■

AGRICULTURAL MECHANIZATION IN ASIA, AFRICA AND LATIN AMERICA 2017 VOL.48 NO.424
Effect of Moisture Content on Physical Properties of Finger (Eleusine coracana) Millet
byK. P. SinghSenior ScientistAgricultural Mechanization DivisionCentral Institute of Agricultural EngineeringBhopal, MP, [email protected]
Rahul R. PotdarScientistAgricultural Mechanization DivisionCentral Institute of Agricultural EngineeringBhopal, MP, -462038INDIA
K. N. AgrawalPrincipal ScientistAgricultural Mechanization DivisionCentral Institute of Agricultural EngineeringBhopal, MP, -462038INDIA
P. S. TiwariHeadAgricultural Mechanization DivisionCentral Institute of Agricultural EngineeringBhopal, MP, -462038INDIA
Smrutilipi HotaSRFAgricultural Mechanization DivisionCentral Institute of Agricultural EngineeringBhopal, MP, -462038INDIA
AbstractDesign of harvesting, grading,
cleaning, processing, grain handling equipment, grain storage structures and transport machineries requires the physical, mechanical, aerody-namic properties of grains. Linear dimensions l ike length, width, thickness, geometric mean diameter sphericity are necessary for selec-tion of sieve separator and calcu-lation of grinding power for size reduction whereas surface area and volume are for modelling of grain drying, aeration, heating and cool-ing. Bulk density determines the ca-pacity of storage and transport sys-tem, whether true density used for separation equipment and porosity
determines the resistance to air flow during aeration and drying of seeds. Terminal velocity helps in designing the cleaning system and frictional coefficient is necessary for design of agricultural product handling equipment. Effect of moisture con-tent on physical properties of finger millet were studied in the range of 0.065 to 0.265 kg kg-1 dry matter and result was found that length, width, thickness, geometric mean diameter, surface area, volume and sphericity increased from 1.61 to 1.81 mm, 1.58 to 1.84 mm, 1.41 to 1.61 mm and 1.53 to 1.75 mm, 7.05 to 9.35 mm2, 1.75 to 2.69 mm3 and 0.95 to 0.96, respectively. True den-sity obtained by proximate compo-sition method was found lower than
the true density obtained by toluene displacement method. Interstice was observed decreased with increase of moisture content from 0.26 to 0.01 m3. Coefficient of friction and ter-minal velocity increased from 0.536 to 0.774 and 1.22 to 2.02 ms-1 with increase of moisture content.
Keywords: Finger millet, physical properties
IntroductionFinger millet (Eleusine coracana),
also known as ragi, red millet, caracan millet, koracan, is widely cultivated in African and Asian countries. It is very adaptable to higher elevations, humid areas and

VOL.48 NO.4 2017 AGRICULTURAL MECHANIZATION IN ASIA, AFRICA AND LATIN AMERICA 25
dry areas. Finger millet is grown in above MSL Africa including Uganda, Kenya, Tanzania, Malawi, Sudan, Zai re, Zambia, Zimba-bwe, Ethiopia and in India south to eastern and western Himalaya up to 2500 m height. In India it is cultivated in Karnataka, Andhra Pradesh, Madhya Pradesh, Tamil Nadu, Rajasthan, Bihar and Odisha states among which Karnataka tops with 58% share.
Finger millet having an annual grass with erect culms, laterally flattened, 60-120 cm tall, profusely tillering, fibrous root system and remarkably strong, the inflorescence is in a whorl of 2-8, digitate, straight or slightly curved spikes 12.5-15 cm long and about 1.3 cm broad, spike-lets (about 70) arranged alternately on rachis, each spikelet containing 4-7 seeds, seed diameter varying from 1-2 mm, caryopsis globose to flattened, smooth or tugose, reddish
brown to nearly white or black in colour. It is generally grown in the month of June-July and harvested in October-November. Normally intercropped with legumes like pea-nuts, cowpeas, pigeon peas, it can be stored for long time without any damage by pests and insects.
Finger millet is very nutritious minor millet which contains methi-onine and amino acid. Its nutritional value is: 100 g finger millet contains carbohydrate 88 g, protein 7.6 g, fibre 3 g, fat 1.5 g, calcium 370 mg, vitamin A 0.48 mg, Thiamine (B1) 0.33 mg, Riboflavin (B2) 0.11 mg, Niacin (B3) 1.2 mg. In India it is a staple food of the tribal people of Odisha and western hilly regions. It can be consumed as cooked cake, puddings, mudde, porridge, idly, dosa, roti, f lat breads. It is made into fermented drink in Nepal and other African countries and also consumed as flavoured drink in fes-tivals. Finger millet straw is used as fodder for animals.
Design of harvesting, grading, cleaning, processing, grain handling equipment, grain storage struc-tures and transport machineries requires the physical, mechanical, aerodynamic properties of grains. Linear dimensions like length, width, thickness, geometric mean diameter sphericity plays vital role in selection of sieve separator and calculation of grinding power for size reduction. Surface area and volume important for modelling of grain drying, aeration, heating and cooling (Tavakoli et al., 2009). Bulk density determines the capac-ity of storage and transport system and used for calculating the struc-tural loads on the storage struc-ture, whether true density used for separation equipments and porosity determines the resistance to air flow during aeration and drying of seeds (Gharib-Zavedi et al., 2010). Termi-nal velocity plays an important role for designing the cleaning system where as frictional coefficient is necessary for design of agricultural
product handling equipment (Isik & Unal, 2007). Many studies were done on physical, mechanical and aerodynamic properties by many researchers like Singh et al., 2010; Balasubhramanian & Viswana-than, 2010; Swami & Swami, 2010; Ojediran et al., 2010; Tavakoli et al., 2009; Tunde-Akintunde & Akin-tunde, 2007; Gharib-Zahedi et al., 2010; Seifi et al., 2010; Shafiee et al., 2009; Altuntas & Yildiz, 2005; Bhise et al., 2014 for the food grains like barnyard millet, minor millets, finger millet, pearl millet, barley grains, beniseed, black cumin, corn, dragon’s head seeds, faba bean, wheat. The current study was done on the effect of moisture content on physical, mechanical and aero-dynamic properties of finger millet within the moisture content range of 0.065 to 0.265 kg kg-1 dry matter.
Materials and MethodsFinger millet grain (Variety: VL
Mandua 149; colour: copper colour; Plant hight: 850-900 mm; Maturity period: 105-110 days; yield poten-tial: 2500-300 kg/ha) was taken from ICAR-Vivekananda Institute of Hill Agriculture, Almora, Ut-tarakhand, India. As per ASAE standard (ASAE, 1993) method moisture content was determined by keeping the grain for 12-14 hours in hot oven at 105±1°C. (Ojediran et al., 2010; Suthar & Das, 1996; Al-tuntas & Yildiz, 2007; Tabatabaee-far, 2003; Seifi et al., 2010; Sezer et al., 2011). Five levels of moisture content were taken (0.065, 0.112, 0.163, 0.22 & 0.265 kg kg-1 dry mat-ter) for analysis of the properties of grain. Grain samples of desired moisture content were prepared by addition of required amount of dis-tilled water to the sample and thor-oughly mixed. After that samples were kept in polyethylene bags and sealed properly to reduce the reduc-tion of moisture. The bags were kept in refrigerator for a week at 5°C
NomenclatureQ Mass of water added, kgWi Initial mass of sample, kgMi initial moisture content of sample,
kg kg-1 dry matterMf Final moisture content of sample,
kg kg-1 dry matterDg Geometric diameter, mmL Length of grain, mmW Width of grain, mmT Thickness of grain, mmS surface area, mm2
V Volume, mm3
Sp Sphericityδbd Bulk density, kg m-3
T Temperature, ºCI Interstice, %δtd True density (kg m-3) assessed by
toluene displacementδpc True density (kg m-3) assessed by
proximate composition methodε Porosity, %µi Coefficient of internal frictionFe Load on pan required to slide the
empty cylinderFg The incremental load applied on
the loading pan to slide the top cylinder
N Mass of the grain or kernel sample contained in the top cylinder

AGRICULTURAL MECHANIZATION IN ASIA, AFRICA AND LATIN AMERICA 2017 VOL.48 NO.426
temperature to allow the moisture to be distributed uniformly throughout the samples. Before each experiment required amount of samples were taken out and allowed to warm up to the room temperature (30±2°C) for 2 h (Balasubramanian & Viswana-than, 2010; Sing & Goswami, 1996; Yalcin & Ozarslan, 2004; Coskun et al., 2006, Nimkar & Chattopadhyay, 2001; Garnayak et al., 2008; Singh et al., 2010).
The required amount of water for addition to obtain the desired mois-ture content was calculated by the following equation (Sacilink, 2002; Karababa, 2006; Altuntas & Yildiz, 2007; Singh et al., 2010; Balasubra-manian & Viswanathan, 2010).Q = (Wi (Mf - Mi)) / (100 - Mf) ....(1)
The physical, mechanical and aerodynamic properties were ob-tained at all the five levels of mois-ture contents with five replications of each.
100 grains were selected random-ly and length, width and thickness were determined using Vernier cal-liper with 0.001 mm least count. The geometrical mean diameter of grain was calculated by the formula given below (Mohsenin, 1970; Singh et al., 2010; Shafiee et al., 2009; Sezer et al., 2011; Seifi et al., 2011).Dg = (LWT)1/3 ..................................(2)
The surface area of the grain was calculated by using the following formula (Sacilik et al., 2003; Tunde-Akintunde & Akintunde, 2004; Altuntas et al. 2005; Singh et al., 2010; McCabe et al., 1986; Dursun and Dursun, 2005; Baryeh, 2002; Al-Mahasneh & Rababah, 2007; Deshpande et al., 1993; Sessiz et al., 2007).S = πDg2 ...........................................(3)
The volume of grain was obtained using formula given below (Jain & Bal, 1997; Gharib-Zahedi et al., 2010).V = 0.25[(π/6) L (W + T)2] .............(4)
The sphericity is defined as the ra-tio of the surface area of the sphere having the same volume as that of grain to the surface area of the
grain. It was determined by using the relationship proposed by Mohes-enin, 1978. Sp = (LWT)1/3 / L ..............................(5)
Thousand grain weight were de-termined by the help of electronic balance with an accuracy of 0.001 g by selecting 1,000 grain randomly.
Bulk density is the ratio of mass and volume of the grain. To deter-mine the bulk density, a cylindrical container of 500 ml was used. It was obtained by taking a container of 500 ml filled with the grain. Then the weight of 500 ml grain was measured with the help of electronic balance with an accuracy of 0.001g and calculated by using the follow-ing formula.δbd = W / 500 × 106 ..........................(6)
The true density is defined as the ratio of the mass of the sample to the solid volume occupied by the sample. It was reviewed that absorb-ing capacity of toluene (C7H8) is less than the absorbing capacity of water by the grain. Therefore tolu-ene displacement method was used for determination of true density (Mohsenin, 1986; Dursun and Dur-sun, 2005). The actual volume will be taken as the volume toluene dis-placed (Singh and Goswami, 1996; Ogut, 1998; Konak et al., 2002).
True density can also be deter-mined by using the proximate com-position of the grain. Choi & Okas, 1986 and Singh et al., 2010 used the following formula for determination of the true density.δT = 1 / {(Cfat / δfat) + (Ccarb / δcarb)
+ (Cfib / δfib) + (Cprotein / δprotein) + (Cash / δash) + (Cwater / δwater)} ..... (7)Where,
δfat = 9.26 × 10² - 4.18 × 10⁻¹T, δcarc = 1.60 × 10³ - 3.10 × 10⁻¹T, δfib = 1.31 × 10³ - 3.66 × 10⁻¹T, δprotein = 1.33 × 10³ - 5.8 × 10⁻¹T, δash = 2.42 × 10³ - 2.81 × 10⁻¹T, δwater = 9.97 × 10² + 3.14 × 10⁻³T -3.38 × 10⁻³T2
Cfat, Ccarb, Cfib, Cprotein, Cash, Cwater are the fraction of fat, carbohydrate, fibre, protein, ash and water in the grain of finger millet at all the level
of moisture content within the ex-perimental range.
Interstices are the intermolecular space present between the molecules of protein, fat, carbohydrate, fibre, ash and water. It was calculated by the formula given below (Singh et al., 2010).I = (1000 grain mass / 1000) × (δpc -
δtd / δpc × δtd) ....................................(8)The porosity was calculated us-
ing of bulk density and true density with the help of the following for-mula (Mohsenin, 1986; Balasubra-manian & Viswanathan, 2010; Sigh et al., 2010)ε = (1 - δbd / δtd) × 100 ..................(9)
Subramanian & Viswanathan, 2007 developed a set up for mea-surement of internal coefficient of friction. In this setup two identical hollow plastic cylinders of 50 mm diameter and 55 mm height were used. Lower cylinder was fixed on the horizontal surface and the top cylinder was kept free. Pulley rope arrangement with loading pan was used to make the top cylinder slide over the stationary cylinder when weight on the loading pan was in-creased. The coefficient of internal friction was obtained by the follow-ing equation.μi = (Fg - Fe) / N ............................(10)
Aerodynamic property like ter-minal velocity of finger millet grain were measured exper imentally by the set up where, a transparent cylindrical hollow plastic cylinder was used. For each analysis 100 g of samples were taken and put into the cylinder. Then the vibrator was used for dropping into the air stream from the top of the vertical column and air f low rate was increased to suspend the grain in the air for 30 sec. The velocity was measured by the vane anemometer and recorded.
Error bar diagram was used for the statistical analysis which repre-sents the precision of the measure-ments and difference from the accu-rate value.

VOL.48 NO.4 2017 AGRICULTURAL MECHANIZATION IN ASIA, AFRICA AND LATIN AMERICA 27
Results and DiscussionPhysical, mechanical and aero-
dynamic properties of finger millet were measured at all the moisture content level within experimental range of 0.065 to 0.265 kg kg-1 dry matter.
LengthLength of finger millet observed
within the experimental range of moisture content was increased linearly as the moisture content increased. Length was increased from 1.61 to 1.81 mm with increase of moisture content from 0.065 to 0.265 kg kg-1 dry matter. This was represented in the Fig. 1. The rela-tionship between the moisture con-tent and length may be expressed by the equation 11. Ojediran et al., 2010 also found similar increasing trend for pearl millet. Similarly Tunde-Akintunde & Akintunde, 2007 for beniseed, Gharib-Zahedi et al., 2010
for black cumin, Seifi et al., 2010 for corn also found increased length with increase of moisture content.Y = 0.5416x2 + 0.8047x + 1.561, R2
= 0.9981 ......................................(11)
WidthWidth of finger millet grain was
measured at all the moisture content level and as a result it was found that width was increased slowly up to 0.163 kg kg-1 dry matter moisture content but increased rapidly there-after. It was increased in the range of 1.58 to 1.84 mm as the moisture content increased from 0.065 to 0.265 kg kg-1 dry matter moisture content. It was represented in the Fig. 2. Relationship between mois-ture content and width was found as equation 12. Ojediran et al., 2010 for pearl millet, Tunde-Akintunde & Akintunde, 2007 for beniseed, Gharib-Zahedi et al., 2010 for black cumin, Seifi et al., 2010 for corn also found similar trend of increased
width with increase of moisture content.Y = 6.3824x2 - 0.8225x + 1.6103, R2
= 0.9997 .....................................(12)
ThicknessFinger millet grain thickness was
observed to have increased as the moisture content increased within the experimental range. When the moisture content of the grain was increased from 0.065 to 0.265 kg kg-1 dry matter moisture content thickness of the grain was increased from 1.41 to 1.61 mm. It can be ob-served from the Fig. 3. Thickness and moisture content relationship of finger millet grain may be expressed by the equation 13. Ojediran et al., 2010 for pearl millet, Sezer et al., 2011 for dent corn seeds, Gharib-Zahedi et al., 2010 for black cumin, Seifi et al., 2010 for corn also found similar trend of increased thickness with increase of moisture content.Y = -2.4357x2 + 1.8232x + 1.3034,
Fig. 1 Effect of moisture content on length of grain Fig. 2 Effect of moisture content on width of grain
Fig. 3 Effect of moisture content on thickness of grain Fig. 4 Effect of moisture content on geometric mean diameter of grain
Moisture content, kg kg-1 dry matter
Geo
met
ric
mea
n di
amet
er, m
m
Moisture content, kg kg-1 dry matter

AGRICULTURAL MECHANIZATION IN ASIA, AFRICA AND LATIN AMERICA 2017 VOL.48 NO.428
R2 = 0.9936 ................................(13)
Geometric Mean DiameterGeometric mean diameter of the
grain was calculated by the formula no. 2 by using the linear dimen-sions of the grain at all the moisture content levels and the result was observed that increase of moisture content within the experimedntal range increased the geometric mean diameter linearly. When the mois-ture content increased from 0.065 to 0.265 kg kg-1 geometric mean diameter of the finger millet grain was increased from 1.53 to 1.75 mm, which can be observed from the Fig. 4. The relationship built between moisture content and geometric mean diameter of the grain can be expressed by the equation 14. Singh et al., 2010 for barnyard millet, Ojediran et al., 2009 for pearl mil-let, Shafiee et al., 2009 for dragon’s head seeds also found increasing trend of geometric mean diameter
with increase of moisture content.Y = 0.003x2 + 0.036x + 1.491, R2 =
0.996 ...........................................(14)
Surface AreaSurface area of finger millet grain
was calculated by the formula sug-gested by Mohsennin and the result was obtained that surface area was increased linearly with increase of moisture content within the experi-mental range. When the moisture content increased from 0.065 to 0.265 kg kg-1 dry matter surface area was increased from 7.05 to 9.35 mm2 as presented in the Fig. 5. Re-lation between moisture content and surface area can be expressed by the equation 15. Similar result were also found for barnyard millet by Singh et al., 2010, for pearl millet by Ojediran et al., 2010, for dent corn seeds by Sezer et al., 2011 for soya-bean grains by Tavakoli, 2009 and for dragon’s head seeds by Shafiee et al., 2010.
Y = 21.453x2 + 4.4307x + 6.6804, R2 = 0.998 .......................................(15)
VolumeFinger millet grain volume was
observed increasing linearly as the moisture content was increased within the experimental range. When moisture content was in-creased from 0.065 to 0.265 kg kg-1 dry matter volume of the grain was increased from 1.75 to 2.69 mm3. It can be observed from the Fig. 6. The relationship between moisture content and volume of grain can be expressed by the regression equation and coefficient of correlation pre-sented in the equation 16. Sezer et al., 2011 for dent corn and Gharib-Zahedi et al., 2010 for black cumin also found similar increasing trend as increase of moisture content.Y = 10.344x2 + 1.2375x + 1.6358, R2
= 0.998 .......................................(16)
Fig. 5 Effect of moisture content on grain surface area Fig. 6 Effect of moisture content on grain volume
Fig. 7 Effect of moisture content on sphericity of grain Fig. 8 effect of moisture content on thousand grain mass of grain
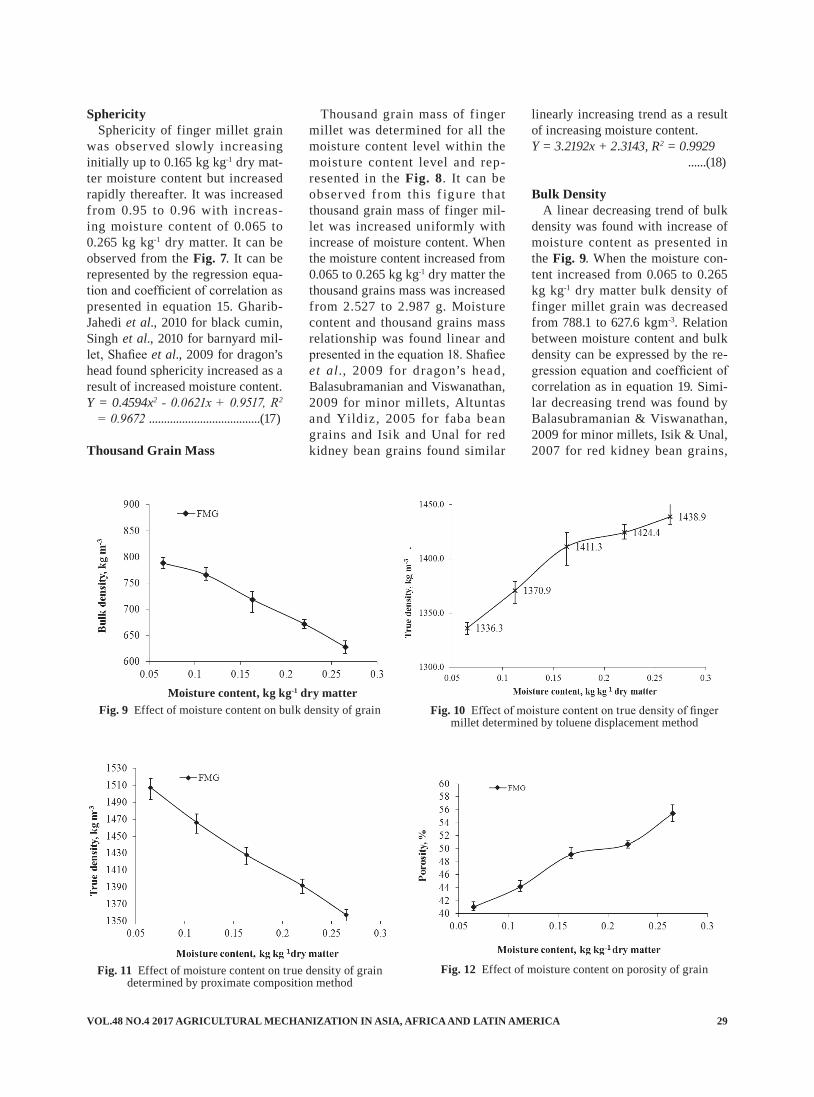
VOL.48 NO.4 2017 AGRICULTURAL MECHANIZATION IN ASIA, AFRICA AND LATIN AMERICA 29
SphericitySphericity of finger millet grain
was observed slowly increasing initially up to 0.165 kg kg-1 dry mat-ter moisture content but increased rapidly thereafter. It was increased from 0.95 to 0.96 with increas-ing moisture content of 0.065 to 0.265 kg kg-1 dry matter. It can be observed from the Fig. 7. It can be represented by the regression equa-tion and coefficient of correlation as presented in equation 15. Gharib-Jahedi et al., 2010 for black cumin, Singh et al., 2010 for barnyard mil-let, Shafiee et al., 2009 for dragon’s head found sphericity increased as a result of increased moisture content.Y = 0.4594x2 - 0.0621x + 0.9517, R2
= 0.9672 .....................................(17)
Thousand Grain Mass
Thousand grain mass of finger millet was determined for all the moisture content level within the moisture content level and rep-resented in the Fig. 8. It can be observed f rom this f igure that thousand grain mass of finger mil-let was increased uniformly with increase of moisture content. When the moisture content increased from 0.065 to 0.265 kg kg-1 dry matter the thousand grains mass was increased from 2.527 to 2.987 g. Moisture content and thousand grains mass relationship was found linear and presented in the equation 18. Shafiee et al., 2009 for dragon’s head, Balasubramanian and Viswanathan, 2009 for minor millets, Altuntas and Yildiz, 2005 for faba bean grains and Isik and Unal for red kidney bean grains found similar
linearly increasing trend as a result of increasing moisture content.Y = 3.2192x + 2.3143, R2 = 0.9929 ......(18)
Bulk DensityA linear decreasing trend of bulk
density was found with increase of moisture content as presented in the Fig. 9. When the moisture con-tent increased from 0.065 to 0.265 kg kg-1 dry matter bulk density of finger millet grain was decreased from 788.1 to 627.6 kgm-3. Relation between moisture content and bulk density can be expressed by the re-gression equation and coefficient of correlation as in equation 19. Simi-lar decreasing trend was found by Balasubramanian & Viswanathan, 2009 for minor millets, Isik & Unal, 2007 for red kidney bean grains,
Fig. 9 Effect of moisture content on bulk density of grain Fig. 10 Effect of moisture content on true density of finger millet determined by toluene displacement method
Fig. 11 Effect of moisture content on true density of grain determined by proximate composition method
Moisture content, kg kg-1 dry matter
Fig. 12 Effect of moisture content on porosity of grain

AGRICULTURAL MECHANIZATION IN ASIA, AFRICA AND LATIN AMERICA 2017 VOL.48 NO.430
Singh et al., 2010 for barnyard mil-let and Altuntas & Yildiz, 2007 for faba bean. Y = -817.71x + 849.26, R2 = 0.9905 ......(19)
True Density (Toluene Displace-ment Method)
True density of finger millet grain was found following an increas-ing trend with increase of moisture content. It was observed increas-ing from 1336.3 to 1438.9 kg m-3 as moisture content increased from 0.065 to 0.265 kg kg-1 dry matter. It can be observed from Fig. 10. The relation between moisture content and bulk density can be expressed by the equation 20. Singh et al., 2010 for barnyard millet, Shafiee et al., 2009 for dragon head seed, Seifi et al., 2010 for corn and Tabatabaee-far, 2003 for wheat also found simi-lar increasing trend with increase of moisture content.Y = -2116.3x + 961.18x + 1288, R2 =
0.5179 ..........................................(20)
True Density (Proximate Compo-sition Method)
True density of finger millet was obtained by taking all the proxi-mate composition of grain at all the moisture content and the result was obtained that increase of moisture content decreased the true density of the grain (Fig. 11). When the moisture content increased from 0.065 to 0.265 kg kg-1 dry matter true density was observed decreased from 1507.55 to 1357.13 kgm-3. The
relation between moisture content and true density can be expressed by the equation 21. Singh et al., 2010 found similar decreasing trend with increase of moisture content in case of barnyard millet.Y = -738.19x + 1551.9, R2 = 0.9971 ......(21)
IntersticeInterstices, the intermolecular
space of grain was found following a decreased trend with increase of moisture content. Interstice of grain was increased from 0.26 to 0.01 with increasing of moisture content from 0.065 to 0.265 kg kg-1 dry mat-ter. Moisture content and interstice relationship can be expressed by the equation 22. Similar result was also found for barnyard millet by Singh et al., 2010.Y = 3.4324x2 - 2.3287x + 0.396, R2 =
0.972 ...........................................(22)
PorosityPorosity of finger millet grain was
obtained at all the moisture content level within the experimental range and found following a increased trend. It can be observed from the Fig. 12. When the moisture con-tent was increased from 0.065 to 0.265 kg kg-1 dry matter porosity was found increased from 41.02 to 55.43%. The relationship between porosity and moisture content can be expressed by the regression equa-tion and coefficient of correlation as presented by the equation 23. Seifi et al., 2010 for corn, Gharib-Zahedi
et al., 2010 for black cumin, Singh et al., 2010 for barnyard millet, Sezer et al., 2011 for dent corn, Tavakoli et al., 2009 for soyabean grains, Shafiee et al., 2009 for dragon head seeds, Bhise et al., 2014 and Karimi et al., 2009 for wheat also found similar increasing trend of result. Y = -16.162x2 + 74.674x + 36.279, R2
= 0.9761 .....................................(23)
Coefficient of Internal FrictionCoefficient of internal friction of
finger millet grain was obtained at all the moisture content level within the experimental range and as a result it was observed from the Fig. 13 that it follows an increasing trend with increase of moisture content. When the moisture content of grain increased from 0.065 to 0.265 kg kg-1 dry matter coefficient of inter-nal friction was observed increased from 0.536 to 0.774. The relation be-tween moisture content and coeffi-cient of friction can be expressed by the equation 24. Similar result was also found by Singh et al., 2010 for barnyard millet and Subramanian and Viswanathan for millet grains and flours.Y =- 1.7422x2 + 0.5398x + 0.501, R2
= 0.9835 .....................................(24)
Terminal VelocityTerminal velocity of finger mil-
let grain was observed increasing as the moisture content increased within the experimental range. Ter-minal velocity was increased from 1.22 to 2.02 ms-1 with increasing
Fig. 14 Effect of moisture content on terminal velocity of grain
Fig. 13 Effect of moisture content on coefficient of internal friction of grain
Coe
ffici
ent o
f int
erna
l fric
tion

VOL.48 NO.4 2017 AGRICULTURAL MECHANIZATION IN ASIA, AFRICA AND LATIN AMERICA 31
of moisture content from 0.065 to 0.265 kg kg-1 dry matter (Fig. 14). Relationship between the moisture content and terminal velocity of grain can be expressed by the equa-tion 25. Gharib-Zahedi et al., 2010 for black cumin, Singh et al., 2010 for barnyard millet, Isik & Unal, 2007 for red kidney bean grain also found similar increasing trend of result.Y = -1.6775x2 + 4.2675x + 0.9715, R2
= 0.9748 .....................................(25)
ConclusionsAll the physical properties and
effect of moisture content on them was studied and some conclusion was drawn that moisture content affects the physical properties of finger millet as the moisture content increased from 0.065 to 0.265 kg kg-1 dry matter. Linear dimensions increased with increase of moisture content. Average length, width, thickness, geometric mean diameter were increased from 1.61 to 1.81 mm, 1.58 to 1.84 mm, 1.41 to 1.61 mm and 1.53 to 1.75 mm, respec-tively. Surface area and volume of grain was found increasing follow-ing a linear trend with increasing of moisture content. True density of finger millet was found higher than the bulk density in case of all the moisture content within the mois-ture content. True density found by proximate composition method was found lower than the true den-sity found by toluene displacement method. Interstice was observed increased with increase of moisture content. Coefficient of friction and terminal velocity increased from 0.536 to 0.774 and 1.22 to 2.02 ms-1 as function of moisture content.
AcknowledgementThe authors wish to thank the
Director, ICAR-Central Institute of Agricultural Engineering, Bhopal,
MP, India for providing all neces-sary requirements for the study.
REFERENCES
Al-Mahasneh, A. M. and T. M. Ra-babah. 2007. Effect of moisture content on some physical proper-ties of green wheat. Journal of Food Engineering, 79, 1467-1473.
Altuntas. E., E. Ozgoz and O. F. Taser. 2005. Some physical prop-erties of fenugreek (Trigonella foenum-graceum L.) seeds. Jour-nal of Food Engineering, 71, 37-43.
Altuntas, E. and M. Yildiz. 2007. Effect of moisture content on some physical and mechanical properties of faba bean (Vicia faba L.) grains. Journal of Food Engineering, 78, 174-183.
ASAE. 2006. Moisture Measure-ment −Ung rou nd G ra i n and Seeds. S352.2, 606.
Balasubramanian, S. and R. Viswa-nathan. 2010. Influence of mois-ture content on physical proper-ties of minor millets. Journal of Food Science Technology, May-June, 47(3), 279-284.
Baryeh, E. A. 2002. Physical prop-erties of millet. Journal of Food Engineering, 51, 39-46.
Bhise, S. R., A. Kaur and M. R. Manikantan. 2014. Moisture de-pendent physical properties of wheat grain. International Journal of Engineer ing Pract ical Re-search, 3(2), 40-45.
Coskun, M.B., D. Yalcin and C. Ozarslan. 2006. Physical proper-ties of sweet corn seed (Zea mays saccharata Sturt.). Journal of Food Engineering, 74, 523-528.
Choi, Y. and M. R. Okas. 1986. Ef-fect of temperature and composi-tion on the thermal properties of foods in food engineering and process applications. In: Magnev, M., Jelen, P. (Eds.), Transport Phenomena, vol. I. Elsevier Ap-plied Science, London.
Deshpande, S. D., S. Bal and T. P.
Ojha. 1993. Physical properties of soybean. Journal of Agricultural Engineering Research, 56 (2), 89-98.
Dursun, E., and I. Dursun. 2005. Some physical properties of caper seed. Biosystem Engineering, 92, 237-245.
Garnayak, D. K., R. C. Pradhan, S. N. Naik and N. Bhatnagar. 2008. Moisture-dependent physical properties of Jatropha seed (Jat-ropha curcas L.). Industrial Crops and Products, 27, 123-129.
Gharib-Zahedi, S. M. T., S. M. Mousavi, A. Moayedi, A. T. Ga-ravand and S. M. Alizadeh. 2010. Moisture dependent engineering properties of black cumin (Nigella Sativa L.) seed. Agricultural En-gineering International: the CIGR journal. Manuscript 1437. Vol. XII. March.
Isik, E. and H. Unal. 2007. Moisture dependent physical properties of white speckled red kidney bean grains. Journal of Food Engineer-ing, 82, 209-216
Jain, R. K. and S. Bal. 1997. Proper-ties of pearl millet. Journal of Ag-ricultural Engineering Research, 66, 85-91.
Karababa, E. 2006. Physical proper-ties of popcorn kernels. Journal of Food Engineering, 72, 100-110.
Konak, M., K. Carman and C. Ay-din. 2002. Physical properties of chickpea grains. Biosystems En-gineering, 82 (1), 73-78.
McCabe, W. L., J. C. Smith and P. Harriot. 1986. Unit Operations of Chemical Engineering. New York: McGraw-Hill.
Mohsenin, N. N. 1970. Physical Properties of Plant and Animal Materials, 2nd ed. Gordon and Breach Science Publishers, New York.
Mohsenin N. N. 1986. Physical properties of plant and animal materials, second ed. Gordon and Breach Science Publishers, New York.
Nimkar, P. M. and P. K. Chattopad-hyay. 2001. Some physical proper-

AGRICULTURAL MECHANIZATION IN ASIA, AFRICA AND LATIN AMERICA 2017 VOL.48 NO.432
ties of green gram. Journal of Ag-ricultural Engineering Research, 80 (2), 183-189.
Ogungimi, L. A. O., N. A. Aviara and O. A. Aregbesola. 2002. Some engineering properties of locust bean seed. Journal of Food Engineering, 55, 95-99.
Ogut , H. 1998. Some physical properties of white lupin. Jour-nal of Agricultural Engineer-ing Research, 69 (3), 273-277. doi:10.1006/jaer.1997.0252.
Ojediran, J. O., M. A. Adamu and D. L. Jim-George. 2009. Some physical properties of pearl mil-let (Pennisetum glaucum) seeds as a function of moisture content. African Journal of general agri-culture, Vol.6, No.1, 39-46.
Rose, D. J. and D. K. Santra. 2013. Proso millet (Panicum miliaceum L.) fermentation for fuel ethanol production. Industrial Crops and Products, 43, 602-605.
Roshevits, R. Yu. 1980. Grasses: An introduction to the study of fodder and cereal grasses. Indian Na-tional Scientific Doc. New Delhi.
Sacilink, K., R. Ozturk and R. Kes-ikin. 2002. Some physical prop-erties of hemp seeds. Biosystem Engineering, 86, 191-198.
Seif i, M. R. and R. Alimardani 2010. The moisture content effect on some physical and mechanical properties of corn (Sc 704). Jour-nal of Agricultural Science. Vol.2. No. 4. December.
Sessiz, A., R. Esgici and S. Kizil. 2007. Moisture-dependent physi-cal properties of caper (Capparis ssp.) fruit. Journal of Food Engi-neering, 79, 1426-1431.
Sezer, I., A. Balkaya, O. Karaa-gac and F. Oner. 2011. Moisture dependent of some physical and morphological properties of dent corn (Zea mays var. Indentete Sturt) seeds. African Journal of Biotechnology, Vol.10(15), 2857-2866.
Shafiee, S., A. Modares Motlagh, S. Minaee and K. Haidarbigi. 2009. Moisture dependent physical
properties of dragons head seeds (Lallemantia iberica). Agricultur-al Engineering International: the CIGR Ejournal. Manuscript 1192. Vol. XI. June.
Sing, K. K. and K.K. Goswami. 1996. Physical properties of cum-in seed. Journal of Food Agricul-tural Engineering Research, 64, 93-98.
Singh, K. P., H. N. Mishra and S. Saha. 2010. Moisture dependent proper ties of barnyard millet grain. Journal of Food Engineer-ing, 96, 598-606.
Subramanian, S. and R. Viswana-than. 2007. Bulk density and fric-tion coefficient of selected minor millet grain and flour. Journal of Food Engineering, 81, 118-126.
Suthar, S. H. and S. K. Das. 1996. Some physical properties of kar-ingda (Citrullus lanatus (Thumb) Mansf) seeds. Journal of Agricul-tural Engineering Research, 65, 15- 22.
Swami, S. S. and S. B. Swami. 2010. Physical properties of finger millet(Eleusine Coracana). Inter-national Journal of Agricultural Engineering, Vol. 3, No. 1, 156-160.
Tabatabaeefar, A. 2003. Moisture dependent physical properties of wheat. International Agrophysics, 17, 207-211.
Tavakoli, H., A. Rajabipour and S. S. Mohtasebi. 2009. Moisture de-pendent some engineering proper-ties of soyabean grains. Agricul-tural Engineering International: the CIGR Ejournal. Manuscript 1110. Vol. XI, February.
Tavakoli, M., H. Tavakoli, A. Ra-jabipour, H. Ahmadi and S. M. T. Gharib-Zahedi. 2009. Moisture dependent physical properties of barley grains. International Jour-nal of Agricultural & Biology Engineering, Vol.2, No 4, 84-91.
Tunde-Akintunde, T. Y. and B. O. Akintune. 2007. Effect of moisture content and variety on selected physical properties of be-niseed. Agricultural Engineering
International: the CIGR Ejournal, Manuscript FP 07021, Vol.IX, No-vember.
Yalcın, D. and C. Ozarslan. 2004. Physical properties of vetch seed. Biosystems Engineering. 88(4), 507-512.
■■

VOL.48 NO.4 2017 AGRICULTURAL MECHANIZATION IN ASIA, AFRICA AND LATIN AMERICA 33
An Innovative Versatile Multi-crop Planter for Crop Establishment Using Two-wheel Tractors
byME HaqueAdjunct Associate Professor, School of Veterinary and Life Sciences, Murdoch University, Murdoch, WA [email protected]
RW BellProfessor, School of Veterinary and Life Sciences, Murdoch University, Murdoch, WA [email protected]
AKMS IslamPrincipal Scientific OfficerFarm Machinery and Postharvest Technology Divi-sionBangladesh Rice Research Institute, [email protected]
KD SayrePrincipal Agronomist, CIMMYT, Apdo. Postal 6-641, 06600 Mexico, [email protected]
AbstractA Versatile Multi-crop Planter
(VMP) was designed and built for seed and fertilizer application in lines when driven by 2-wheel trac-tors (2WT) for: single-pass shallow-tillage; strip tillage (ST); zero till-age; bed planting, and conventional tillage (CT). Field performance and operational costs were recorded and analysed in Bangladesh. Field ca-pacity of VMP was 0.07 ha/h for ST which was 34% lower than for CT. Land preparation cost by VMP was decreased by up to 75% for single pass compared to CT. VMP was capable of sowing many crops from small jute seed (2 g/1000 seeds) up to maize (160 g/1000 seeds). The VMP weighs 152 kg and ex-factory price is US$ 1,000. Accep-
tance of this multipurpose planter by smallholder farmers who prefer two wheel tractors is expected to be high.
IntroductionSmall farm sizes restrict the pur-
chase and utility of 4-wheel tractors in many parts of Asia and Africa. The wide range of opt ions for 4-wheel tractor in mechanised plant-ing is not available for 2WT that are a major form of mechanised tillage in S. Asia (Baker et al., 2007). In Bangladesh, the 2WT accounted for tillage on 75% of fields in 2001 (Meisner 2001). Mostly these have been used in fully rotary tillage mode to prepare land or puddle wet soils for transplanted rice (Oryza
sativa L.). The large numbers of 2WT operating in South Asia are evidence of considerable interest amongst small farmers in mecha-nised tillage. However, repeated full rotary tillage of soil, often practiced more than six times per year, is not favourable to maintenance of soil organic matter (SOM) and soil structure. The rapid developments in minimum tillage planting for CA using 4-wheel tractors have largely by-passed the 2WT (Baker et al., 2007). In principle, the same com-ponents, tool bars, furrow openers, seed meters, seed box, fertiliser box, etc. can be used on planters for 2WT as for 4-wheel tractors but on a smaller scale with fewer and smaller tool bars, fewer tines and at-tention to light weight construction. However, the challenge remains to
MM HossainProfessor, Department of Farm Power Machinery, Bangladesh Agricultural University, [email protected]

AGRICULTURAL MECHANIZATION IN ASIA, AFRICA AND LATIN AMERICA 2017 VOL.48 NO.434
design such planters and demon-strate their effectiveness, reliability, and durability at a price that allows ready adoption in the target market.
The developments in 2WT-oper-ated minimum tillage planters are reported in Haque et al. (2013). De-spite these promising developments, none of the present planters for 2WT are capable of planting in all modes of tillage. In diverse, inten-sive cropping systems such as in the Eastern Gangetic Plain, two or more planters are presently needed to carry out the range of minimum till-age and conventional tillage opera-tions. Hence service providers are reluctant to purchase a planter that can only be used for a narrow selec-tion of crops at a particular time of the year. The challenge is to design a multi-function planter capable of handling many crops and planting methods etc. In the present paper we describe the design, construc-tion and operation of such a planter, called the VMP. The VMP meets the above criteria and has success-fully established a diverse range of crops in Bangladesh (Haque et al., 2010).
Materials and MethodsThe VMP was powered by a
Dongfeng or Saifeng 12 - 16 horse-power 2WT but could be used with any 2WT with similar power rating. The Dongfeng or Saifeng 2WT have different but suitable hitching points to attach with the VMP. The ap-propriate planter hitching needs to be used with the particular type of 2WT. The VMP was designed with capability for seeding and fertilizing with f luted roller or vertical plate meters in lines for: 1) Single-pass shallow-tillage (SPST); 2) strip till-age (ST); 3) zero tillage (ZT); 4) bed planting (BP) (for single-pass new bed-making or re-shaping of perma-nent beds and simultaneous planting and fertilizer application); and 5) conventional tillage (CT) using full rotary tillage following broadcast seeding and fertiliser spreading.
The rotary shaft is operated by the 2WT at 250 or 375 rpm through a chain and gear mechanism. The power transmission chain box is lo-cated on the right side of the planter with 14 teeth on the upper sprocket attached to the drive shaft and 13 teeth on the lower sprocket attached to the rotary shaft. Rotary shaft and blades are covered by a metal sheet fitted with a clearance of 240 mm
from the shaft. The net weight of VMP is 152 kg and its overall di-mensions are length 990 mm, width 1220 mm, and height 840 mm (Fig. 1). The VMP is mounted on a 700 mm toolbar attached through side arms and connecting rods to the main handle of the 2WT. Seed and fertiliser boxes are mounted on the toolbar, as the cover of the rotary shaft. This allows for seeding and fertilizing in four adjustable lines if row spacing is 200 mm, down to a single row in case of maize sown in 600-700 mm rows. The seed box is fitted with four seed meters. Either f luted roller or vertical plate seed meters can be fitted depending on the level of precision in seed place-ment required. Seed rate can be ad-justed by sprocket size in the case of vertical plate meters. Sprocket sizes range from 10-40 teeth giving 5 set-tings for seed rate and seed size. For the f luted seed meter, seed rate is varied by adjusting the length of the flutes by a handle. By fitting seed meters with 4, 8, or 16 flutes, deliv-ery of different-sized seed can be regulated. The fertiliser box is made from the same iron sheet and has the same external dimensions as the seed box. The fertiliser box is fitted with four fluted meters with eight or four flutes.
Seed meters are attached to a shaft and fertiliser meters to a sepa-rate shaft. The power for the ferti-liser meters comes from the 2WT differential shaft, through a chain driven by a 19-teeth sprocket and is relayed to the seed meter shaft through a chain and sprocket. The furrow openers are each attached on the toolbar by two U-clamps along with bolts and plate. Seed and fertiliser delivery tubes made of 27 mm diameter clear polypropylene pipe join behind the furrow opener. A pressing roller 670 mm long with 127 mm diameter (Fig. 1) is at-tached behind the furrow openers by a pair of arms 560 mm long. The photographs illustrating the VMP (Fig. 1) are for the 4th version. Sub-
(1)(2)
(3)(4)(5)(6)(7)(8)
1: Seed box, 2: Fertilizer box, 3: Seed delivery tube, 4: Toolbar frame5: Fertilizer delivery tube, 6: Depth contoroller, 7: Press roller, 8: Furrow opener
Fig. 1 Versatile Multi-crop Planter attached (marked in dash line) to 2WT in strip tillage mode

VOL.48 NO.4 2017 AGRICULTURAL MECHANIZATION IN ASIA, AFRICA AND LATIN AMERICA 35
sequent versions involved changes to seed metering so externally the later generations have the same ap-pearance as shown. The reasons for changes made to earlier generations are outlined below in results.
Data CollectionSeed calibration
Seed rate was calibrated over a 20 m travel distance with an 800 mm sowing width. This procedure was used to calibrate the VMP for a range of species (Table 1) before planting in the fields. Data on labour requirement, operational time, time loss, and field capacity were record-ed during the field operation. The time losses due to turning, clogging and operators' personal needs were also recorded. Field capacity was determined using the formulae of Hunt (1973).Field trials with lentil, chickpea, mung bean, black gram, maize, and direct seeded rice
The field trials with lentil, chick-pea, mung bean, and black gram were established at the High Barind Tract, Rajshahi; and the maize and direct-seeded monsoon rice were established at the Bangladesh Sug-arcane Research Institute, Gazipur, Bangladesh. The treatments were arranged in a randomized complete block (RCB) design with three rep-
lications. Treatments for the trials of lentil, chickpea, mung bean, and black gram were i) CT, ii) SPST, iii) ZT, iv) ST, and v) BP. In the case of maize trial, the treatments were i) VMP with vertical disk seed meter in SPST planting mode, ii) Earthway planter in soils that had been tilled four times, and iii) hand planted in soils that had been tilled four times. Two tillage treatments i) SPST and ii) ZT were used in the case of the direct-seeded rice trial. Data on operational capacity of the seed box and coverage per full seed box of different species; plant popu-lation/m2; fuel consumption, field capacity, labour requirement, cost of land preparation and seeding, etc. were collected from trials of lentil, chickpea, mung bean, and black gram; and spacing between adjacent maize plants and rice hills, etc. was determined. Data were analysed sta-tistically using one-way analysis of variance (ANOVA) with MSTAT-C. Means were compared with least significant difference (LSD) test at P < 0.05.
ResultsThe following results are based on
4th and 6th versions of VMP. After version 4, changes focussed on seed
metering improvements. Version 6 replaced fluted rollers with vertical plate seed meters.
Blade Arrangement for Different Tillage Operations
By contrast with the standard rotary tiller that has blades bolted at f ixed positions; the VMP has flexible blade positioning. This was achieved by replacing the round shaft with a square shaft and then designing brackets that can be flex-ibly re-positioned across the shaft while holding two or four blades each. The sliding of the bracket sideways without blade removal enables row spacing to be adjusted quickly in the field according the crop requirements. The previous rotary shaft had to be dissembled in a workshop if the row spac-ing was to be changed. Hence the square shaft and brackets designed for the VMP achieve improved f lexibility for multi-crop planting and capacity for rapid adjustment of row spacing on a field-by-field basis. For SPST planting, 32 blades are attached on eight brackets (Fig. 1), evenly spread across the shaft. Blades alternate between left and right twist. For ST, one bracket containing 2-4 blades is retained for each furrow opener. Blade size with either straight or twisted shape provided strip tillage to 140 mm depth and 100 mm width. Settings for bed shaping involve a decrease in the wheel-base from 740 to 600 mm (centre-to-centre) by f lipping each wheel around and re-bolting to the axle. The centre line of the wheel is then aligned with both the outer blade and the outer edge of the cones used to shape beds. For newly-formed beds, blades are ar-ranged with longer blades (230 mm) on the outer six brackets (holding 24 blades altogether) and with a twist that throws soil towards the centre of the bed. Shorter blades (155 mm) with alternate left and right twist are fitted to the two central brack-ets. For re-shaping of old beds, only
Species Seed size (g/1000 seed)
Seed rates(kg/ha)
Carrying capacity of full seed box (kg)
Planted area per full seed box
(ha)Maize 160 18 21 1.17Chickpea 138 34 20 0.67Wheat 52 120 18 0.15Mung bean 45 40 20 0.59Lentil 20 34 22 0.65Rice 18 30 15 0.67Mustarda
(Brassica spp.) 3.7 8 17 2.13
Sesamea
(Sesamum indicum.) 2.7 6 14 2.27
Jutea
(Corchorus capsularis) 2 5.5 17 3.05a Rice husk at a 1:1 ratio was added with small seed to increase the volume
for sowing using the fluted meter.
Table 1 The operating capacity of the seed box and coverage per full seed box of the VMP when used to sow a range of species with different seed sizes and seed rates

AGRICULTURAL MECHANIZATION IN ASIA, AFRICA AND LATIN AMERICA 2017 VOL.48 NO.436
the two or three outer brackets on each side of the rotary shaft retain the long blades, while all blades on the three or four inner brackets may be retained. If there is little residue or weeds on the beds, only the lon-ger outer blades need to be fitted to throw soil from the furrow on to the bed to re-shape it. The VMP can be operated in ZT mode with blades re-tained to clear some residue, but the furrow openers need to be set deep enough to ensure sufficient clear-ance of the blades above the soil and residue.
Seed MeteringSeveral types of seed metering
device have been tested leading to the vertical plate device in the 6th version VMP. The vertical plate is modelled on the Earthway Garden Planter (from USA). It is made from moulded plastic in 5 different aper-
ture sizes to accommodate seed siz-es from 2 to 160 g seeds/1000 (Ta-ble 1). However, if continuous seed dropping is preferred, the f luted rollers are satisfactory and cheaper. Among tillage treatments, no sig-nificant difference was observed in the case of lentil and chickpea emer-gence after seed metering using the f luted roller; however, significant improvements were observed for emergence of mung bean and black gram compared to CT (Table 2).
Field Operation and CostsField capacities of CT, SPST, ST,
ZT and BP were 0.11, 0.07, 0.07, 0.06 and 0.05 ha/h, respectively (Table 3). Field capacity of CT was higher (0.11 ha/h) since broadcast seeding did not require precision seed alignment like row planting. Fuel consumption was higher with CT (33.1 l/ha) and lowest in ST (5.83
l/ha) by VMP (Table 3). The SPST, ST, ZT and BP by VMP saved 38, 82, 50 and 13% diesel fuel over CT. The maximum cost (US$ 41.47/ha) of land preparation and seeding was incurred in case of CT system and the lowest (US$ 10.27/ha) for ST systems (Table 3). Compared to CT, planting by SPST, ST, ZT, and BP systems lowered costs by 52, 75, 23, and 13%, respectively (Table 3).
Planting Options, Methods, Spe-cies, and Seed Rate
Seeding has been tested for the different crops, in order of increas-ing seed size: jute, sesame, mustard, lentil, mung bean, rice, wheat, black gram, chickpea and maize. The vertical plate seed meter with VMP was evaluated when planting by ZT and SPST systems to sow direct-seeded monsoon rice. In the case of SPST by VMP about 78% of rice plants were spaced between 160 and 250 mm apart (mean 187; SE ± 7.6 mm) in a single-pass operation. The establishment of plants by ZT plant-ing with the VMP achieved 70% at 160-250 mm apart (mean 170; SE ± 8.7 mm). With vertical plate seed meter in VMP, about 96% of maize plants were placed 180 to 260 mm apart (mean 205 mm; SE ± 3.9 mm) with a single-pass operation. The spacing between plants was less even (mean 231 mm; SE ± 6.7 mm) in the case of maize planted by hand in well-prepared land after four tillage operations. However, the maize planted by Earthway planter performed slightly better (mean 215 mm; SE ± 2.3 mm) compared to the vertical plate seed meter of VMP. The vertical plate seed meter has a tendency to drop more seed at <170 mm spacing than the Ear thway Planter.
DiscussionThe 6th version of VMP ex-
factory price is ~US$ 1,000 per unit. Further reductions in cost are
Crop CT SPST ZT ST BP CV, % SignificanceLentil 25 100 178 171 - 59.9 NSChickpea 56 55 47 57 31 24.7 NSMung bean 27c 145ab 121b 209a 101b 20.5 **Black gram 22b - 99a 93a 52ab 29.6 **Values in a row, followed by a common letter are not significantly different at P < 0.01 by Duncan's Multiple Range Test.
Table 2 Plant populations (plants/m2) established using the fluted type seed meter on the VMP for lentil, chickpea, mung bean and black gram sowing in CT, SPST, ZT,
ST, and BP at the High Barind Tract, Rajshahi, Bangladesh.
Table 3 Effect of tillage mode by the Versatile Multi-crop Planter on fuel consumption, field capacity, labour requirement and cost of land preparation and seeding of lentil, chickpea, mung bean and black gram in clay soil at High Barind
Tract, Rajshahi, Bangladesh, 2010-11.
Tillage type Field capacity(ha/h)
Fuel consumption
(l/ha)
Labour requirement, (person-h/ha)
Cost of land preparation and
seedinga, (US$/ha)Conventional
tillage 0.11a 33.1a 48.1a 41.5a
Single pass shallow tillage 0.07b 20.6c (38) 15.4c (68) 19.8d (52)
Strip tillage 0.07b 5.83e (82) 15.3c (68) 10.3d (75)Zero tillage 0.06b 16.6d (50) 17.3c (64) 18.1c (23)Bed planting 0.05b 28.9b (13) 23.9b (51) 28.8b (13)CV, % 31.9 30.8 45.4 26Significance ** ** ** **Values in the parenthesis indicate the percent saving over CT.Values in a column, followed by a common letter are not significantly different at P < 0.01 by Duncan's Multiple Range Test.aConsidering variable costs for labour (land preparation @Taka 30 and seeding @Taka 20/ha); diesel fuel (@Taka 45/l). 1 US$ = 68 Taka

VOL.48 NO.4 2017 AGRICULTURAL MECHANIZATION IN ASIA, AFRICA AND LATIN AMERICA 37
possible with increased scale of production. Moreover, if continuous seeding rather than spaced planting is acceptable, a further reduction in price to US$ 600 could be achieved by fitting only fluted rollers rather than the vertical plate seed meter. The VMP is fully fabricated in Ban-gladesh. Three manufacturers have begun production, commercialisa-tion and scale-up. To date a total of more than 120 units have been sold including 40 to international buyers in India, Mexico, Uganda, Ethiopia, Tanzania, Zimbabwe and Vietnam. With the VMP, an operator can adjust row spacing using a span-ner in the field. In two seasons of planting, contractors have sown 132 ha comprising nine crop species. No serious concerns about planter performance, operation or reliabil-ity have been identified. The multi-functional, multi-crop capabilities of VMP allow it to be used all year round in intensive crop rotations. In the dry season, planting of rainfed and irrigated crops has been accom-plished on alluvial soil as well as the hard-setting High Barind Tract soil (Haque et al., 2010). In the early wet season, mung bean, black gram and direct seeded rice have been planted successfully. The VMP shaped permanent beds and is able to re-shape beds for each crop in a rotation. The flexibility of VMP and adaptability for a range of crops and planting methods means that service providers can feasibly make a year-round business from hiring a VMP for planting farmers’ crops. Miah et al. (2010) reported that using of the 2WT-mounted Chinese planter in SPST mode was highly profitable as a business for service providers with the capacity of year-round op-eration. A similar business model should be applicable to the VMP.
Clear gains in fuel efficiency were obtained with the VMP, but essen-tially all the single-pass modes of planting were fuel-saving compared to CT. The field capacity of 0.07 ha/h for ST was comparable to rates
with the SPST planter (Hossain et al., 2005). Hence in a single day’s operation about 1 ha can be planted by the VMP in ST and SPST modes. Erenstein & Laxmi, (2008) reported the net benefit of ZT over CT aver-ages US$ 97/ha across the Indo-Gangetic Plains with the contribu-tion from the cost saving effect (53%) being slightly higher than the yield improvement (47%). The present study with 2WT and VMP reported that the ZT cost saving ef-fect averages US$ 52/ha across the experiments and crops. Brief results in the present paper show similar or greater plant populations of chick-pea and mung bean established using VMP in single pass planting (ST, ZT, and BP) using a fluted roll-er seed metering compared to CT.
China (10 million), Thailand (3 million), Bangladesh (0.45 million) and Sri Lanka (0.12 million) have the highest usage of 2WT (Anony-mous, 2011). Parts of Africa have begun importing Chinese tractors and Nigeria may have close to 1,000. Southern Germany, northern and southern Italy, and many countries of central Europe also have signifi-cant numbers of 2WT (Anonymous, 2011). Hence the potential for appli-cation of minimum tillage planters with these 2WTs is extensive. Plant-ers such as VMP could be used to develop CA practices across a wide range of cropping systems used by smallholder farmers in Asia and Af-rica (Johansen et al., 2012).
ConclusionThe VMP is a unique mult i-
functional and multi-crop planter powered by 12-16 hp 2WT with capability for seed and fertilizer ap-plication in variable row spacing us-ing SPST, ST, ZT, BP, and CT. The square shaft and brackets designed for the VMP achieve improved flex-ibility for multi-crop planting and capacity for rapid adjustment of row spacing on a field-by-field basis. By
using the VMP, the establishment costs for various crops in different tillage systems were significantly reduced compared to CT. Plant-ers such as VMP could be used to develop CA practices across a wide range of cropping systems used by smallholder farmers in Asia, Africa and other regions.
AcknowledgementsThe authors gratefully acknowl-
edged the funding contr ibution of ACIAR (LWR 2005/001) and CIMMYT for research and develop-ment of the VMP. The authors also acknowledge the following persons who continuously supported through technical advice and constructive criticism of the development of VMP: RJ Esdaile, C Johansen, MA Musa, M Nur Nobi, Alam Engineer-ing Workshop, service providers and VMP users.
REFERENCES
A n o n y m o u s . 2 0 11 . h t t p : / /en .wi k iped ia .org /wi k i /Two -wheel_tractor#Bangladesh.
Baker, C. J., and K. E. Saxton. (Eds.) 2007. No-tillage Seeding in Conservation Agriculture. (2nd ed.) CAB International and Food and Agriculture Organization of the United Nations, Italy. 326 pp.
Erenstein O, and V. Laxmi. 2008. Zero tillage impacts in India’s rice-wheat systems: a review. Soil Till. Res. 100, 1-14.
(Continued on page 44)

AGRICULTURAL MECHANIZATION IN ASIA, AFRICA AND LATIN AMERICA 2017 VOL.48 NO.438
Development of Pneumatic Assisted Electronically Controlled Automatic Custard Apple Pulper
byV. Eyarkai NambiScientistCentral Institute of Post Harvest Engineering and Technology (CIPHET) [email protected]
R.K.GuptaDirector, CIPHET, PunjabINDIA
R. K. ViswakarmaSenior ScientistCIPHETPunjabINDIA
R. A. KausikProfessorRajasthan Agriculture college Maharanapratap Agricultural UniversityUdaipur, RajasthanINDIA
AbstractCustard apple (Annona squamosa
Z,.), popularly known "sitaphal" in India is a most delicious and favou-rite fruit of the tropics. Extraction of pulp is a major constraint in pro-cessing of custard apple fruits. An automatic custard apple pulper was developed with the capacity of 100-120 kg/h. The machine comprises of three main mechanisms viz. fruit cutting mechanism, fruit scooping mechanism and pulping mecha-nism. Performance evaluation of the developed custard apple pulper machine was done with different
pulping shaft speeds (100, 300, 500, 600 and 800 rpm), different pulping chamber inclination (19°, 23°, 27° and 29°) with two types of beater along with 3 type of pulping sieve. The higher amount of coarse pulp recovery has been observed with inclined slotted sieve with the shaft speed of 600 rpm along with 29° pulping chamber inclination.
IntroductionThe world is presently over-
dependent on a few plant species. Through many underutilized food crops prevail throughout the world, production and consumption of most of the underutilized food crops are dominant in South East Asia and Africa. Diversification on pro-duction and consumption habits, In particular those currently identified underutilized crops, can contribute significantly to improve nutrition and health, livelihoods, house hold food security and ecological sustain-ability, therefore have an important role in supporting social diversity.
The International Centre for Un-der-utilized Crops listed some of the fruits crops as underutilized crops at global level and identified limiting factor for those crops. Some of the identified major limiting factors are limited post-harvest knowledge for harvesting, handling and transport-ing techniques. (Dainiel, J. N. and Dudhode, P. A. 2007) Among the identified underutilized fruit crops, Custard apple (Fig. 1), Aonla and Ber are gaining commercial interest due to its nutritional value, medici-nal properties and the suitability for processing into a wide range of products.
Custard apple (Annona squamosa Z,.), popularly known "sitaphal" in India is a most delicious and fa-vourite fruit of the tropics. Custard apple is cultivated in more than one lakh hectares in India (Chahal et al. 2008). In fact custard apple fruits are collected from either wild plantation or from orchards which hardly receive any care. Majority of the custard apple today is as wild plantations in tribal areas. The fruit Fig. 1 Custard Apple Fruits

VOL.48 NO.4 2017 AGRICULTURAL MECHANIZATION IN ASIA, AFRICA AND LATIN AMERICA 39
trees not only produce protective food but also provide assured in-come for livelihood in the drought prone dry lands since it is drought tolerant and it grows well with low rainfall. However, lack of efficient processing techniques and non-pop-ularity of processed products from custard apple leads to huge wastage of produced mass.
Custard apple is one of the deli-cious fruits relished by many for table purposes in India. Pleasant f lavour, mild aroma and sweet taste have a universal acceptance. Despite being fruit of choice, due to the large number of seeds, poor shelf life and lack of processing technology, custard apple is not cult ivated in large commercial orchards. Moreover it is very per-ishable and have a very short post-harvest life; therefore they require efficient storage techniques (Coro-nel, 1994). Ripe fruits can be kept at room temperature for one day only (Salunkhe and Desai, 1984), while immature fruits stored below 15°C develop chilling injury, resulting in an unpleasant appearance (Tsay and Wu, 1989). It is observed that more than 75% of fruits produced in tribal areas go waste after harvesting due to inefficient storage techniques and short shelf life of fruits (Chahal et al. 2008). Further, there is no orga-nized marketing for custard apple in India. These factors lead to huge economic losses to the arid and semi-arid region tribal farmers.
Attempts to enhance the post-harvest life of these fruits must take
into account ripening physiology, physical chemical aspects of fruit quality, harvest and post-harvest handling. Custard apple fruits can be stored at 15 to 20°C with low oxygen and ethylene tensions, com-bined with 10% C02 and 85 to 90% RH (Broughton and Tan, 1979).
Custard apple fruits can be pro-cessed and used in the preparation of nectars, drinks, sherbets, ice-cream, syrup etc. Development of enzymatic browning within an hour of pulp extraction, bitterness, un-pleasant repulsive off-flavour in the pulp on heating beyond 65°C and presence of gritty cells are problems encountered during processing of fruits.
Extraction of pulp is a major constraint in processing of custard apple fruits. Manual pulp extrac-tion has been tried which leads to browning in short time. Pulpers are available in the market suitable for extraction of juice/pulp from citrus fruits, mango, guava etc. There is no pulping machine exists that can be used to safely remove the pulp specifically from the custard apple (Chahal et al. 2008).
Under this scenario of custard apple typically in India need to be considered for research and devel-opment particularly in handling and processing to improve the socio- economic condition of the arid and tribal farmers. With this purview the main objective of this study was to develop a custard apple pulper which would be suitable for small and medium scale processing.
Material and Method The underutilized fruits are be-
ing underutilized till today because of lack of handling and processing machineries. So-far very few re-searchers reported about handling machineries for underutilized fruits. Eyarkai nambi et al. (2012a), re-ported about an automatic machine for removing the seeds continuously
from the aonla fruits. In literatures, the reports about the handling and processing machines for custard apple are merely nil.
Based on the previous empirical knowledge and preliminary labo-ratory trails, a prototype machine (Fig. 2) was developed at Central Institute of Post Harvest Engineer-ing and Technology (CIPHET), Abohar. In order to completely mechanize the handling and pro-cessing of custard apple fruits, the whole process were divided into three main unit operations viz. Cut-ting the fruit, peel separation and pulp & seed separations. Then each operations were addressed to de-velop a mechanism and the machine parameters were optimized. Some of the machine parameters like pulping chamber inclination, speed of the pulping shaft and the type of the beater were affected the pulping efficiency of custard apple pulp-ing machine (Eyarkai nambi et al. 2012b).
Based on the selected unit opera-tion, the whole machine were divid-ed into 3 main parts, these are fruit cutting mechanism, fruit scooping mechanism and pulping mechanism. Fruit cutting and scooping mecha-nism were made with pneumatic actuators and electronic controls. This invention is fully automatic machine, assisted with pneumatic power and electronic controllers. The detail dimensions were not given with this paper, since this machine has been filed for grant of patent under Indian IPR.
Fruit Cutting MechanismThis part contains two opposite
rotating rollers with fruit holding cups (Fig. 3). The fruit holding cups are arranged in a way that the fruit is held and guided without any dam-age while cutting and falling over the guide plate, which is provided below the cutting mechanism. The cutting knife is attached with pneu-matic actuator (25 mm diameter and 100 mm displacement) along with Fig. 2 Custard Apple Pulper
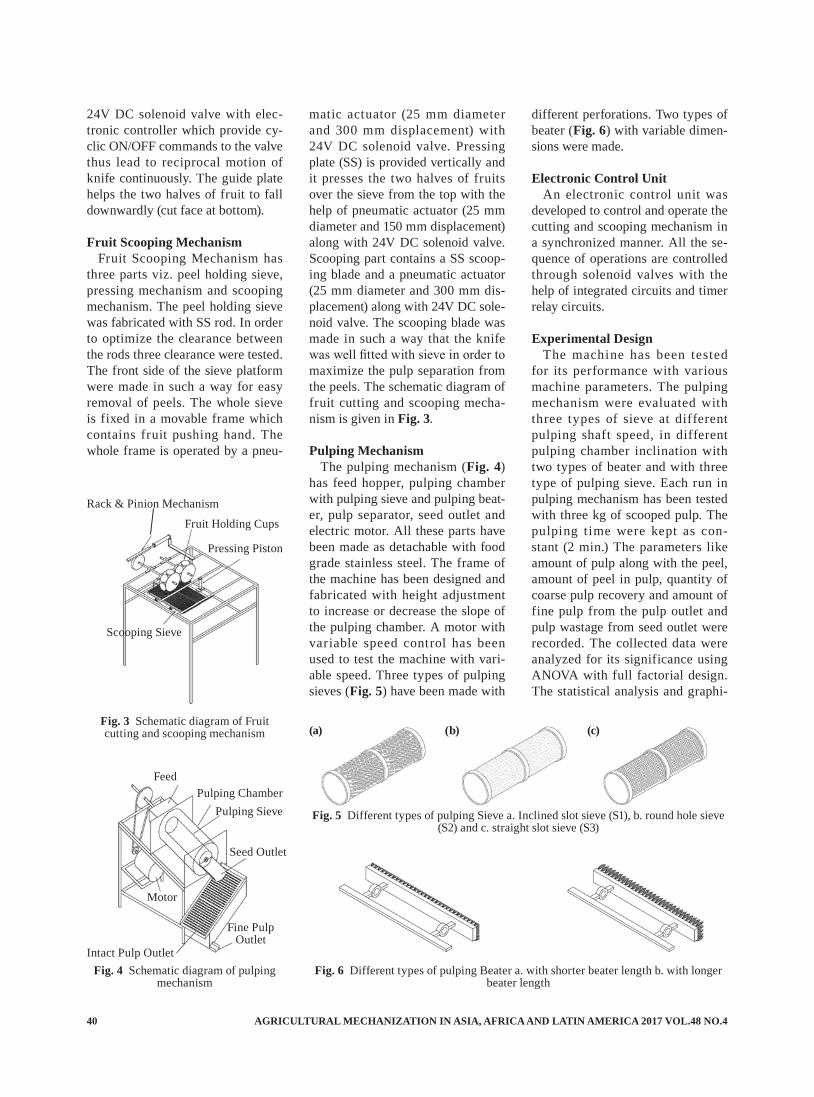
AGRICULTURAL MECHANIZATION IN ASIA, AFRICA AND LATIN AMERICA 2017 VOL.48 NO.440
24V DC solenoid valve with elec-tronic controller which provide cy-clic ON/OFF commands to the valve thus lead to reciprocal motion of knife continuously. The guide plate helps the two halves of fruit to fall downwardly (cut face at bottom).
Fruit Scooping MechanismFruit Scooping Mechanism has
three parts viz. peel holding sieve, pressing mechanism and scooping mechanism. The peel holding sieve was fabricated with SS rod. In order to optimize the clearance between the rods three clearance were tested. The front side of the sieve platform were made in such a way for easy removal of peels. The whole sieve is fixed in a movable frame which contains fruit pushing hand. The whole frame is operated by a pneu-
matic actuator (25 mm diameter and 300 mm displacement) with 24V DC solenoid valve. Pressing plate (SS) is provided vertically and it presses the two halves of fruits over the sieve from the top with the help of pneumatic actuator (25 mm diameter and 150 mm displacement) along with 24V DC solenoid valve. Scooping part contains a SS scoop-ing blade and a pneumatic actuator (25 mm diameter and 300 mm dis-placement) along with 24V DC sole-noid valve. The scooping blade was made in such a way that the knife was well fitted with sieve in order to maximize the pulp separation from the peels. The schematic diagram of fruit cutting and scooping mecha-nism is given in Fig. 3.
Pulping MechanismThe pulping mechanism (Fig. 4)
has feed hopper, pulping chamber with pulping sieve and pulping beat-er, pulp separator, seed outlet and electric motor. All these parts have been made as detachable with food grade stainless steel. The frame of the machine has been designed and fabricated with height adjustment to increase or decrease the slope of the pulping chamber. A motor with variable speed control has been used to test the machine with vari-able speed. Three types of pulping sieves (Fig. 5) have been made with
different perforations. Two types of beater (Fig. 6) with variable dimen-sions were made.
Electronic Control UnitAn electronic control unit was
developed to control and operate the cutting and scooping mechanism in a synchronized manner. All the se-quence of operations are controlled through solenoid valves with the help of integrated circuits and timer relay circuits.
Experimental DesignThe machine has been tested
for its performance with various machine parameters. The pulping mechanism were evaluated with three types of sieve at different pulping shaft speed, in different pulping chamber inclination with two types of beater and with three type of pulping sieve. Each run in pulping mechanism has been tested with three kg of scooped pulp. The pulping time were kept as con-stant (2 min.) The parameters like amount of pulp along with the peel, amount of peel in pulp, quantity of coarse pulp recovery and amount of fine pulp from the pulp outlet and pulp wastage from seed outlet were recorded. The collected data were analyzed for its significance using ANOVA with full factorial design. The statistical analysis and graphi-
Fruit Holding Cups
Rack & Pinion Mechanism
Pressing Piston
Scooping Sieve
FeedPulping Chamber
Pulping Sieve
Seed Outlet
Fine PulpOutlet
Intact Pulp Outlet
Motor
Fig. 3 Schematic diagram of Fruit cutting and scooping mechanism
Fig. 4 Schematic diagram of pulping mechanism
(a) (b) (c)
Fig. 5 Different types of pulping Sieve a. Inclined slot sieve (S1), b. round hole sieve (S2) and c. straight slot sieve (S3)
Fig. 6 Different types of pulping Beater a. with shorter beater length b. with longer beater length

VOL.48 NO.4 2017 AGRICULTURAL MECHANIZATION IN ASIA, AFRICA AND LATIN AMERICA 41
cal representations were done using JMP software package.
Results and Discussion The machine has been taken to
Maharana Pratap Agricultural Uni-versity, Udaipur for testing. Based on the experimental full factorial design, the machine was evaluated.
Performance Evaluation of Cut-ting and Scooping Mechanism
The whole fruits were fed directly on the feed hopper. The cutting mechanism had worked as desired. In order to optimize the scooping mechanism, the peel holding sieve were tested with three clearances
(10 mm, 12.5 mm & 15mm). This range was fixed based on the pre-liminary study about the geometri-cal properties of the seeds and peels. The amount of peels in pulp outlet and the amount of pulp in peel outlet were measured. The observed data were plotted and given in Fig. 7.
Our aim was to get lower pulp wastage along with peels and to get lower the peel mixture in the pulp outlet. From the Fig. 7, it could be concluded that 12.5 mm clearance has given the optimum condition with low pulp wastage and peel mixture.
Performance Evaluation of Pulp-ing Mechanism
The pulping mechanisms were tested based on the full factorial
design. The mecha-nism was evaluated with three main de-pendent variables viz. quantity of coarse pulp recovery, amount of fine pulp in pulp outlet and amount of pulp in seed outlet. Amount of seeds in pulp outlet was avoided as a dependent
variable, because very negligible quantity were observed in prelimi-nary trials. The seed damage was almost nil in all the cases. Due to the commercial value for the coarse pulp is higher than the fine pulp, our interest was to get higher amount of coarse pulp rather than fine pulp. The collected data were analyzed for its significance using ANOVA and the consolidated ANOVA Table with 3 level interaction is given in Table 1. Among the machine pa-rameter, the type of sieve, speed of the pulping shaft and the inclina-tion of the pulping chamber were observed as highly significant on pulping process whereas type of beater was non- significant over the pulping process (Table 1).
Effect of Machine Parameters on Pulping
The speed of the pulping shaft has been fixed in 5 limits of 100, 300, 500, 600 and 800 rpm and tested with the three different sieve types. The interaction effect between the pulping shaft speed and type of sieve on pulping process were shown as box plot in Fig 8. It was observed that the quantity of coarse pulp was increasing with increase in shaft speed. At the same time, the quantity of pulp in seed outlet were decreasing with increase in shaft speed. Among the different type of sieve, sieve S1 had shown higher coarse pulp recovery rather than S2 and S3. The sieve S2 had shown higher fine pulp recovery than sieve S1 and S3. From the Fig. 8 it can be observed that there is a clear sweep of sieve S1 over sieve S2&S3 in terms of coarse pulp recovery. No significant difference was observed between the pulping shaft speed of 600 and 800 rpm in case of coarse pulp recovery.
The pulping chamber inclination has been fixed in 4 levels viz. 190, 230, 270 and 290. The interaction effect between the pulping shaft speed and pulping chamber inclina-tion on pulping process were shown
SourceSig.(p-value)
Amount of fine pulp
Amount of coarse pulp
Amount of pulp in seed outlet
Corrected Model 0.000** 0.000** 0.000**Intercept 0.000** 0.000** 0.000**Sieve 0.000** 0.000** 0.000**Beater 0.155 0.042* 0.022*Speed 0.000** 0.000** 0.000**Inclination 0.000** 0.000** 0.000**Beater × Inclination 0.101 0.003** 0.178Sieve × Beater 0.338 0.062 0.097Beater × Speed 0.217 0.17 0.309Sieve × Inclination 0.051 0.000** 0.183Speed × Inclination 0.000** 0.016* 0.000**Sieve × Speed 0.002** 0.002** 0.013*Sieve × Beater × Inclination 0.739 0.005** 0.247Beater × Speed × Inclination 0.021* 0.731 0.291Sieve × Beater × Speed 0.342 0.335 0.212Sieve × Speed × Inclination 0.591 0.015* 0.134**significant at 99%* significant at 95%
Table 1 Consolidated ANOVA table with 3 factor interaction
Fig. 7 Effect of sieve clearance on amount of pulp in peel and amount peel in pulp

AGRICULTURAL MECHANIZATION IN ASIA, AFRICA AND LATIN AMERICA 2017 VOL.48 NO.442
Fig. 8 Effect of pulping shaft speed and sieve type on a) amount of coarse pulp in pulp outlet, b) amount of fine pulp in
pulp outlet, c) amount of pulp in seed outlet
Fig. 9 Effect of pulping shaft speed and pulping chamber on a) amount of coarse pulp in pulp outlet, b) amount of fine pulp
in pulp outlet, c) amount of pulp in seed outlet
a)
b)
c)
a)
b)
c)

VOL.48 NO.4 2017 AGRICULTURAL MECHANIZATION IN ASIA, AFRICA AND LATIN AMERICA 43
as box plot in Fig 9. An increasing trend were observed in coarse pulp recovery with increase in chamber inclination. Higher coarse pulp re-covery and lower fine pulp recover were found at 290 inclination. The amount of pulp in seed outlet was almost similar for the pulping cham-ber inclination 270 and 290. The interaction effect between the sieve type and pulping chamber inclina-tion on pulping were shown as box plot in Fig. 10. From the Fig. 10, it can be concluded that the higher coarse pulp recovery with lower fine pulp and less pulp in seed outlet were found with sieve S1 along with higher pulping chamber inclination. Since the beater type had not shown the significant effect on pulping (Table 1), the box plot was not plot-ted for the beater type.
Optimization of Machine Param-eters
Based on the full factorial analy-sis, the sieve S1(inclined slotted) with the pulping chamber inclina-tion of 290 along with the pulping shaft speed of 600 rpm had given the best optimum results. Further increase in the inclination (more than 290) may lead to more pulp wastage in seed outlet. Same way the higher speed of the pulping shaft may not be useful in case of coarse pulp recovery. Fine pulp is needed for the preparation of processed bev-erages, for that sieve type S2 along with all other optimized machine parameters would be useful. Lower the perforation size may increase the yield of fine pulp. With these optimized condition, the capacity of the machine was calculated as 100-120kg/hr. The calculated intact pulp recovery was 80-82% and the rest were fine pulp.
Conclusion An automatic custard apple pulper
was developed with the capacity of 100-120kg/h. The machine com-
Fig. 10 Effect of sieve type and pulping chamber on a) amount of coarse pulp in pulp outlet, b) amount of fine pulp in pulp outlet, c) amount of pulp in seed outlet
a)
b)
c)

AGRICULTURAL MECHANIZATION IN ASIA, AFRICA AND LATIN AMERICA 2017 VOL.48 NO.444
prises of three main mechanisms viz. fruit cutting mechanism, fruit scooping mechanism and pulping mechanism. Performance evalua-tion of the developed custard apple pulper machine was done with 5 different pulping shaft speeds, 4 dif-ferent pulping chamber inclination with two types of beater along with 3 type of pulping sieve. The higher amount of coarse pulp recovery has been observed with inclined slotted sieve with the shaft speed of 600 rpm along with 290 pulping cham-ber inclination. The calculated in-tact pulp recovery was 80-82% and the rest were fine pulp.
AcknowledgementNational Agricultural Innovation
Project (NAIP), Indian Council of Agricultural Research (ICAR) for funding the subproject entitled ‘‘A Value Chain on Commercial Ex-ploitation of Underutilized Fruits of Tribal Zones of Rajasthan’’Intellectual Property Right(IPR)
The entire machine with the pro-
cess were filed for the grant of pat-ent in Indian (3050/DEL/2011)
REFERENCE
Broughton, W. J. and G. Tan. 1979. Storage conditions and ripening of the custard apple (Annona squa-mosa). Scientia Horticulturae, 10: 73-82.
Chahal.S. S, R. A. Kaushik, N. S. Rathore and Sunil Pareek. 2008. A value Chain on Commercial Exploitation of Under Utilized fruits of traibal zones of rajasthan. NAIP project document, MPUAT, Udaipur, Rajasthan.
Coronel, R. E. 1994. Atis. In: Prom-ising Fruits of the Philippines. College of agriculture university of Philippines los banos laguna Philippines page 1-18
Dainiel, J. N. and P. A. Dudhode. 2007. Analysis of economic char-acteristics of value chains of three under-utilized fruits of India. Re-search Report No.3 International Centre for Underutilized Crops, Colombo, Sri Lanka.
Eyarkai Nambi.V., K. Thagavel, D. Manohar Jesudas. 2012a. A pneumatic assisted electronically controlled continuous aonla seed removing machine, Agric Eng Int: CIGR Journal Vol. 14, No. 2, pages 94-101
Eyarkai Nambi.V, R. K.Gupta, R. K. Viswakarma. 2012b. Stud-ies on effect of machine param-eters on pulping of custard apple fruit, paper presented at National Workshop on “A value Chain on Commercial Exploitation of under Utilized fruits of arid and semi-arid region”, 20-21st march 2012. Punjab, India.
Salunkhe, D. K and B. B. Desai. 1984. Custard apple and jujube. Post Harvest Biotechnolgoy of Fruits II CRC Press, Boca Raton.Page 133-135
Tsay, L. M. and M. C. Wu. 1989. Studies on the postharvest of sug-ar apple. Acta Horticulturae, 285: 287-294
■■
(Continued from 37)Haque, M. E., R. Esdaile, Jeff, Ka-
bir, Enamul, Vance, Wendy, Bell, W. Richard, Musa, M. A., Sha-hidullah, A. K. M., Maruffuza-man, M., & Johansen, Chris. 2010. Minimum-tillage, mechanized sowing of pulses with two-wheel tractors. Proc. Int. Conf. 19th World Congress of Soil Science: Soil Solutions for a Changing World (pp. 156-159). Ed. R.J. Gil-kes and N. Prakongkep. Published on DVD. Australian Society of Soils Science, Brisbane, Austra-lia.
Haque, M. E., S. R. Nabila and R. W. Bell. 2013. Smallholders mini-mum tillage planter adoption in Bangladesh: A successful case of private sector involvement for technology commercialization. In
Water, Environment and Agricul-ture: Challenges for Sustainable Development. Proceedings. Eds N. Lamaddalena, M. Todorovic and L. S. Pereira.CIHEAM-Insti-tute of Agronomy Mediterranean Bari, Valenzano, Italy. pp. 68-69.
Hossain, M. I., M. E. Haque, C. A. Meisner, M. A. Sufian and M. M. Rahman. 2005. Strip tillage plant-ing method for better wheat estab-lishment. J. Sci. Tech. 3, 91-95.
Hunt, D. 1973. Farm Power and Ma-chinery Management, Laboratory Manual and Work Book, Iowa State University Press. Ames, Iowa.
Johansen, C., M. E. Haque, R. W. Bell, C. Thierfelder and R. J. Esdaile. 2012. Conservation ag-riculture for small holder rainfed farming: Opportunities and con-
straints of new mechanized seed-ing systems. Field Crops Res. 132, 18-32 doi:10.1016/j.fcr.2011.11.026.
Meisner, C. A. 2001. Report of an on-farm survey of the Greater Sylhet Region: Wheat growers' practices, perceptions, and their implications. Monograph No. 16. Bangladesh Agricultural Research Institute, Wheat Research Centre, Nashipur, Dinajpur.
Miah Monayem, M. A., M. E. Haque, M. Baksh and M. I. Hos-sai. 2010. Economic analysis of power tiller operated seeder op-eration at farm level. Journal of Agricultural Engineering (Ban-gladesh) 38/AE, 1, 19-24.
■■

VOL.48 NO.4 2017 AGRICULTURAL MECHANIZATION IN ASIA, AFRICA AND LATIN AMERICA 45
Design, Development and Evaluation of Neem Depulper
byR. C. SolankiChief Tech. OfficerICAR-Indian Agricultural Research Institute, New Delhi-110012INDIA
S. N. NaikProfessorCRDT, Indian Institute of Technology, Delhi-110016INDIA
S. SantoshProfessorCRDT, Indian Institute of Technology, Delhi-110016INDIA
A. P. SrivastavaNational CoordinatorNAIP,KAB-2, ICAR, Pusa, New Delhi-110012INDIA
AbstractNeem (Azadirachtaindica A Juss)
is one of the most suitable and valu-able tree species found in India. There are about 20 million neem trees in India. A neem tree starts fruiting in 3 to 5 years and can produce 30 to 50 kg fruits/year. To harness the natural resource, a hand operated axial-flow neem depulper was designed, developedand evalu-ated to meet demand of neem seeds and its products. Using standard mechanical design procedures, an axial-f low hand operated neem depulper was developed. The opti-mized parameters of this machine is 3 days soaking period of neem fruit, 20 h-1 water f low rate, 18 × 5mm sieve size, rotor speed of 0.32 m. s-1, 5mm clearance between sieve and
S. P. SinghPrincipal ScientistICAR-Indian Agricultural Research Institute, New Delhi-110012INDIA
rubbing unit with spiral f lat belt. A farm worker can easily operate the machine; however, two persons (one for its operation and another for feeding) are required for day-long work with this machine. The overall output capacity of depulper was about 22.22 kg fruits/h at 30-35 rpm. The depulping efficiency was 98% and breakage was in the range of 0.02- 0.12%.
IntroductionIndia is the second most populous
country in the world with 121 mil-lion population, 60% of which is en-gaged in agriculture (Anonymous, 2012). Neem (AzadirachtaindicaA.Juss) is recognized as a natural product for solving global agricul-
tural, environmental, public health problems and environmentally safe alternative to synthetic pesticides etc. Neem seeds as its oil occupy a significant place in Indian economy for generating employment in rural area. About 14 million farmers are engaged in production of various oil seeds and 0.5 million in processing sector (Hegde, 2005).
According to the estimates of Neem Foundation, there are about 20 million neem trees in India and as per industry estimates, neem bears 3.5 million tonnes of kernels every year, and from this, around 7 lakh tonnes of neem oil can be obtained. However, total neem oil produced in India is about 2.5 lakh tonnes, which is only 30% of the total potential, the report said, indi-cating the scope for optimising yield

AGRICULTURAL MECHANIZATION IN ASIA, AFRICA AND LATIN AMERICA 2017 VOL.48 NO.446
(Anonymous, 2013).There is immense potential of
neem based products in India, which can be tapped if the medicinal plant, as part of agro-forestry and Integrated Rural Development Pro-gram (IRDP), is popularized and its value added products are rolled out through village industries.In rural areas, neem fruits are collected and processed manually in locality for domestic use and sale by marginal and landless farmers/occupants. The large size commercial machines are available which are used by chemi-cal based industries.
Uttar Pradesh Government and the Indian Institute of Pulses Re-search, Kanpur had developed mechanical devices for neem pro-cessing (Sharma et al., 1953). The depulper, developed at the institute, consisted of hopper and agitation cylinder of horizontal wire mesh of 9 mm, in which agitator rotatedwire mesh immersed in water reservoir. Mitra (1963) developed neem fruit depulper which consisted of a cy-lindrical steel drum with a central revolving shaft; carrying blades are fitted on the wall of drum. Prior to use of neem fruits in machine, it has to undergo with pre-treatment process of soaking for 4-5 days. In this machine, 40 kg of fruits were fed at a time. Due to bulky size of
machine, it did not find adoption at village level. Anonymous (2005) reported that 50% of collected seed goes waste without having proper depulping facility. The depulping should be done within 3-4 days and dried immediately. Depulped seeds dry faster as compared to the un-depulped seeds and yield better quality oil.
The harvesting and post-harvest technology for neem special ly depulping and decortication has not received due attention of re-searchers. This might be due to the climatic conditions at the time of its maturity and its fast perishable quality. Keeping this in view, low-cost, small size neem depulper was designed and developed to suit the need oflandless and small farmers.
Materials and Methods Collection of Neem Fruits
The neem seeds are col-lected during May-July and are sun dried. Conven-tionally the fruits are col-lected by brooming under the tree or shaking tree/ branches. Traditional col-lection process was stud-
ied to get the time involved, waste material and output during each time and compared with improved method (collection of neem fruits on polythene sheet) and manual pluck-ing (Table 1).
Physical and Mechanical Proper-ties of Neem
Neem starts bearing fruits after 3-5 yearsand it comes to full bear-ing at the age of 10-12 years. Fruit yield is 10-25 kg per tree per year in the initial years. A mature tree pro-duces 35-50 kg fruits/year. The size, shape, bulk density and true density, seed volume, porosity, angle of re-pose, coefficient of static friction, terminal and carrying velocity and compression and shear strength of neem fruits were determined fol-lowing standard techniques (Table 2).
DesignhypothesisBased on the review and data, the
design hypothesisisdecided which are as follows:Requirement of user/ group: Land-
less and small farmers used to collect about 200 kg neem fruits per year from 4 to 6 trees. The to-tal time span of neem fruit collec-tion per tree is for about 20 days, of which, 80% collection is in ten to eleven days. The local farmers of Haryana collect and make heep near treeand after decomposition, it was used as manure. The farm-
Parameters ValuesSize
Length 17.4 mm (16.21-19.00 mm)Diameter 13.0 mm (11.52-15.00 mm)
Angle of repose 40.12ºBulk density 633 kg/m3
Porosity 55.53%Compressive force 20.8N (18.83 – 22.76N)Shear force 19.82N (17.85 – 21.78N)Fruit weight 1.58-2.72 gWeight of 1000 fruits 1613±52.36 gWeight of 1000 seeds 325.1±11.21 gWeight of 1000 kernels 197.5±3.27 g
Parameters Traditional method Improved method Manual picking
Plucking method Fallen near tree over a night
Branches shaken manually with a pole
Direct from tree by hand
Flooring under tree Barren earth 200 micron thickness poly sheet NA
Time taken, man-h 1.5 2 3Fruit collected per tree, kg 17.62 20.9 10.5
Time taken in sorting, min/person
33 14.5 nil
Weight of waste material, kg 5.3 4.6 nil
Effective output (neem fruits), kg/h 6 7.27 3.5
Type of waste Moulds, stone, debris, sticks and leaves etc
Unripe fruits, leaves and sticks nil
Start of decomposition On 3rd day On 4th day On 6th day
Table 1 Methods of collection of neem fruits
Table 2 Physical and mechanical properties neem fruits

VOL.48 NO.4 2017 AGRICULTURAL MECHANIZATION IN ASIA, AFRICA AND LATIN AMERICA 47
ers were fully aware of its other uses but farmers could not fully utilize the benefits due to lack of small processing machinery (up to 200 kg/ day) and collection centres.
Manual power: Keeping this in view, it was thought to provide such a machine which can be op-erated manually for removal of pulp.
Cleaning simultaneously while depulping: Machine should also have a provision to clean/ wash the seed while depulping for bet-ter and efficient output as pulp would have tendency to make paste which adversely affect the performance of machine.
Simple and energy efficient mecha-nism: The energy efficient mecha-nism, particularly for rubbing unit will help in achieving better out-put with a manual operated ma-chine as human beings are having limited power for continuous op-eration. A simple machine would have advantage for its adoption by users because it can be fabricated bylocal artisans.
Ease in use: The collection by local farmers is from tree to tree at a distance and they are also scat-tered. Machine should easily be transported from one place to an-other.
Design of Depulper for Neem Fruits
Based on review, data and hy-pothesis, a manual operated neem depulperwas designed which con-sisted of depulping unit (cylinder,
rubbing unit, outlets andwater sup-ply system), power transmission unit, hopper, and frame. Depulping unit
A n e n e r g y e f f i c i e n t a x i a l -f lowdepulping unit was designed. It consistedof rubbing unit, sieve cylinder, outer cylinder cover, and water supply system. Rubbing unit
The spiral rubbing system (Fig. 1) was selectedas material passed through the rubbing zone between the sieve cylinder and spiral rubbing unit. It was continuously remained in movement with the rubbing sur-face in a helical path, which provid-ed longer path to the fruits as well as more retention time and helped in removal of skin and pulp easily. This system consumedless energy because it workedon two directional sheering actions.
Design considerations:Bulk density of neem fruit = 633 kg
per m3
1000fruit weight = 1613gFor 25 kg/h capacity of machine, to-
tal volume for rubbing unit should be nearly double of its capacity so that nearly half of its volume would be utilized for feeding only to get required depulping.
Axial-flow mechanism being energy efficient, the length was kept 810 mm.
The machine was to be operated by human beings so the bigger diameter of cylinder (rubbing unit) will be helpful for getting required powerto depulp the neem fruit. Thus diameter of rubbing unit was kept 190 mm andcovered
with sieve cylinder of 200 mm di-ameter.
Principle of screw conveyor was uti-lized for rubbing unit which was made in spiral shape.
Total volume ofneem fruit was0.073 m3.Parameters for shaft design of
rubbing unit:Modulus of elasticity of mild steel
shaft (Typ) = 84 × 104 kg m-2
Modulus of rigidity of the mild steel shaft (G) = 21 × 106 kg m-3
Maximum angle of twist = 1° (Hall et al., 1961)
Factor of safety (FS) = 2.5Where,
Lc = length of rubbing chamber, mmLs = length of shaft, mmLr = length of rubbing unit, mmd = diameter of shaft, mmD1 = diameter of cylindrical base for
rubbing system, mmD2 = outer diameter of rubbing unit,
mmH = height of rubbing unit, mmc = clearance between rubbing unit
and rubbing surface, mmP = pitch of screw, mmInner diameter (D1) of rubbing unit
= 100 mmOuter diameter (D2) of rubbing unit
= 195 mm Pitch, p = 41 mmClearance between sieve and rub-
bing unit = 5 mm (on the basis of minimum diameter of seed, i.e. 5.7 mm).
Length of sieve cylinder, Lc = 810 mm
Length of rubbing unit, Lr = 816 mm (spirally fitted with the help of ordinary bolt of 10 mm)The design of shaft was based on
the maximum shear theory of Spotts (1971)Tmax = 0.5 × Typ / FS …...............…(7)Typ = [0.5 (84 × 104)] / 2.5 = 168 N/
m2
Where,Tmax = maximum shear stressTyp = yield stress of mild steelFS = factor of safetyNow τmax = 16 {T / (πd3)} …....…............(8)Fig. 1 Schematic diagram of spiral rubbing unit

AGRICULTURAL MECHANIZATION IN ASIA, AFRICA AND LATIN AMERICA 2017 VOL.48 NO.448
As a design check, the equation for torsion of a solid shaftT/J = τ/R = Gβ/L ............................(9)
From which ,τ = (R G β)/L …………............…(10)
Whereτ = torque, N-mJ = polar moment of iner t ia =
(πd4)/32 ………….................…..(11)R = radius of spiral, mβ = angle of twistL = length of screw, mG = modulus of rigidity of material,
kg/m3
τ = (0.01 × 21 × 106 × 1)/0.80= 262.5 N/m2
As the torque 168 N/m2 is much less than 262.5 N/m2.Therefore, the 10 mm diameter was safe for twist angle of 1° fora length of 800 mm. The shaft of 20 mm diameter can withstand a stress of 262.5 N/m2 which is more than calculated stress
of 168 N/m2.For applied torque
τ = (J G β)/L ……............……….(12)= 157 N/m2
Therefore, diameter of shaft (d)will be 20 mm. The shaft design is safe for stress and torque.Cylindrical sieve
It works as a depulping cylinder consisted of holes throughout the length and dimeter for providing sufficient retention time to avoid car rying of un-depulped neem fruits. As the action is sheering the total power requirement in depulp-ing is less.
The main determinant for sieve is size of holes, thickness of sheet, diameter and length of seed. A rect-angular hole size of 18 × 5mm was used with the 4 mm gap between each hole and 8 mm gap between rows. The 18 gauge mild steel sheet
was used for making of sieve cyl-inder. The inner diameter of cylin-drical sieve is 200 mm and length including a collar of 10 mm is 820 mm (Fig. 2).Outer cylinder cover
It provide cover and to hold the slurry of pulp and water with skin and pulp. The main cylinder is made of 18 gauge m.s. sheet rolled in the diameter of 305 mm and the length of 820 mm. The main cylinder (Fig. 3) is providing the cover to the whole unit and holds the pulp and skin mixed with water and carries this slurry to the outlet. An inspec-tion box is provided to see inside the rubbing system. There are two separate outlets provided, one outlet was provided at the bottom of main cylinder for slurry of pulp and wa-ter while other outlet was for clean seeds at the end of sieve.Watering system
Water supply system is important in removing pulp from Neem fruit. A galvanized iron (G.I) pipe 860 mm longand 12 mm diameter was fitted inside the outer cylinder at the top of sieve cylinder (Fig. 4). There is a line of 21 hole each hav-ing 3 mm diameter upto the length of 800 mm from the end point in such a way that it sprinkle water on the sieve cylinder and help in clean-ing and removing of pulp and other material. A valve at the beginning is provided to control the amount of water supplied. Hopper
Being a small machine its hopper was designed for the feeding capac-ity of 5 kg of neem fruits. The top is in rectangular shape with size of 180 × 205 mm up to the depth of 140 mm and bottom is tapered at 45-degree angle towards the inlet opening of machine, which directly poured the material to the rubbing unit inside sieve cylinder.
Design procedure for fruit hopper, as reported by Narvani (1991) was followed. Following expression was used for determining holding capac-ity of hopper,
Fig. 2 Schematic diagram cylindrical sieve
Fig. 3 Schematic diagram of main cylinder
Fig. 4 Water supply system

VOL.48 NO.4 2017 AGRICULTURAL MECHANIZATION IN ASIA, AFRICA AND LATIN AMERICA 49
Fig. 5 Schematic diagram of hopper
Fig. 6 Schematic diagram of handle
Component SpecificationOverall dimensionsLength 1200 mmWidth 430 mmHeight 1110 mmMain frameLength 900 mmWidth 393 mmHeight 762 mmMain cylinderLength 820 mmDiameter 305 mmThickness 18 gaugeCylindrical sieveLength 810 mmDiameter 200 mmThickness 18 gaugeHole size 18 × 5 mmSpiral type rubbing unitlength of angle iron base 850 mmheight of flat belt 42 mmthickness of angle iron base 03 mmradial height of the unit 95 mmlength of shaft extension –tail side 130 mm –front side 210 mmdiameter of cylindrical base 100 mmWater supply systemlength of pipe 860 mmdiameter of pipe 12.5 mmnumber of holes 21diameter of holes 3 mmstop valve oneHopperLength 205 mmWidth 180 mmHeight 300 & 140 mmHandleLength 245 mm(Continued on the right)
(Continued from the left)Grip dia. inner 20mmouter 40mmHeight 140 mmWeight of machine 35 kg
Table 3 Dimensions of different components of neem depulper
V = W/BD ……………...........……(1)Where,
V = volume of hopper, m3
W = weight of fruit fed into hopper, kg
BD = bulk density of neem fruit, kg per m3
For smoot h a nd cont i nuou s flow of neem fruit from hopper to depulping chamberthe following condition must satisfyθh ≥ θ …………….....…............…..(2)
Where,
θh = angle of inclination of hop-per bottom with horizontal axis, 0
θ = angle of repose of neem fruit (40.32°), say, θh = 45°Volume of hopper = [(H+ h) / 2] × L
× W ..........................…………….(3)Weight of fruit in hopper = 5 kgBulk density of fruit = 633 kg per
m3
Capacity (Q), kg per m3 = V × BD ………...............................………(4)Where,
V = capacity, m3 h-1
BD = bulk density, kg m-3
V = 0.008 m3….............…………. (5)The length and width of top por-
tion of hopper was kept 170 mm and 205 mm, respectively. Height of hopper was kept 270 and 170 mm to provide slope of 45° while feeding in to cylinder.Frame
The main frame is fabricated by using mild steel angle of three sizes for top 35 × 3mm for legs 40 × 4mm and for support to legs 25 ×

AGRICULTURAL MECHANIZATION IN ASIA, AFRICA AND LATIN AMERICA 2017 VOL.48 NO.450
3 mm size. The height, width, and length of the frame are 762 mm, 393 mm and 900 mm, respectively. The adjusting system is incorporated towards the hopper side to provide slope to the main cylinder. The top of frame is joined with the legs in such a way to provide free move-ment while giving slope. Handle
The handle is fabricated by using mild steel and wooden. The handle arm is made of mild steel flat of the size 40 × 6 mm and 245 mm as ef-fective length (Fig. 6). It is mounted on main shaft with a hollow mild steel rod of outer and inner diameter as 40 mm and 20 mm respectively. Handle is made of round wooden with 45 mm diameter and 125 mm long and attached to connecting arm with 20 mm MS rod.
Fabrication of Neem DepulperBased on the design of neem
depulper, thedimensions for fabrica-tion of prototype aregiven in Table
3 and the fabricated prototype is shown in Plate 1.
Performance Evaluation of Neem Depulper
After laboratory evaluation of thedepulperfor proper working of each components, the prototype was testedby feeding 3-days soaked 4 kg neem fruit to assess its perfor-mance in terms of clean seed col-lected at outlet, seed left in the sieve cylinder, un-depulped neem fruits in sieve cylinder and un-depulped Neem fruits collected at seed outlet. The experiment was repeated thrice to get mean value. The material received at outlet was collected and separated for un-depulped seed, clean seed, broken seed and seed/ fruit left in the rubbing chamber, broken neem seed collected at pulp outlet, broken neem seed col-lected at sieve cylinder, water flow rate,cranking speed and time taken for depulping. Depulping efficiency, capacity of machine, percentage of clean seed, percentage of un-depulped seed, percentage of pulp loss, percentage of broken seed and cost of operation of machine were calculated as per standard formula.
The cost of operation of devel-oped machine was compared with conventional method (manual) of depulping (Table 4).
Results and DiscussionNeem fruits collected by two
persons from a tree were 17.62, 20.9 and 10.5 kgwith traditional, improved and manual picking meth-ods, respectively (Table 1). The effective output per hour in terms of neem fruit was higher (7.27 kg) in improved method where plastic sheet was used and followed by 6.0 kg in traditional method and 3.5 kg with manual picking. Higher output with improved method was due to no stone and dust as compared to traditional method and low output with manual picking was due to rea-son of individual fruit picking.
Performance Data of Developed Axial-flow Neem Depulper
From laboratory data, optimum soaking period of neem fruit was found to 3 days (Solanki, 2012). Four kg soaked neem fruit was fed into hopper at start and machine was operated continuously for an hour to assess the performance of machine. Capacity of machine was 24.5 kg/h at hand cranking speed of 32 rpm (Table 4). The hand crank-ing speed was varied between 30 to 35 rpm which is as per the recom-mendation of (Grandjean, 1982). Water flow rate was 0.02 m3/h. The produce obtained from the machine needs one washing in fresh water which took time of 2 min. Overall capacity of machine came to 22.22 kg/h. Depuling efficiency was 98% at rotor speed of 0.32 m. s-1. Pulp and skin losses were 0.9%.
The output of machine was 2.7 times more as compared to conven-tional method of depulping the neem fruit. Fabrication cost of machine was about Rs. 10,000 (USD is 65.34 for one INR) and cost of neem fruit depulping per kg was Rs. 3.5. Oper-
(1) (2) (3)
(4)
(5) (6)
(7)
(8)
Plate 1 Photograph of developed neem depulper
1 Water line2 Inspection box3 Main cylinder4 Hopper5 Outlet for seed6 Outlet for pulp and skin7 Main frame8 Handle
Particulars Mean value
Soaking period of neem fruit, days 3
Input material fed, kg 4Number of worker 2Hand cranking speed, rpm 32Speed of rotor, m/s 0.32Time taken to depulp the neem fruit, s 548
Time taken to wash seed after depulper, s 120
Water flow rate, l/h 20Capacity of machine, kg/h 24.5Overall capacity including washing, kg/h 22.22
Depulping efficiency, % 98Total loss (pulp & skin), % 0.9Energy consumption, W 67.14Capacity of depulping with conventional method, kg/h 6.0
Cost of depulping neem fruit, Rs/kgWith machine 3.5With traditional method 6.25Saving in cost, % 44.0
Table 4 Performance data of developed neem depulper

VOL.48 NO.4 2017 AGRICULTURAL MECHANIZATION IN ASIA, AFRICA AND LATIN AMERICA 51
ating cost was calculated on per kg seed and per hour basis which came to Rs. 1.57 andRs. 39.68, respec-tively.
During long run test, it was ob-served that a person (male worker) can easily operate the machine for about an hour at stretch and there-after rest pause is needed. This way, the machine if operated for 6 h in a day, the capacity would be 133 kg which enables small and landless farmers having about 13 trees.
Based on the laboratory and field evaluation, the optimum values of neem fruit depulper is as follows,
ConclusionsHand operated neem depulper was
developed using standard mechani-cal design procedures. It consisted of hopper, main cylinder, cylindrical sieve, spiral type rubbing unit, wa-ter supply system, handle and main frame. The optimized parameters for hand operated neem depulper is 3 days soaking period of neem fruit, 20 l/h-1 water flow rate, 18 × 5 mm sieve size, rotor speed of 0.32 m/s-1, 5mm clearance between sieve and rubbing unit with spiral f lat belt. The output of this developed ma-chine is 24.5 kg neem fruits per h 98% depuling efficiency. The depul-ing of neem fruits with this devel-oped machine is 44% economical to the traditional method. This ma-chine can be suitable for small and landless farmers having about 13 trees.
REFERENCES
Anonymous. 1973. Compiled re-port for the period of 1953-73.
Khadi and Village Industr ies Commission,“Gramodaya” 3, Irla Road, Vile Parle (W) Mumbai, India.
Anonymous. 1992. Neem: a tree for solving global problems. National Research Council (NRC), Nation-al Academy Press, Washington, D.C., USA.
Anonymous. 2005. Workshop on Strategies for Development of Tree-borne Oil seeds and Niger in Tribal Areas. National Oilseed and Vegetable Oils Development board (NOVOD), Gurgaon, India.
Anonymous. 2012. Agriculture Re-search Data Book. ICAR-IASRI, New Delhi.
Anonymous. 2013. Neem-based pesticide market growing at 7-9% annually: Report. The Economic Times.Sept 2,,http://articles.eco-nomictimes.indiatimes.com/2013-09-02/news / 41688741_1_neem-products-neem-foundation-neem-seeds. retrieved on 15.06.2015 at 5 p.m.
Grandjean, E. 1982. Fitting the Task to the Man- An Ergonomic Ap-proach. Taylor and Francis Lim-ited, London.
Hagde, D. M. 2005. Striving for self sufficiency. The Hindu Survey of India Agriculture, 58-62.
Mitra, C. R. 1963. Neem. The Indi-an Central Oil Seeds Committee, Bombay.
Narvani, N. B. 1991. Studies on de-sign and operation parameters of sunflower and safflower threshing.Unpublished Ph.D. thesis. Indian Agricultural Research Institute, New Delhi.
Omprakash, T. N Sharma,.and AmanullahKhan. 1953. Devising of Machinery for Depulping, Dry-ing and Decortication of Neem Fruit for its oil and Cake. Scheme Report.Indian Central Oil Seed Committee, All India Coordinat-ed Research Project on Oilseeds, ICAR, New Delhi.
Spotts, M. F. 1971. Design of ma-chine elements (4th ed.) Engle-wood Cliffs, NJ:Prentice Hall Inc.
Solanki, R. C. 2012. Development of depulper and decorticator for pro-cessing of neem (azadirachtain-dica a. Juss) fruits and seeds, Un-published Ph. D. Thesis, Center for Rural Development and Tech-nology, IIT, Delhi.
■■
1. Type of rubbing unit Spiral flat belt2. Clearance between
sieve and rubbing unit 5 mm
3. Rotor speed 30-35 rpm4. Sieve size 18 × 5 mm5. Soaking period 3 days6. Water flow rate 20 l/h7. Slope on cylinder horizontal

AGRICULTURAL MECHANIZATION IN ASIA, AFRICA AND LATIN AMERICA 2017 VOL.48 NO.452
Development of A Hydro-Separating Cowpea Dehuller
byOlaoye, Joshua OlanrewajuAgricultural and Biosystems Engineering Depart-ment, University of Ilorin, P.M.B, 1515 [email protected]
Olotu, Funke BosedeNational Centre for Agricultural Mechanization, P.M.B. 1525, [email protected]
AbstractThe dehulling of cowpeas is a
long and tedious process which involves detaching of cotyledon from the hull. Dehulling machines for soaked cowpea seeds were de-veloped to produce clean dehulled cow pea seeds for use in food preparation. Dehulling of cowpea seeds influences the quality of the final products. An improved hydro-separating cowpea dehuller was de-signed, fabricated and tested. Some of the components designed for and fabricated are hopper for feeding in the material, dehulling unit where dehulling operation takes place, cleaning unit where separation of cotyledon and hull take place and the shafts for auger and agitator for transmission of power to carry out the necessary operations. The test performance carried out on the ma-chine showed that it can effectively dehull the cowpea seeds and sepa-rate the hull from the cotyledon. The machine gave 93.61% as the highest dehulling efficiency and 73.24% as lowest dehulling efficiency. The least cleaning efficiency of dehuller was 79.96%; the average feed rate of the machine was 157.02 kg/h while output capacity of the machine was calculated to be 18.63 kg/h./batch.
Keywords: Cowpea Seed, Design, Fabrication, Dehuller/Separator,
Performance
IntroductionDehulling refers to the removal of
the seed coat (hull) from the seed, resulting in the separation of the cotyledons from the hulls. In the rural sector, the dehulling process is still a part of the housewife's man-ual work in food preparation. Wil-liams (1974) described the dehulling of cowpeas as a long and tedious process. Most housewives require an hour or more to dehull cowpeas depending on the quantity and the method used. Housewives generally prefer the wet method of dehulling or a combination of the dry and wet methods. The first innovation for dehulling cowpea is known as semi-mechanical method, this is achieved by firstly breaking the cowpea seeds into coarse particles consisting of hulls and seed particles using a milling machine, followed by sepa-rating the hull from the cotyledon by the process of winnowing and finally dry milling the cotyledons to produce cowpea flour. This method is popularly used by large scale pro-cessors of cowpea flour which are commonly found on food shelves in the stores. However, this method leaves the powder with black specks from the seed coat of the cowpea
(Dovlop, et al., 1976). Depending on the desired end products, the black specks left on the cowpea might not give the desired end product the ex-pected quality.
Some dehulling machines have been developed by institutions like National Centre for Agricultural Mechanization, (NCAM), Ilorin and University of Ilorin, Ilorin, (Unilorin). However, the complete removal of the hull (or testa) from cowpea was achieved by the use of dehulling machines developed by Babatunde (1995) and (Kolade (2003) at the University of Ilorin and Olowonibi (1999) at National Centre for Agricultural Mechaniza-tion (NCAM), Ilorin and some Al-lied Institutes but most of these ma-chines developed by institutions do not have separating chamber for the hull and cotyledon and those having separating chamber are not func-tioning well. This reason prompted the need to design and fabricate an improved cowpea dehuller.
This work aimed at developing a machine for detaching cowpea hull from its cotyledon so as to improve the quality of processed cowpea products. The overall objective was to design and construct an improved cowpea seeds dehulling machine.

VOL.48 NO.4 2017 AGRICULTURAL MECHANIZATION IN ASIA, AFRICA AND LATIN AMERICA 53
Materials and MethodsEquipment Description
The machine comprises of a hop-per, a dehulling unit, and a separat-ing/cleaning unit; the hopper is frus-tum pyramid in shape made from 2 mm thick galvanized sheet situated at the top of left end of the dehull-ing unit housing. The dehulling unit consists of a 25 mm diameter shaft that passes through a pipe of diam-eter 60 mm with series of punches on the pipe. A rod of diameter 10 mm was then wind round the 60 mm diameter pipe to form a worm which serves as an auger. This auger is then enclosed inside a perforated pipe of diameter 90 mm. The whole unit is housed inside a pipe of diam-eter 135 mm. The cleaning/separat-ing unit consists of two major com-ponents. A trapezoidal water trough where separation and cleaning op-eration take place, it is made from 2 mm thick galvanized with outlet for discharge of hull in the medium of water; at the centre top of the water trough is an agitator made of spikes of 10 mm diameter rod attached to a shaft of diameter 20 mm. Also an external rectangular water tank of 410 mm × 540 mm × 330 mm di-mensions made of 2 mm galvanized sheet which constantly supplies water into the separating/cleaning chamber during operation.
Design AnalysisT he major ca lcu la t ions a nd
analysis carried on the design of the hydro separating cowpea dehuller were:Hopper design
The volumetric capacity of the hopper was determined from the di-mensional layout of a frustum set up in a resting position. Two kilogram of cowpea seeds is to fill the hopper. The volume to be occupied by mate-rial is calculated using equation 1 while the volumetric capacity of the hopper was calculated from equa-tion 2 and this volume is to avoid choking of the materials when felt
conveyor in a horizontal position; CD was calculated to be 0.0385 m3/h using equation 3 as given by (Skill-ing 2001).CD = π / 8 (D2
s - D2A) N × (P - T)
(m3/h) .............................................(3)where,
Ds is the screw diameter in m DA is the axle diameter in mT the thickness of the blade in mP the pitch length of the auger in mN is the speed of operation in rpm The power/energy requirement for the dehuller’ screw conveyor
The power requirement for a screw conveyor was estimated from the sum of the power required to turn the empty screw and the ad-ditional power required to move the solids as stated by (Skilling 2001). The power requirement was calcu-lated to be 0.00023 kw using equa-tion 4. The power required to move empty screw conveyor was estimat-ed to be 0.00013 kw using equation 5 while the power to move material estimated to be 0.000104 kw using equation 6 based on the bulk density of soaked cowpea seeds to be de-hulled as given by Yalcin (2007) and (Davies and Zibokere, 2011) to range between 979.59 kg/m3 and 1,014.54 kg/m3 at 30% moisture content dry basis. Therefore, 1,014.54 kg/m3 was chosen. Thus power source higher than the required power is selected for this operation.PSC = EP + MP .................................(4)
where, EP is Empty PowerMP is the Material Motion Power
andEP = 2.45 × 10⁻⁶LNFDFB (Kw) ....(5)
where, L is the Screw Length in mN is the rotating speed in rpmFD is a function of the screw size,
usually about 5FB is a factor, about 4
Also,MP = 5.39 × 10⁻⁶LCWFMFFFP .......(6)
where, C = capacity of the Conveyor in m3/
hW = material density in kg/m3
into the hopper.V (m3) = M (kg) / ρ (kg / m3) .........(1)
where,V = volume of material in m3
M = mass of the material in kgρ = bulky density of the material in
kg/m3
Hence, volumetric capacity of the hopper is given asV = 1/3 (A1 + A2 + √(A1 + A2) h) ..(2)
where,V = Volumetric capacity of the hop-
per (mm3)A1 = Area of top of the hopper in m2
A2 = Area of bottom base of the hopper in m2
h = the height of the hopper in m The highest bulk density at 30%
moisture content dry basis given by (Davies and Zibokere, 2011) to be 1,014.54 kg/m3 since the material to be dehulled ranges between the moisture content of the bulk den-sity. Therefore, the volume of the quantity of the cowpea seeds is de-termined using equation 1. Hence, volumetric capacity of the hopper is calculated to be 0.00297 m3.The capacity of the screw conveyor dehuller
The quantity of cowpea seeds to be dehulled and the whole compo-nent of auger (screw conveyor) are to be contained inside the dehull-ing unit housing. The pitch length of the auger is assumed based on the time of retention of the soaked cowpea seeds inside the dehulling chamber, this is necessary because, the dehulling operat ion on the soaked cowpea seeds is carried out by rubbing action of the seeds with the wall of the cover and between the seeds themselves inside the chamber. A complete removal of the teasta from the cotyledon is guar-antee, if times of retention of seeds inside the chamber is longer during operation and the speed of opera-tion is lower. That is a shorter pitch length reduces time of retention of seeds. Hence, a low speed of 318.40 rpm and 120 mm of pitch length are chosen for this design.
The output capacity of a screw

AGRICULTURAL MECHANIZATION IN ASIA, AFRICA AND LATIN AMERICA 2017 VOL.48 NO.454
FM = a material factor usually 1.0FF and FP = a flight factor and a seed
factor respectively both usually 1 for both standard screws.
Auger designThe volumetric capacity of auger
housing is established in the rela-tionship of the cowpea seeds and the auger to be placed inside the hous-ing it is calculated to be 0.0018 m3 using equation 7 given by (Olaoye, 2011)V = (πD2 / 4) L ................................(7)
where, V = volumetric capacity of the au-
ger cover in m3
L = length of the auger cover in mD = Diameter of the auger Cover in
mThe volumetric capacity of the
auger Housing gave r ise to the dimensions of the auger as Core diameter 60 mm, Screw diameter 80 mm, Pitch of the auger 120 mm, Radial clearance 3 mm, Thickness of screw or diameter of worm or rod 10 mm and average height of mate-rial on the screw surfaces 20 mm. According to Roberts (1999) Con-veyor Throughput of an enclosed screw conveyor is influenced by the rotational or vortex motion of the bulk material during transportation and the degree of fill or "fullness" of the screw. As the rotational speed of the conveyor increases, the rota-tional or vortex motion decreases up to a limiting value, making for a more efficient conveying action. The net result is for the volumetric throughput of the screw conveyor to reach a limiting value. It was cal-culated to be 1.55 × 10³ m/s using equation 8.This shows the materials will move through the length of the conveyor as fast as 0.00155 m in a second. Maximum theoretical volu-metric throughput with conveyor running 100% full and the bulk material moving axially without rotation is calculated to be 1.83 × 10³ m/s using equation 9 when the Γ value is 0.3934 m using equation 10 and angular velocity is 0.058 rev/sec from equation 11. The volumetric
through put of a screw conveyor is given by (Roberts, 1999).Q = Qtηv ...........................................(8)Qt = Γ ω D .......................................(9)Γ = 1/8 [(1 + 2 C/ D) - ( DC / D)][(ρ
/ D) - tS / D] ...............................(10)where,
Qt = maximum theoretical volu-metric throughput with conveyor running 100% full and the bulk material moving axially without rotation.
ηv = volumetric efficiencyD = screw diameter (m)DC = core diameter (m)p = pitch (m)ω = angular velocity of screw (r/s)C = radial clearance (m)tS = thickness of screw blade (m)
The screw conveyors of large di-ameter attain their maximum output at lower speeds than conveyors of smaller diameter. The angular ve-locity,ω = gND / R01789 ..........................(11)
where, R0 = outer radius g = gravitational accelerationN = the speed of the auger in revolu-
tion per second;D is as defined above
Also, the volumetric efficiency of a screw conveyor is the product of two components is indicated to be 84.91% from equation 12. When fullness efficiency of 8.3% is calcu-lated using equation 13ηv = ηVR .ηF .....................................(12)
where,ηVR = conveying or vortex efficiency
accounting for the rotational or vortex motion
ηF = 'Fullness' Efficiency = hav / ρ......(13)
where,hav = average height of material on
the screw surface = 10 mmρ is as defined above.
The conveying efficiency is given to be 10.23% using equation 14 and for it to be determined, it is neces-sary to first determine the variation of the path helix angle λ as a func-tion of the radius and rotational speed of the conveyor and the effec-
tive helix angle of the screw flight = 80.95° from equation 16 while effective helix angle of the path ex-tracted from AUTOCAD drawing is given as λe = 35.6°. With the knowl-edge that VT≈ constant and does not vary with the radius, the analysis of the screw conveyor may be simpli-fied by lumping the rotational mass and resultant forces at the effective radius Re defined byηVR = VLe / VLt = tan λe / (tan ae + tan
λe) .................................................(14)The helix angle of the screw flight
corresponding to Re isae = tan-1 [(p / nD) (R0 / Re)] .......(15)Re = 2 / 3 [R0 - R1 / R0 - R1] .........(16)
where,R0 = outside radius of screw flight in
mR1 = inner radius of radius of shaft
in mρ as defined aboveD = 2 R0 = screw flight diameter
in mPulley design
There were two operating shafts namely; screw conveyor (auger) shaft and agitator shaft and they are to use different pulley diameter. The design and selection of appropri-ate power requirement for rotation of screw conveyor and the agitator was selected based on the speed of the driving motor, speed reduction ratio and centre to centre distance between the shafts at the condi-tions under which the dehulling and separation/cleaning action must take place. An ac motor with 1410 rev/min was used with pulley diameter of 70 mm. The dehulling operation speed of 318.4 rev/min was desired. A low speed of auger shaft rotation is expected during dehulling opera-tion because according to (Reichert, et al., 1979) dehulling of cowpea seeds at lower speed is more effi-cient than dehulling at higher speed. The diameters of pulley of the shafts were calculated using equa-tion for the peripheral speed of belt as shown in equation 17 given by (Khurmi and Gupta, 2005) as:πN1D1 = πN2D2 ..............................(17)

VOL.48 NO.4 2017 AGRICULTURAL MECHANIZATION IN ASIA, AFRICA AND LATIN AMERICA 55
where,N1 = Speed of the driving motor in
rev/min, N2 = Speed of the shaft in rev/minD1 = Diameter of driving pulley in
m, D2 = Diameter of driven pulley in
m.The operating speeds of the agita-
tor is expected to be in ratio 1:4 of the speed of screw conveyor, since, it is expected to agitate the water without splashing. The pulley di-ameters of the agitator and screw conveyor were calculated to be 250 mm and 300 mm using equation 17. The shaft to shaft centre for the electric motor and auger shaft was chosen to be 240 mm while that of the agitator and auger was chosen to be 195 mm. The choices are based on the calculation from equation 19. The minimum obtainable distance between the central axis of the elec-tric motor shaft and the radius of the outer cylindrical auger housing for dehulling operation as well as the distance between auger shaft and the agitator shaft inf luenced the choice of this parameters and it was calculated using equation 18. A v-belt of 1.14 m was recommended to drive the screw conveyor while a v-belt of 0.88 m was recommended to drive the agitator.L = {π / 2 (D1 + D2)} + 2C + {(D1 -
D2)2 / 4C} .....................................(18)where,
L = Total length of belt in m, D1 = Diameter of driving pulley in
mD2 = Diameter of driven pulley in mC = the shaft to shaft centre, it is ex-
pressed as;C = D1 ; D2 / 2 + 0.05 .................(19)
The Power/Energy Requirement for the Dehuller’s Agitator
BEE (2004) stated that the fan op-erate under a predictable set of laws concerning speed, power and pres-sure. A change in speed revolution per minute (rpm) of any fan in op-eration will predictably change the pressure rise and power necessary to operate it at the new rpm. This
law can be applied to agricultural equipment that uses blade to carry out its operation.
One of the equations of these laws is given as;KW1 / KW2 = [N1 / N2]3 ....................(20)
where,KW1 = power from the screw con-
veyor KW2 = power required by the agita-
torN1 = speed of the agitator shaft N2 = speed of the screw conveyor
shaftThis Law is applicable because
speed from the screw conveyor is being transferred to the agita-tor during the dehulling operation. Therefore, the power required by the agitator shaft was calculated to be 3.6 × 10⁻⁶ kW using equation 20.Torque transmitted by the shafts
The torque transmitted by the screw conveyor shafts was 0.0069 Nm while that of agitator shaft was 0.00043Nm calculated from equation 21 given by (Khurmi and Gupta, 2005).T = Px60 / 2πN ...............................(21)
where, P = the calculated power (W)N = the operating speed of the shaft
(rpm)Shafts design
In the design of the dehuller, two major shafts were designed for; the main shaft of the screw conveyor (auger) and the shaft of the agitator. The design of the shafts is based on strength and will be controlled by maximum shear theory. The design for the Shafts of the Screw Convey-or (Auger) and agitator is subjected to combined twisting moment and bending moment, so the shafts were designed based on two simultane-ous moments on them. The shaft di-ameter selected for screw conveyor was 25 mm based on its maximum bending moment of 37.23 Nm while the shaft diameter selected for the agitator was 20 mm based on its maximum bending moment of 4.82 Nm using equation 22 given by (Khurmi and Gupta, 2005).
Te = (M2 + T2)0.5 = (π × SS × d3 ) / 16......(22)
where, Te = equivalent twisting moment in
Nm M = maximum bending moment in
NmT = Torque transmitted by the shaft
in NmSS = Allowable shear stress with
keyway = 40 N/mm2 (Pa?)d = diameter of the shaft in mm Fabrication Techniques
The construction processes were carried out in the fabrication work-shop, Department and Biosystems Engineering, University of Ilorin, Ilorin, Nigeria. The basic manufac-turing processes which include cut-ting, bending, primary shaping and joining processes were undertaken.Hopper
The hopper is a frustum of pyra-mid (a pyramid with a portion of the head cut off parallel to the base) this is a medium through which the grains are introduced to the dehull-ing units and retained prior to their introduction into the machine.
It is constructed of mild sheet of 1.5 mm thickness. The dimensions are 257 mm × 232 mm at the top and 100.2 mm × 80.2 mm at the bot-tom with slant of length 205.5 mm and height 214.7 mm. The fabrica-tion was done by marking out the measurements on the plate, cutting it into shapes, welding and giving it a finishing touch by grinding.Auger housing
The auger housing consists of two halves of 90 mm diameter pipe, (perfect circular shape) which is perforated to ease dehulling and cleaning of the unit. The upper half has an inlet of dimension 100mm × 80 mm for the base of hopper, while the discharge outlet in the bottom half situated at the opposite end of the inlet end is 67.5 mm × 40 mm opening. The auger housing has a total length of 502 mm. It was fab-ricated by marking out the 90 mm diameter pipe into a desire length and required shape. The finishing of

AGRICULTURAL MECHANIZATION IN ASIA, AFRICA AND LATIN AMERICA 2017 VOL.48 NO.456
the housing was done by grinding..Screw conveyor unit (auger)
The screw conveyor unit has an over length of 815 mm with a pitch length of 120 mm and helix angle of 35.60. It is made of a pipe of diam-eter 60 mm with a 10 mm diameter rod worm around it, then 25 mm diameter rods of length 120 mm each were attached at the extreme ends of the worm shaft. The unit was constructed by cutting the 60 mm diameter pipe into a length of 495 mm and a 10mm rod of length 420 mm was wind round the pipe by welding to form an auger. Then the 25 mm rod was cut into two (2) shafts of 120 mm length each, the shafts were welded to end edges of the auger.Cleaning unit
The separating unit comprises of separating trough, agitator, and chaff/water separator. The separat-ing trough which is trapezoidal in shape has an over dimension 425 mm length, 250 mm width, the maximum height of 345 mm and minimum height of 230 mm. it has two openings; the first opening for removing the chaff while the second opening is for draining water from the cleaned cowpea cotyledons. It is constructed from 2.0 mm mild steel plate; the plate was marked and cut out into required lengths and shapes, then welded together to form trapezoidal shape.
The agitator is made of blades from 1.5 mm thickness galvanized sheet attached to a shaft which is situated at the top centre runs across the width of the separating trough and made to sit at the top of the trough. It is designed to keep the hulls in suspension after creating turbulence in the surface of the wa-ter. This is constructed from mild steel rod of 20 mm diameter shaft, 2 plates of 1.5 mm and dimension 380 mm × 50 mm were bend to 45° and fitted along the length of the shaft using bolt and nut. The fabrication of the agitator was done by cutting the 20 mm diameter rod into the
required length of 450 mm and the plate into marked out shape. The blade was bending to the specified angle of 45° and fit to the shaft us-ing bolt and nut.
The chaff/water separator is cylin-drical in shape with diameter of 204 mm and height of 202 mm, it has a sieve of perforation 4 mm diam-eter and 31,416 mm2 area inside the cylinder for holding the chaff and a valve tap for discharge of water. It is fabricated from 2 mm galvanized by marking and cutting out of the plate into the length and folded cy-lindrical shape. The mild steel plate was also mark out and cut into two circular plates. One of the plates was welded to form the base of the cylinder while the other one was perforated using drilling machine to form a sieve which is placed inside the cylinder.Water tank and bearing housing
The water tank which is cuboid in shape has an overall dimension of 410 mm × 334 mm × 545 mm and it is constructed from 1.5 mm galvanized sheet. It is fabricated by marking and cutting the sheet into the required lengths and shapes, and then welded to form cuboid shape.
The bearing is fitted between the inner races and the shaft in interfer-ence, fitted to prevent relative rota-tion and wears between the race and the shaft. This is rigidly attached to the frame and cover with metal sheet serving as housing. The hous-ing is constructed using construc-tion instruments such as vice and anvil to fold the metal into a semi-circle covering the bearing on a flat f lange which was shaped out. The flange has two holes drilled on both ends of a 4 mm diameter, thickness of 18 mm. the enclosing circle de-pends on the external diameter of the bearing house.Frame
The frame is cuboid in shape and gives a rigid support to the whole system. It has an over dimension of 610 mm × 460 mm × 655 mm. It is constructed of 50 mm × 50 mm × 50
mm angle and 2 mm thickness plate of dimension 610 mm × 460 mm to cover the top of the frame. The fabrication procedure was done by marking and cutting out the angle iron into different lengths of 655 mm, 610 mm, 460 mm, etc. using power hacksaw and mild steel sheet into rectangular shape then welded together to form the frame.Pulley
Three pulleys were used in the construction of this machine. The auger has two main pulleys the ma-jor pulley has a diameter of 310 mm; the minor pulley has a diameter of 60 mm, while the third pulley which is the pulley of the agitator has 240 mm diameter.
Operation of the Modified Cow-pea Dehulling Machine
The machine is operated by a 2 hp electric motor and has the following features such as hopper, dehulling unit and cleaning unit. The hopper is where the soaked beans is fed into, the dehulling unit consist of an
Fig. 1 (a) the Isometric View of Hydro-Separating Cowpea Dehuller and (b)
the Pictorial View of Hydro-Separating Cowpea Dehuller
(a)
(b)

VOL.48 NO.4 2017 AGRICULTURAL MECHANIZATION IN ASIA, AFRICA AND LATIN AMERICA 57
auger that convey the soaked cow-pea that gets dehulled by rubbing action principle as it moves along the length of the screw conveyor. The auger discharges dehulled cow-pea seeds into the separating trough.
The cleaning chamber which is to separate the hull from the coty-ledon consist of an agitator made of blades attached to a shaft and fixed at the top of a separating trough where the cleaning takes place. The agitator stirs the water inside sepa-rating trough as the clusters of hull and cotyledon dropped inside the trough for separation. The lighter hull floats and flows out through its outlet as the water from the water tank continually fills the separat-ing chamber during operation. The water that filled chamber allow the mechanical agitator to easily and constantly stirs the dehulled seeds and hull for easy separation of the materials, hence, allow the heavier cotyledons to settle to the bottom of the separating chamber while the lighter hulls float and flow out with the flowing water.
The hulls are collected by a chaff/water collector through a pipe while the cotyledons sink down and settle at the bottom of the separating trough. After the dehulling opera-tion, the separating trough is pulled out from its seat, the water is then drained and the cleaned cotyledons are packed for further operation.
The electric motor simultaneously powers the screw conveyor shaft in the dehulling chamber where the soaked cowpea seeds are being dehulled and the agitator shaft that agitates the water inside separating/cleaning chamber.
Performance TestA preliminary test was carried
out on the hydro-separating cowpea dehuller using 2hp electric motor as the source of power at operating auger speed of 150, 200, 250, 300 and 350 rpm using driven pulley of diameter 493.50 mm with a corre-sponding agitator speed of 43.5 rpm. Four commonly available cowpea varieties namely; Yarihausa, IAR48, Oloyin, and IAR 60/62 were used as
Legend of Fig. 31 Hopper2 Dehulling unit housing (upper part)3 Auger pulley4 Auger shaft5 Screw convey or unit6 Auger cover (lower part)7 Dehulling unit housing (lower part)8 Top covering seat9 A-Belt10 Main frame11 Electric motor12 Separating trough13 Separating trough tap14 Water guard15 Separating trough seat16 Water agitator17 Agitator shaft18 Agitator pulley19 Water collector tap20 Water collector21 Filtering plage22 Discharge chute23 Chaff/Water outlet24 Agitator driving pulley25 Water tank frame26 Water tank 27 Wtaer tank cover28 Water tank tap29 Auger cover (upper part)
Fig. 2 Orthographic Projections of Hydro-Separating Cowpea Dehuller
Fig. 3 Exploded View of Hydro-Separating Cowpea Dehuller

AGRICULTURAL MECHANIZATION IN ASIA, AFRICA AND LATIN AMERICA 2017 VOL.48 NO.458
a testing material at 2, 4, 6, 8, and 10 minutes soaking time.
The performance indices used for this experiment are the equations 23-26 as expressed below following the format of Standard test code for groundnut sheller, (NIS, 1997) and Babatunde, (1995).DE = (W3 / W2) × 100(%) .............(23)
where,W2 (kg) = W3 + W4
W3 (kg)= Weight of dehulled cow-pea seeds.
W4 (kg) = Weight of undehulled cowpea seeds
CE = W6 / W5 × 100(%) ................(24)where,
W5 = W6 + W7
W6 (Kg) = Weight of chaff inside chaff collector
W7 (Kg) = Weight of chaff remain-ing inside the cleaning chamber after operation
FR = W1 / T1 (kg/h) ........................(25)where,
W1 (kg) = Total weight of soaked seeds fed into the machine
T1 (h) = Time of feedingOC = W1 / T2 (kg/batch/h) ............(26)
where,T2 (h) = Time of operation
Analysis of the New Duncan Mul-tiple Range Test was carried out to determine the effect of the speed of operation and soaking time on the dehulling efficiency and cleaning efficiency on the hydro separating dehulling machine using for four varieties of Cowpea seeds.
Results and DiscussionThe hydro-separating cowpea
dehuller was designed and fabri-cated. The isometric and pictorial views, orthographic projection and exploded views of the dehulling machine were as shown in Figs. 1, 2 and 3 respectively. The machine is operated by a 2 hp electric motor to power all the accompanied features. The dehulling unit consists of an auger that convey the soaked cow-pea that get dehulled by rubbing ac-
tion principle as it moves along the length of the screw conveyor. The auger discharges dehulled cowpea seeds into the separating trough.
The cleaning chamber which separates the hull from the cotyle-don consists of an agitator made of blades attached to a shaft and fixed at the top of a separating trough where the cleaning takes place. The hull is collected by chaff cum water separator through a pipe while the cotyledons sink down and settle at the bottom of the separating trough. After the dehulling operation, the separating trough is pulled out from its seat, the water is then drained and the cleaned cotyledon is packed for further operation. The operation of 2 hp electric motor simultane-ously dehulls the soaked cowpea seeds and agitates the water inside separating/cleaning chamber. The basic unit operations in dehulling process were handled in an opera-tion as an improvement over Ba-batunde (1995), Kolade (2003) and Olowonibi (1999).
Performance Test of the Hydro-Separating Cowpea Dehuller
Table 1 shows the summary of performance test of the dehuller.
The highest dehulling efficiency was 95.06% and 73.24% as lowest dehulling efficiency of the machine when four varieties, yari hausa, IAR60/62, IAR48 and oloyin, were compared. The cleaning efficiency of the dehuller ranged from 79.96% to 81.85%. The feed rate of the ma-chine ranged from 156.18 kg/h and 157.02 kg/h while output capacity of the machine was calculated to be between 17.76 kg/h/batch and 18.63 kg/h/batch (Table 1). These results showed that the dehuller was capable of effectively dehulling the cowpea seeds and separating the hull from the cotyledon compared to the results indicated by Babatude (1995) and Olowonibi (1999). The hydro separating component was a unique feature of the dehuller unit. This feature made the separation of the dehulled seeds and cotyledon feasible.
Effect of Speed of Operation on the Dehulling Efficiency of the De-huller
Table 2 showed that there was gradual decrease in the dehulling ef-ficiency of the machine as the speed increases for all the four varieties of cowpea seeds used with excep-
VarietyOperating
Speed (rpm)
Soaking Time (min)
Dehulling Efficiency
(%)
Cleaning Efficiency
(%)Feed rate
(kg/h)Output
Capacity (kg/h/batch)
Yari Hausa 200 6 73.24 81.66 157 18.63IAR60/62 200 6 80.7 81.85 156.18 17.76IAR48 200 6 93.61 81.42 157.02 17.81Oloyin 200 6 81.67 79.96 156.98 18.45*Values are means of five replications
Table 1 Summary of the Performance test of the Hydro-Separating Cowpea Dehuller
Table 2 Effect of Speed of Operation on Dehulling Efficiency of the Dehuller using NDMRT* for Four Varieties of Cowpea Seeds
Operating Speed (rpm)
Mean Dehulling Efficiency for Cowpea Varieties (%)Yari Hausa IAR 60/62 IAR48 Oloyin
150 71.2273d 80.7460d 93.0940d 80.1980d
200 74.5727e 83.1513e 96.0147e 83.9633e 250 69.5467c 76.4827c 88.3267c 77.7567c
300 63.6353b 72.7207b 82.5633b 72.4113b
350 57.9300a 63.0967a 80.2907a 67.5460a
* implies New Duncan Multiple Range Test
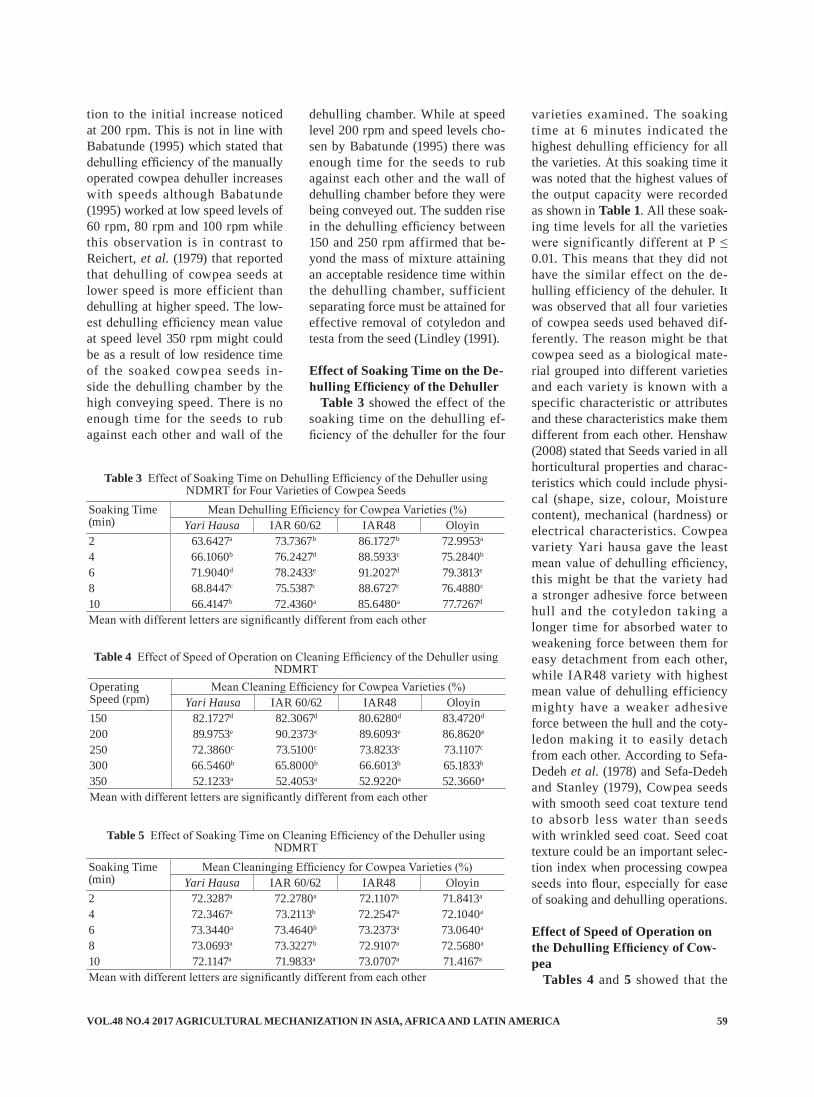
VOL.48 NO.4 2017 AGRICULTURAL MECHANIZATION IN ASIA, AFRICA AND LATIN AMERICA 59
tion to the initial increase noticed at 200 rpm. This is not in line with Babatunde (1995) which stated that dehulling efficiency of the manually operated cowpea dehuller increases with speeds although Babatunde (1995) worked at low speed levels of 60 rpm, 80 rpm and 100 rpm while this observation is in contrast to Reichert, et al. (1979) that reported that dehulling of cowpea seeds at lower speed is more efficient than dehulling at higher speed. The low-est dehulling efficiency mean value at speed level 350 rpm might could be as a result of low residence time of the soaked cowpea seeds in-side the dehulling chamber by the high conveying speed. There is no enough time for the seeds to rub against each other and wall of the
dehulling chamber. While at speed level 200 rpm and speed levels cho-sen by Babatunde (1995) there was enough time for the seeds to rub against each other and the wall of dehulling chamber before they were being conveyed out. The sudden rise in the dehulling efficiency between 150 and 250 rpm affirmed that be-yond the mass of mixture attaining an acceptable residence time within the dehulling chamber, sufficient separating force must be attained for effective removal of cotyledon and testa from the seed (Lindley (1991).
Effect of Soaking Time on the De-hulling Efficiency of the Dehuller
Table 3 showed the effect of the soaking time on the dehulling ef-ficiency of the dehuller for the four
varieties examined. The soaking time at 6 minutes indicated the highest dehulling efficiency for all the varieties. At this soaking time it was noted that the highest values of the output capacity were recorded as shown in Table 1. All these soak-ing time levels for all the varieties were significantly different at P ≤ 0.01. This means that they did not have the similar effect on the de-hulling efficiency of the dehuler. It was observed that all four varieties of cowpea seeds used behaved dif-ferently. The reason might be that cowpea seed as a biological mate-rial grouped into different varieties and each variety is known with a specific characteristic or attributes and these characteristics make them different from each other. Henshaw (2008) stated that Seeds varied in all horticultural properties and charac-teristics which could include physi-cal (shape, size, colour, Moisture content), mechanical (hardness) or electrical characteristics. Cowpea variety Yari hausa gave the least mean value of dehulling efficiency, this might be that the variety had a stronger adhesive force between hull and the cotyledon taking a longer time for absorbed water to weakening force between them for easy detachment from each other, while IAR48 variety with highest mean value of dehulling efficiency mighty have a weaker adhesive force between the hull and the coty-ledon making it to easily detach from each other. According to Sefa-Dedeh et al. (1978) and Sefa-Dedeh and Stanley (1979), Cowpea seeds with smooth seed coat texture tend to absorb less water than seeds with wrinkled seed coat. Seed coat texture could be an important selec-tion index when processing cowpea seeds into flour, especially for ease of soaking and dehulling operations.
Effect of Speed of Operation on the Dehulling Efficiency of Cow-pea
Tables 4 and 5 showed that the
Soaking Time (min)
Mean Dehulling Efficiency for Cowpea Varieties (%)Yari Hausa IAR 60/62 IAR48 Oloyin
2 63.6427a 73.7367b 86.1727b 72.9953a
4 66.1060b 76.2427d 88.5933c 75.2840b
6 71.9040d 78.2433e 91.2027d 79.3813e
8 68.8447c 75.5387c 88.6727c 76.4880c
10 66.4147b 72.4360a 85.6480a 77.7267d
Mean with different letters are significantly different from each other
Table 3 Effect of Soaking Time on Dehulling Efficiency of the Dehuller using NDMRT for Four Varieties of Cowpea Seeds
Operating Speed (rpm)
Mean Cleaning Efficiency for Cowpea Varieties (%)Yari Hausa IAR 60/62 IAR48 Oloyin
150 82.1727d 82.3067d 80.6280d 83.4720d
200 89.9753e 90.2373e 89.6093e 86.8620e 250 72.3860c 73.5100c 73.8233c 73.1107c
300 66.5460b 65.8000b 66.6013b 65.1833b
350 52.1233a 52.4053a 52.9220a 52.3660a
Mean with different letters are significantly different from each other
Table 4 Effect of Speed of Operation on Cleaning Efficiency of the Dehuller using NDMRT
Soaking Time (min)
Mean Cleaninging Efficiency for Cowpea Varieties (%)Yari Hausa IAR 60/62 IAR48 Oloyin
2 72.3287a 72.2780a 72.1107a 71.8413a 4 72.3467a 73.2113b 72.2547a 72.1040a
6 73.3440a 73.4640b 73.2373a 73.0640a 8 73.0693a 73.3227b 72.9107a 72.5680a
10 72.1147a 71.9833a 73.0707a 71.4167a Mean with different letters are significantly different from each other
Table 5 Effect of Soaking Time on Cleaning Efficiency of the Dehuller using NDMRT

AGRICULTURAL MECHANIZATION IN ASIA, AFRICA AND LATIN AMERICA 2017 VOL.48 NO.460
dehulling eff iciency of Cowpea seeds for the four varieties increase with respect to the speed of opera-tion of the dehuller machine, so also their soaking time increases but a point their dehulling efficiency be-gan to gradually decrease as their soaking time continue to increase. This observations might be that as the seed is soaked the hull gradually absorbed water and as the water is absorbed it occupy the space be-tween then and the adhesive force between the hull and cotyledon gets weaken, hence detaches from each other under any slight application of pressure on them. The soaking time at which there was a gradual de-crease in their dehulling efficiency might be that their cotyledons had started absorbing the moisture that was between it and the hull by the principle of osmosis, thus leading to turgidity of the cotyledon as a result there could be no more space between them, leading to a stronger adhesive force and hence decrease in the dehulling efficiency of the dehuller. The highest dehulling ef-ficiency for each variety ranges be-tween 89.61% and 90.23%.
Effect of Soaking Time of Cowpea Seeds on the Cleaning Efficiency Dehuller
The soaking t ime of Cowpea seeds had significant effect on the magnitude of cleaning efficiency of the machine for IAR 60/62 and IAR48 varieties of cowpea seeds tested P≤ 0.01. While, for yari hausa and oloyin varieties of cowpea seeds, the soaking time of cowpea seeds had no significant effect on the magnitude of cleaning efficiency of the machine tested P≤ 0.01 (Ta-ble 5). The New Duncan Multiple Range Test (NDMRT) was used to show the levels of the soaking time of cowpea seeds that led to the sig-nificant difference in the cleaning efficiency of dehuller. From Table 5 only IAR 60/62 showed very slight significant difference while from Tables 4 and 5 yari hausa, IAR48
and oloyin varieties of cowpea seeds showed no significant difference. Table 5 showed that all the levels of soaking time of yari hausa were not significant from each other at P≤ 0.01. It means that they all have similar effect on the cleaning ef-ficiency of the machine. The effect of soaking time for all the varieties examined on the cleaning efficiency of the machine at soaking time level 6 mins had the highest mean value of cleaning efficiency.
ConclusionsThe improved hydro-separating
cowpea dehuller was designed and fabricated. Some of the components designed for and fabricated are hopper for feeding in the material, dehulling unit where dehulling op-eration takes place, cleaning unit where the hull (seed coat) is being separated from the cotyledon; and the shafts for the auger and the agi-tator for transmission of power to carry out the necessary operations. A performance test was carried out on the cowpea dehulling machine using four commonly available varieties of cowpea seeds. It was discovered that the cowpea seeds were effectively dehulled and the cotyledons were separated from the hull because the performance of the dehuller gave the lowest dehull-ing efficiency of 73.24% for Yari Hausa and highest value of 93.61% for IAR60/62. Also, the cleaning ef-ficiency ranges between 81.85% for IAR60/62 and 79.96% for Oloyin.
REFERENCES
Babatunde, O. O. 1995. Develop-ment and Performance Evaluation of a Manually Operated Cowpea DehullingMachine for Soaked Cowpea’’. Journal of Agricultural Engineering Technology Vol.3, Pp1-7.
BEE. 2004. Bureau of Energy Ef-
ficiency, India, Energy Efficiency Guide Book. (New Delhi: Gov-ernment of India. Chapter 5, Pp93-112.
Davies, R. M. and D. S. Zibokere. 2011. Effect of Moisture Content on Some Physical an Mechanical Properties of Three Varieties of Cowpea (VignaUnguiculata (L) walp)’’. Agricultural Engineering International: CIGR Journal Vol. 13, no. 1 Pp17.
Dovlop, F. F., C. E. Williams and L. Zoaka. 1976. Cowpea: Home Preparation and use in West Af-rica. International Research and Development Council, Ottawa, Canada.
Henshaw, F. O. 2008. Varietal Dif-ferences in Physical Characteris-tics and Proximate Composition of Cowpea (Vigna unguiculata). World Journal of Agricultural Sci-ences 4 (3): 302-306.
Khurimi, R. S and J. K. Gupta. 2005. Shaft, in Textbook of Ma-chine Design (S.I. Units) 4th Edition. New Delhi:Eurasia Pub-lishing House (PVT) LTD. Ram Nagar. Pp 509-557.
Kolade, B. A. 2003. Design and Const ruct ion of a Motor ized Maize/Cowpea Dehuuler/Cleaner. Bachelor of Engineering project Department of Agricultural En-gineering, University of Ilorin, Ilorin.
Lindley, J. A. 1991. Mixing pro-cesses for Agricultural and Food Material. Part 2. Highly Viscous Liquid and Cohesive material. J Agri Engng Res. 48: 229-247
NIS. 1997. Niger ian Indust r ial Standard: Standard Test Code for Groundnut Shellers, NIS 321, La-gos: SON, Ikoyi, Lagos.
Olaoye, J. O. 2011. Development of Small-Scale Equipment for Depulping Locust Bean Seeds. In-ternational Journal of Engineering and Technology. (IJET-IJENS) vol.11 no.6, Pp173-186.
Olowonibi, M. M. 1999. Develop-ment and Evaluation of a Hand Operated Cowpea and Soya bean

VOL.48 NO.4 2017 AGRICULTURAL MECHANIZATION IN ASIA, AFRICA AND LATIN AMERICA 61
Testa Remover. Agrimech, Re-search and Information Bulletin of NCAMVol. 1.Pp42-47.
Reichert, R. D., E. F. Lorer and C. G. Youngs. 1979. Village?Scale Mechanical Dehulling of Cow-peas. Cereal Chemistry Vol. 56, no. 3. Pp181-184.
Roberts, A. W. 1999. The Influence of Granular Vortex Motion on the Volumetric Performance of En-closed Screw Conveyors. Powder Technology Vol. 104, Pp56-67.
Sefa-Dedeh, S., D. W. Stanley and P.
W. Voisey. 1978. Effects of soak-ing time and cooking conditions on texture and microstructure of cowpeas. Journal of Food Science, 43: 32-1883.
Sefa-Dedeh, S. and D. W. Stanley. 1979. Textural Implications of the Microstructure of Legumes. Food Technology, October, 77-83.
Skilling, J. 2001. Screw Conveyors. http://www.chemeng.ed.ac.uk/-jennifer/pre2004/solids2001/lec-tures.
Williams, C. E. 1974. A preliminary
study of consumer preference in the choice of cowpeas: Kwara State Headquarters and Western areas of Nigeria. Depar tment of Agricultural Economics and Extension, University of Ibadan, Ibadan, Nigeria. Pp103.
Yalcin, I. 2007. Physical Properties of Cowpea (VignaSinensis L.)Seed. Journal of Food Engineer-ing.Vol.79, Issue 1, March Pp57-62.
■■
New Co-operating Editor
Alejandro Isabel Luna MaldonadoDate of Birth: May 5 th, 1966Nationality: MexicanPresent Position: Professor and Head of the Department of Agricultural and Food Engineering, Autonomous
University of Nuevo Leon, Nuevo León, MexicoEducation Background:
2009: Ph.D in Agricultural Science, Kyushu University, Fukuoka, Japan.2004: M.Sc. in Agri-Industrial Mechanical Design, Agricultural Autonomous University ”Antonio Narro”,
Coahuila, Mexico.1990: B.Sc. in Agricultural Engineering, Autonomous University of Nuevo Leon, Nuevo León, Mexico.2002: Training Course on Farm Machine Automation, JICA (OIC), Obihiro, Japan.1996: Training Course on Farm Machinery Design, JICA (TBIC), Tsukuba, Japan.
Professional Experience:2017-Date: Professor and Head of the Department of Agricultural and Food Engineering, Faculty of Agriculture, Autonomous
University of Nuevo León, Nuevo León, Mexico.2010-Date: Distinguished Member of Mexican Research System.2000-Date: Distinguished Professor of Mexican Ministry of Education 2013-2014: Secretary of Posgraduate Studies at Faculty of Agriculture, Autonomous University of Nuevo León, Nuevo León,
Mexico.2009-Date: Member of Quality Commitee for Educational Program of Food Engineering.
E-mail: [email protected]; [email protected]

AGRICULTURAL MECHANIZATION IN ASIA, AFRICA AND LATIN AMERICA 2017 VOL.48 NO.462
Effect of Conservation Tillage and Crop Residue Management on Soil Physical Properties and Crop Productivity of Wheat
byV P ChaudharySenior ScientistIndian Institute for Farming Systems Research (ICAR)Modipuram, Meerut -250 110 (UP)[email protected]
Monalisha ParmanikScientistIndian Institute for Farming Systems Research (ICAR)Modipuram, Meerut -250 110 (UP)INDIA
AbstractField experiments were carried
out on a sandy loam (Typic -Us-tochrept) soil in hot dry semi-arid subtropical climate of Meerut to study the effect of tillage systems and crop residue mulching with fer-tilizer application doze combination on soil physical properties (aggre-gate size distribution, mean weight diameter (GMD) and bulk density), chemical properties (soil organic carbon (SOC) and soil microbial biomass carbon (MBC)) and its plant growth parameters and yield continuous wheat (Triticum aesti-vum L. emend. Fiori & Paol) system during 2008-11. Two tillage systems and four crop residue mulching with recommended doze fertilizer (RDF) combination were factorially combined in a split plot design with three replications and each plot size
was 5 length and 4 m width. The tillage systems (main plots) were: no tillage (NT) and conventional tillage (CT), i.e. 4 harrowing +1 tine cultivating and one patella. The rice crop residue used as mulching and fertilizer combination treatments (sub-plots) consisted of four M1 - No mulch + recommended dose of fer-tilizer (RDF), M2 - Mulch (6 t ha-1) + recommended dose of fertilizer (120:60:40 kg NPK) (RDF), M3 - Mulch (0) + 125% recommended dose of fertilizer (RDF), M4 - Mulch (6 t ha-1) + 125% recommended dose of fertilizer (RDF). Results revealed that ZT had higher MWDs and lower GMDs than CT at both depths. The MWDs decreased with increase in soil depth for both tillage (T) treatments as well as rice crop residue mulching (M) treatments. The bulk density were not affected significantly (P < 0.05) by tillage
systems and crop residue mulching × recommended dose of fertilizer (RDF) application at both 0-15 and 15-30 cm soil depth. Tillage system did not inf luence significantly on SOC at both depths but MBC influ-enced significantly (P = 0.05) at up-per depth (0-15 cm). The SOC and MBC were affected significantly (P = 0.01) by crop residue mulching with combination of recommended fertilizer application rate at upper depth (0-15 cm) but 15-30 cm, SOC was significantly at P = 0.05 but MBC had no significant different. The SOC was significantly higher value in ZT (5.61 gkg-1) than CT (4.69 g kg-1) at 0-15 cm soil depth. The SOC and MBC were recorded in ordered M4>M2>M3>M1 which had significant difference value at P = 0.01.
The zero tillage showed signifi-cantly (P = 0.01) higher infiltration
Anurag PatelICAR - Indian Institute of Farming Systems Research Modipuram, Meerut (U.P.) -250110INDIA

VOL.48 NO.4 2017 AGRICULTURAL MECHANIZATION IN ASIA, AFRICA AND LATIN AMERICA 63
rate (1.96 cm h-1) than conventional tillage. The infiltration rate (IR) was significantly (P = 0.01) higher in M4 (2.15 cm h-1) followed by M2 (1.97 cm h-1). Tillage system influenced significantly (P = 0.05) on shoot dry weight and total biomass accumula-tion at all three growth stages i.e. ear emergence (EE), BGF and dough stages, however, on LAI at dough stage, it significant at P = 0.01. The growth parameters (LAI, shoot dry weight, root dry weight and total biomass accumulation) were influ-enced significantly (P = 0.01) by residue mulching with combination of recommended dose of fertilizer (RDF) at beginning grain filling (BGF) and dough stages, however, at ear emergence stage, it was only significant (P = 0.01) on shoot dry weight and total biomass accumula-tion. The higher grain yield value was observed in zero tillage as com-pared to conventional tillage. The highest grain yield of wheat crop was observed in M4 (5.33 t ha-1) and followed by M2 (5.21 t ha-1), M3 (5.15 t ha-1) and M1 (4.62 t ha-1) but differ-ence among the treatments was non-significant.
Key words: Mean weight diameter (MWD), Geometric mean diameter (GMD), Soil organic carbon, Micro-bial bio-mass carbon, Bulk density, Infiltration rate (IR)
IntroductionRice (Oryza sativa L.) - wheat
(Triticum aestivum L. emend. Fiori & Paol) is the major cropping sys-tem covering 13.5 million ha in Indo-Gangetic plain (IGP) of South Asia and feeding 20% of world population is immense importance for the food security and livelihood of region (Ladha et al., 2009). The widespread adoption of high yield-ing cereals along with improved crop management practices and availability of irrigation water and chemical inputs during the Green Revolution (GR) has led to tremen-
dous impressive increase in system productivity. The rice-wheat pro-ductivity is plateauing and total fac-tor productivity is declining because of a fatigued natural resource base and therefore, sustainability of this cropping system is at risk (Sahara-wat et al., 2010).
Soil tillage is one of the funda-mental agro-technical operations in agriculture because of its influence on soil properties (physical, chemi-cal and biological) which creates favourable environment for plant growth. The continuous soil tillage strongly influences the soil physical and chemical properties due to deg-radation of soil structure (Lal 1998, Greenland 1981). The different till-age systems and crop residue may enhance soil organic matter and mi-crobial biomass carbon and alter C and N dynamics. Tillage promotes soil organic matter decomposition through crop residue mulching onto surface soil, physical breakdown of residues, and disruption of soil organic matter protected within ag-gregates (Paustain et al., 2000, Six et al., 2000). No tillage farming systems usually help to maintain soil organic matter (SOM) and ag-gregate stability (Rhoton 2000), conserve soil moisture, maintain constant soil temperatures (Benegas 1998) and improve water infiltration rates (Battcharyya et al., 2008). No tillage also results in a better soil structure and in an extensive sys-tem of macro-pores (Martino and Shaykewich 1994), which benefits root growth (Lampurlanes et al., 2001). Crop residues are a source of soil organic matter, which are the primary source and temporary sink of plant nutrients and an energy source for soil microorganisms (Ka-nazawa and Philip 1986, Cater et al., 1994). No tillage, residue return and cropping system may enhance soil organic matter and microbial bio-mass and alter C and N dynamics. Cropping systems/ intensity trends to increase SOC and microbial bio-mass through greatest return of crop
residues (Stromberger et al., 2007). Crop residues have been reported to increase soil organic fertility (Shafi et al., 2007, Bakht et al., 2009) which can improve microbial activ-ity and nutrient supply (Shah et al., 2003b). Previous studies have shown that microbial biomass is higher in soils under no till plot as compared to conventional tillage practices (Al-vear et al., 2005, Bausenwein et al., 2008, Spedding et al., 2004). Adop-tion of better management strategies such continuous cropping, reduced tillage, improved fertilization, ap-plication of organic amendments and crop rotations including peren-nial forage can increase the amount of organic C and/or N stored in the soil (Liang et al., 2002, Malhi et al., 2009). By minimizing soil distur-bance, reduced tillage decreases the mineralization of organic matter. The result is a large store of soil or-ganic carbon than with conventional tillage (West and Post 2002, Al-Kaisi and Yin 2005).
The present study aimed to: (iii) examine the effect of tillage and crop residue mulching on different soil physical properties (i.e. ag-gregate pattern and mean weight diameter (GMD) and bulk density). (ii) effect of tillage systems and crop residue mulching on soil or-ganic carbon and microbial biomass carbon up to 0-15 and 15-30 cm soil depth; (ii) determine the effects of tillage systems and crop residue mulching on system productivity.
Materials and MethodsField experiments with two till-
age systems and four crop residues mulching with combinat ion of fertilizer dozes (RDF) were factori-ally combined in a split- plot design with three replications, size of sub plots having of 5 m length and 4 m width each. The tillage systems (main plots) were: no tillage (NT) and conventional tillage (CT), i.e. 4 harrowing +1 tine cultivating and

AGRICULTURAL MECHANIZATION IN ASIA, AFRICA AND LATIN AMERICA 2017 VOL.48 NO.464
one patella. The rice crop residue used as mulching and fer tilizer doses combination treatments (sub-plots) consisted of four M1 - No mulch + recommended dose of fer-tilizer (RDF), M2 - Mulch (6 t ha-1) + recommended dose of fertilizer (120:60:40 kg NPK) (RDF), M3 - Mulch (0) +125% recommended dose of fertilizer (RDF), M4 - Mulch (6 t ha-1) +125% recommended dose of fertilizer (RDF). The soil (0-15 cm deep) was sandy loam soil (63.7% sand, 19.1% silt and 17.2% clay) in texture (Typic -Ustochrept), having mildly alkaline (pH 8.20), non-saline (EC 0.27 dS m-1) and low in soil organic carbon (4.4 g kg-1).
The sowing of wheat (PBW-343), in both conventional and zero till plot, was performed by zero-till drill at line spacing 20 cm with seed rate of 100 kg ha-1 and it was grown with recommended package and practices. The crop received a recommended fertilizer dose of 120 kg N, 60 kg P2O5 and 40 kg K2O ha-1. One third of the N and all the P and K were applied before sowing, and the remaining urea-N was top-dressed in two equal splits, 30 and 55 days after sowing (DAS). For weed control in wheat, the chemical weed control was applied using Sul-fosulfuron @ 25g active ingredient ha-1 + Metsulfuran methyl @ 4.00 g active ingredient ha-1 at 30 days after sowing (DAS). This helped to maintain a weed-free condition in all treatments throughout the seasons. Wheat was grown under assured irrigated conditions as per recommendation of crop.
The exper iment farm is situ-ated at latitude of 29° 40” North and longitude 77° 40” East at an elevation of 237 m above sea level and categorized in hot dry semi-arid subtropical climate with sum-mers and severe cold winters. The average monthly minimum and maximum temperatures in January (the coolest month) were 7.2°C and 20.1°C, respectively. The corre-sponding temperatures in May (the
hottest month) were 24.2°C and 39.8 °C, respectively. The 10-year aver-age annual rainfall is 823 mm, and over 75% of this is received through north-west monsoon during July-September. During experimental period the average rainfall in kharif season (June-October) during 2007, 2008, 2009 and 2010 was 480, 210, 457 and 597 mm, respectively and in rabi (November- March) season during 2007-08, 2008-09, 2009-10 and 2010-11 was 39.4, 19 mm.
Soil samples were collected using cores (5 cm high and 3 cm diameter) for estimation of bulk density (0-15 cm and 15-30 cm soil depth) by gravimetric method and expressed in Mg m3. Soil samples (0-15 cm and 15-30 cm soil depth) from each plot collected randomly from three spots with the help of a core sampler (10 cm internal diameter and 15 cm height) after the wheat crop harvest in the year 2010 at each treatment. The samples were air-dried and each sample was divided in two parts. One part was used for chemi-cal analysis while other part was
used for determination of aggregate size distr ibution (Yoder, 1936), mean weight diameter and geomet-ric mean diameter.
Mean weight diameter (GWD, mm) of aggregates was calculated as follows.
Where Xi is the mean diameter of aggregates fraction i and Wi is the mass proportion of aggregates frac-tion i (Kemper and Rosenau, 1986)
Geometric mean diameter (GMD, mm) was calculated as follows.
Where Wi is the mean proportion of aggregates fraction i and Xi is the mean diameter of aggregate fraction i (Kremper and Chepil 1965).
Infiltration characteristics were obtained from the measured infiltra-tion data after 4 years of rice-wheat cropping (after the 2010 wheat har-vest). Infiltration was determined using a double-ring infiltrometer.
Source of variationsSoil depth (cm)
MWD GMD0-15 15-30 0-15 15-30
ANOVATillage system (T) NS NS NS NSResidue mulching + RDF (M) 0.09** 0.04** 0.04** 0.10**Interaction (M × T) * NS NS NSTreatmentTillage systems (T)CT 0.25 0.17 0.41 0.49ZT 0.29 0.21 0.41 0.4Crop residue mulching + RDF (M)M1 0.18 0.13 0.5 0.52M2 0.33 0.2 0.4 0.46M3 0.21 0.17 0.44 0.45M4 0.36 0.24 0.33 0.35RDF: recommended dose of fertilizer, MWD: mean weight diameter, GMD: Geometric mean diameterZT indicates zero tillage and CT indicates conventional tillage. M1, M2, M3 and M4 indicates no mulch + recommended dose of fertilizer (RDF), mulch (6 t ha-1) + recommended dose of fertilizer (120:60:40 kg NPK) (RDF), mulch (0) +125% recommended dose of fertilizer (RDF), mulch (6 t ha-1) +125% recommended dose of fertilizer (RDF), respectively.NS, Not significant, *Significant at P<0.05, **Significant at P<0.01.
Table 1 Significance the effects of experimental factors and their interaction on MWD and GMD at various depth of sample, as resulting from analysis of variance
(ANOVA)

VOL.48 NO.4 2017 AGRICULTURAL MECHANIZATION IN ASIA, AFRICA AND LATIN AMERICA 65
Soil organic carbon (SOC) and microbial biomass carbon (MBC) were determined after harvest of rabi crop by following standard pro-cedures. The plant growth rate pa-rameters (i.e. LAI, shoot dry weight, root dry weight (samples at 0-30 cm soil depth as standard procedure), total biomass accumulation) were recorded at three different stages in wheat (i.e. ear emergence -EE (55 days after sowing), beginning of grain filling-BGF (68 days after sowing) and dough stage (85 DAS)). Leaf area index (LAI) during re-spective growth stages was moni-tored by canopy analyzer (Model LICOR-3000). LAI was calculated using the relationship LAI = total leaf area (cm2)/canopy of the plant (length x breadth). The total bio-mass accumulation of plant (such as shoot, leaf and root dry weight per square meter of crop was estimated at different three growth stages as ear emergence (EE), beginning of grain filling (BGF) and dough stage. The clean root, shoot and leaf sam-ples were first sun dried and there-after in oven dried at 60±5°C for 48 hour, weighted and root dry weight and shoot dry matter were calcu-
lated as dry weight/ square meter. An area of 1 m2 from each plot was harvested for determining the grain yield.
Statistical analysis was carried out using the methods suggested by Gomez and Gomez (1984). All parameters were analysed as a split plot model (tillage systems as main effect and crop residue and fertilizer application rate as split plot effect). The significant different among the means of different parameters with treatments wise were separated us-ing the LSD at P <0.05 and 0.01.
Results and DiscussionSoil Parameter
T he me a n we ig h t d i a me t e r (MWD) and geometric mean diam-eter (GMD) of soil aggregates were not significantly (even at P<0.05) influenced by tillage at both depth 0-15 and 15-30 cm depth (Table 1). At both depths, ZT had higher MWDs and lower GMDs than CT. The MWDs decreased with in-crease in soil depth for both tillage (T) treatments as well as rice crop residue mulching (M) treatments.
The higher MWD was recorded in ZT (0.29 mm) as compared to CT (0.25 mm) at 0-15 cm soil depth, however, in 15-30 cm soil depth, it was significant (P<0.05) (i.e. 0.21 mm in ZT and 0.17 mm in CT). The GMDs (in either ZT or CT case 0.41 mm) had shown at par value in 0-15 cm depth, however, 15-30 cm, higher value in CT (0.49 mm) was observed than ZT (0.40 mm) but not significant. The MWD was significantly (P = 0.01) higher in M4 (0.36 mm) than M1 (0.18 mm) and M3 (0.20 mm) and at par with M2
(0.33 mm) at 0-15 cm. At 15-30 cm, the MWD decreased with depth and similar pattern was shown as in case of upper depth.
The GMD of aggregates was sig-nificantly (P = 0.01) higher in M1 (0.50 mm) than M3 (0.44 mm) which was at par with M2 (0.40 mm). Sig-nificantly (P = 0.01) lower GMD was recorded in M4 (0.33 mm) than other treatments at 0-15 cm soil depth. At 15-30 cm, significantly at par GMD were recorded in treat-ments M1 (0.52 mm), M2 (0.46 mm) and M3 (0.45 mm). The treatments M4 (0.35 mm) was significantly (P = 0.01) lower than other treatments.
Source of cariationsSoil depth (cm)
SOC (g kg-1) MB-C (μg g-1) BD (Mg m-3) IR (cm hr-1)0-15 15-30 0-15 15-30 0-15 15-30
ANOVATillage system (T) NS NS 20.7* NS NS NS 0.13**Residue mulching + RDF - (M) 0.60** 0.22* 26.7** NS NS NS 0.08**Interaction (M X T) NS NS NS NS NS NS **TreatmentsTillage systems (T)CT 4.69 3.39 312 237 1.61 1.61 1.71ZT 5.61 3.63 345 248 1.59 1.62 1.96Residue mulching + RDF- (M)M1 4.06 3.24 304 233 1.63 1.63 1.46M2 5.90 3.64 347 247 1.58 1.61 1.97M3 4.46 3.48 307 236 1.62 1.64 1.75M4 6.19 3.68 354 253 1.55 1.57 2.15SOC, soil organic carbon, MBC, microbial biomass carbon, BD: bulk density, IR: Infiltration rateZT indicates zero tillage and CT indicates conventional tillage. M1, M2, M3 and M4 indicates no mulch + recommended dose of fertilizer (RDF), mulch (6 t ha-1) + recommended dose of fertilizer (120:60:40 kg NPK) (RDF), mulch (0) +125% recommended dose of fertilizer (RDF), mulch (6 t ha-1) +125% recommended dose of fertilizer (RDF), respectively.NS, Not significant, *Significant at P<0.05, **Significant at P <0.01.
Table 2 Significance the effects of experimental factors and their interaction on SOC, MBC and BD at various depth of sample, as resulting from analysis of variance (ANOVA)

AGRICULTURAL MECHANIZATION IN ASIA, AFRICA AND LATIN AMERICA 2017 VOL.48 NO.466
The interaction of tillage systems with crop residue mulching x fertil-izer application rates (RDF) combi-nation on MWDs and GMDs were non-significant (P = 0.05) at both depth except MWD was observed significant at 0-15 cm soil depth. Tillage signif icantly decreased MWD and increased GMD at both depths, although the differences were not always significant at both depth (i.e. 0-15 cm and 15-30 cm) layers. The reduction in MWD with CT could be mainly due to mechani-cal disruption of macro-aggregates from frequent tillage operations and reduced aggregate stability. This reduction in aggregates stability with tillage has been reported in the literature. Zotarelli et al., (2005) reported that the MWD of the ag-gregates was on average greater un-der ZT compared with CT. Similar result was also reported by Chen et al. (2009). Zibilske and Bradford (2007) showed that plow tillage had significantly lower GMDs than no tillage. The bulk density were not affected significantly (P < 0.05) by tillage systems and crop residue mulching x recommended dose of fertilizer (RDF) application at both 0-15 and 15-30 cm soil depth (Table 2). However, lower bulk density was recorded in ZT (1.59 Mg m-3) as compared to CT (1.61 Mg m-3). Lower, bulk density was recorded in M4 (1.55 kg m-3) than M2 (1.58 Mg m-3), M3 (1.62 Mg m-3) and M1 (1.63 Mg m-3) in upper depth 0-15 cm which were at par values. At 15-30 cm, comparatively higher bulk den-sity was recorded varied from 1.57 to 1.64 Mg m-3 in all treatments. All the interactions were found non-sig-nificant. The crop residue mulching and recommended dose of fertilizer as in treatments (M4) have reported lowest bulk density due to microbial activity which changes the physi-cal status of soil. The more micro organism may reduce the bulk den-sity. Crop residue mulch has been reported to improve soil quality in terms of organic carbon and biotic
activity (Karlen et al., 1994, Lal 1989), and this might be the cause for lower bulk density, particularly near the soil surface in the no-till plots of this study.
Tillage system did not influence significantly on SOC at both depth 0-15 cm and 15-30 cm, however, crop residue mulching with com-bination fertilizer application rate influenced significantly (P = 0.01) at 0-15 cm but 15-30 cm, it was significantly at P = 0.05 (Table 2). However, tillage system influenced significantly (P = 0.05) on the MBC but crop residue mulching with com-bination fertilizer application rate influenced significantly (P = 0.01) at 0-15 cm but at 15-30 cm, there was no significant different. The SOC was significantly higher value in ZT (5.61 gkg-1) than CT (4.69 g kg-1) at 0-15 cm soil depth. However, in 15-30 cm, it was observed lower value as 3.63 g kg-1 in ZT and 3.39 g kg-1 in CT. The effect of treatment of crop residue mulching and recom-mended dose of fertilizer combina-tion had shown significant (P = 0.01) results on SOC and MBC at 0-15 cm soil depth. On average, com-pared to M1 (control), soil organic carbon (SOC) was 50.5 and 40.8% higher in M4 and M2 , respectively. The treatments M4 (6.19 g kg-1) had significantly (P = 0.01) higher than M2 (5.90 g kg-1) and both treatments significantly (P = 0.01) greater as compared to M1 and M3 (4.06 and 4.46 g kg-1) which had significant at par value. The SOC decreased with depth from 0-15 cm to 15-30 cm in all treatments and similar tread were observed among the treatments as in upper layer. The MBC in soil tended to be lower (significant P = 0.05) un-der CT (312 μg g-1) compared to NT (345 μg g-1). The MBC was recorded in ordered M4>M2 >M3>M1 which had significant difference value at P = 0.01. On average, MBC in treat-ment M4 (354 μg g-1 soil) was sig-nificantly higher (at P = 0.01) with M2 (347 μg g-1 soil) which also was significantly higher as compared to
M1 (304 μg g-1 soil) and M3 (307 μg g-1 soil) which were non-significant in 0-15 cm soil depth. The signifi-cantly higher MBC was recorded in M4 (354 μg g-1 soil) than other treatments, it was due to 6 t ha-1 and 125% of recommended dose of fertilizer (RDF). The similar pat-tern were also observed in 15-30 cm soil depth but it was not significant at P = 0.05, however, the MBC was reduced (varied from 23 to 29%) in lower depth as compared to up-per depth. The interaction of tillage systems with crop residue mulching x combination fertilizer application rate (RDF) on SOC and MBC were non-significant (P = 0.05) at both the soil depth.
Elimination of soil mixing under NT leads to a concentration of or-ganic matter at soil surface. In other terms, low storage of carbon under CT was probably due to high oxida-tion rates, release of organic com-pounds to soluble form, and greater microbial activity (Marbet et al., 2001). The higher SOC & MBC con-tents under residue treatments could be attributed to the beneficial effects of residue such as nutrient cycling and soil quality enhancement. Dalal et al. (1991) observed that in the surface soil layers, the interactive effects of zero tillage and return-ing residues resulted in higher SOC contents compared with zero and conventional tillage. The crop resi-due was retained (6 t ha-1) and 125% recommended dose of fer tilizer (RDF) application resulted in higher SOC due to greater numbers of mi-crobes thus enhanced the microbial activity, with the highest SOC in the soil in M4. It was also revealed that higher fertilizer application (i.e. 125% RDF) influenced the mi-crobes’ population due to increasing the decomposition of biomass avail-able in the field which ultimately increases the SOC and MBC of the soil in upper depth (0-15 cm). Ear-lier research has shown that quality and /or quantity of organic matter in soil can be altered by tillage, crop

VOL.48 NO.4 2017 AGRICULTURAL MECHANIZATION IN ASIA, AFRICA AND LATIN AMERICA 67
residue management and fertiliza-tion (Havlin et al., 1990, Nyborg et al., 1995). Tillage increases oxida-tion of soil organic matter (Doran and Scott-Smith 1987), while NT reduces its oxidation because of less mixing with soil (Doran 1980). Therefore, one would expect a substantial increase of SOC in soil under ZT compared to CT (Halvor-son et al., 2002). Crop residues pro-vide a source of organic matter, so when returned to soil the residues increase the storage of organic C in soil, whereas their removal results in a substantial loss of organic car-bon (Solberg et al., 1997, Malhi and Lemke 2007).
The t i l lage system and crop residue mulching with combination fertilizer application rate influenced significantly (P = 0.01) on the steady state (basic) of infiltration rate (IR). Zero tillage showed significantly (P = 0.01) higher infiltration (1.96 cm h-1) than conventional tillage. Steady state conditions, the infiltra-tion rate (Table 2) was significantly (P = 0.01) higher in M4 (2.15 cm h-1) than M2 (1.97 cm h-1), M3 (1.75 cm h-1) and M1 (1.46 cm h-1). There were also significant differences each other at P = 0.01. The interaction of tillage systems with crop residue mulching x combination fertilizer application rate (RDF) on basic in-filtration rate significant (P = 0.01).
More soil organic carbon and mi-crobial biomass carbon in the zero tillage was arguably caused by less oxidation of the organic matter (crop & weed residues, root bio mass etc) due to less disturbance of soil by tillage. This might have possibly influenced the infiltration character-istics of the soil where initial water uptake was improve but not the final (steady) infiltration rate. In the ab-sence of so called long-term effect, the macro-channels produced after decay of roots or due to earthworm activity under zero tillage (where the soil is left less disturbed unlike the conventional tillage) are likely to have extended to surface, producing
Tabl
e 3
Sig
nific
ance
the
effe
cts o
f exp
erim
enta
l fac
tors
and
thei
r int
erac
tion
on g
row
th p
aram
eter
s (LA
I, sh
oot d
ry w
eigh
t, ro
ot d
ry w
eigh
t and
tota
l bio
mas
s acc
umul
atio
n)
sam
ple
of w
heat
cro
p, a
s res
ultin
g fr
om a
naly
sis o
f var
ianc
e (A
NO
VA)
Trea
tmen
tLe
af a
rea
inde
x (L
AI)
Shoo
t dry
wei
ght (
g m
-2)
Root
bio
mas
s (g
m-2)
Tota
l bi
omas
s acc
umul
atio
n (g
m-2)
Ear
emer
genc
eB
GF
Dou
ghEa
r em
erge
nce
BG
FD
ough
Ear
emer
genc
eB
GF
Dou
ghEa
r em
erge
nce
BG
F D
ough
AN
OVA
Tilla
ge sy
stem
(T
)N
SN
S0.
46**
86*
97*
197*
NS
10*
NS
89*
107*
196*
Res
idue
m
ulch
ing
+ R
DF
(M)
NS
0.21
**0.
33**
98**
170*
*21
1**
NS
31**
28**
103*
*16
0**
202*
*
Inte
ract
ion
(M
x T)
NS
**N
SN
SN
SN
SN
SN
S*
NS
NS
NS
Tilla
ge sy
stem
(T
)C
T2.
462.
512.
5156
395
411
2359
8413
762
210
3812
60ZT
2.11
2.74
3.28
415
1115
1641
5110
215
646
512
1717
98R
esid
ue
mul
chin
g +
RD
F (M
)M
11.
892.
072.
4638
384
411
0443
6511
642
590
912
20M
22.
472.
73.
0455
211
0813
0959
112
149
611
1220
1459
M3
2.04
2.56
2.75
433
939
1236
4979
153
483
1017
1390
M4
2.75
3.16
3.32
587
1247
1879
6911
616
665
613
6320
45LA
I: Le
af a
rea
inde
x, B
GF:
bef
ore
grai
n fil
ling,
Dou
gh: b
efor
e ph
ysio
logi
cal m
atur
ityZT
indi
cate
s zer
o til
lage
and
CT
indi
cate
s con
vent
iona
l till
age.
M1,
M2,
M3 a
nd M
4 ind
icat
es n
o m
ulch
+ re
com
men
ded
dose
of f
ertil
izer
(RD
F), m
ulch
(6 t
ha-1) +
reco
mm
ende
d do
se o
f fer
tiliz
er (1
20:6
0:40
kg
NPK
) (R
DF)
, m
ulch
(0) +
125%
reco
mm
ende
d do
se o
f fer
tiliz
er (R
DF)
, mul
ch (6
t ha
-1) +
125
% re
com
men
ded
dose
of f
ertil
izer
(RD
F),
resp
ectiv
ely.
NS,
Not
sign
ifica
nt, *
Sign
ifica
nt a
t P<0
.05,
**S
igni
fican
t at P
<0.0
1.
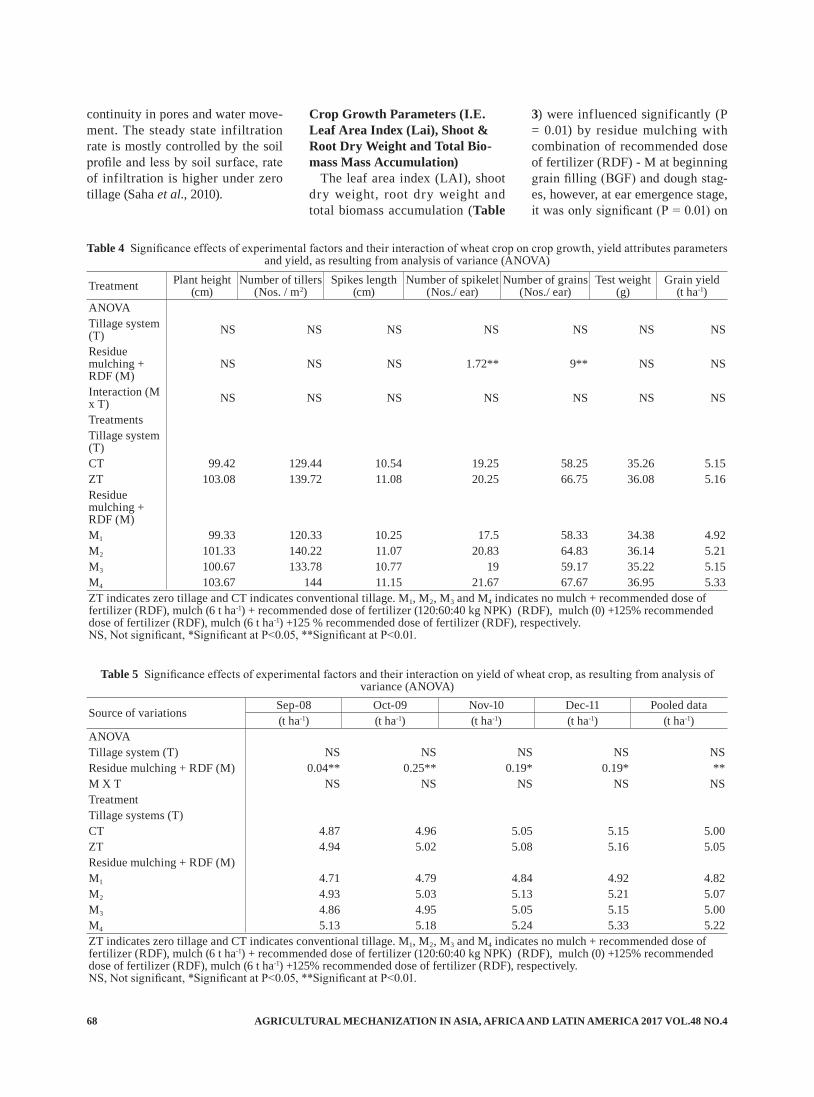
AGRICULTURAL MECHANIZATION IN ASIA, AFRICA AND LATIN AMERICA 2017 VOL.48 NO.468
continuity in pores and water move-ment. The steady state infiltration rate is mostly controlled by the soil profile and less by soil surface, rate of infiltration is higher under zero tillage (Saha et al., 2010).
Crop Growth Parameters (I.E. Leaf Area Index (Lai), Shoot & Root Dry Weight and Total Bio-mass Mass Accumulation)
The leaf area index (LAI), shoot dry weight, root dry weight and total biomass accumulation (Table
3) were influenced significantly (P = 0.01) by residue mulching with combination of recommended dose of fertilizer (RDF) - M at beginning grain filling (BGF) and dough stag-es, however, at ear emergence stage, it was only significant (P = 0.01) on
Treatment Plant height(cm)
Number of tillers (Nos. / m2)
Spikes length(cm)
Number of spikelet(Nos./ ear)
Number of grains(Nos./ ear)
Test weight(g)
Grain yield(t ha-1)
ANOVATillage system (T) NS NS NS NS NS NS NS
Residue mulching + RDF (M)
NS NS NS 1.72** 9** NS NS
Interaction (M x T) NS NS NS NS NS NS NS
TreatmentsTillage system (T)CT 99.42 129.44 10.54 19.25 58.25 35.26 5.15ZT 103.08 139.72 11.08 20.25 66.75 36.08 5.16Residue mulching + RDF (M)M1 99.33 120.33 10.25 17.5 58.33 34.38 4.92M2 101.33 140.22 11.07 20.83 64.83 36.14 5.21M3 100.67 133.78 10.77 19 59.17 35.22 5.15M4 103.67 144 11.15 21.67 67.67 36.95 5.33ZT indicates zero tillage and CT indicates conventional tillage. M1, M2, M3 and M4 indicates no mulch + recommended dose of fertilizer (RDF), mulch (6 t ha-1) + recommended dose of fertilizer (120:60:40 kg NPK) (RDF), mulch (0) +125% recommended dose of fertilizer (RDF), mulch (6 t ha-1) +125 % recommended dose of fertilizer (RDF), respectively.NS, Not significant, *Significant at P<0.05, **Significant at P<0.01.
Table 4 Significance effects of experimental factors and their interaction of wheat crop on crop growth, yield attributes parameters and yield, as resulting from analysis of variance (ANOVA)
Source of variations Sep-08 Oct-09 Nov-10 Dec-11 Pooled data (t ha-1) (t ha-1) (t ha-1) (t ha-1) (t ha-1)
ANOVATillage system (T) NS NS NS NS NSResidue mulching + RDF (M) 0.04** 0.25** 0.19* 0.19* **M X T NS NS NS NS NSTreatmentTillage systems (T)CT 4.87 4.96 5.05 5.15 5.00ZT 4.94 5.02 5.08 5.16 5.05Residue mulching + RDF (M)M1 4.71 4.79 4.84 4.92 4.82M2 4.93 5.03 5.13 5.21 5.07M3 4.86 4.95 5.05 5.15 5.00M4 5.13 5.18 5.24 5.33 5.22ZT indicates zero tillage and CT indicates conventional tillage. M1, M2, M3 and M4 indicates no mulch + recommended dose of fertilizer (RDF), mulch (6 t ha-1) + recommended dose of fertilizer (120:60:40 kg NPK) (RDF), mulch (0) +125% recommended dose of fertilizer (RDF), mulch (6 t ha-1) +125% recommended dose of fertilizer (RDF), respectively.NS, Not significant, *Significant at P<0.05, **Significant at P<0.01.
Table 5 Significance effects of experimental factors and their interaction on yield of wheat crop, as resulting from analysis of variance (ANOVA)

VOL.48 NO.4 2017 AGRICULTURAL MECHANIZATION IN ASIA, AFRICA AND LATIN AMERICA 69
Agricultural Research. John Wi-ley & Sons, Singapore.
Halvorson, A. D., B. J. Wienhold and A. L. Black. 2002. Tillage, nitrogen, and cropping system ef-fects on soil carbon sequestration. Soil SCI. Soc. Am. J. 66, 906-912.
Havlin, J. L., D. E. Kissel, L. D. Maddux, M. M. Claassen and J. H. Long. 1990. Crop rotation and tillage effects on soil organic car-bon and nitrogen. Soil Sci. Soc. Am. J. 53, 1515-1519.
Karlen, D. L., N. C. Wollenhaupt, D. C. Erbach, E. C. Berry, J. B. Swan, N. S. Eash and J. L. Jor-dahl. 1994. Long term tillage ef-fects on soil quality. Soil Till. Res. 32.313-327.
Kemper, W. D. and W. S. Chepil. 1965. Size distr ibution of ag-gregates. In: Black, C.A. (Ed.), Methods of soil analysis. Part 1. Physical and Mineralogical prop-erties, including statistics of mea-surement and sampling. Agron. Monogr. 9. ASA, Madison, WI, pp. 499-510.
Kemper, W. D. and R. C. Rosenau. 1986. Aggregate stability and size distribution, In: Klute, A. (Ed.), Methods of soil analysis. Part 1. Physical and Mineralogical Meth-ods. ASA-SSSA, Madison, WI, pp. 425-440.
Lal, R. 1989. Conservation tillage for sustainable agriculture. Adv. Agron. 42,85-197.
Malhi, S. S. and R. Lemke. 2007. Tillage, crop residue and N fertil-izer effects on crop yield, nutrient uptake, soil quality and nitrous oxide gas emissions in a second 4-yr rotation cycle. Soil Till. Res. 96, 269-283.
Mrabet, R., N. Saber, A. Ei-Brahli, S. Lahlou and F. Bessam. 2001. Total, particulate organic matter and structural stability of a Cal-cixeroll soil under different wheat rotat ions and t il lage systems systems in a semiarid area of Mo-rocco. Soil & Tillage rsearch, 57, 225-235.
Nyborg, M, E. D. Solberg, S. S.
shoot dry weight and total biomass accumulation. Tillage system in-fluenced significantly (P = 0.05) on shoot dry weight and total biomass accumulation at all three growth stages i.e. ear emergence (EE), BGF and dough stages, however, on LAI at dough stage, it significant at P = 0.01.
Zero tillage treatment has shown higher value as compared to con-ventional tillage but not significant in respect of all parameters. Signifi-cantly (P = 0.01) higher growth pa-rameters (i.e. LAI, shoot dry weight, root dry weight and total biomass accumulation) at almost three stages were observed in treatments M4 than M2 , M1 and M3. Except at ear emergence stage of LAI and root biomass, the treatments M4 was noticed at pat with other treatments (Talbe 3). The lowest all growth parameters were observed in M1 and most of cases it was at par with M3. The interaction of tillage sys-tem with crop residue mulching and combination of RDF was significant at P = 0.01 on LAI at BGF and root biomass at dough stage but other all interactions were not significant.
Yield Attributes and Grain YieldThe yield attributes of wheat (i.e.
plant height, number of tillers and test weight) were not significantly (P = 0.05) affected by the tillage systems and crop residue mulching with combination of recommended dose of fertilizer (RDF), however, the number of spikelets/ear (Table 4), number of grains/ear were ob-served significant (P = 0.01) of crop residue mulching with combination of recommended dose of fertilizer (RDF). However, higher value was observed in zero tillage as compared to conventional tillage ultimately greater grain yield was also noticed in zero tillage.
Significantly higher number of spikelet and number of grains per ear was observed in M4 which was at pat with M2 (Table 4). Other parameters (i.e. plant height, num-
ber of tillers, spike length and test weight) were found not significant. The highest grain yield of wheat crop was observed in M4 (5.33 t ha-1) and followed by M2 (5.21 t ha-1), M3 (5.15 t ha-1) and M1 (4.92 t ha-1) but difference among the treatments was non-significant (Table 5).
ConclusionsThe highest growth parameters
(LAI, shoot dry, total biomass ac-cumulation) and ultimately produc-tivity of wheat crop was recorded in plot where 25% higher fertilizer and 6 t ha-1 (M4) was applied than others treatments. It was concluded that wheat sown in zero tilled strip had significantly higher SOC and MBC contents while it was lowest in con-ventionally sown.
REFERENCES
Chen, H. Q., R. X. Hou, Y. S. Gong, H. W. Li, M. S. Fan and Y. Kuzya-kov. 2009. Effects of 11 years of conservation tillage on soils organic matter fractions in wheat monoculture in loess Plateau of China. Soil Till Res 106:85-94.
Dalal, R. C., P. A. Henderson, J. M. Glasby. 1991. Organic matter and microbial biomass in a vertisol af-ter 20 yrs of zero tillage. Soil Biol Biochem 23:435-441.
Doran, J. W., and M. Scott-Smith. 1987. Organic matter manage-ment and utilization of soil and fertilizer nutrients. In: Follett RF, Stewart JWB, Cole CV (eds) Soil fertility and organic matter as critical components of produc-tion systems. American society of agronomy, Madison, WI, USA, pp 53-72.
Doran, J. W. 1980. Soil microbial and biochemical changes associ-ated with reduced tillage. Soil Sci Soc Am. J 44:765-771.
Gomez, K. A. and A. A. Gomez. 1984. Statistical Procedures for

AGRICULTURAL MECHANIZATION IN ASIA, AFRICA AND LATIN AMERICA 2017 VOL.48 NO.470
Malhi and R. C. Izaurralde. 1995. Fertilizer N, crop residue, and tillage after soil C and N content in a decade. In : Lal R, Kimble J, Levine E, Stewart BA (eds) Soil management and greenhouse ef-fect. Adv. Soil Sci. Lewis Publish-ers, CRC Press, Boca Raton, FL, USA, pp 93-99.
Saha, S., D. Chakraborty, A. R. Sharma, R. K. Tomar, S. Bhad-raray, U. Sen, U. K. Behera, T. J. Purakayastha, R. N. Garg, N. Ka-lra. 2010. Effect of tillage and resi-due management on soil physical properties and crop productivity in maize (Zea mays)-Indian mustard
(Brassica juncea) system. Indian Journal of Agricultural Sciences 80 (8):679-85.
Solberg, E. D., M. Nyborg, R. C. Izaurralde, S. S. Malhi, H. H. Janzen and M. Molina-Ayala. 1997. Carbon storage in soils under continuous cereal grain cropping: N fertilizer and straw. In: Lal R, Kimble JM, Follett RF, Stewart BA (eds) Management of carbon sequestration in soil. Adv. Soil Sci. Lewis Publishers, CRC Press, Boca Raton, FL, USA, pp 235-254.
Yoder, R. E. 1936. A direct method of aggregate analysis of soils and
study of the physical nature of soil erosion loses. Am. Soc. Agron. J. 28, 337-351.
Zibilske, L. M. and J. M. Bradford. 2007. Soil aggregation, aggregate carbon and nitrogen, and moisture retention induced by conservation tillage. Soil. Sci. Am. J. 71, 793-802.
Zotarelli, I., B. J. R. Alves, S. Urqui-aga, E. Torres, H. P. dos Santos, K. Paustian, R. M. Boddey and J. Six. 2005. Impact of tillage and crop rotation aggregate-associated carbon in two oxisols. Soil Sci. Am. J. 69, 482-491.
■■
New Co-operating Editor
Rostom AliDate of Birth: December 22, 1979Nationality: BangladeshiPresent Position: Professor, Department of Farm Power and Machinery, Bangladesh Agricultural University,
Mymensingh-2202, BangladeshEducation Background:
2014-2015: Postdoc (Renewable Energy Systems), Kyoto University, Japan2008-2011: Doctor of Philosophy (Engineering), Tohoku University, Japan2005-2006: Master of Science (Farm Power and Machinery), Bangladesh Agricultural University, My-
mensingh-2202, Bangladesh1997-2002: B.Sc. Eng. (Mechanical), Bangladesh University of Engineering and Technology (BUET), Dhaka, Bangladesh
Professional Experience:September 2015 to Present: Professor, Department of Farm Power and Machinery, Bangladesh Agricultural University, My-
mensingh-2202, BangladeshSeptember 2011 to August 2015: Associate Professor, Department of Farm Power and Machinery, Bangladesh Agricultural Uni-
versity, Mymensingh-2202, BangladeshAugust 2012 to July 2014: Head, Department of Farm Power and Machinery, Bangladesh Agricultural University, Mymensingh-
2202, BangladeshSeptember 2005 to August 2011: Assistant Professor, Department of Farm Power and Machinery, Bangladesh Agricultural Uni-
versity, Mymensingh-2202, BangladeshJune 2003 to August 2005: Lecturer, Department of Farm Power and Machinery, Bangladesh Agricultural University, My-
mensingh-2202, BangladeshIn addition to the professional experiences, he is currently involved in USAID, USA funded two research projects. He has suc-
cessfully completed four research projects as a principal investigator. He has published more than 30 research articles in peer reviewed national and international journals.
E-mail: [email protected]

VOL.48 NO.4 2017 AGRICULTURAL MECHANIZATION IN ASIA, AFRICA AND LATIN AMERICA 71
Design and Development of Pedal Operated Ragi Thresher for Tribal Region of Odisha, India
bySmrutilipi HotaSRF, Central Institute of Agricultural EngineeringBhopal - 462038INDIA
J. N. MishraAssociate ProfessorCollege of Agricultural Engineering and Technol-ogy, OUAT, Bhubaneswar - 751003INDIA
S. K. MohantyAssociate ProfessorCollege of Agricultural Engineering and Technol-ogy, OUAT, Bhubaneswar - 751003INDIA
Abhijit KhadatkarScientistCentral Institute of Agricultural EngineeringBhopal- [email protected]
AbstractRagi is an important millet crop
and a major source of energy rich food of tribal people of Odisha. It is mostly grown in hilly regions of Ko-raput, Ganjam, Rayagada, Gajapati, Kalahandi districts of Odisha in In-dia. Threshing of ragi in traditional method is very time consuming, te-dious and labourious activity. Also, the output capacity is very low, less economic and produces low quality product. As most of the tribal have small land holding, poor economy, insufficient power supply and poor transport facility, a pedal operated ragi thresher was developed for the tribal regions of Odisha. The maximum threshing and cleaning efficiency of the developed thresher was found to be 95.3% and 95.2%, respectively. The average threshing efficiency, cleaning efficiency, grain damage and total grain loss were obtained as 92.2%, 93%, 2.3% and 2.5%, respectively.
Keywords: Ragi, Tribal, Tradi-tional, Threshing, Cleaning and Ef-
ficiency
IntroductionRagi (Eleusine Coracana) also
known as finger millet is very im-portant small millet of Poaceae fam-ily, which is a major food of tribal people of Odisha state of India. The crop occupies 2.5 million hectare area and produces 2.6 million tonne of grain in India. It is mostly grown in hilly regions of Karnataka, Od-isha, Tamil Nadu, Andhra Pradesh states and also in North-western Hi-malaya of India (Singh and Mishra, 2008). Odisha stands second after Karnataka in production of ragi by producing 11% of total produc-tion in India. The production was about 151.42 thousand tonne from 169.22 thousand hectare area with yield of 895 kg/ha. In Odisha, ragi is mostly cultivated by tribal people in Koraput, Ganjam, Rayagada, Gajapati and Kalahandi districts. Ragi is a good source of energy as it is rich in carbohydrates, proteins,
minerals and dietary fibres. Ragi contains amino acid, methionine and lysine, which are essential for the poor people. It is consumed in form of cooked cakes, puddings or porridge. As compared to rice, it provides eight times more calcium, four times more minerals and four times more phosphorus per unit grain consumption. The 100 grams of ragi grain contains 88 g carbohy-drate, 7.3 g protein, 1.3 g fat, 2.7 g minerals, 344 mg calcium, 3.6 g fi-bre, 0.33 mg thiamine (B1), 0.11 mg riboflavin (B2), 1.2 mg niacin (B3) and 328 kCal of energy (Barbeau and Hilu, 1993; Malleshi, 2005).
Odisha is having 62 tribes with a population of 84.51 million. The t r ibal people in Odisha occupy 22.1% of total area mostly located in hilly regions and not connected with road and electricity. In tribal areas, the threshing of ragi is done generally by traditional method, i.e. by manual beating with a stick on a hard surface. The traditional meth-od of ragi threshing is very tedious, t ime consuming, less eff icient,

AGRICULTURAL MECHANIZATION IN ASIA, AFRICA AND LATIN AMERICA 2017 VOL.48 NO.472
uneconomical process (Singh and Mishra, 2010). The output is very low and produces low quality prod-ucts (Singh et al., 2003; Singh and Mishra, 2010). Therefore, a pedal operated ragi thresher was designed and developed for the tribal people of Odisha.
Materials and MethodsA pedal operated ragi thresher
was developed and evaluated by taking the Chilika variety of ragi as raw materials. Threshing efficiency, grain damage, cleaning efficiency and total grain loss were measured. The design considerations were as below.
Design of Feed HopperThe hopper was designed on the
basis of bulk density of crop, quan-tity of crop to be fed each time and angle of repose of the crop. The calculation was done by using the following equations,V ≥ W / BD .......................................(1)
Where,V = volume or holding capacity of
the feed hopper, m3
W = quantity of crop fed into the feed hopper during each filling, kg
BD = bulk density of the crop, kg/m3
For ensuring smooth and continu-ous gravity f low of the ear heads from the hopper to the cylinder, ϴh ≥ ϴ ...............................................(2)
Where,ϴh = angle of inclination of the feed
hopper to the horizontal, degreesϴ = angle of repose of the crop, de-
greesThe feed hopper was designed
for of 3 kg capacity of ear heads. The feed hopper was of rectangular shape, tapered with a slope of 45° towards the threshing chamber. The length, width and height of the hopper were 340, 260 and 200 mm, respectively. One shutter was pro-vided which can be easily moved
forward and backward manually to control the feed rate. The size of outlet of hopper was 180 mm × 80 mm. The hopper is supported by 25 × 25 × 3 mm mild steel angle which was welded to main frame.
Design of the Threshing UnitThreshing drum
Threshing of ragi requires both impact and shear forces for better operation (Singh et al., 2008). A combination of MS flat and canvas strips were used as threshing ele-ment which gave less broken grains than the iron face of the rasp bar type cylinder (Saiedirad and Javedi, 2011). The cylinder drum consisted of six bars at a gap of 48 mm and 60° angle. L = q / qa × Rb ...................................(3)
Where,L = length of drum, mq =feed rate of crop, kg/sqa = allowable feed rate, kg/s/mRb = no. of bars
The length of drum was found to be 260 mm. A canvas strip of size 260 × 25 × 5 mm was riveted in between two MS flats strips of size 260 × 25 × 5 mm welded on the cyl-inder longitudinally.
Diameter of drum was calculated by the formula,Ad / Ar = 3 ........................................(4)
Where,Ad =Peripheral area of threshing
drum, mm2
Ar = Total area of rasp bars, mm2
The diameter of the threshing drum was obtained as 150 mm di-ameter.Speed of threshing drumN = (v × 60) / πD ............................(5)
Where,N=No. of revolutions of drum,
rpmv = peripheral velocity, m/s (2.75 m/
s for threshing of ragi)D = Diameter of cylinder, m
The drum speed was obtained as 350 rpm.Threshing cylinder shaft
The shaft used in the thresher was a solid circular cross-section made
of MS rod for transmitting power and rotational motion through chain drive arrangement. The shaft was subjected to shear stress due to ro-tational motion and bending stress due to weight of the elements over it such as pinion, coverings in addition to its self-weight and maximum per-missible dynamic load on it. Also, the shaft should be designed to sus-tain adequate torsional strength to transmit torque and not to be over stressed. Therefore, the shaft is to be designed to sustain a combina-tion of bending and torsional loads. The shaft is supported on two bear-ings. So the maximum bending mo-ment produced on it was obtained from the equation given by Sarangi (2013),M = W / 2 × L / 2 ............................(6)
Where,M = Maximum bending moment,
kg-mW = Weight of the shelling unit on
the shaft, kgL = Distance between the two bear-
ing, mThe developed torque was calcu-
lated from the equation considering, a person can develop 0.1 hp. HP = 2πNT / 4500 ..........................(7)
Where,HP = Horse power produced by
the operator (better to use kW or Watts for power as all units are in SI)
N =Revolution per minute of the shaft, rpm
T = Torque developed, kg-mFor safety, maximum torque
transmitted was taken.The equivalent torque given by
Guest’s theory,Teq = √(T2 + M2) ............................(8)
When a pure torque acts on a cir-cular shaft the relation between ap-plied moment and internal stress is given by the equation, T / J = Fs / r ....................................(9)
Where,T = the applied torque, kg-cmJ = polar moment of inertia of shaft,
cm4
Fs = torsional shear stress, kg/cm2
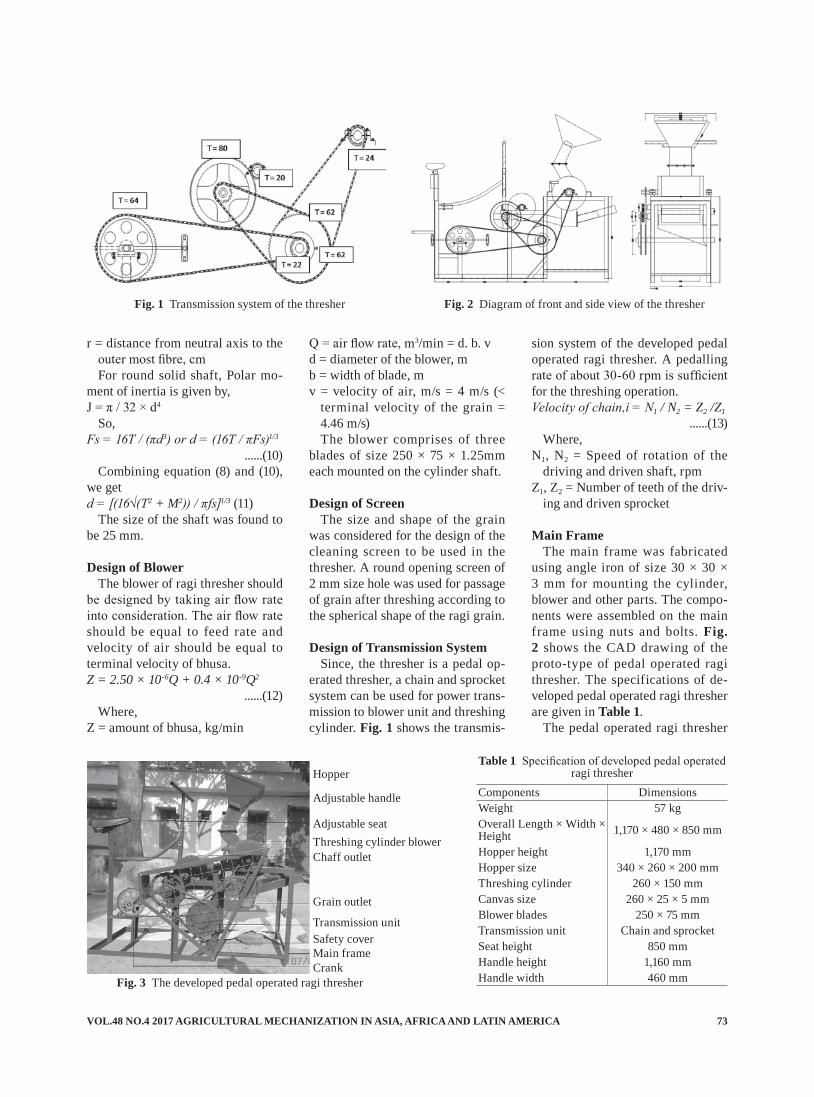
VOL.48 NO.4 2017 AGRICULTURAL MECHANIZATION IN ASIA, AFRICA AND LATIN AMERICA 73
r = distance from neutral axis to the outer most fibre, cmFor round solid shaft, Polar mo-
ment of inertia is given by,J = π / 32 × d4
So,Fs = 16T / (πd3) or d = (16T / πFs)1/3
......(10)Combining equation (8) and (10),
we getd = [(16√(T2 + M2)) / πfs]1/3 (11)
The size of the shaft was found to be 25 mm.
Design of BlowerThe blower of ragi thresher should
be designed by taking air flow rate into consideration. The air flow rate should be equal to feed rate and velocity of air should be equal to terminal velocity of bhusa. Z = 2.50 × 10⁻⁶Q + 0.4 × 10⁻⁹Q2
......(12)Where,
Z = amount of bhusa, kg/min
Q = air flow rate, m3/min = d. b. vd = diameter of the blower, mb = width of blade, mv = velocity of air, m/s = 4 m/s (<
terminal velocity of the grain = 4.46 m/s)The blower comprises of three
blades of size 250 × 75 × 1.25mm each mounted on the cylinder shaft.
Design of ScreenThe size and shape of the grain
was considered for the design of the cleaning screen to be used in the thresher. A round opening screen of 2 mm size hole was used for passage of grain after threshing according to the spherical shape of the ragi grain.
Design of Transmission SystemSince, the thresher is a pedal op-
erated thresher, a chain and sprocket system can be used for power trans-mission to blower unit and threshing cylinder. Fig. 1 shows the transmis-
sion system of the developed pedal operated ragi thresher. A pedalling rate of about 30-60 rpm is sufficient for the threshing operation. Velocity of chain,i = N1 / N2 = Z2 /Z1
......(13)Where,
N1, N2 = Speed of rotation of the driving and driven shaft, rpm
Z1, Z2 = Number of teeth of the driv-ing and driven sprocket
Main FrameThe main frame was fabricated
using angle iron of size 30 × 30 × 3 mm for mounting the cylinder, blower and other parts. The compo-nents were assembled on the main frame using nuts and bolts. Fig. 2 shows the CAD drawing of the proto-type of pedal operated ragi thresher. The specifications of de-veloped pedal operated ragi thresher are given in Table 1.
The pedal operated ragi thresher
Components DimensionsWeight 57 kgOverall Length × Width × Height 1,170 × 480 × 850 mm
Hopper height 1,170 mmHopper size 340 × 260 × 200 mmThreshing cylinder 260 × 150 mmCanvas size 260 × 25 × 5 mmBlower blades 250 × 75 mmTransmission unit Chain and sprocketSeat height 850 mmHandle height 1,160 mmHandle width 460 mm
Table 1 Specification of developed pedal operated ragi thresher
Fig. 1 Transmission system of the thresher Fig. 2 Diagram of front and side view of the thresher
Hopper
Adjustable handle
Adjustable seatThreshing cylinder blowerChaff outlet
Grain outlet
Transmission unitSafety coverMain frameCrank
Fig. 3 The developed pedal operated ragi thresher

AGRICULTURAL MECHANIZATION IN ASIA, AFRICA AND LATIN AMERICA 2017 VOL.48 NO.474
was designed and a prototype was developed at OUAT, Bhubaneswar, Odisha, India (Fig. 3). The perfor-mance evaluation of the developed pedal operated ragi thresher was conducted to determine the best suitable threshing cylinder speed, threshing element and air velocity for maximum threshing efficiency and cleaning efficiency with mini-mum grain damage and least grain loss. The performance of developed ragi thresher was compared with the traditional method of hand beating of the crop.
Results and DiscussionPerformance Evaluation of the Thresher
The performance of the developed thresher was evaluated at different levels of cylinder speed, thresh-ing elements and air velocity. The experiment for the evaluation was statistically designed as a three factor Randomized Block Design (RBD) with three replications. Ob-servations like threshing efficiency, cleaning efficiency, grain damage and total grain loss were recorded.Threshing efficiency
The mean values of threshing ef-ficiency for all cylinder speed and threshing element are presented in the Table 2. The average threshing efficiency was obtained as 92.2%. The th reshing ef f iciency with threshing element of canvas and rubber was obtained as 93.1% and 91.2%, respectively. This may be due to the reason that rubbing action of canvas is more due to the hard and rough surface than the rubber which leads to better threshing.
As cylinder speed increases, the
impact load on the grain increases which leads to more detachment of the grains from the ear heads (Dhananchezhiyan et al., 2013; Gbabo et al., 2013).The interactions between cylinder speed and thresh-ing element showed that maximum threshing efficiency was obtained in the combination of 3.5 m/s cyl-inder speed and canvas threshing element. ANOVA shows that the threshing efficiency was influenced significantly with cylinder speed and threshing element with all com-bination of levels at 1% significance level.Grain damage
The mean values of grain damage for all cylinder speed and thresh-ing element are presented in the Table 3. The average grain damage was obtained as 2.3%. The grain damage with threshing elements of canvas and rubber was obtained as 2.3% and 2.2%, respectively. It was also observed that the grain damage increased with increase in cylinder speed.
As cylinder speed increases, the impact load on the grain increases which causes the damage to the grain (Asli-Ardeh et al., 2009; Alizadeh and Khodabakshipour, 2010; Saiedirad and Javedi, 2011). The grain damage with canvas type threshing element was higher as compared to rubber due to the reason that hardness and surface roughness of canvas was more than that of rubber. ANOVA shows that the grain damage was inf luenced significantly by the cylinder speed and threshing element at all combi-nation of levels at 1% significance level. Cleaning efficiency
The cleaning ef f iciency was
evaluated and the mean values for all cylinder speed and air velocity are presented in the Table 4. The average cleaning eff iciency was obtained as 93%. The cleaning effi-ciency increased from 91.2 to 94.7% as the air velocity increased from 2.4 to 4.0 m/s. The minimum carry-ing velocity of chaff was observed as 2.3 m/s. So, as the air velocity increases the carrying amount of chaff also increases, which lead to increase in cleaning efficiency. The cleaning efficiency increased from 90.5 to 95.2% as the cylinder speed increased from 2.2 m/s to 3.5 m/s. This may be due to the reason that at increased level of cylinder speed, the chaff became finer and carried away by the air easily (Gbabo et al., 2013). The interactions between the cylinder speed and air velocity showed that better cleaning effi-ciency was obtained in the combina-tion of 3.5 m/s cylinder speed and 4.0 m/s air velocity. ANOVA shows that the cleaning efficiency was sig-nificantly influenced by all the air velocity and cylinder speed at 1% significance level. Total grain loss
The total grain loss includes the loss of grain through the chaff which was blown out. The obser-vations were taken and the mean values of grain loss for all cylinder speed and air velocity were pre-sented in the Table 5. The average value of grain loss was obtained as 2.5%. The total grain loss increased from 1.1 to 4.3% as the air velocity increased from 2.4 to 4 m/sand the cylinder speed increased from 2.2 - 3.5 m/s. The minimum terminal velocity of grain was observed as 4.3 m/s. So with the increase of air velocity the amount of blown away
Threshing element
Cylinder speed, m/s2.2 2.75 3.5
Canvas 90.2 93.7 95.3Rubber 88.7 91.6 93.3
Table 2 Threshing efficiency at different cylinder speed and threshing
element (%) Threshing
elementCylinder speed, m/s
2.2 2.75 3.5Canvas 1.02 2.16 3.86Rubber 0.96 2.06 3.76
Table 3 Grain damage at different cylinder speed and threshing element
(%) Air velocity
Cylinder speed, m/s2.2 2.75 3.5
2.4 m/s 90.5 91.3 91.73.0 m/s 92.7 93.3 93.64.0 m/s 94.2 94.8 95.2
Table 4 Cleaning efficiency at different cylinder speed and air velocity (%)

VOL.48 NO.4 2017 AGRICULTURAL MECHANIZATION IN ASIA, AFRICA AND LATIN AMERICA 75
grains might be increased. This may be due to the reason that the in-creased speed allowed some grain to pass off with the chaff (Sessiz and Ulger, 2003; Vejasit and Salokhe, 2004).The total grain loss between the interactions of cylinder speed and air velocity showed that grain loss was minimum at the combina-tion of 2.2 m/s cylinder speed and air velocity of 2.4 m/s and does not depend on the type of threshing ele-ment used. ANOVA shows that the total grain loss was significantly in-fluenced by the cylinder speed and air velocity at 1% significance level.
ConclusionsThe pedal operated ragi thresher
was designed and developed for the tribal region of Odisha. The per-formance evaluation was done and the average threshing efficiency, cleaning efficiency, grain damage and total grain loss was obtained as 92.2%, 93%, 2.3% and 2.5%, respectively. However, the highest threshing efficiency obtained was 95.3% with canvas type threshing element. The highest cleaning ef-ficiency of 95.2% was achieved at air velocity of 4.0 m/s and cylinder speed of 3.5 m/s. The lowest grain damage of 0.96% was obtained with rubber type threshing element and the total grain loss of 1.1% at air ve-locity of 2.4 m/s and cylinder speed of 2.2 m/s.
Therefore, it was recommended to operate the developed pedal operat-ed ragi thresher at 2.75 m/s cylinder speed having canvas type threshing element, as there was high thresh-ing efficiency (93.7%) and less grain damage (2.16%).
AcknowledgementThe authors are grateful to the
Dean, College of Agricultural En-gineering and Technology, OUAT, Bhubaneswar for h is immense support and providing facilities to conduct this study. The authors also wish to thank the staffs of the Department of Farm Machinery & Power and all the subjects who took part in the study.
REFERENCES
Alizadeh, M. R. and M. Khodabak-shipour. 2010. Effect of threshing drum speed and crop moisture content on the paddy grain dam-age in axial f low thresher. Cer-cetari Agronomice in Maldova, XLIII, 4(144), 5-11.
Asli-Ardeh, E. A., Y. Abbaspour-Gilandeh and S. Abbasi. 2009. Study of performance parameters of threshing unit in a single plant thresher. American Journal of Ag-ricultural and Biological Sciences, 4(2), 92-96.
Barbeau, W. E. and K. W. Hillu. 1993. Protein, calcium, iron and amino acid content of selected wild and domesticated cultivars of finger millet. Plant Foods for Hu-man Nutrition, 43, 97-104.
Dhananchezhiyan, P., S. Parveen and K. Rangasamy. 2013. Devel-opment and performance evalu-ation of low cost portable paddy thresher for small farmers. Inter-national Journal of Engineering Research & Technology, 2(7), July, 571-585.
Gbabo, A., I. Gana and M. Amoto. 2013. Design, fabrication and test-ing of a millet thresher. Net Jour-nal of Agricultural Science, 1(6), 100-106.
Malleshi, N. G. 2005. Finger millet − the wonder grain. IFIS, www.ieis.org/fsc.xid.
Saiedirad, M. H. and A. Javedi. 2011. Study on machine crop parameters of cylinder threshers
for cumin threshing. Agricultural Engineering International: CIGR Journal. Manuscript No 1746, 13 (2).
Sarangi, P. 2013. Studies on design and operational parameters of groundnut decorticator through rotary mode of operation using bullock power. M.Tech Thesis.
Sessiz, A. and P. Ulger. 2003. Deter-mination of threshing losses with a raspbar type axial flow thresh-ing unit. Journal of Agricultural Engineering, 40 (4), 1-8.
Singh, K. P., Kundu, S., Gupta, H.S., 2003. Development of higher capacity thresher for ragi/ kodo. Recent trend in millet processing and utilization, pp 109-116.
Singh, K.P. and Mishra, H.N., 2010. Optimization of machine param-eters of finger millet thresher cum pearler. Agricultural Mechaniza-tion in Asia, Africa and Latin America, 41 (1), 60-67.
Vejasit, A. and Salokhe, V.M., 2004. Studies of machine crop param-eters of an axial flow thresher for threshing soybean, Agriculture Engineering International: the CIGR Journal of Scientific Re-search and Development, Manu-script PM 04 004, July, 1-12.
■■
Air velocity
Cylinder speed, m/s2.2 2.75 3.5
2.4 m/s 1.1 1.2 1.33.0 m/s 2.1 2.3 2.44.0 m/s 3.9 4.1 4.3
Table 5 Total grain loss at different cylinder speed and air velocity (%)
AGRICULTURAL MECHANIZATION IN ASIA, AFRICA AND LATIN AMERICA 2017 VOL.48 NO.476
Performance Evaluation of Power Weeders for Paddy Cultivation in South India
byT. SeerangurayarDepartment of SoilsWater and Agricultural Engineering College of Agricultural and Marine Sciences Sultan Qaboos UniversityMuscatSULTANATE OF OMAN
B. ShridarAgricultural Machinery Research CentreTamil Nadu Agricultural UniversityCoimbatoreINDIA
R. KavithaAgricultural Machinery Research CentreTamil Nadu Agricultural UniversityCoimbatoreINDIA
A. ManickavasaganDepartment of SoilsWater and Agricultural EngineeringCollege of Agricultural and Marine Sciences Sultan Qaboos UniversityMuscatSULTANATE OF OMAN
AbstractWeed management in paddy field
is a laborious and cumbersome task. In many small paddy farms of south India, currently manual weeding is being followed. The objective of this study was to evaluate the per-formance of commercially available power weeders (Model A, Model B and Model C) in comparison to manual weeding. The weeding effi-ciency and field efficiency of power weeders were in the range of 60 to 64% and 76 to 78%, respectively. Similarly, the plant damage due to power weeders was in the range of 1.2 to 2.7%. The highest field capac-ity was observed in Model A (0.13 ha/h) followed by Model C (0.09 ha/h) and Model B (0.07 ha/h). While adopting any power weeder, the farmer would be able to save 56 to 64% of weeding cost and 95 to 97% of time over manual weeding.
Key words: paddy, power weeder, plant damage, weeding efficiency, field capacity
IntroductionIndia is the second largest pro-
ducer of rice (Oryza sativa L.) in the world (USDA, 2013). The area un-der rice cultivation in India has been increased from 31 million hectares in 1953-54 to 44 million hectare in 2011-12, with productivity increase from 902 kg/ha to 2,372 kg/ha dur-ing the above period (Ministry of Agriculture, 2013). The production of rice in India was about 106 MT in 2012-13, which accounted 22% of global production (473 MT) (Inter-national Grains Council, 2014).
Weed control is a major operation in agricultural production. In India, about 4.2 billion rupees (approxi-mately 62 Indian rupees (Rs) = 1 US $) are spent every year for con-trolling weeds in the production of major crops. At least 40 million tons of major food grains are lost every year due to weeds alone (Singh and Sahay, 2001). The reduction in yield due to weed is predicted to be 16 to 42% depending on crops and loca-tion, and it involves one third of the
cost of cultivation (Rangasamy et al., 1993). Delay and inattention in weeding operation affect the crop yield up to 30 to 60% (Singh, 1988). Rice and groundnut are very sensi-tive crops to weed, especially in the early stages and results in 50% yield reduction if failed to control (Guna-sena and Arceo, 1981). Experiments revealed that competition of just one kind of weed namely Echinochloa crus-galli in paddy fields decreased around 25% of rice yield (Islam and Haq, 1991).
In general, different types of weed control such as chemical, manual, mechanical, biological and agronomical methods are followed in paddy cultivation (Mohammad, 2011). Chemical methods are more prominent than manual and me-chanical methods, but it produces more adverse effects on environ-ment. Therefore, the current trend is moving towards non-chemical weed control methods (Olaoye et al., 2011). The manual weeding is effective in paddy fields, however it requires 25% of the total labour
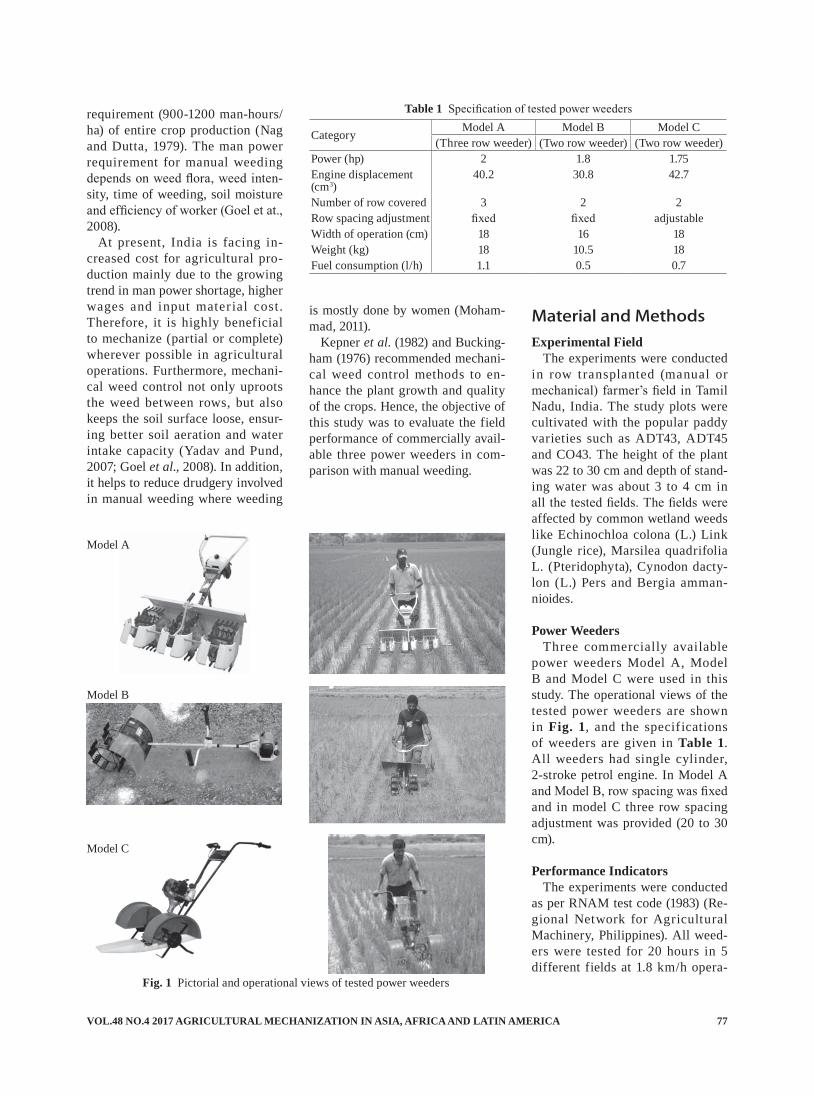
VOL.48 NO.4 2017 AGRICULTURAL MECHANIZATION IN ASIA, AFRICA AND LATIN AMERICA 77
requirement (900-1200 man-hours/ha) of entire crop production (Nag and Dutta, 1979). The man power requirement for manual weeding depends on weed flora, weed inten-sity, time of weeding, soil moisture and efficiency of worker (Goel et at., 2008).
At present, India is facing in-creased cost for agricultural pro-duction mainly due to the growing trend in man power shortage, higher wages and input mater ial cost. Therefore, it is highly beneficial to mechanize (partial or complete) wherever possible in agricultural operations. Furthermore, mechani-cal weed control not only uproots the weed between rows, but also keeps the soil surface loose, ensur-ing better soil aeration and water intake capacity (Yadav and Pund, 2007; Goel et al., 2008). In addition, it helps to reduce drudgery involved in manual weeding where weeding
is mostly done by women (Moham-mad, 2011).
Kepner et al. (1982) and Bucking-ham (1976) recommended mechani-cal weed control methods to en-hance the plant growth and quality of the crops. Hence, the objective of this study was to evaluate the field performance of commercially avail-able three power weeders in com-parison with manual weeding.
Material and MethodsExperimental Field
The experiments were conducted in row transplanted (manual or mechanical) farmer’s field in Tamil Nadu, India. The study plots were cultivated with the popular paddy varieties such as ADT43, ADT45 and CO43. The height of the plant was 22 to 30 cm and depth of stand-ing water was about 3 to 4 cm in all the tested fields. The fields were affected by common wetland weeds like Echinochloa colona (L.) Link (Jungle rice), Marsilea quadrifolia L. (Pteridophyta), Cynodon dacty-lon (L.) Pers and Bergia amman-nioides.
Power WeedersThree commercially available
power weeders Model A, Model B and Model C were used in this study. The operational views of the tested power weeders are shown in Fig. 1, and the specifications of weeders are given in Table 1. All weeders had single cylinder, 2-stroke petrol engine. In Model A and Model B, row spacing was fixed and in model C three row spacing adjustment was provided (20 to 30 cm).
Performance IndicatorsThe experiments were conducted
as per RNAM test code (1983) (Re-gional Network for Agricultural Machinery, Philippines). All weed-ers were tested for 20 hours in 5 different fields at 1.8 km/h opera-
Fig. 1 Pictorial and operational views of tested power weeders
Model A
Model B
Model C
Category Model A Model B Model C(Three row weeder) (Two row weeder) (Two row weeder)
Power (hp) 2 1.8 1.75Engine displacement (cm3)
40.2 30.8 42.7
Number of row covered 3 2 2Row spacing adjustment fixed fixed adjustableWidth of operation (cm) 18 16 18Weight (kg) 18 10.5 18Fuel consumption (l/h) 1.1 0.5 0.7
Table 1 Specification of tested power weeders

AGRICULTURAL MECHANIZATION IN ASIA, AFRICA AND LATIN AMERICA 2017 VOL.48 NO.478
tion speed. Before starting the ex-periments, details about the paddy plants (plant height and number of plants in 10 m row length), weeds (weed height and weed population (number of weeds per square me-ter)) and standing water height were recorded at ten different locations in each field. Similarly, fuel consump-tion, area coverage, width of opera-tion, number of damaged plants (in 10 m row length) and weed popula-tion after operation were recorded during the f ield evaluation. The collected data were used to assess performance of the weeders such as weeding efficiency (%), plant dam-age (%), effective field capacity (ha/h), and field efficiency (%).Weeding efficiency
The weeding efficiency is the ratio between number of weeds removed by a weeder to number of weeds present in the field before weeding in unit area. Generally it is calcu-
lated by Eqn. 1 (Anonymous, 1985):Weeding efficiency (%) = (W1-W2)/
W1 × 100 ................................Eqn. 1Where,
W1 = Number of weeds present be-fore weeding in 1 m2 area of the field
W2 = Number of weeds present after weeding in 1 m2 area of the field
Plant damageThe plant damage is the ratio
between the numbers of damaged plants in a row after weeding to the number of plants present in that row before weeding, and calculated by Eqn. 2 (Gupta, 1981):Plant damage (%) = Q2 / Q1 × 100
......Eqn. 2Where,
Q1 = Number of plants in 10 m row length of field before weeding
Q2 = Number of damaged plants in 10 m row length of field after weeding
Field capacity
a) Theoretical field capacityTheoretical field capacity is de-
fined as the area covered by the ma-chine based on width of implement and speed of operation and calcu-lated by Eqn. 3 (Kepner et al., 1982)Theoretical field capacity (ha/h) =
(W × S) / 10 ..................…... Eqn. 3Where,
W = Width of the implement (m)S = Speed of the operation (km/h)
b) Effective field capacityEffective field capacity is actual
area covered by the machine in given time.Field efficiency
The field efficiency is the ratio of effective field capacity to theoretical field capacity and expressed in per-centage (Eqn. 4) (Hunt, 1995):Field efficiency (%) = (Effective
field capacity) / (Theoretical field capacity) × 100 …................Eqn. 4
Cost Analysis
Fig. 2 Efficiency of tested power weeders Fig. 3 Percentage of plant damage during weeding
Fig. 4 Field capacity of tested power weeders Fig. 5 Field efficiency of tested power weeders

VOL.48 NO.4 2017 AGRICULTURAL MECHANIZATION IN ASIA, AFRICA AND LATIN AMERICA 79
S = Salvage value (Rs)L = Useful life of machine (number
of years)Interest
I = {(P + S) / 2} × i .................Eqn. 6Where,
I = Interest (Rs)P = Cost of the machine (Rs) S = Salvage value (Rs)i = Interest rate (%)
Cost of operationC = Fixed cost + Variable cost =
(FC + RM) + (F + O + L)......Eqn. 7
Where,C = Cost of operation (Rs/h)FC = Fixed cost (Rs/h) which in-
cluded depreciation, interest on capital, insurance, taxes and shel-ter cost
RM = Repair and maintenance cost (Rs/h)
F = Fuel cost (Rs/h)O = Lubricant cost (Rs/h)L = Labor cost (Rs/h)
Results and DiscussionPerformance IndicatorsWeeding efficiency
The efficiency of the tested power weeders was in the range of 60.8 to 64.0% (Fig. 2). The weeders were able to perform in the space between rows only, and the weeds present along the row and near to
plants could not be removed and re-sulted in lower efficiency. However in power weeding, if we employ 2-3 workers to remove weeds which were not taken by the weeders, especially near the plants, it is pos-sible to achieve higher efficiencies. Senthilkumar et al. (2014) stated that the weeding efficiency of power weeders for pulse crops was from 45.4 to 74.1%. Olaoye et al. (2012) developed a rotary power weeder and reported that the efficiency was in the range of 53.7 to 72.4% for various engine speeds.Plant damage
The percentage of plant damage caused by power weeders is given in Fig. 3. It was in the range of 1.2 to 2.7%. When the weeders move in the space between rows it encoun-tered difficulties due to the plant spread, and caused damage. Plant damage can be minimized by pro-viding sufficient row spacing during transplantation and operating with skilled worker. Senthilkumar et al. (2014) reported that the percentage of plant damage of power weeders for pulse crops was in the range of 4.2 to 9.6%.Field capacity
The field capacity of power weed-ers varied from 0.074 to 0.131 ha/h (Fig. 4). Since, Model A was three-row weeder and hence area cover-age was more compared to Model
Equipment/ method
Initial cost(Rs*)
Depreciation(Rs/yr)
Annual fixed cost (Rs/yr)
Annual use(h)
Hourly fixedcost (Rs/h)
Repair and maintenance (Rs)
Fuel cost(Rs/h)
Lubrication cost (Rs/h)
Model A 80,499 14,490 23,828 360 66 4,025 77 23Model B 47,000 8,460 13,912 360 39 2,350 35 11Model C 36,000 6,480 10,656 360 30 1,800 49 15Manual weeding - - - - - - - -
Equipment/ method
Labor charge(Rs/h)
Hourly variable cost (Rs/h)
Actual field capacity (ha/h)
Total cost of operation Cost saving in power weeders over manual weeding (per ha)
Rs/hr Rs/ha (Rs) (%)Model A 100 200 0.131 266 2,031 3,594 64Model B 100 146 0.074 185 2,500 3,125 56Model C 100 164 0.091 194 2,132 3,493 62Manual weeding 18.75** - 0.0033 - 5,625 Base Base*Rs: Indian rupees (approximately 62 Rs = 1 US $)** Rs.150/8h shift
Table 2 Cost analysis to compare tested power weeders and manual weeding
Cost analysis was calculated using fixed and variable cost for the weeders. Straight line method to calculate annual depreciation cost as explained by Kepner et al. (1982) and Hunt (1995) was used. The salvage value and interest rate were assumed as 10% and 12%, re-spectively for the cost of the weeder per annum. The cost of insurance, taxes and shelter was considered as negligible for power weeders, and therefore not included in the cal-culation. Repair and maintenance cost of power weeder was assumed as 5% of capital value and lubricant cost was accounted to be 30% of fuel cost (Remesan et al., 2007). Weeder’s actual fuel consumption was used to calculate fuel cost. Labor wage was taken as per the regional customary rate per day. Annual operation of the equipment was considered as 360 h based on maximum 15 days in each seasons (3 seasons, total 45 days, daily 8 h) of actual use in paddy weeding. The cost of operation, depreciation and interest were calculated using Eqns. 5-7 (Kepner et al., 1982; Hunt, 1995; and Alizadeh et al., 2007).
Depreciation costD = (P-S) / L ............................Eqn. 5
Where,D = Mean annual depreciation cost
(Rs)P = Cost of the machine (Rs)

AGRICULTURAL MECHANIZATION IN ASIA, AFRICA AND LATIN AMERICA 2017 VOL.48 NO.480
B and Model C (two rows weeders). Also it depended on weed intensity, time of weeding and efficiency of operator. Tajuddin (2009) developed low land paddy power weeder and observed effective field capacity was around 0.075 ha/h. Shekhar et al. (2010) stated that field capacity was 0.067 ha/h in maize crop and power weeder was the most efficient time saving weeding tool.Field efficiency
The field efficiency of the power weeders is shown in Fig. 5. It was in the range of 76 to 78%. Maximum field efficiency could be achieved by minimizing nonproductive time (shifting weeder from one pass to another pass, fuel refill time, and so on) during operation. Similar results were also reported by Olaoye et al. (2012) and Shekhar et al. (2010) that the field efficiency of power weed-ers was between 73% and 76%.Cost analysis
Cost analysis of different power weeders and manual weeding is giv-en in Table 2. The results revealed that the operation cost was lower in Model B (Rs.185/h) followed by Model C (Rs.194/h) and Model A (Rs.266/h). The total weeding cost was obtained in the range of Rs.2,031/ha to Rs.2,500/ha. The percentage of cost and time saving when compared to manual weeding is illustrated in Figs. 6 and 7. It was observed that the saving in cost and time ranged from 56 to 64% and 95
to 97%, respectively. However, the machine cost of Model A was high-er than Model B, Model C and there was not much difference in saving cost and time among the weeders. Significant decrease in cost of oper-ation and time saving in mechanical weeder over manual weeding was also reported by other researchers (Parida, 2002; Remesan et al., 2007; Goel et al., 2008; Tajuddin, 2009; Senthilkumar et al., 2014).
ConclusionsThree commercially available
power weeders were tested for their performance in paddy fields. In gen-eral, similar effectiveness was ob-served in all three weeders in terms of field efficiency and weeding ef-ficiency. However, the maximum field efficiency, weeding efficiency and minimum plant damage was found in Model C. The highest field capacity was observed in Model A (0.131 ha/h) followed by Model C (0.0912 ha/h) and Model B (0.074 ha/h). The cost of weeding in power weeders was reduced by 56-64% and time saving was 95-97% while comparing with manual weeding. It is recommended to use power weed-ers in paddy farms along with a few additional workers to remove the left out weeds by the weeders.
AcknowledgementsThe authors would like to express
their acknowledgements to the Indi-an Council of Agricultural Research (ICAR), New Delhi, India for their financial support and Agricultural Engineering College& Research Institute, Tamil Nadu Agricultural University, Coimbatore, India for providing facilities for this research.
REFERENCES
Alizadeh, M. R., I. Bagheri, and M. H. Payman. 2007. Evaluation of a rice reaper used for rapeseed har-vesting. American-Eurasian Jour-nal Agricultural Environmental Science. 2(4): 388-394
A nony mous.1985. R NA M test codes and procedure for farm ma-chinery, Technical series No. 12, Economic and Social Commission for Asia and the Pacific, Regional Network for Agricultural Mecha-nization, Bangkok, Thailand.
Buckingham, F. 1976. Fundamentals of machine Operation. John Deere Service Publicat ion, Moline, Iowa, USA.
Goel, A. K., D. Behera, B. K. Be-hera, S. K. Mohanty, and S. K. Nanda. 2008. Development and Ergonomic Evaluation of Manual-ly Operated Weeder for Dry Land Crops. Agricultural Engineering International: The CIGR eJournal.
Fig. 6 Percentage of cost saving in tested power weeders when compared with manual weeding
Fig. 7 Percentage of time saving in tested power weeders when compared with manual weeding
VOL.48 NO.4 2017 AGRICULTURAL MECHANIZATION IN ASIA, AFRICA AND LATIN AMERICA 81
Manuscript PM 08 009. Vol. X. September.
Gunasena, H. P. M. and L. M. Ar-ceo. 1981. Weed control studies with butachlor in direct seeded rice in ShriLawlea, Proceedings of 8th Asian Pacific weed science society conference, Bangalore, India, November 27-29.
Gupta, C. P. 1981. Report on weed-ers. Regional Network for Agri-cultural Machinery, Manila, Phil-ippines.
Hunt, D. 1995. Farm power and machinery management (9thEdi-tion). Iowa State University Press. Ames, IA, USA.
International Grains Council. 2014. Five-year global supply and de-mand projections. Canada Square, Canary Wharf, London E14 5AE, England.
Islam, M. D. and K. A. Haq. 1991. Development of a low cost weeder for low land paddy. Agricultural Mechanization in Asia, Africa, Latin America. 22(1): 45-48.
Kepner, R. A., R. Bainer and E. L. Barger. 1982. Principle of Farm Machinery. 3rd edit ion, AVI Publishing, INC, West port, Con-necticut, USA.
Mohammad Reza Alizadeh. 2011. Field performance evaluation of mechanical weeders in the paddy field. Scientific Research and Es-says. 6(25): 5427-5434
Ministry of Agricultural. 2013. Pocket book on Agricultural Sta-tistics, Ministry of Agricultural, Department of Agriculture and Cooperation, Government of In-dia New Delhi.
Nag, P. K. and P. Dutta. 1979. Ef-fectiveness of some simple agri-cultural weeders with reference to physiological responses. J. Human Ergonomics 8: 11-21.
Olaoye J. O., and T. A. Adekanye. 2011. Development and Evaluation of an rotary power weeder. Till-age for Agriculture productivity and environmental sustainability-conference, held in Ilorin, Nigeria (February 21-23 2011) Page No.
129-141.Olaoye, J. O., O. D. Samueland
and T. A. Adekanye. 2012. Per-formance Evaluation of an In-digenous Rotary Power Weeder. Energy and Environmental Engi-neering Journal. 1(2): 94-97.
Parida, B. C. 2002. Development and evaluation of star cum cono-weeder for r ice. Agricultural Mechanization in Asia, Africa, Latin America. 33(3): 21-22.
Rangasamy. K., M. Balasubramani-um and K. R. Swaminathan. 1993. Evaluation of power weederper-formance. Agricultural Mecha-nization in Asia, Africa, Latin America. 24(4): 16-18.
RNAM. 1983. Testing, evaluation and modification of weeders. Re-gional Network for Agricultural Mechinery, Phillipines, Technical Series No.12:4-21.
Remesan., R., M. S. Roopesh, N. Remya and P. S. Preman. 2007. Wet land weeding- A compre-hensive comparative study from south India. Agricultural Engi-neering International: The CIGR E-Journal. Manuscript PM 07011, 9: 1-21.
Senthilkumar, T., V. M. Duraisamy and D. Asokan. 2014. Performance evaluation of different models of power weeders for pulse crop cultivation. Agricultural Mecha-nization in Asia, Africa& Latin America. 45(1): 15-19.
Shekhar, S., S. Chandra, and D. K. Roy. 2010. Performance evalua-tion of different weeding tools in maize. Indian Journal of Weed Science. 42 (1&2): 95-97.
Singh, G. 1988. Development and fabrication techniques of im-proved grubber. Agricultural Mechanization in Asia, Africa& Latin America 19(2): 42-46.
Singh, G. and K. M. Sahay. 2001. Research, Development and tech-nology dissemination. A silverJu-bilee Publication, CIAE, Bhopal, India.
Tajuddin, A. 2009. Development of a power weeder for low land rice.
IE (I). 90:15-17.USDA. 2013. http://www.ers.usda.
gov/publications /Rice Outlook/ RCS-13e/May 14, 2013, Economic Research service, USDA.
Yadav, R. and S. Pund. 2007. Devel-opment and Ergonomic evaluation of manual weeder. Agricultural Engineering International: The CIGR E-Journal. Manuscript PM 07022, Vo. IX. October, 2007.
■■

AGRICULTURAL MECHANIZATION IN ASIA, AFRICA AND LATIN AMERICA 2017 VOL.48 NO.482
Design and Development of A Pull Type Four Row Urea Super Granule Applicator
byM. AlamProfessorDept. of Farm Power & MachineryBangladesh Agricultural UniversityMymensingh [email protected]
A. KunduPost Graduate StudentDept. of Farm Power & MachineryBangladesh Agricultural UniversityMymensingh 2202BANGLADESH
M. A. HaqueProfessorDept. of Farm Power & MachineryBangladesh Agricultural UniversityMymensingh [email protected]
M. S. HudaPost Graduate StudentDept. of Farm Power & MachineryBangladesh Agricultural UniversityMymensingh 2202BANGLADESH
AbstractAlthough deep placement of urea
super granule (USG) reduces the losses of urea and increases yield, it was not being practiced broadly in Bangladesh due to lack of an ap-propriate applicator. Therefore, a four row pull type manually oper-ated USG applicator was designed and developed at the department of Farm Power and Machinery, Ban-gladesh Agricultural University, Mymensingh. The width of the applicator was 1.6 m. The lowest values of missing (0.86%), over-falling (0.90%) and breaking (0.6%) of USG were found in the speed range of 2.05 to 2.21 km/h in a laboratory experiment. Therefore, the recommended operating speed of the applicator was 2 to 2.2 km/h. The effective field capacity and field efficiency of the applicator at a for-ward speed of 2.06 km/h were 0.26 ha/h and 78%, respectively. The average spacing between USG in a row was found to be 39.89 cm which was desired. The cost of the applica-tor was US$ 78 and the operating
cost of the applicator was US$ 22 per hectare. The machine was easy to pull because the maximum draft and drawbar power were only 0.105 kN and 0.06 kW, respectively in puddle field. Moreover, the weight of the whole applicator was only 12 kg which made it easy to carry. The break-even point of the applicator when compared with manual ap-plication of USG justified the own-ership of this machine for an area of only 0.63 ha/yr of rice land. The overall performance of the applica-tor was found better than that of the available USG applicators in Ban-gladesh. Therefore, the developed applicator might be introduced in the Bangladesh to apply USG in rice field.
IntroductionThe expansion of modern agri-
cultural practices to intensify cul-tivation has led to a high demand of fer tilizers application in the cultivation processes. Urea is one of the main inputs which are required
for increasing the crop production (NAP, 2009). Urea can be classified as prilled and granular type. Most of the farmers of Bangladesh ap-ply prilled urea in their rice field by broadcasting method and this cause huge wastage of urea in different ways: i) a part of it converts into gaseous form and mixes with air, ii) a portion dissolves with rain or irrigation water and runoff to sur-rounding canal and river from the field applied, and iii) some of those go beyond the root zone of the rice plants (NAP, 2009). This wastage of urea can be minimized through deep placement of urea super gran-ule (USG) at a depth of 7-10 cm. In this process, the effectiveness of the fertilizer could be enhanced from 40 to 70% (The Bangladesh Today, 2009) and rice yield could be increased by 20-25% (IFDC, 2005 & 2007). Most of the farmers of Bangladesh apply USG by hand which is tedious and time consum-ing. It takes 50 man-hrs to apply USG on one hectare of land. Manual placing of USG also creates back pain, and diseases in fingers of the

VOL.48 NO.4 2017 AGRICULTURAL MECHANIZATION IN ASIA, AFRICA AND LATIN AMERICA 83
farmer applying it. Moreover, it is difficult to place a USG in an accu-rate depth and spacing by hand. So the performance of the USG applied manually in the field is not satisfac-tory. With a view to overcome all these problems, a limited number of researches were conducted to develop granular urea applicator in Bangladesh. IFDC (1989) developed a device for placement of granular urea but this was not a mechanical applicator. Therefore, it did not de-
crease the drudgery of the farmers (Savant, 1991). Wohab et al. (2011) developed a hand driven urea super granule (USG) applicator machine at Bangladesh Rice Research In-stitute (BRRI). With this machine two labourers could apply USG in 33.33 decimal of rice land per hour. BARI (2009) and other institutes (BRRI, HYPA) developed 2-row push type USG applicators (Fig. 1 a-c) and the effective field capacity of those varied from 0.087 to 0.092
ha/h. Ahmed (2011) worked on the improvement of an existing push type USG applicator. Sultana (2011) developed a pull type single row granular urea applicator while Ajoy and Fazlu (2012), Alam et al. (2013 & 2014) designed and developed a pull type 2-row USG applicator (Fig. 1 d). The effective field capac-ity (0.11 ha/h) of the later one was found higher than those of the push type USG applicators. The effective field capacities of the existing USG applicators are still low which con-tributes to high cost of USG appli-cation. Still, there remains scope to increase the width of the applicator keeping the pulling force within the practical limit. Therefore, a research was conducted with a view to design and develop an improved granular urea applicator which will increase the field and economic performance compared to the available USG ap-plicators in Bangladesh.
Materials and MethodThe four row granular urea appli-
cator was designed and developed at the engineering workshop of the department of Farm Power and Ma-
Fig. 1 Different types of USG applicators. a. BARI made USG applicator, b. BRRI made USG applicator, c. HYPA made USG applicator, and d. Alam made pull type
USG applicator
(a) (b)
(c) (d)
Fig. 2 Different views of hopper with metering device (All dimensions are in cm)
Fig. 3 Different views of the furrow opener

AGRICULTURAL MECHANIZATION IN ASIA, AFRICA AND LATIN AMERICA 2017 VOL.48 NO.484
chinery, Bangladesh Agricultural University. The applicator was de-signed on the basis of the ground-wheel operated metering device. The wheels were fixed to a shaft (3.5 cm hollow MS round shaft) by nuts and bolts. Thus, the shaft and meter-ing system rotated simultaneously with the rotation of wheels dur-ing operation. The diameter of the wheel of the applicator was selected as 50.93 cm which covered 160 cm of linear distance in each revolu-tion. Therefore, 4 cups were set in the metering system for getting 40
cm of space between USG to USG in a row. The metering device and the hopper were made of M.S sheet. The hopper was 9 cm wide and 27 cm long having a rubber gate at the bottom of one end. Different views of hopper with metering device are shown in Fig. 2. The hopper was supported by an angle bar which was set on the shaft by a bearing. As a result, the rotating shaft rotated the metering device while the hop-per remained stationary.
The furrow opener was made of M.S square bar of 24 cm long. It was tapered and pointed at the bot-
tom to cut the soil to a desired depth required to place the USG. It was set with the frame of the applicator with nut and bolt. There was a pro-vision to adjust the height of the furrow opener to obtain the desired depth. It was set to obtain a furrow depth of 8 cm. Different views of the furrow opener
are shown in Fig. 3.The covering device was made
to cover the USG dropped in the furrow by an L-shaped device. The shaft of the covering device was made of a square hollow shaft (2 cm × 2 cm), 38 cm long, fixed to the frame of the applicator by keeping a provision to set the shaft at any desired position. The size of ‘L’ arm fixed at the end of the shaft was 12 cm x 8 cm which was made of MS sheet. Different views of covering device are shown in Fig. 4.
The pulling handle of the machine was made of M.S f lat bar (3.8 cm × 0.6 cm) and attached to the main shaft. It was 120 cm long and 72.5 cm wide. The length of the handle was adjustable to fix it according to the user’s height. Different parts and whole applicator were drawn by AutoCAD. The drawing and photo-graphic view of the applicator are shown in Fig. 5.
The USG applicator worked on the principle that the forward move-ment of the machine caused by the operator’s pull rotated the driving wheels, the shaft and the metering device. The cups of the metering device picked up urea super granule (USG) from the hopper and dropped
Fig. 5 Photographic view and detailed drawing of pull type 4 rows USG applicator (without handle) (All dimensions are in cm)
Fig. 4 Different views of the covering device (All dimensions are in cm)

VOL.48 NO.4 2017 AGRICULTURAL MECHANIZATION IN ASIA, AFRICA AND LATIN AMERICA 85
on to the furrow through the tube. The furrow was created by the fur-row opener before dropping the USG. After that, the covering device covered the dropped USG with soil.
Lab Experiment of The MachineTwenty four USG were weighted
by a digital balance. The diameters and weights of thirty USG were measured by a slide callipers and a digital balance, respectively. The descriptive statistics of the recorded weights and sizes of the USG were determined by the Excel software. These measurements were made in order to check out the uniformity of the USG which affects the machine performance. Percentage of USG missing, over-falling, and breaking were determined in the laboratory experiment. Four plastic bags were set at the end of each tube. The metering device was rotated at dif-ferent speeds (2.05 to 2.21 km/h) through turning the wheels by hand. Number of turns of the wheel was counted and the time was recorded by a stop watch. Total number of USG falling in the bag was counted and recorded. Then the missing or over-falling percentage of USG was calculated using the following equa-tion:R = [(N × Y - NG) / (N × Y)] × 100
Where,R = Over-falling or missing percent-
age of USG
N = Number of turn of wheel/meter-ing device per minute
Y = No. of cups in the metering de-vice
NG = Total number of granular urea fallen per minuteNegative value of R indicates
over-falling of USG while its posi-tive value indicates missing of USG. Average of missing, over-falling and breaking of USG dropped by the four metering devices were plotted in a graph as percentage.
The applicator was operated over a dry tilled field to find out the dis-tribution pattern of USG fallen. A measuring tape was used to mea-sure the spacing between USG to USG in each row and the average spacing was determined for all the four rows. Then descriptive statis-tics of the spacing was determined using Microsoft Excel software. The applicator was operated in puddled field to find out the effec-tive field capacity, field efficiency, and required pulling force. The total time of operation was recorded with a stopwatch. The length and the width of the land were measured by a measuring tape to calculate the area. The effective field capacity of the machine was determined by di-viding the total area with total time required and was expressed in ha/h. The pulling force was measured by a spring balance maximum capac-ity of which was 30 kg. Total cost
(price, P) of the machine was deter-mined on the basis of the material cost and fabricating cost incurred to construct the machine. The op-erating cost (fixed cost + variable cost) was calculated by assuming some data (i.e. expected life of the machine 10 yrs., tax, insurance & shelter 0%, repair & maintenance is 0.02% of purchase price, labour cost US$ 1/h, annual use of the machine 31 ha/yr). Break-even point was es-timated by plotting the operational costs involved in applying USG by the applicator and manually against the area covered.
Results and DiscussionThe average weight of the USG
was 2.72 g with a standard deviation of 0.103 g and the average size of the USG was 2.16 cm having a standard deviation of only 0.07 cm. These results indicated the uniformity of the USG used by the applicator. The weight of whole USG applicator was only 12 kg. It indicated that it was not heavy to carry or transport by a person. The effect of speed on aver-age percentage of missing, over-fall-ing and breaking of USG dropped by all the four metering devices are shown in Fig. 6. The missing, over-falling and breaking percentage of USG varied from 0.5-4.5%, 0.7-5%, and 0.3-3%, respectively for varying
Fig. 6 Effect of speed on missing, over-falling and breaking of USG at different speeds
Fig. 7 Distribution of USG on dry land from all the 4 hoppers

AGRICULTURAL MECHANIZATION IN ASIA, AFRICA AND LATIN AMERICA 2017 VOL.48 NO.486
speeds of the applicator from 1.62 to 2.61 km/h. The average data of missing, over-falling and breaking percentage of USG were calculated from 3 replications of four hoppers. It was observed that the missing, over-falling and breaking percent-age of USG was less than 1% for the speed of applicator between 2.05 to 2.23 km/h in a puddled field. There-fore, the recommended operating speed of the applicator was 2 to 2.2 km/h.
The applicator was pulled over a tilled dry land at an average speed of 2.10 km/h to find out the distribu-tion pattern of USG fallen from the metering devices. During opera-tion the applicator dropped USG in a row with an average spacing of 39.89 cm (sd 1.74 cm and median 40 cm) between USG to USG which was very close to the desired spac-ing (40 cm). This result indicated the spacing between USG to USG was quit uniform. The depth of furrow at which USG was placed found to vary within 6-8 cm which was in the range of depth intended.
The distribution pattern of USG fallen on dry land from 4 hoppers is shown in Fig. 7. Occurrence of dropping only one USG per cup of the metering unit was found to be the most (96%) while occurrence of dropping two number of USG was only 1.96% and that of missing was only 1.47%.
The width of the USG applicator was 1.6m. Thus, the theoretical field capacity of the applicator was 0.33 ha/h at a forward speed of 2.06 km/h. The effective field capacity and field efficiency of the machine was found to be 0.257 ha/h and 78%, respectively. The pulling force was measured by a spring balance. Max-imum draft was found to be 105.03 N in puddled f ield at a pulling angle of 40°. As a result, the maxi-mum drawbar power was 0.06 kW (0.08hp) at a forward speed of 2.10 km/h. Although the draft of the pull type single or 2-row USG ap-plicator was less than that of the pull type 4-row USG applicator, higher field capacity of the later justified its merit. It indicated that it was very
easy to operate the pull type 4-row USG applicator by a person in the field.
The total cost (material cost + fabrication cost) of the four row pull type USG applicator was US$ 78. The operating cost (fixed + variable) of the applicator was compared with that of the mannual operaion of USG appliaction and the break-even point (BEP) was determined as shown in Fig. 8. It was evident that a land area more than 0.63 ha in a year justified the use of the ma-chine over the manual application of USG from the economic point of view. The costs of USG application per hectare were found to be US$ 22 and US$ 33 by the applicator and manual operation, respectively. Consequently, it could save 35% application cost compared to that of manual application of USG. The specifications of the four row USG applicator is shown in Table 1.
Conclusions
Fig. 8 Break-even point of USG application by the applicator and manual operation
Particulars DescriptionName Pull type four row granular
urea applicatorSource of power ManualSource of power for driving metering mechanism
Driving wheel
(Continued on the right)
(Continued from the left)Weight of the machine 12 kgNo. of operator OneMetering system Rotating shaft with four cupsDropping mechanism USG fallen due to
gravitational forceRecommended travelling speed
2.06-2.14 km/h
No. of hopper 4Dimension of the machine:Length, Width, Height
160 cm, 30 cm, 25 cm
Capacity of each hopper 1.5 kg Diameter of ground wheel 50.93 cmPulling force 78.55 NTheoretical field capacity 0.33 ha/h at 2.06 km/h
forward speedEffective field capacity 0.26 ha/h at 2.06 km/h &
78% field efficiencyMaximum draft was 105 N in puddled field at a
pulling angle of 40º.Maximum drawbar power 0.06kW(0.08hp) at forward
speed of 2.10 km/h Price US$78 Operating cost US$ 22/ha
Table 1 Specification of the pull type four row USG applicator

VOL.48 NO.4 2017 AGRICULTURAL MECHANIZATION IN ASIA, AFRICA AND LATIN AMERICA 87
The average spacing between granular urea dropped in the furrow was found to be 39.89 cm which was very close to the required spac-ing (40 cm). The depth of the USG placement var ied f rom 6-8 cm which was within the desired depth of soil at which the USG should be placed. The percentage of missing, over-falling and breaking of USG did not exceed 1% for the speed range of applicator within 2.05 to 2.23 km/h in a dry tilled field. Therefore, it will not cause short-age of urea from the recommended dose in the field. The effective field capacity and field efficiency of the machine were found to be 0.257 ha/h and 78%, respectively. Although single or double row pull type USG applicators need less pulling force but their field capacities were low. The maximum draft (at an angle of 40°) and drawbar power for the ma-chine were 105.03 N and 0.06 kW (0.08hp), respectively at a forward speed of 2.10 km/h. Hence, one person can operate it easily. The cost of the applicator was only US$ 78 which was within the buying capacity of the farmers of Bangla-desh. The cost of USG application per hectare were US$ 22 and US$ 33 by the applicator and manually, respectively. Thus, it can save 35% of the application cost compared to manually application of USG. As a whole, the 4-row pull type applica-tor showed the best performance among all available USG applicators in Bangladesh and it can be intro-duced in the field.
REFERENCES
Alam, M., T. R. Sarker and T. A. Orin. 2014. Performance evalu-ation of a pull type two rows granular urea applicator. J. of the Bangladesh Agricultural Univer-sity. 12 (1): 211-220.
Alam, M., F. Karim, and A. Kundu. 2013. Design and development of a pull type two rows super granu-
lar urea applicator. Bangladesh. J. of the Institution of Engineers, Agril. Engg. Division. 40/AE (2): 15-24
Ajoy and Fazlu. 2012. Design and development of a pull type two rows granular urea applicator. Project report. Department of farm power and machinery, Ban-gladesh Agricultural University.
Ahmed, Md. Shamim. 2011. Im-provement of guti urea applicator. M.S. thesis, Department of farm power and machinery, Bangladesh Agricultural University.
BARI (Bangladesh Agricultural Research Institute), 2009. Design and development of a urea super granule applicator for puddle rice field, journal of Agricultural Engineering Technology, vol-37, p-57-62.
IFDC (International Fertilizer De-velopment Center). 2005. Report on urea deep placement as an op-tion for increasing nitrogen use efficiency; IFDC-Asia Division;
IFDC (International Fertilizer De-velopment Center). 2007. Report on fertilizers and agricultural in-tensification IFDC’s experiences; IFDC-Asia Division
NAP. 2009. National Agricultural Policy report on fertilizer applica-tion, Government of the People’s Republic of Bangladesh, p-20.
Savant N. K., P. S. Ongkingco, R. R. Khadse, S. A. Chavan, and K. S. Rao. 1991. Agronomic Perfor-mance of Urea Briquette Applica-tor in Transplanted Rice. Inter-national Fertilizer Development Center (IFDC), P.O. Box 2040, Muscle Shoals, AL 35662,USA, Philippine Rice Research Institute (PhilRice), Los BaBos, Laguna, Philippines, Konkan Krishi Vidy-apeeth (KKV), Dapoli, Maharash-tra, 415 712, India, Central Rice Research Institute (CRRI), Cut-tack, Orissa, 753 006, India.
Sultana, Afroja. 2011. Design and development of a pull type granu-lar urea applicator M.S. thesis, Department of farm power and
machinery, Bangladesh Agricul-tural University.
Wohab M. A., M. A. Hoque, M. Mohiuddin and M. S. Hasan. 2011. Field performance evalu-ation of BARI USG Applicator.ResearchReport 2010-2011. Farm Machinery and Postharvest Pro-cess Engineering Division, BARI, Gazipur-1701, Bangladesh.
■■

AGRICULTURAL MECHANIZATION IN ASIA, AFRICA AND LATIN AMERICA 2017 VOL.48 NO.488
The ABSTRACTS pages is to introduce the abstracts of the article which cannot be published in whole contents owing to the limited publication space and so many contributions to AMA. The readers who wish to know the contents of the article more in detail are kindly requested to contact the authors.
1458Evaluation of Tractor Rear Tyre Wear Rate During Highway Travel in Ghana: S. Y. Dorvlo, Department of Agricultural
Engineering, University of Ghana, Legon, Accra, GHANA, [email protected]; A. A. Mahama, same; E. A. Baryeh, sameOn most Ghanaian farms, the tractor is not only used for on-farm work but for hauling goods over long distances. Ear-
lier studies have shown that tractor rear tyre replacement is problematic in Ghana and undergoes severe wear than other tyres. This study seeks to understand and provide information on the tractor rear tyre wear during highway travel, since for this form of transportation the farmer can get alternatives. Consequently, a 55.9 kW (75 hp) Massey Furguson 375E wheel tractor fitted with an 18.4-30 new tyres marked at four diametrically opposite sides was used for the study. From each tyre, eight lugs were each assessed at three points and the twenty-four wear measurements obtained were statisti-cally analyzed. The average wear rate found was 10.65±1.07 × 10 - 4 mm/km. The findings of the study showed that to prevent severe wearing of the rear tyre, highway travel with the rear tyre should be done in moderation.
■■
ABSTRACTS
1516Study of Long Duration Utilization Effect of Denatured Aqueous Ethanol in Petrol Start Kerosene Run Type Small
Constant Speed SI Engines: Manoj Kumar, Assistant Professor, Division of Agricultural Engineering, Sher-e-Kashmir, Uni-versity of Agricultural Sciences and Technology-Jammu, INDIA, [email protected]; T. K. Bhattacharya, Dean, College of Agricultural Engineering, JNKVV, Jabalpur, Madhya Pradesh, INDIA
The study conducted for observing effect of long duration utilization effect of aqueous ethanol on fuel consumption, emission, crank case oil quality and engine cleanliness on petrol start kerosene run type small SI engine coupled with an alternator running on denatured ethanol 190° proof in place of kerosene. The result indicated no significant deposition of foreign matter on carburetor component, deterioration in the crank case oil quality and shoot formation within the rec-ommended change period of 100 hours. The emission of CO, NO and NO2 was found less, whereas HC found more than petrol run SI engines. The operation of engine on denatured 190° proof ethanol was found satisfactory.
■■
1529Development and Evaluation of Weed Wiper for Resource Conservation in Hills of North Western Himalayas: Sukh-
bir Singh, Sr. Scientist (FMP), Division of Agricultural Engineering, ICAR- I.I.S.R., Lucknow-226002, INDIA, [email protected]; D C Sahoo, Sr. Scientist (LWME), ICAR-CSWCRTI, Research Centre, Koraput, Odisha, INDIA; Sher Singh, Sr. Scientist (Agronomy), Crop Production Division, ICAR-VPKAS, Almora, INDIA; M D Tuti, Scientist (Agronomy), same; J K Bisht, Pr. Sci-entist and Head, same
In hills, women are generally involved in weeding operation which is very drudgery oriented and time consuming as carried out manually with traditional tools such as kutla, kudal etc. A light weight manual weed wiper (1.85 kg weight & 180 mm roller width) based on the principle of wiping (or brushing) was developed for weed control in between crop rows by using non-selective herbicides i.e. glyphosate (roundup) to the targets (weeds) by direct contact without damag-ing the crops. The herbicide solution is supplied to an absorbent surface i.e. spongy roller in weed wiper. The weed wip-er was calibrated for herbicide dose and volume of water and tested at Vivekananda Hill Agriculture Research Institute (ICAR), Almora in pea and finger millet crops. The capacity of wiper was 0.032-0.035 ha h-1 with weeding efficiency 78-83% after 12-15 days of application of weedicide. It was found that application of glyphosate @ 2.16 litres ha-1 in 432 litres of water and @ 1.98 litres ha-1 in 395 litres of water through weed wiper was sufficient to wipe out the weeds in be-tween the rows of pea and finger millet crop in one hectare area without any injury to crop. The time and labour require-ment of weeding with weed wiper was observed 76-81% less as compared to kutla. However, after operation of wiper, some time and labour was required for weeding near plants. The cost of weeding with wiper was also observed 67-74% less as compared to kutla. Hence, wiper was observed very effective in labour, time, drudgery and cost saving for weed control in between crop rows.
■■

VOL.48 NO.4 2017 AGRICULTURAL MECHANIZATION IN ASIA, AFRICA AND LATIN AMERICA 89
1533Effect of Raised Bed, Zero and Conventional Till System on Performance of Soybean Crop in Vertisol: Atul Kumar
Shrivastava, Prof. and Head, Dept. Farm Machinery and Power Engg., College of Agricultural Engineering, JNKVV, Jabalpur, 482 004, INDIA, [email protected]; Ajeet Kumar, M. Tech Student, same, [email protected]; K. S. Kush-waha, Associate Professor, Dept. Mathematics and Statistics, College of Agriculture, same; Amit Jha, Asstt. Professor, De-partment of Agronomy, College of Agriculture, same, [email protected]
The study was conducted to evaluate the performance of raised bed planter, zero till seed cum fertilizer drill and seed cum fertilizer drill systems for the sowing of soybean crop in vertisol. The experiments was conducted at J.N.K.V.V., Re-search Farm, Jabalpur, (India). Randomized block design was used for conducting the experiments. It was found that the total time and cost required for making raised bed and sowing operations by the raised bed planter was 1.85 h/ha which was 4.60% less than conventional (seed cum fertilizer drill) but it was 74.80% more time than zero till seed cum fertil-izer drill. The average yield with the raised bed planter was obtained 31.37 q/ha, whereas, with seed cum fertilizer drill and zero till seed cum fertilizer drill it was 21.35 and 19.31 q/ha respectively. The soil conditions were found to be better for raised bed planter.
■■
1540Extent of Present Status of Indigenous Farm Tools Utilization and Potential of Farm Mechanization in Uttrakhand
State of India: V. P. Chaudhary, ICAR- Indian Institute of Farming Systems Research, Modipuram, Meerut (UP), INDIA; M. Shamim, same; Nisha Verma, Scientist (FRM), IIFSR, same
Agriculture is major source of livelihood in Uttrakhand state because of more than three-fourths of population de-pends directly and indirectly on it. The crops, livestock and horticulture enterprises are the main part of agricultural scenario in the region. Mechanization in agriculture increase the productivity of land and labour by meeting timeliness operations and increase work out put per unit time. It also enables efficient utilization inputs such as seeds, fertilizer and irrigation water. Appropriate mechanization in hill farming saves time, energy and also reduces drudgery of women farmers. Hill farming in Uttrakhand state, the level of mechanization is very low in the view of mechanical power use, efficient implements availability and post- harvest technology. Mechanization in hill farming is a very difficult task due to its unique topography (i.e. steep slope, small terrace), small holding and plot size, lack of unskilled man power, poor facilities of repair, maintenance and manufacture, non-availability of suitable tools as operation-wise and poor economic condition of farmers. Small and marginal farmers dominate in the state. The adequate and appropriate power source with suitable matching equipment is required to be intervening as per the topography for mechanization. Most of farm operations are performed by women farmers ranged from 55 to 85%. The various field operation viz., tilling of small plot, clod breaking, sowing, planting of seeds and transplanting of paddy as well as vegetable crops, weeding and inter-culture, harvesting, threshing and shelling, digging of tuber root crops, transportation /material handling are mostly exe-cuted by women workers by indigenous tools and equipment. The livestock rearing, maintenance and collection of green grasses as fodders, making silage are done by the women. The mechanization in fruit crops are very low such as digging of pit for transplanting, pruning/cutting branches, plucking of fruits and transportation is done by traditional methods.
■■
1547A Study on Wear Characteristics and Material Composition of ADI Blades Used in Rotavator: Sumit Tewari, Student
M. Tech, Dept. of Farm Machinery and Power Engineering, College of Technology, Pantnagar-263145, Uttarakhand INDIA; R. N. Pateriya, same; T K Bhattacharya, Prof. and Prof. & Head, same; Manish Tewari, Assistant Prof. Department of Indus-trial and Production Engineering, College of Technology, GBPUA & T, Pantnagar Distt. U. S. Nagar, same
The primary cause that limits the persistence of many agricultural tools is wear. Rotary tillage implements are being projected as important tools that result in production of fine tilth of soil The wear of agricultural soil cutting tools have their own characteristics, which are different from other types, since they interact with soils of various textures, mois-tures and other unpredictable conditions in the field. The study was undertaken to compare the wear characteristics and material composition of ADI rotavator blades with the indigenous and imported rotavator blades.
The results indicated that the average width of ADI (Austempered Ductile Iron) ADI blades was greater than the in-digenous and imported blades. The ADI blades were rich in iron content, had 85% Fe initially which decreased to 60% after 100 h of run. Elemental analysis and imaging of selected rotavator blades that with increase in working hours

AGRICULTURAL MECHANIZATION IN ASIA, AFRICA AND LATIN AMERICA 2017 VOL.48 NO.490
1550Pre-Slaughter Logistics Management in Brazilian Pigs’ Chain: A Case-Study of Fasting Time, Transportation Pro-
cess and Lairage Period: Sivanilza Teixeira Machado, Paulista University-Graduate Program in Production Engineering. R. Dr. Barcelar 1212, São Paulo, SP, BRAZIL, [email protected]; Irenilza de Alencar Nääs, same; João Gilberto Mendes dos Reis, same; Pedro Luiz de Oliveira Costa Neto, same
The study aimed to determine the effects of pre-slaughter logistic management (PSL) on pigs’ thermal comfort and surface temperature. Air temperature (AT), relative humidity (RH), wind speed (WS), and surface temperature (ST) were registered at fasting time, transportation, and lairage for three periods in the stage. General Linear model was used to analyze the variables and their interactions. The environmental change caused an increased on pigs’ ST. Temperature humidity index (THI) during transportation (93.9 ±3.5) impacted the rise in the pigs’ ST. Controlling the environment in tropical condition is crucial to improving pork quality and supply chain competitiveness.
■■
1553Performance Evaluation of Commercial Rotary Knife Roller Gin for Ginning Indian Cotton: V. G. Arude, Scientist
(FMP), ICAR-Central Institute for Research on Cotton Technology, Mumbai-400 019, INDIA; S. K. Shukla, Sr. Scientist (Mech. Engg.), Ginning Training Centre of ICAR-Central Institute for Research on Cotton Technology, Nagpur-440 023, INDIA; P. G. Patil, Director, ICAR-Central Institute for Research on Cotton Technology, Mumbai-400 019, INDIA
Double Roller (DR) ginning technology is widely used in India despite low productive and there is limited scope for improvement in the productivity. Advanced rotary knife roller ginning technology is so far not practiced in India for ginning Indian cotton. Therefore to understand the difficulties in adoption and for finding its suitability for efficient gin-ning of Indian cotton, the performance of a commercial rotary knife roller gin was evaluated in terms of capacity, pow-er, energy consumption and effect on fibre physical properties and spinning performance. The results were compared with double roller ginning. The rotary knife roller gin was operated at the roller speed of 200 rpm, rotary knife speed of 400 rpm, feeder roller speed of 16 rpm and at 80 bar pressure between the roller and stationary knife. The capacity of the single stand of rotary knife roller gin (425 kg lint/h) was found to be about six times that of the Jumbo double roller gin (70 kg lint/h). Energy consumption was found to be 28 kWh/bale as against the 22 kWh/bale for rotary knife and DR ginning plant of capacity 25 bales/h. Physical properties tested by HVI indicated marginal increase in 2.5% span length in rotary knife ginning as compared to DR ginning and other fibre properties remain unaffected. AFIS results showed higher fibre neps and seed coat neps in rotary knife gin than DR gin. Fibre neps were found to be 263 cnt/gm and 162 cnt/gm and seed coat neps were found to be 42 cnt/gm and 21 cnt/gm for rotary knife gin and DR gin respectively. Full spinning of rotary knife and double roller ginned cotton was done at 50s counts and the yarn properties were evaluated. The lea strength and CSP values were found to be higher for rotary knife ginning than DR ginning. Study revealed that from a capacity standpoint, the rotary knife roller gin is a higher capacity option than double roller gin without com-promising fiber and spinning quality for processing Indian cotton. However rotary knife roller gin machine and process parameters needs to be optimised to bring down the fibre neps and cut seed percentage to the level acceptable to the spinning industry.
■■
1554Fuel Measuring Devices, Systems and Tractor Fuel Consumption Pattern on the Field – A Review: Harvinder Singh
Dhingra, Associate Prof. of Agril. Engg., Deptt. of Farm Machinery and Power Engg., P A U, Ludhiana, Punjab, 141-004, IN-DIA
The agriculture is boosted by the mechanization by improving efficiency of the field operations, which enhanced the
there were decrease in percentage of elements along the blade sections. Average dimensional wear rate of indigenous I blade at S,B and E points was 0.28 mm/h, 0.195 mm/h and 0.06 mm/h respectively. Average dimensional wear rate of Indigenous II blade at S,B and E points was 0.33 mm/h, 0.23 mm/h and 0.25 mm/h respectively. Average dimensional wear rate of ADI blade at S,B and E points came out to be 0.209 mm/h, 0.08 mm/h and 0.029 mm/h respectively. ADI blades have very less wear rate as compared to the indigenous and imported blades. Wear pattern of ADI blades is also a smooth curve and uniform in nature.
■■
VOL.48 NO.4 2017 AGRICULTURAL MECHANIZATION IN ASIA, AFRICA AND LATIN AMERICA 91
1561Design and Development of Cup Feed Metering Mechanism of a Paddy Seed Drill: M. K. Ghosal, Prof., Dept. of Farm
Machinery and Power, College of Agricultural Engineering and Technology, O. U. A. T., Bhubnaneswar-751003, Odisha, IN-DIA, [email protected]; M. Din, Principal Scientist (Agril. Engg.), Central Rice Research Institute, Cuttack, Odisha, INDIA
Line sowing of seeds in time is necessary for enhancing production and productivity of crops in an agricultural field. In order to promote line sowing, there is a need to design and evaluate cup feed type metering device which ultimately helps in developing a multi crop seed drill for sowing of various seeds with replaceable cups. The present investiga-tion deals with the seed pattern characteristics of the most prevalent variety of paddy i.e. Pathara in the state of Odisha. The modification in the dimensions of cup in cup feed metering device was done for their suitability in a seed drill for achieving effective sowing operation of paddy. The spatial dimensions of paddy variety, Pathara were studied and ac-cordingly the cup dimensions were fixed. An experimental test rig was developed in the laboratory to study the seed sowing pattern characteristics i.e. seed rate deviation, seed distribution and percentage seed damage for various dimen-sions of cups for Pathara variety of paddy. Five different sizes of cups with depth and diameter of 14.83 × 8 mm, 11.71 × 9 mm, 9.48 × 10 mm, 7.84 × 11 mm and 6.58 × 12 mm were prepared keeping the volume constant and were used for the study. Similarly, five different peripheral speeds of the cup discs of 6.28, 9.42, 12.55, 18.84 and 23.56 m/min were select-ed for evaluating the most suitable dimensions and peripheral speed of cup for better performance of the seed drill. The belt speed in the test rig was also calculated and maintained to study the seed pattern characteristics. It was observed that the dimensions of cup with depth and diameter of 9.48 × 10 mm were found most suitable with a permissible periph-eral velocity up to 23.56 m/min and an overall efficiency of 80.94%. The cup of size 9.48 × 10 mm was recommended for seed metering mechanism of the seed drill for sowing of the paddy seed.
■■
crop productivity. This intensification in mechanization in agriculture, however, resulted in higher energy costs . There-fore, it became necessary to evaluate the tractor fuel consumption, by varying various other factors. There were number of sensors or transducers which could be utilized for the measurement of fuel consumption of tractor implement system like - piston-type area meter, glass tube flow meter, propeller type fuel flow meter, etc. The various methods used in agricultural tractors for measuring fuel consumption included most simple method of tank filling to the most accurate method like on board data acquisition with electronic sensor including the most sophisticated instrumented tractors. The fuel consumption ranged between 14.96 to 19.7 l/h for the draft of 13.54 to 24.13 kN while operating the MB plow. The fuel consumption was found to be less in stubble mulch system than MB plow system . The sensors installed on the tractor and connected to data logger showed that the fuel consumption varied with type of soil. The fuel sensor based on fuel level were the simple sensors to measure fuel consumption. Bio diesel fuel consumption was measured through an instrumented tractor the sensors fitted in the tractor gave a real time curve between fuel consumption, draft with time and was similar to the diesel fuel.
■■
1562Constructive-Regime Parameters Of Rotor-Brush Cleaner of Tuberous Roots: Maxut Dussenov, Zhangir Khan West
Kazakhstan Agrarian-Technical University, REPUBLIC OF KAZAKHSTANResults of researches of modern technologies of tuberous roots cleaning process showed that efficiency increase of
cleaning quality in the form of connected soil with vegetable remains depends on rational constructive-technological scheme and optimum constructive-regime parameters of device. Major factors influencing quality and power consump-tion of cleaning process is theoretically reasonable rational constructive-technological scheme and experimentally cer-tain optimum constructive-regime parameters of cleaner. Constructive-technological scheme of rotor-brush cleaner with justification of constructive-regime parameters is offered: tilt angle of brush, frequency of brush rotation, frequency of disk rotation. Quality of cleaning in this cleaner increases due to the application of rotor brush as working body which clears product in cleaning channel formed by disk, propeller and brush. Power consumption decreases as a result of ap-plication of propeller rational form and compact arrangement of working bodies.
■■

AGRICULTURAL MECHANIZATION IN ASIA, AFRICA AND LATIN AMERICA 2017 VOL.48 NO.492
EVENT CALENDAR◆ EIMA Agrimach India 2017
December 7-9, New Delhi, INDIAhttp://eimaagrimach.in/
◆ 5th ADDIS AGROFOODDecember 8-11, Addis Ababa, ETHIOPIAhttp://www.addis-agrofood.com/
◆ KISAN 2017December 13-17, Pune, INDIAhttp://pune.kisan.in/
◆ The International Conference on Agricultural & Bio-system Engineering (ICABE)
December 19-21, Ho Chi Minh City, VIETNAMhttp://www.istdst.org/ABE
◆ ISAE 201852nd Annual Convention of ISAEJanuary 8-10, 2018, Gujarat, INDIAhttp://www.isae.in/
◆ Fieragricola 2018January 31-February 3, Verona, ITALYhttp://www.fieragricola.it/
◆ 2018 Agricultural Equipment Technology Con-ference
February 12-14, 2018, Kentucky, USAhttp://www.asabe.org/meetings-events/2018/02/agricultural-equipment-technology-conference.aspx
◆ ALLSENSORS 2018―The Third International Conference on Advances in Sensors, Actuators, Metering and Sensing―
March 25-29, 2018, Rome, ITALYhttp://www.iaria.org/conferences2018/ALLSENSORS18.html
◆ Autonomous Trucks―2nd International VDI Conference―
April 10-11, Dusseldorf, GERMANYhttps://www.vdi-wissensforum.de/en/event/autonomous-trucks/
◆ XIX. World Congress of CIGRApril 22-25, 2018, Kyneria, TURKEYhttp://www.cigr2018.org/
◆ Caspian Agro 2018―12th Azerbaijan Interna-tional Agriculture Exhibition―
May 16-18, 2018, Baku, AZERBAIJANhttp://caspianagro.az/en-main/
◆ GreenTechJune 12-14, 2018, Amsterdam, NETHERLANDShttp://www.greentech.nl/amsterdam/
◆ EURAGENG 2018 ConferenceJuly 8-12, 2018, Wageningen, THE NETHERLANDShttp://ageng2018.com/
◆ 2018 ASABE Annual International MeetingJuly 29-August 1, Detroit, USAhttps://www.asabe.org/meetings-events/2018/07/2018-asabe-annual-international-meeting.aspx
◆ Agritechnica Asia 2018August 22-24, 2018, Bangkok, THAILANShttp://www.agritechnica-asia.com/
◆ EIMA 2018November 7-11, 2018, Bologna, ITALYhttps://www.eima.it/en/index.php
■■
NEWS
2017 Kishida International Award Went to G.S. Vi-jaya Raghavan
This year's Kishida International Award was presented at the ASABE 2017 Annual International Meeting. The recipient was G.S. Vijaya Raghavan, a James McGill Professor in the Biore-source Engineering Department of the Faculty of Agricultural and Environmental Sciences. He's the 40th receipient of the award.
The Kishida International Award serves to recognize out-standing contributions to engineering mechnization-techno-logical related programs of education, research, developments, consultation or technology transfer outside the United States. It is endowed by Shin-Norinsha Co., Ltd. of Japan in honor of Yoshikuni Kishida, founder of the firm.
■■ Yoshisuke Kishida (R) gave the award toG.S. Vijaya Raghavan (L)

VOL.48 NO.4 2017 AGRICULTURAL MECHANIZATION IN ASIA, AFRICA, AND LATIN AMERICA 93
-AFRICA-Benedict KayomboAssoc. Prof. of Soil and Water Eng., Dept. of Agric. Eng. and Land Planning, Botswana College of Ag-ric., Univ. of Botswana, Private Bag 0027, Gaborone, BOTSWANA. TEL+267-3650125, [email protected]
Mathias Fru FontehAssoc. Prof. and Head, Dept. of Agril. Eng., Faculty of Agronomy and Agril. Sciences, Univ. of Dschang, P.O. Box 447, Dschang, West Region, CAMEROON. TEL+237-7774-0863, [email protected]
Sali Atanga NdindengDr., Rice Processing and Value-Addition Specialist, Africa Rice Center (AfricaRice), Sustainable Produc-tivity Enhancement, M’ bé Research Station, 01 B. P. 2551, Bouaké 01, COTE D’ IVOIRE, [email protected]
Said Elshahat AbdallahDr., Prof. of Agricultural Process Engineering De-partment of Agricultural Engineering, Faculty of Agriculture Kafrelsheikh University, Kafr Elsheikh 33516, EGYPT. TEL+20473148949, [email protected]; [email protected]
Ahmed Abdel Khalek El BeheryAgric Eng. Research Institute, Agril. Research Cen-ter, Nadi El-Said St. P.O. Box 256, Dokki 12311, Giza, EGYPT. [email protected]
Ahmad AddoAssoc. Prof., Department of Agril. Engg, Kwame Nkrumah Univ. of Sci. and Tech. (KNUST) Kumasi, GHANA. TEL+233-3220-60242, [email protected]
Richard Jinks BaniLecturer & Co-ordinator, Agric. Eng. Div., Faculty of Agric., Univ. of Ghana, Legon, GHANA
Israel Kofi DjokotoProf., Israel Kofi Djokoto, Associate Prof. Univ. of Science and Technology, P.O.Box 420 ust, Kumasi, GHANA, [email protected]
Ayub N. Gitau
Chairman and Associate Prof., Dept. of Environ-mental and Biosystems Engineering, University of Nairobi, P.O Box 30197, Nairobi, KENYA, [email protected]; [email protected]
David Kimutaiarap SomeEng. Prof. Dept. of Agril & Biosystems Eng., School of Engg Chepkoilel University College of Moi Univ., P.O. Box: 2405-30100, Eldoret, KENYA, [email protected]
Karim HoumyDr., International Consultant on Agricultural Mech-anization, 2 Rue Ali Al Haddani, Route Akrach, Sou-issi, Rabat, MOROCCO. TEL+212-7-680512, [email protected]
O. A. OyeladeDr., Farm Power and Machinery Dept., Na-tional Centre for Agril. Mechanization (NCAM), P.M.B. 1525, I lor in, Kwara State, NIGERIA . TEL+2348069030588, [email protected]
Umar Buba BindirDirector General/CEO, National Office for Technol-ogy Acquisition and Promotion, No 4. Blantyre Street, Wuse II PMB 5074, Abuja, FCT Federal Re-public of NIGERIA. TEL+234-9461-1183, [email protected]
Joseph Chukwugotium IgbekaProf., Dept. of Agril. Eng., Univ. of Ibadan,, Ibadan, NIGERIA. TEL+234-2-810-1100-4, [email protected]
Emmanuel Uche OdigbohProf., Agril. Engg Dept., Faculty of Eng., Univ. of Ni-geria, Nsukka, Enugu state, NIGERIA. TEL+234-042-771676, [email protected]
Kayode C. OniDept. of Agril. & Biosystems Eng., Faculty of Eng. & Technology, Univ. of Ilorin, PMB 1515, Ilorin, NIGE-RIA. TEL+234-803-5724708, [email protected]
Umezuruike L. OparaResearch Prof., S. Africa Research Chair in Post-harvest Technology, Faculty of AgriSciences, Stel-lenbosch Univ., Private Bag X1, Stellenbosch 7602,
SOUTH AFRICA. TEL+27-21-808-4604, [email protected]
Nathaniel Gbahama KuyembehAssoc. Prof., Njala Univ. Colle, Univ. of Sierra Le-one, Private Mail Bag, Free Town, SIERRA LEONE. TEL+249-11-778620/780045
Abdien Hassan AbdounMember of Board, Amin Enterprises Ltd., P.O. Box 1333, Khartoum, SUDAN.
Amir Bakheit SaeedAssoc. Prof., Dept. of Agric. Eng., Faculty of Agric., Univ. of Khartoum, 310131 Shambat, SUDAN. TEL+249-11-310131, [email protected]
Abdisalam I. KhatibuP. O. Box 2138, Zanzibar, TANZANIA. [email protected]
Solomon Tembo52 Goodrington Drive, PO Mabelreign, Sunridge, Harare, ZIMBABWE.
-AMERICAS-Hugo Alfredo CetrangoloFull Prof. and Director of Food and Agribusiness Program Agronomy College Buenos Aires Univ., Av. San Martin4453, (1417) Capital Federal, ARGEN-TINA. TEL+54-11-4524-8041/93, [email protected]
Irenilza de Alencar NääsProf., Agril. Eng. College, UNICAMP, Agril. Con-struction Dept.,P.O. Box 6011, 13081 -Campinas- S.P.,BRAZIL. TEL+55-19-788-1039, [email protected]
Abdelkader E. GhalyProf., Emeritus of Biological & Environmental Eng. Dalhousie Univ., P.O. Box 1500, 1360 Barrington St., Halifax, Nova Scotia, B3H 4R2, CANADA. [email protected]
Edmundo J. HetzProf., Dept. of Agric. Eng. Univ. of Concepcion, Av. V. Mendez 595, P.O. Box 537, Chillan, CHILE. TEL+56-42-216333, [email protected]
B Kayombo M F Fonteh A A KEl Behery
S E Abdallah
R J Bani I K Djokoto D K Some
K Houmy J C Igbeka E U-Odigboh
K C Oni N GKuyembeh
A HAbdoun
A B Saeed
I de A Nääs A E Ghaly E J Hetz R Aguirre O Ulloa-Torres
Co-operating Editors
U L OparaUmar BBindir
M A L Roudergue
O A Oyelade
H ACetrangolo
Ahmad Addo
Y M MesaS Tembo
A N GITAU
A I Khatibu
S ANdindeng

AGRICULTURAL MECHANIZATION IN ASIA, AFRICA, AND LATIN AMERICA 2017 VOL.48 NO.494
Surya Nath
A KMahapatra
Marco A. L. RoudergueMechanization and Energy Dept., Agril. Eng. Fac-ulty, Campus Chillan, Univ. of Concepcion, Chile. Vicente Mendez #595, CHILE. TEL+56-42-2208709, [email protected]
Roberto AguirreAssoc. Prof., National Univ. of Colombia, A.A. 237, Palmira, COLOMBIA. TEL+57-572-271-7000, [email protected]
Omar Ulloa-TorresProf., Escuela de Agricultura de la Region, Tropi-cal Humeda(EARTH), Apdo. 4442- 1000, San Jose, COSTA RICA. TEL+506-255-2000, [email protected]
Yanoy Morejón MesaAgril. Engineer Univ. Agraria de La Habana, Facul-tad de Ciencias Técnicas Autopista Nacional y Car-retera de Tapaste Apartado, 18-19 San José de las Lajas, Mayabeque, CP 32700 CUBA. [email protected]
Pedro Paneque RondonAssoc. Prof., Universidad Agraria de La Habana, Facultad de Ciencias Técnicas, Autopista Nacional y Carretera de Tapaste, Apartado 18-19, San José de las Lajas, Mayabeque, CP 32700 CUBA. [email protected]
S. G. Campos Magan~aPhD. and Prof., Paseo de los Claveles #398, Colonia Parques de la Cañada. CP 25080, Saltillo, Coahuila, MEXICO. [email protected]
Hipolito Ortiz-LaurelHead of Agric. Eng. and Mechanization Dept./ Postgraduate College, Iturbide 73, Salinas de Hgo, S.L.P., C.P. 78600, MEXICO. TEL+52-496-30448
Alejandro Isabel Luna MaldonadoProf. and Head of the Dept. of Agricultural and Food Engineering, Autonomous University of Nuevo Leon, Nuevo León, MEXICO. [email protected]; [email protected]
Ganesh C. BoraAssociate Prof., Dept. of Agricultural and Biological Engineering, Mississippi State Univ., 130 Creel-man St., Room 242, P.O. Box 9632, MS 39762, U.S.A. [email protected]
Megh R. Goyal
Senior Acquisitions Editor, Agric. & Biomedical Eng. and Retired Professor in Agric. & Biomedical Eng. Univ. of Puerto Rico, Mayaguez P.O. BOX 86, Rincon, PR-00677, U.S.A. [email protected]
Ajit K. MahapatraAgric. & Biosystems Eng. Dept., South Dakota State Univ., P.O. Box 2120 Brookings, SD 57007-1496, U.S.A. TEL+1-605-688-5291, [email protected]
-ASIA and OCEANIA-Shah M. FaroukProf. (Retd.), Farm Power & Machinery Dept., Ban-gladesh Agril. Univ., Mymensingh 2202, BANGLA-DESH. TEL+880-1711-801923, [email protected]
Daulat HussainDean, Faculty of Agric. Eng. and Technology, Ban-gladesh Agril. Univ., Mymensingh-2202, BANGLA-DESH. TEL+880-91-52245
Mohammed A. MazedMember-Director, Bangladesh Agri. Res. Council, Farmgate, Dhaka, BANGLADESH. [email protected]
Rostom AliProf., Dept. of Farm Power and Machinery, Bangla-desh Agricultural University, Mymensingh-2202, BANGLADESH. [email protected]
Chetem WangchenProgramme Director Agril. Machinery Centre Ministry of Agric. Royal Government of Bhutan, Bondey Paro Bhutan 1228, BHUTAN. [email protected]
Mohammad Ali Basunia Associate Prof., Mechanical Engineering Pro-gramme, Institute Teknologi Brunei (ITB), Jalan Tungku Link, Gadong BE 1410, BRUNEI DARUS-SALAM, [email protected]
Li ShujunProf., China National Machinery Industry Corpo-ration, No. 3 Danling Street, Haidian District P.C. 100080, CHINA. [email protected]
S. M. IlyasProf. Green View Apartment, Flat-699; Pocket-2; Sector-19; Dwarka, NEW DELHI-110 075, INDIA. Tel+91-95608 48971, [email protected]
Surya Nathc/o R.K. Univ., School of Eng. Rajkot-Bharnagar Highway, KASTURBADHAM, RAJKOT,360020, Gu-jrat, INDIA. [email protected]
Indra ManiProf., Head of Division of Agril. Eng. IARI, New Delhi-110012, INDIA. [email protected]
C. R. MehtaProject Coordinator, AICRP on Farm Implements and Machinery, ICAR - Central Institute of Agricul-tural Engineering, Nabi-bagh, Berasia Road, Bhopal - 462 038, INDIA. [email protected]
A. M. Michael1/64, Vattekunnam, Methanam Road, Edappally North P.O., Cochin, 682024, Kerala State, INDIA. [email protected]
B. S. PathakAdjunct Prof., Indian Agril. Research Institute, KC5, Kavi Nagar, Ghaziabad- 201002, INDIA. [email protected]
Vilas M. SalokheProf., Flat B-1, Royal Gateway Apartment Near Yal-lama Temple, Main Road Kasaba Bawada Kolhapur - 416006, INDIA. [email protected]
Gajendra SinghAdjunct Professor, Indian Agricultural Research In-stitute (IARI), 86-C, Millennium Apartments, Sector-61, NOIDA, U. P. 201301, INDIA. TEL+91-99-71087591, [email protected]
Sitaram Dagdupant KulkarniDr., Flat No. 105, Guruprasad Apptts., Plot No. 85 & 86, Survey No. 78, Left Bhusari Colony, Kothrud, Pune - 411038, INDIA. [email protected]
S. R. VermaEx-Dean & Prof. of Agr. Eng., H. No. 14, Good Friends Colony, Barewal Road, Ludhiana 141012. Punjab, INDIA. TEL+91-161-2551096, [email protected]
Kamaruddin AbdullahThe Graduate School/Renewable Energy, Darma Persada University, JI. Radin Inten II, Pondok Ke-lapa, East Jakarta, 13450, INDONESIA. TEL+64-21-8649051, [email protected]
Mansoor Behroozi-LarProf., Emeritus Tehran Uni. Agr. Eng., Ph. D., Jalal All Ahmad Nasim St. Nasim Danesh Complex Block
S M Farouk DaulatHussain
M A Mazed
Chetem Wangchen
S M Ilyas A MMichael
A M Abdul-Munaim
M ABasunia
Li Shujun Indra Mani C R Mehta
Saeid Minaei
M R Goyal
MBehroozi-Lar
Kamaruddin Abdullah
G C BoraH Ortiz-Laurel
S D Kulkarni
S G CMagan~a
S R Verma
P P Rondon
HHasegawa
G Singh
A I Luna Maldonado
V MSalokhe
R Ali B S Pathak

VOL.48 NO.4 2017 AGRICULTURAL MECHANIZATION IN ASIA, AFRICA, AND LATIN AMERICA 95
R PVenturina
#35, second floor Tehran, IRAN. [email protected]
Saeid MinaeiAssoc. Prof., Dept. of Agr. Machinery Eng., Tarbiat Modarres Univ., P.O.Box 14115-336, Tehran, IRAN. TEL+9821-44180537, [email protected]
Ali Mazin Abdul-MunaimAssistant Prof., Dept. of Agril. Machines and Equip-ments, College of Agric., Univ. of Baghdad, IRAQ. TEL+964-778-4561, [email protected]
Hideo HasegawaAssoc. Prof., Institute of Science and Technology, Niigata University, 8050 Ikarashi 2-no-cho, Nishi-ku, Niigata 950-2181 JAPAN. +81-25-262-6690, [email protected]
Bassam A. SnobarProf., Univ. of Jordan, Faculty of Agriculture, Am-man 11492, JORDAN. [email protected]
Jong Hoon ChungProf., Dept. of Biosystems & Biomaterials Science and Eng., College of Agril. and Life Sciences, Seoul National Univ., Bldg 200 Rm 2216 1 Gwanangno, Gwanak-Gu, Seoul, 151-742, KOREA. TEL+82-2-880-4601, [email protected]
In-Bok LeeProf., Laboratory of Aero-Environmental & Energy Engineering (A3EL), Dept. of Rural Systems Eng., College of Agril. & Life Sciences, Seoul National Univ., San 56-1, Shillim-dong, Gwanak-gu, Seoul-city, KOREA. TEL+82-2-880-4586, [email protected]
Muhamad Zohadie BardaieProf., Dept. of Agril. and Biosystems Eng., Univ. Putra Malaysia, 43400 upm, Serdang, Selangor, MALAYSIA. TEL+60-3-8946-6410
Enkhbayar GonchigdorjDirector, School of Eng. & Technology, Mongo-lian University of Life Sciences, Ulaanbaatar, Zai-san, 17024, MONGOLIA. [email protected]
Madan P. PariyarConsultant, Rural Development through Selfhelp Promotion Lamjung Project, German Technical Cooperation. P.O. Box 1457, Kathmandu, NEPAL.
Hemanatha P. W. JayasuriyaCollege of Agril. and Marine Sciences, P.O. Box 34,
PC 123Al-khod, Muscat Sultanate, OMAN. TEL+968-2414-1223, [email protected]
Alamgir A. KhanResearch Engineer, Agricultural Mechanization Re-search Institute, Multan, PAKISTAN. [email protected]
A. Q. A. MughalResearch Professor, Greenwich Univ., DK-10, Street 38t, Darakshan, DHA Phase-6, Karachi-75500, PAKI-STAN. [email protected]
Muhammad Saffar MirjatDean, Faculty of Agril. Eng., Sindh Agriculture Univ. Tandojam, PAKISTAN. TEL+92-221653160, [email protected]
Nawaf A. Abu-KhalafAssistant Prof., Palestine Technical Univ. -Kadoorie (PTUK), P.O.Box 405, Hebron, West Bank, PALES-TINE. TEL+972-2-2227-846/7, [email protected]
Reynaldo M. LantinRetired Professor, College of Engineering and Agro-Industrial Technology, University of the Phil-ippines Los Banos, College, Laguna 4031, PHILIP-PINES. TEL+63-49-536-2792, [email protected]
Ricardo P. VenturinaPHILIPPINES.
Saleh Abdulrahman Al-suhaibaniProf., Agril. Eng. Dept.,College of Agric., King Saud Univ., P.O. Box 2460 Riyadh 11451, SAUDI ARABIA. [email protected]
Ali Mufarreh Saleh Al-AmriProf., Dept. of Agril. Systems Eng., College of Agril. Sciences & Food, King Faisal Univ., P.O.Box 55035, Al-Ahsa, 31982 SAUDI ARABIA. [email protected]
Sarath G. IllangantilekeProf., Sarath Ilangantileke, Consultant in Agric Engineering, Mechanization and Education, 4/567 Victoria Range Bungalows, Kengalla, SRI LANKA. [email protected]
Sen-Fuh ChangAdjunct Prof., Dept. of Bio-Industrial Mechatronics Eng., National Taiwan Univ., 136 choushan Road, Taipei, 106. TAIWAN. [email protected]
Suming ChenProf., Dept. of Bio-Industrial Mechatronics Eng.,
National Taiwan Univ., 1, Section 4, Roosevelt Road, Taipei, TAIWAN. TEL+886-2-33665350, [email protected]
Suraweth KrishnasreniEmeritus Prof. 24/77 Baan Kasemsan 1, Soi Kasemsan 1 Rama 1 Rd., Wangmai, Pathumwan, Bangkok 10330, THAILA, [email protected]
Surin PhongsupasamitPresident, Institute for Promotion of Teaching Sci-ence and Technology, 924 Sukumit Rd. Klong Toey Bangkok, THAILAND, [email protected]
Akkapol SenanarongAgricultural Engineering Research Institue De-partment of Agriculture, 50 Phaholyothin Rd., Jatuchak Bangkok 10900, THAILAND, [email protected]
Peeyush SoniAssociate Professor & Coordinator, Agril. Systems and Eng., School of Environment, Resources and Development; Asian Institute of Technology; 12120 THAILAND, [email protected]
Can ErtekinProf., Dpt. of Farm Machinery and Technologies Eng., Faculty of Agril., Akdeniz University, 07070, Antalya, TURKEY. [email protected]
Imad HaffarManaging Director, Palm Water Jumeirah Village (SIte Office Gate #10) Al Khail Road, P.O. Box 215122, Dubai, U.A.E. Tel+971-4-375-1196, [email protected]
Nguyen HayProf., President of Nong Lam Univ., Linh Trung Ward, Thu Duc District, Ho Chi Minh City, VIET NAM. [email protected]
Pham Van LangVIET NAM. [email protected]
-EUROPE-Tihomir Hristov KatardjievGeneral Manager at Yogurtson Trade Ltd., Omachi 216-74, Ichikawa-shi, Chiba-ken 272-0801, Japan (BULGARIA). [email protected]
Pavel KicProfessor, Czech Univ. of Life Sciences Prague, Faculty of Eng. 16521 Prague 6-Suchdol, CZECH REPUBLIC. TEL+420-2-2438314 [email protected]
S AAl-Suhaibani
A M SAl-Amri
SKrishnasreni
S Phong-supasamit
R M Lantin
M S Mirjat
S G Illangantileke
B A Snobar M P Pariyar H P W Jayasuriya
A Q AMughal
Alamgir A Khan
S F Chang Suming Chen
P V Lang J MüllerP KicT HKatardjiev
N Hay
Enkhbayar Gonchigdorj
I Haffar
M ZBardaie
C Ertekin
In-Bok Lee
P Soni
J H Chung
ASenanarong
N AAbu-Khalaf

AGRICULTURAL MECHANIZATION IN ASIA, AFRICA, AND LATIN AMERICA 2017 VOL.48 NO.496
Co-editor's name Nationality Inaugu-ral year
Retired year
Adrian Moens Netherlands 1972 1989Bala Krishna Shrestha Nepal 1972 1991Chul Choo Lee Korea 1972 2014Chau Van Khe Vietnam 1972 1980Manbahadur Gurung Bhutan 1972 2006Merle L. Esmay U. S. A. 1972 1990Giuseppe Pellizzi Italy 1973 2012Mohamed A. Bedri Sudan 1973 1987Shahansha-Uddin Choudhury Bangladesh 1973 1991T. B. Muckle U. K. 1973 1978Chang Joo Chung Korea 1975 2014T. Touggaard Pedersen Denmark 1975 1990Bilash Kanti Bala Bangladesh 1976 1982George B. Hanna Egypt 1976 1988Jun Sakai Japan 1976 2015Siswadhi Soepardjo Indonesia 1976 1985Tieng-Song Peng Taiwan Taiwan 1976 2015Mohammad Ilyas Pakistan 1977 1981Amala Prasad Sharma Fiji 1978 1981Arumugam Kandiah Ethiopia 1978 1989Bherulal T. Devrajani Pakistan 1978 2004John Kilgour U.K. 1978 2014Satish Chandra Fiji 1979 1990Jitendra P. Mittal Nigeria 1980 1993Naresh Chandra Saxena India 1980 1988Paris Andereou Lebanon 1980 1984Wang Wanjun China 1981 2012Allah Ditta Chaudhry Pakistan 1981 2015
Co-editor's name Nationality Inaugu-ral year
Retired year
Allan L. Phillips U. S. A. 1981 2004Julien G. Van Lancker Brundi 1981 1989Suppiah Kathirkamathamby Sri Lanka 1981 1991Armed Hossain Mirdha Mexico 1982 1991A. A. Valenzuela Chile 1982 2013David Boakye Ampratwum Ghana 1982 2011Kshirode Chandra Roy Bangladesh 1982 1985M. H. Abdel Aziz Saudi Arabia 1982 1991Krishna Prakash Srivastava Ethiopia 1983 1989Muhammad Siddique Chaudhry U. S. A. 1983 1991Wimala Tissa Weerakoon Zambia 1983 1985Harry D. Henderson Lebanon 1984 1985Mohammad Afzal Pakistan 1984 1994A. P. Kaloyanov Bulgaria 1985 2013Soedjatmiko Indonesia 1986 2014Aalbert Anne Wanders Netherlands 1988 2007Ali Mahmoud El Hossary Egypt 1988 2010Chanchai Rojanasaroj Thailand 1988 2011Edward A. Baryeh Zimbabwe 1988 2014T. P. Ojha India 1988 2015Eltag S. Eldin Mahmoud Sudan 1990 2011Henrik Have Denmark 1990 2009Graeme Ross Quick Australia 1995 2015Rafiq ur Rehman Pakistan 1995 2015Abdulsamad Abdulmalik Hazza
,a Yemen 1999 2014
Yunus Pinar Turkey 1983 2016William J. Chancellor U.S.A 1972 2017Kunihiro Tokida Japan 2016 2017
Retirement Co-editors' Name List
Joachim MüllerProf. of the Univ. Hohenheim, Institute of Agril. Eng., Head of Agric.l Eng. in the Tropics and Sub-tropics, Univ. of Hohenheim, 70593 Stuttgart, GER-MANY. TEL+49-711-459-22490, [email protected]
Konstantinos P. FerentinosResearcher, Dept. of Agricultural Engineering, Institute of Soil & Water Resources, Hellenic Agri-cultural Organization “Demeter” , Ministry of Ag-riculture and Food of Greece, 61 Dimokratias Av., Athens 13561, GREECE. [email protected]
Nick SigrimisProf., Agricultural University of Athens, Iera Odos 75, Athina 118 55, GREECE. TEL +30-6940940885, [email protected]
Ettore GasparettoFormer Professor of Agril. Mechanization, Dept. Agril. Eng., Univ. of Milano, Via Galileo Galilei 17, I- 35121 Padova, ITALY. TEL+39-0250316619, [email protected]
W. B. HoogmoedUniv. Lecturer, Wageningen Univ., Farm Technol-ogy Group, P.O.Box 317, 6708 AA Wageningen NETHERLAND. [email protected]
Jan PawlakInstitute for Technology and Life Sciences, Branch in Warsaw, Poland, ul. Rakowiecka 32, 02-532 War-saw, POLAND. [email protected]
Oleg S. MarchenkoProf. and Agril. Engineer, Dept. Head in All-Russia Research Institute for Mechanization in Agric. (VIM), 1st Institutsky proezd, 5, Moscow 109428, RUSSIA. TEL+7-926-492-1207, [email protected]
Milan MartinovProf., Faculty of Technical Sciences, Chair for Bio-systems Eng., Novi Sad, SERBIA. TEL+ 381-21-485-2369, [email protected]
Jaime Ortiz-Cañavate Puig-MauriDpto. Ingenieria Rural Universidad Politécnica de Madrid, Esc. T. S. Ing. Agrónomos 28040-Madrid SPAIN. TEL+34-91-336-5852, [email protected]
Brian G. SimsFAO Agricultural Mechanization Consultant. 3 Bourneside Bedford MK41 7EG, U.K. [email protected]
O SMarchenko
M Martinov J Ortiz-Cañavate
Jan Pawlak Brian G Sims
W BHoogmoed
EGasparetto
Nick Sigrimis
K P Ferentinos

VOL.48 NO.4 2017 AGRICULTURAL MECHANIZATION IN ASIA, AFRICA, AND LATIN AMERICA 97
Back Issues AGRICULTURAL MECHANIZATION IN ASIA, AFRICA AND LATIN AMERICA
(Vol.47, No.1, Winter, 2016-)
◇ ◇ ◇Vol.47, No.1, Winter 2016
Design and Development of Reciprocating Type Cumin Cleaner Cum Grader (K. R. Jethva, A. K. Varshney) ...............................
Effect of Three Honeycomb Interplant Dis-tances on Growth and Flowering of Two Cultivars of Bean (Iman J. Abdul Rasool, Ali Annon) ....................................................
Test and Analyses of the Reciprocal Friction Properties between the Rapeseeds Thresh-ing Mixture and Non-smooth Bionic Surface (Xu Lizhang, Ma Zheng, Li Yao-ming) .............................................................
Preparation of Value Added Products from Waste Collected from Cotton Ginneries (R. D. Nagarkar, Sujata Saxena, M. G. Am-bare, A. J. Shaikh) ........................................
Quantification of Agricultural Mechanization for Soybean -Wheat Cropping Pattern in Bhopal Region of India (Manoj Kumar, A. K. Dubey, U. C. Dubey, P. C. Bargale, Tau-queer Ahmad) ...............................................
Development and Performance Evaluation of a Power Operated Onion Seed Extractor (D. P. Theertha, G. Senthil Kumaran, A. Carolin Rathinakumari) ...............................
Development of an Evaporative Cooling Transportation System for Perishable Com-modities (S. A. Venu, G. Senthil Kumaran, C. R. Chethan) ..............................................
Effect of Chemical Fertilizers on Soil Com-paction and Degradation (Jafar Massah, Behzad Azadegan) .......................................
Field Evaluat ion of Deep Soil Volume Loosener-cum-Fertilizer Applicator for Management of Sugarcane Ratoon Crop (Manoj Kumar, T. C. Thakur) ......................
Comparative Grinding Behavior and Powder Characteristics of Basmati Rice Brokens (Y. Singh, K. Prasad) ...................................
Design and Installation of Pot-Based Indige-nous Hybrid Hydroponics Technology with Water and Nutrient Recirculation System for Commercial Greenhouse Vegetable Production: Part 1 (V. P. Sethi, Ashwani Kumar) ..........................................................
Experimental and Economic Evaluation of Pot-Based Indigenous Hybrid Hydroponics Technology with Water and Nutrient Re-circulation System for Commercial Green-house Vegetable Production: Part II (V. P. Sethi, Ashwani Kumar, A. S. Dhatt, M. K. Sidhu) ............................................................
Present Status and Future Need of Mecha-nizing Sugarcane Cultivation in India (Sukhbir Singh, P. R. Singh, A. K. Singh, Rajendra Gupta) ..........................................
Experimental and Combined Calculation of Variable Fluidic Sprinkler in Agriculture Irrigation (LIU Jun-ping, YUAN Shou-qi, LI Hong, Zhu Xingye) ..................................
◇ ◇ ◇Vol.47, No.2, Spring 2016
Agricultural Mechanization Situation in Asia and the Pacific Region (Gajendra Singh, Bing Zhao) ........................................................
Agricultural Machinery Industry in India (Surendra Singh)..............................................
Present Status and Future Prospects of Ag-ricultural Machinery Research in India (Indra Mani, P. K. Sahoo) ..............................
Agricultural Machinery Industry in India (Balachandra Babu) ........................................
Farm Mechanization: Historical Develop-ments, Present Status and Future Trends in Pakistan (Alamgir A. Khan, Muhammad Rafiq-ur-Rehman, Ghulam Siddique, Syed Imran Ahmed) .................................................
Status of Demand and Manufacturing of Agricultural Machinery in Bangladesh (Sultan Ahmmed, Abutaher M. Ziauddin, S. M. Farouk) ...................................................
Research on Agricultural Machinery Devel-opment in Bangladesh (Sultan Ahmmed, Abutaher M. Ziauddin, S. M. Farouk) .........
Agricultural Mechanization in Thailand: Cur-rent Status and Future Outlook (Peeyush Soni) ..................................................................
Viet Nam Agricultural Machinery Industry (Nguyen Huy Bich, Nguyen Hay, Le Anh Duc, Bui Ngoc Hung) .....................................
Present Status and Future Prospects of Agri-cultural Machinery Industry in Indonesia (Kamaruddin Abdullah) ................................
Present Status and Future Prospects of Agri-cultural Machinery Research Activities in Indonesia (Tineke Mandang, Kamaruddin Abdullah) ..........................................................
Agricultural Mechanization in the Philip-pines, Part I: Brief History (Reynaldo M. Lantin) ...............................................................
Agricultural Mechanization in the Philip-pines, Part II: Current Status (Reynaldo M. Lantin) ...............................................................
The Current Situation and Future of Agricul-tural Machinery Industry in China (Gao Yuanen) .............................................................
Status and Trends on Sci-Tech Development of Agricultural Machinery in China (Li Shujun) ..............................................................
Present Status and Future Prospects of Agri-cultural Machinery Research and Industry in Taiwan (Li-Duhng Huarng, Jyh-Rong Tsay) ..................................................................
Current Status of Agricultural Engineering Research in Korea (Jehoon Sung) ................
The Present State of Farm Machinery Indus-try in Japan (Shin-Norinsha Co., Ltd.) ........
Latest Activities for Overseas Market (JAM-MA) ...................................................................
Global Operations of Japanese Agricultural Machinery Manufacturers (Editorial De-partment, AMA) .............................................
◇ ◇ ◇Vol.47, No.3, Summer 2016
Grain Recovery Efficiency of a Developed Rice Stripper Harvester for Rural Use in Nigeria (Adisa A. F.) .......................................
Development of Low Cost Plastic Evaporative Cooling Storage Structure (V. K. Chande-gara, Sachin C. Sureja, Suman B. Vamja, Kajal R. Vaghela) ............................................
Effect of Mechanical Planting on Grain and Straw Yields, Water Use Efficiency and Profitability of Rice Cultivation (P. C. Mo-hapatra, M. Din, S. P. Patel, P. Mishra) .......
Design of Nitrogen (Liquid Urea) Metering Mechanism for Point Injection in Straw Mulched Fields (Jagvir Dixit, J. S. Mahal, G. S. Manes) .....................................................
Evaluation of Tractor Drawn Potato Planter in West Bengal State of India (Subrata Karmakar, Subhajit Roy, Prasenjit Mandal, Rahul Majumder) ............................................
Design and Development of a Power Oper-ated Tamarind Huller Cum Deseeder (Jansi Sheeba Rani, J, P. Rajkumar, R. Kailappan)
Energy Use for Wheat Cultivation in South-east Anatolia Region of Turkey (H. Hus-eyin Ozturk) .....................................................
Design and Development of Cup in Cup Feed Metering Seed Drill for Seed Pattern Char-acteristics Study of Paddy Seeds (M. K. Ghosal, M. Din) ...............................................
Development and Evaluation of Aloe Vera Gel Expulsion Machine (V. K. Chande-gara, A. K. Varshney) .....................................
A Review on Status of Gum Tapping and Scope for Improvement (S. C. Sharma, N. Prasad, S. K. Pandey, S. K. Giri) ..................
Design, Manufacturing and Field Test of Ani-mal-drawn Ground Nuts planting Machine for Rural Farming in Northern Kordofan (Sudan) (Mohamed H. Dahab, Moayed M. Balal, Rafie M. Ali) ........................................
Research and Application of Osmotic Dehy-dration Technique in Preservation of Fresh Guavas (Psidium guajava L.) (Wael Mo-hamed Elmessery, Said Elshahat Abdallah)
◇ ◇ ◇Vol.47, No.4, Autumn 2016
Investigation on Possibilities for Sustainable Provision of Corn Stover as an Energy Source: Case Study for Vojvodina (Marko Golub, M. Martinov, S. Bojic M. Viskovic, M. Martinov, D. Djatkov, G. Dragutinovic, J. F. Dallemand) ...............................................
Design and Evaluation of Biomass Combustor and Solar Dryer for Turmeric Processing (H. Sanchavat, S. Kothari) .............................
Effect of Conservation Agricultural Practice on Energy Consumption in Crop Produc-tion System in India (K. P. Singh, C. R. Mehta, M. K. Singh H. Tripathi, R. S. Singh) ................................................................
Moisture Dependent Dimensional and Physi-cal Properties of Re-Fabricated Rice (Syed Zameer Hussain, Baljit Singh) ......................
Design of Rotary Weeder Blade (S. P. Modak, Baldev Dogra, Ritu Dogra, Dinesh Kumar)
Selected Anthropometric Study and Energy Required for Grading Tomatoes by Farm-ers using Hoes in Zaria (A. Afolabi, M.
7
13
17
24
28
33
38
44
51
56
60
69
75
82
15
26
36
41
44
51
55
58
67
71
75
80
87
109
115
121
127
131
137
139
7
14
23
28
36
41
47
54
60
68
76
82
7
16
21
27
32

AGRICULTURAL MECHANIZATION IN ASIA, AFRICA, AND LATIN AMERICA 2017 VOL.48 NO.498
Abubakar, O. T. Oriolowo) .............................Low Cost Fermenter for Ethanol Production
from Rice Straw in Egypt (Mohamed A. A. A., R. K. Ibrahim, M. A. M. Elesaily) .........
Development and Evaluation of a Pneumatic Dibble Punch Planter for Precision Plant-ing (Majid Dowlati, Moslem Namjoo) .........
Development and Evaluation of Improved TNAU Mini Dhal Mill (P. Rajkumar, C. Indu Rani, R. Visvanathan) ...........................
Development of Three-Dimensional Force Measurement Instrument for Plough in Mountain Region (Karma Thinley, M. Ueno, K. Saengprachatanarug, E. Taira) ...
Energy use Pattern and Economic Analysis of Jute Fibre Production in India a case study for West Bengal (V. B. Shambhu) .................
Animal Drawn Improved Sowing Equipment for Mustard in Terraces of Sikkim in India (R. K. Tiwari, S. K. Chauhan) .......................
A Tractor Drawn Vegetable Transplanter for Handling Paper Pot Seedlings (B. M. Nandede, H. Raheman) ..................................
◇ ◇ ◇Vol.48, No.1, Winter 2017
Low Cost Fermenter for Ethanol Production from Rice Straw in Egypt (Mohamed A. A. A., R. K. Ibrahim, M. A. M. Elesaily) .........
Shearing Characteristics of Sorghum Stalk (Mrudulata Deshmukh, S. K. Thakare S. W. Jahagirdar ) ................................................
Design of a Portable Dates Cluster Harvest-ing Machin (Ahmed Nourani, F. Kaci, F. G. Pegna, A. Kadri) ........................................
Development of a Paddle Wheel Aerator for Small and Medium Fish Farmers in Nigeria (Omofunmi O. E., Adewumi J. K., Adisa A. F., Alegbeleye S. O.) ..................................
Determination of Residue, Drift and Biologi-cal Efficacy of Different Spray Methods Against Flower Thrips (Frankliniella spp.) (Thys., Thripidae) in Strawberries (N. Yarpuz-Bozdogan, E. Atakan, A. M. Boz-dogan, T. Erdem, N. Daglioglu, E. Kafkas)
Determination of Dermal Exposure of Opera-tor in Greenhouse Spraying (N. Yarpuz-Bozdogan, A. M. Bozdogan, N. Daglioglu, T. Erdem) ..........................................................
Regional Distribution of the World’s Tractor Stock (Jan Pawlak) ..........................................
Storage and Handling Engineering of Sug-arbeet Pulp as a Feedstuff for Animal Feeding (Said Elshahat Abdallah, Wael Mohamed Elmessery) ....................................
Promoting Agricultural Productivity in Nige-ria − The Case of the Agricultural Credit Guarantee Scheme Fund (ACGSF): 1981 to 2014 (M. A. Olaitan, B. O. Ogunlaja, L. Juma, M. A. Olasupo, J. Yusuf, O. A. Oyelade) ............................................................
Farm Mechanization Strategy for Promotion of Improved Equipment Under Animal Based Farming in Nagaland-India (R. K. Tiwari) ..............................................................
Performance Evaluation of Self-Propelled Groundnut Combine (T. Senthilkumar, D. M. Jesudas, D. Asokan) .................................
Prototype: A Ridge Profile Mechanical Power Weeder (D. S. Thorat, P. K. Sahoo, Di-pankar De, Mir Asif Iquebal) .......................
◇ ◇ ◇Vol.48, No.2, Spring 2017
Present Status and Future Trends of Engineer-ing Science in Mongolian Agriculture (G. Enkhbayar, C. Byambadorj, B. Hymgerel, D. Baatarkhyy) ................................................
Agricultural Machinery in Kyrgyz Republic (Kunio Nishizaki) ...........................................
Agricultural Machinery Market of the Rus-sian Federation (N. Sandakova, H. Hasega-wa, T. Sandakov, E. Kolesnikova) ................
Government Policy of Agricultural Machin-ery in the Russian Federation (E. Kole-snikova, H. Hasegawa, S. Sidorenko, N. Sandakova, A. Melnikov)...............................
Current Situation, Issues and Trends of Mechanization for Grain Harvesting in the Russian Federation (S. Sidorenko, E. Tru-bilin, E. Kolesnikova, H. Hasegawa) ...........
Role of Agricultural Education for the De-velopment of Agro-Industrial Complex in Primorsky Krai, Russian Federation (K. Andrei, Z. Dmitrii, H. Hasegawa) ................
Present Situation and Future Prospect for Farm Mechanization in Bhutan (Kinga Norbu) ...............................................................
Rice Mechanization in Laos and Its Current Issues (Hiroshi Akutsu) .................................
Trends of Tractorization in Indian Agricul-ture (T. Senthilkumar, N. S. Chandel, C. R. Mehta, B. S. Gholap) ......................................
Present Status and Future Prospects of Agri-cultural Machinery Industry in Iran (Beh-roozi Lar) ..........................................................
Farming Systems in Oman and Mechaniza-tion Potentials (H. P. W. Jayasuriya, A. M. Al-Ismaili, T. Al-Shukaili)..............................
Controlled Environment Agriculture in Oman: Facts and Mechanization Potentials (A. M. Al-Ismaili, N. K. Al-Mezeini, H. P. Jayasuriya) ........................................................
Agricultural Mechanization in Jordan (Bas-sam A. Snobar) ................................................
Japanese Agricultural Machinery Situation and the Role of Institute of Agricultural Machinery (Hiroshi Fujimura).......................
◇ ◇ ◇Vol.48, No.2, Spring 2017
Design, Development and Evaluation of Whole Cane Combine Harvester (Joby Bastian, P. K. Sureshkumar, B. Shridar, D. Manohar Yesudas) ..........................................
Detaching of Saffron Flower Parts Based on Aerodynamic Properties (Abbas Moghani-zadeh) ................................................................
Design, Development and Evaluation of Manually Operated Seabuckthorn Fruit Harvesting Tools (D. K. Vatsa, Virendra Singh) ................................................................
Design and Development of Groundnut plant-er for Power Weeder (A. Ashok Kumar, A. Anil Kumar, V. Vidhyadhar, K. Mohan, Ch. Suresh, A. Srinivasa Rao, M. V. Ra-mana) .................................................................
Assessment of Design Variations in Tractor-Trailer Systems on Indian Farm for Safe Haulage (Satish Devram Lande, Indra Mani, Adarsh Kumar, Tapan Kumar Khu-ra) .......................................................................
Effect of Mulches and Drip Irrigation Man-agement on the Quality and Yield of Potato Relating Hydro-Thermal Regime of Soil (Kamal G. Singh, Amanpreet Kaur, R. P. Rudra, Alamgir A. Khan) ...............................
Design and Development of a Digital Dyna-mometer for Manually Operated Agricul-tural Implements (Rohul Amin, Murshed Alam, Md. Rostom Ali) .................................
Development and Evaluation of Impact and Shear Type Tamarind Deseeder (Karpoora Sundara Pandian N., Rajkumar P., Vis-vanathan R.) .....................................................
Effect of Plant Crushing by Machine Traffic on Re-Generation of Multi-Cut Berseem Fodder (C. S. Sahay, P. K. Pathak, P. N. Dwivedi) ...........................................................
Design, Fabrication and Drying Performance of Flash Dryer for High Quality Cassava Flour (A. Kuye, A. O. Raji, O. O. Otuu, E. I. Kwaya, W. B. Asiru, I. B. AbdulKareem, B. Alenkhe, D. B. Ayo, Sanni L. O.) ............
Effect of Planting of Onion Sets in Different Orientations on Crop Growth for Develop-ment of Onion Set Planter (A. C. Rathina-kumari, D. M. Jesudas) ..................................
A Contribution of Foam Separation Tech-nique and Electro-Coagulation for Dairy By-Products Treatment (Said Elshahat Ab-dallah, Wael Mohamed Elmessery) .............
Development of a Damping System for Re-versible Mouldboard Plows Using Multi-ple-Criteria Decision Analysis (A. Mahda-vian, H. Aghel, S. Minaei, G. H. Najafi, H. Zareiforoush) ...................................................
■■
41
47
53
60
66
74
82
87
7
13
18
22
27
33
39
45
59
71
76
81
13
17
22
27
31
36
40
44
50
60
66
75
82
88
7
14
20
25
31
37
44
52
58
63
71
77
88

INSTRUCTIONS TO AMA CONTRIBUTORSThe Editorial Staff of the AMA requests of articles for publication to observe the following editorial
policy and guidelines in order to improve communication and to facilitate the editorial process:
The article must bear the writer(s) name, title/designa-tion, office/organization, nationality and complete mailing address.
Article must be sent by E-mail with Word File and PDF File attached.The data for graphs and photographs must be saved into piecemeal data and enclosed (attached) with the article.Whether the article is a technical or popular contribu-tion, lecture, research result, thesis or special report, the format must contain the following features:(i) brief and appropriate title;(ii) the writer(s) name, designation/title, office/orga-nization; and mailing address;(iii) an abstract following ii) above;(iv) body proper (text/discussion);(v) conclusion/recommendation; and a(vi) bibliographyTables, graphs and diagrams must be numbered. Table numbers must precede table titles, e.g., "Table 1 Rate of Seeding per Hectare". Such table number and title must be typed at the top center of the table. On the other hand, graphs, diagrams, maps and photo-graphs are considered figures in which case the cap-tions must be indicated below the figure and preceded by number, e.g., "Fig. 1 View of the Farm Buildings".The data for the graph must also be included. (e.g. EXCEL for Windows)Tables and figures must be preceded by texts or discussions. Inclusion of such tables and figures not otherwise referred to in the text/discussion must be avoided.Tables must be typed clearly without vertical lines or partitions. Horizontal lines must be drawn only to contain the sub-title heads of columns and at the bot-tom of the table.Express measurements in the metric system and crop yields in metric tons per hectare (t/ha) and smaller units in kilogram or gram (kg/plot or g/row).Indicate by footnotes or legends any abbreviations or symbols used in tables or figures.Convert national currencies in US dollars and use the later consistently.Round off numbers, if possible, to one or two decimal units, e.g., 45.5 kg/ha instead of 45.4762 kg/ha.When numbers must start a sentence, such numbers must be written in words, e.g., Forty-five workers..., or Five tractors..."instead of 45 workers..., or, 5 trac-tors.
c.
Format/Style Guidancea.
b.
c.
d.
e.
f.
g.
h.
i.
j.
k.
l.
Criteria for Article SelectionPriority in the selection of article for publication is given
to those that –a.b.
c.
d.
e.
f.
g.
h.
Rejected/Accepted Articlesa.
b.
c.d.
Procedurea.
b.
are written in the English language;are relevant: to the promotion of agricultural mecha-nization, particularly for the developing countries;have not been previously published elsewhere, or, if previously published are supported by a copyright permission;deal with practical and adoptable innovations by, small farmers with a minimum of complicated for-mulas, theories and schematic diagrams;have a 50 to 100-word abstract, preferably preceding the main body of the article;are printed, double-spaced, under 3,000 words (ap-proximately equivalent to 6 pages of AMA-size pa-per) ; and those thatart: supported by authentic sources, reference or bib-liography.written in MS DOS format.
As a rule, articles that are not chosen for AMA publi-cation are not returned. At the earliest time possible, the writer(s) is advised whether the article is rejected or accepted.When an article is accepted but requires revision/modification, the details will be indicated in the re-turn reply from the AMA Chief Editor in which case such revision/modification must be completed and returned to AMA within three months from the date of receipt from the Editorial Staff.The AMA does not pay for articles published. Complimentary copies: Following the publishing, three successive issue are sent to the author(s).
Articles for publication (original and one-copy) must be sent to AMA through the Co-operating Editor in the country where the article originates. (Please refer to the names and addresses of Co-operating Editors in any issue of the AMA). However, in the absence of any Co-operating Editor, the article needs to be sent to Co-operating Editor in the writer’s neighbor-ing country. Please note that it is AMA Chief Editor that decide whether publish each submitted paper on AMA or not. Even if Co-operating Editor found your manuscript suitable for publication on AMA, it can not the case with AMA Chief Editor. Contributors of articles for the AMA for the first time are required to attach a passport size ID photograph (black and white print preferred) to the article. The same applies to those who have contributed articles three years earlier. In either case, ID photographs taken within the last 6 months are preferred.

SUBSCRIPTION/ORDER FORMAGRICULTURAL MECHANIZATION IN ASIA, AFRICA AND LATIN AMERICA ( AMA )
Issued Quarterly
AMA has Achieved an IMPACT FACTOR!!AMA has been read by those involved in agricultural machinery and industry all over the world since the first
publishment in 1971. Thanks to many contributions from both the readers and writers, in 2012, we have achieved an Impact Factor, established by Thomson Reuters in U.S.A. AMA is the only Japanese agricultural machinery and industry related magazine which achieved an Impact Factor.
Subscription Rate (includes surface mail postage)
Annual (4 issues)...........................¥8,000 Single copy .......................................¥2,500
(Check one)□Please send me/us an invoice□ I/We enclose remittance for ¥ □Please charge my/our credit card □ VISA □ MASTER Card. No.
Exp. date
Signature
We deeply appreciate your payment by credit card (NO EXTRA CHARGE NEEDED).
We charge you extra 4,000 JPY when paid by check or wire transfer.
******************************
Name:
Firm:
Position:
Address:
(block letters)
FARM MACHINERY INDUSTRIAL RESEARCH CORP.1-12-3 Kanda-Nishikicho, Chiyoda-ku, Tokyo 101-0054, Japan
Tel. +81-3-3291-3674, Fax. +81-3-3291-5717URL: http://www.shin-norin.co.jpE-Mail: [email protected]

AGRICULTURAL MECHANIZATION IN ASIA, AFRICA, AND LATIN AMERICA 2017 VOL.48 NO.4


![Vol 44 - [Autumn Leaves].pdf](https://img.pdfslide.us/doc/110x75/563db88b550346aa9a94abba/vol-44-autumn-leavespdf.jpg)