Embed Size (px)
Citation preview

) f !
I
NATIONAL AERONAUTICS AND SPACE ADMINISTRATION
Technical Memorandum 33-689
V/k/ng Mars Lander 1975 Dynamic Test
Mode//Orb/ter Deve/opmenta/ TestMode/Forced V/brat/on Test
Summary Report 1
J. Fortenberry6. R. Brownlee
'%
<
_ (NASA-CR-lqCE[,!) VIKING t-!A_5 LA_DEf 1975 N75-1202_
D_ANIC '_ES_ M;JEL/OEgiTg;; DEqFLOt;i'I_'I_AL_IESI ,MOD_L FC[_CgD V_f_kAilC_ C_;[
Summary Pe_ogt (Jet P_ODU_,iiOrl Ld_l.) UIctc_s
_5 p IIC bq.)b CSCL 22g G3/I_ 13572
JET PROPULSION LABORATORYCALIFORNIA |N|T|TUTE OF TECHNOLOGY
I PAIIAOENA, CALIFORNIA
November15,1974
\
1975003956
https://ntrs.nasa.gov/search.jsp?R=19750003956 2018-07-16T12:18:36+00:00Z
I!
8
NATIONAL AERONAUTICS AND SPACE ADMINISTRATION
Technical Memorandum 33-689
Viking Mars Lander 1975 Dynamic Test
Model/Orbiter Developmental TestModel Forced Vibration Test
Summary Report
J. Fortenberry
G. R. Brownlee
JET PROPULSION LABORATORY
CALIFORNIA INSTITUTE OF TECHNOLOGY
PASADENA, CALIFORNIA
November15, 1974
1975003956-002

' TECHNICAL REPORTSTANDARD TITLE PAGE
I. Report No. 33-(_9 2. Government Accession No. 3. Recipient's Catalog No.
4. Title and Subtitle 5. Report Date
VIKING MARS LANDER 1975 DYNAMIC TEST MOD_/ August i, 197401_1_ D_'v'_OI:I_ITAL TK._ MODlm'.FORCED 6. Performing Organization Code
VIBRATION TEST: SUMMARYREPORT
7. Author(s) 8. Performing Organization Report No.J. Fortenberry, G. R. Brownlee
9. Performing Organization Name and Address [0. Work Unit No.
JET PROPULSION LABORATORY
- California Institute of Technology 11. Contract or Grant No.4800 Oak Grove Drive NAS 7-1OO
Pasadena, California 91103 13. Type of Report c.d Period Covered
12. SponsoringAgency Name and Address Technical Memorandum
NATIONAL AERONAUTICS AND SPACE ADMINISTRATION 14. SponsoringAgency CodeWashington, D.C. 20546
15. Supplementary Notes
16. Abstract
The Viking Mars Lander 1975 dynamic test model and Orbiter developmental testmodel were subjected to forced vibration sine tests in November-December 1973, !at JPL's dynamic test facility. Flight acceptance (FA) and type approval(TA) test levels were applied to the spacecraft structure in a longitudinaltest configuration using a 133,440-N (301000-ib) force shaker. Testing in
the two lateral axes (X, Y) was performed at lower levels using four 667-N
(150-Ib) force shakers.
Forced vibration qualif._ation (TA) test levels were successfully imposed onthe spacecraft at frequencies down to 10 Hz. JPL test equipment and methodshave been adequately checked out for rose on the proof test Orbiter.
Measured responses showed the same character as analytical predictions, and _ !correlation was reasonably good. Because of control system test tolerances, i
Orbiter primary structure generally did not reach the design load limits iattained in earlier static testing.
A post-test examination of critical Orbiter structure disclosed no apparent
damage to the structure as a result of the test environment.
17. Key Words (Selected by Author(s)) 18. Distribution Statement _t
Environmental Sciences I
Structural Engineering Unclassified -- Unlimited
Test Facilities and Equipment i
Vlkin_ Project |!
19. Security Classlf. (of this report) 20. Security Clasif. (of this po0e) 21. No. of Pages 22. Price I _:Unclassified Unclassified 83 !
t
1975003956-003

!
'IL 1g, •
HOW TO FILL OUT THE TECHNICAL REPORT STANDARD TITLE PAGE
Make items 1, 4, 5, 9, 12, and 13 agree with the corresponding information on the
report cover. Use all capital letters for title (item 4). _eave items 2, 6, and 14blank. Complete the remaining items as follows:
3. Recipient's Catalog No. Reserved for use by report recipients.
7. Author(s). Include corresponding information from the report cover. Inaddition, list the affiliation of an author if it differs from that of the
performing organization.
8. Performing Organization Report No. Insert if performing organizationwishes to assign this number.
10. Work Unit No. Use the agency-wide code (for example, 923-50-10-06-72),which uniquely identifies the work unit under which the work was authorized.
Non-NASA performing organizations will leave this blank.
11. Insert the number of the contract or grant under which the report wasprepared.
15. Supplementary Notes. Enter information not included elsewhere but useful,such as: Prepared in cooperation with... Translation of (or by)... Presented
at conference of... To be published in...
16. Abstract. Include a brief (not to exceed 200 words) factual summary of themost significant information contained in the report. If passible, theabstract of a classified report should be unclassified. If the report contains
a significant bibliography or literature survey, mention it here.
17. Key Words. Insert terms or short phrases selected by the author that identifythe principal subjects covered _n the report, and that are sufficiently
specific and precise to be used for cataloging.
18. Distribution Statement. Enter one of the authorized statements used to
denote releasability to the public or a limitation on dissemination forreasons other than security of defense information. Authorized statements
are "Unclassifled-Unllmlted, " "U. S. Government and Contractors only, "
"U. S. Government Agencies only, " and "NASA and NASA Contractors only. "
19. Security Classification (of report). NOTE: Reports carrying a security
classification will require additional markings giving security and down-grading information as specified by the Security Requirements Checklistand the DaD Industrial Security Manual (DaD5220.22-M).
20. Security Classification (of this page). NOTE. Because this page may be
used in preparing announcements, bibliographies, and data banks, it should
be unclassified if possible. If a classification is required, indicate sepa-rately the classification of the title and the abstract by following these items
with either "(U)" for unclassified, or "(C)" or "(S)" as applicable forclassified items.
21. No. of Pages. Insert the number of pages.
! 22. Price. Insert the price set by the Clearinghouse for Federal Scientific and
_ _ Technical Information or the Government Printing Office0 if known.
1975003956-004

PREFACE
The work described in this report was performed by the Applied
Mechanics Div_ion of the Jet Propulsion Laboratory.L
The Jet Propulsion Laboratory is responsible for the Viking Orbiter
System, which is part of the overall Viking Project managed by the Viking
Project Office at Langley Research Center for NASA.
i
JPL Technical Memorandum 33-689 ll! °
1975003956-005

ACKNOWLEDGMENT
The authors are indebted to J. Garba and F. Day for their tireless
support in providing the response analyses so vital to safe implementation of
the test. Thanks are also extended to R. Hansen and D. LoGiurato for their
diligence in providing trustworthy data acquisition and reduction for a very
complex structure. N. Morgan is to be commended for coordinating the pre-
test activities of the several different agencies involved in the test. In addi-
tion, the authors wish to thank M. Trummel and R. Glaser for their
suggestions and valuable assistance in conducting the test. Special mention
is made of G. Milder and the Dynamic Environmental Testing Group for their
fine execution of a pioneering test effort,
iv JPL Technical Memorandum 33-689
1975003956-006

CONTENTS
I. Introduction .................................. 1
II. Test Program .......................... ....... 1
A. Test Specimen ............................. I
B. Implementation ............................ 2
I. Longitudinal Test Setup .................. 2
Z. Lateral Test Setup ...................... 3
3. Test Levels ......................... 3
4. Vibration Control ...................... 4
5. Data Recording, Reduction ............... 5
6. Test Run Summary ...................... 5
III. Discussion of Test R.esults ....................... 6
A. Data Reduction ............................ 6
B. Test Level/Loads Control .................... 7
C. Response Measurements ...................... 9
IV. Conclusion .................................. 10
References ....................................... 11
APPENDIXES
A. Supporting Analyses ......................... 41
B. Rigid Lander Testing ........................ 47?
C. Measurement Assignment Sheets andPatch Assignments ......................... 57
TABLES
1. ODTM propulsion module mass configuration,294 K (70*F) .............................. 12
2. Forced vibration test levels, longitudinal (Z) axis ..... 12
JPL Technical Memorandum 33-689 v
1975003956-007

3. Forced vibration test levels, lateral (X,Y) axes ...... 13
4. Recording channel capability, tape recorderallocation ................................ 13
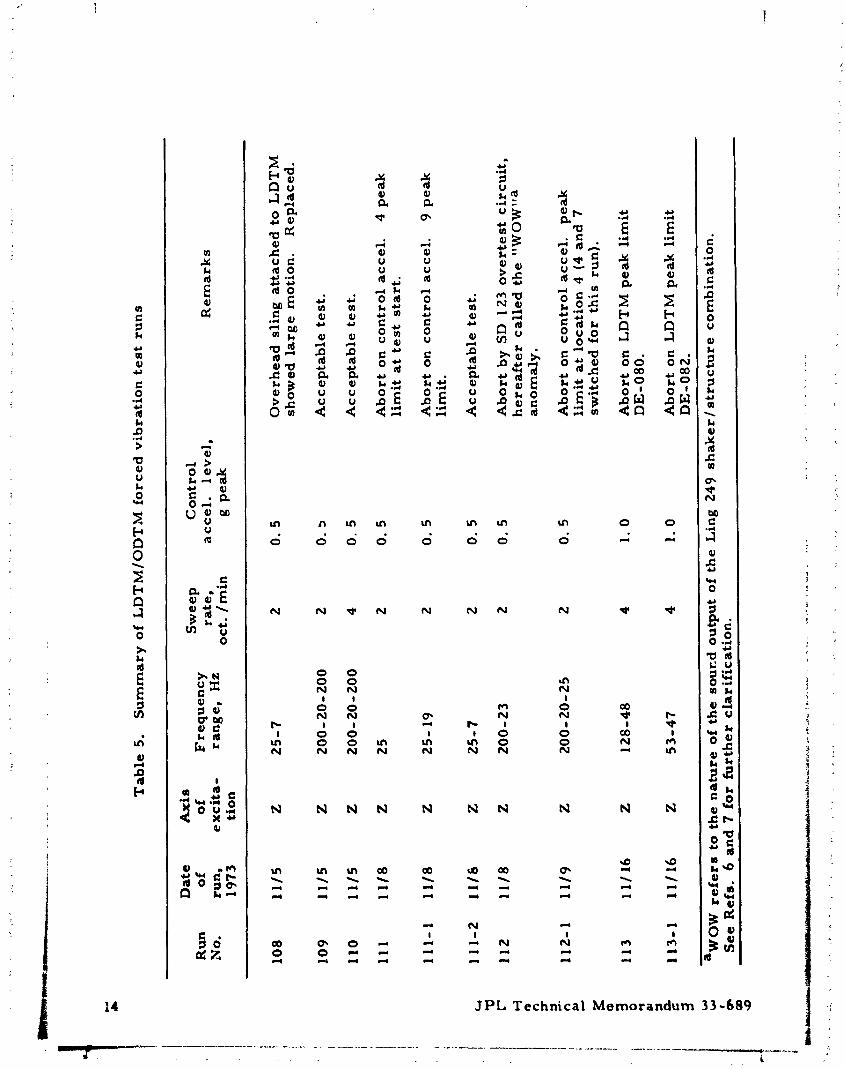
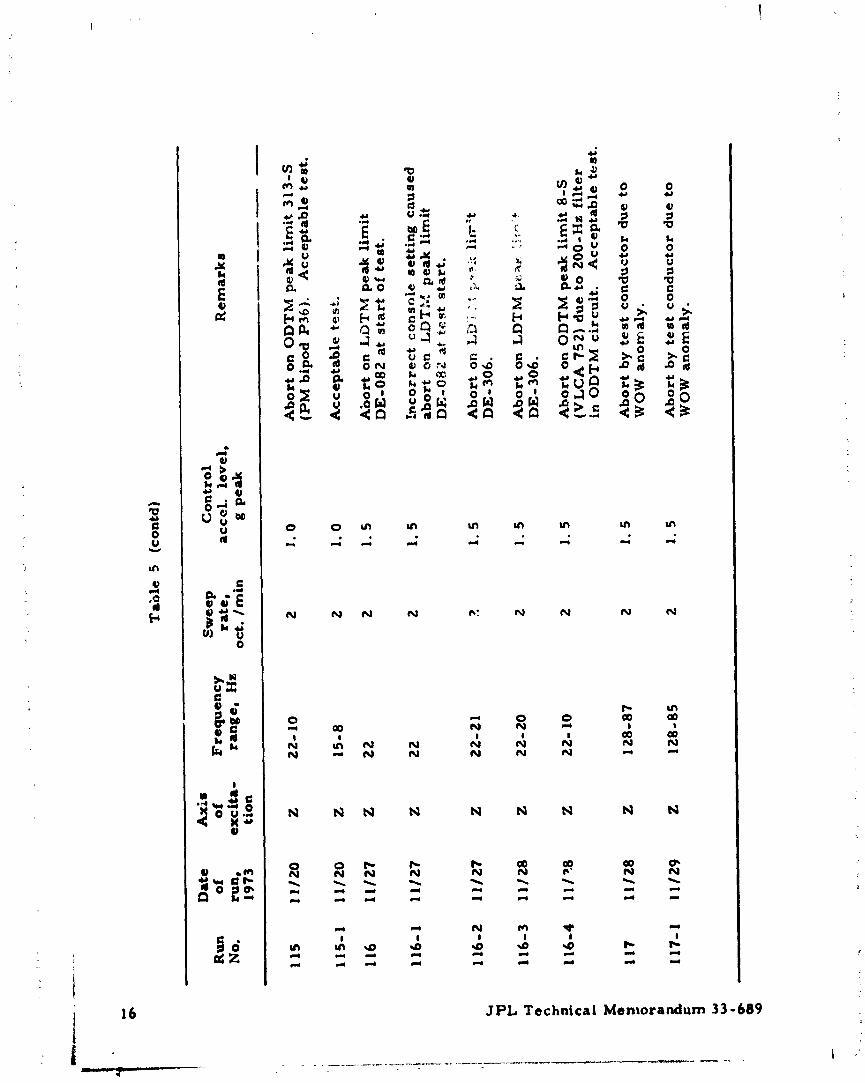
5. Summary of LDTM/ODTM forced vibrationtest runs ................................ 14
6. Typical ODTM loads derived from strain-gagemeasurements, TAinput, Z-axis, 10-40 Hz ........ 20
7. Typical ODTM response acceleration level _compared to analytical predictions, TA input,Z-axis, 10-40 Hz .......................... 21
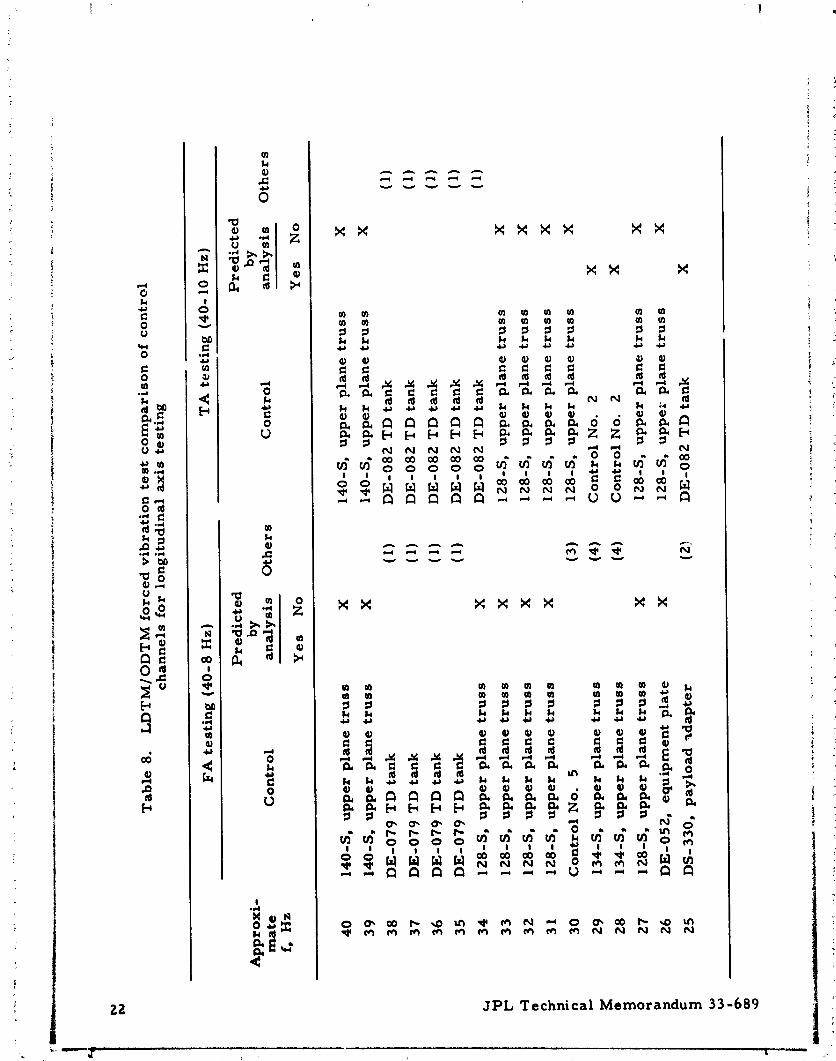
8. LDTM/ODTM forccd vibration test comparisonof control channels for longitudinal axis testing ...... 22
A-1. Test fixture modes as a function of design iteration .... 45
A-2. Comparison of two phases of response analysis(longitudinal ) .............................. 45
B-I. Recording channel capability, taperecorder allocation ......................... 49
B-Z. Summary of CDTM/RL forced vibration test runs ..... 50
B-3. ODTM/RL forced vibration test comparison ofcontrol channels ........................... 5 l
B-4. Typical ODTM/RL loads derived from strain-gagemeasurements, comparison with analyticalpredictions, 1/3 TAinput, Z-axis, 8-40 Hz ......... 53
FIGURES
I. View from balcony of LDTM/ODTM longitudinal (Z)axis test setup ............................ 24
_. View from floor of LDTM/ODTM longitudinal (Z)axis test setup ............................ 35
3. Typical hydrostatic bearing installation ............ 26
4. Pneumatic spring support system ................ 27
5. Shaker body blocking system ................... 28
6. Overall view of LDTM/ODI'M lateral {Y) axistest setup ................................ 29
vi JPL Technical Memorandum 33-689
I
1975003956-008

7. Shaker 12, stinger, mechanical £uze, andODTM ous longeron attachment (Y-axis) ........... 30
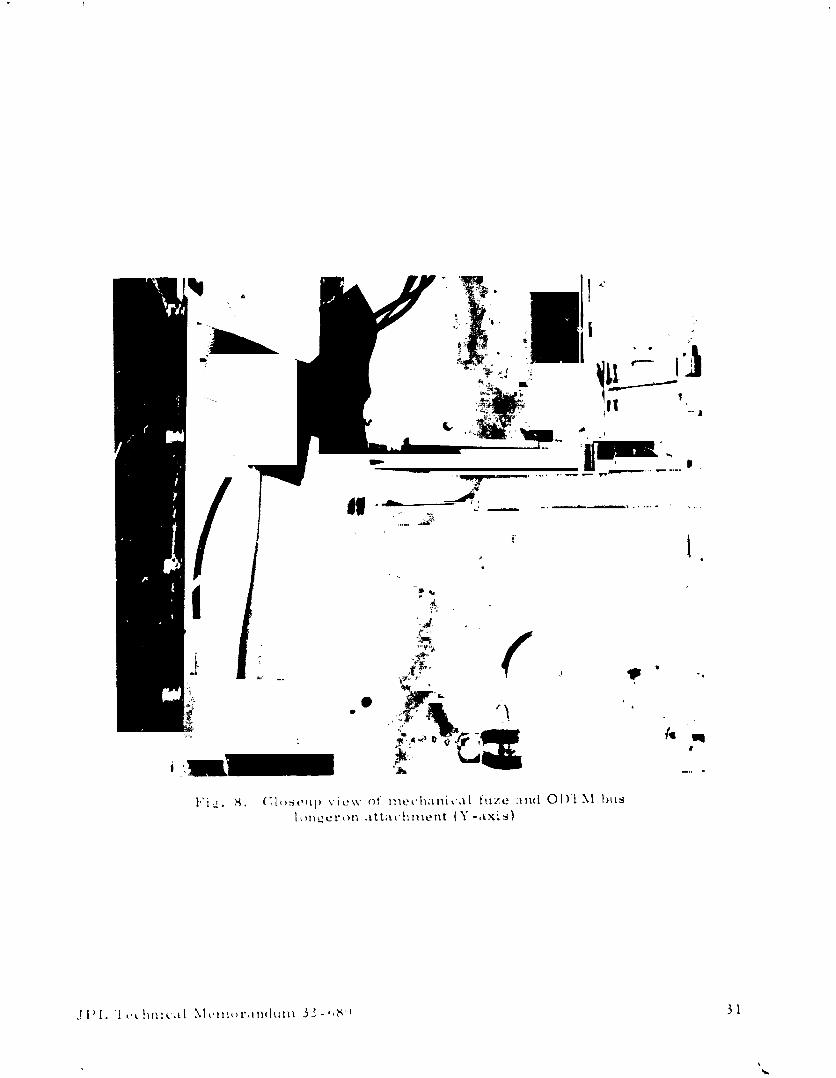
8. Closeup view of mechanical fuze and ODTM buslongeron attachment (Y-axis) ................... 3 1
9. Overall view of LDTM/ODTM lateral (X) axistest setup ................................ 32
10. LDTM/ODTM forced vibration test busaccelerometer location ....................... 33
11. LDTM/ODTM longitudinal (Z) axis vibration testcontrol circuit, functional diagram ............... 35
12. Data acquisition system ...................... 37
13. Sequence of quick-look data reduction for testrun evaluation ............................. 38
14. Typical data reduction sequence ................. 38
15. Flow plan for establishing peak limit/select values .... 39
._-1. Analog load computation system ................. 46
B-1. Viking 1975 ODTM/RL longitudinal (Z) axistest setup ................................ 55
JPL Technical Memorandum 33-689 vii
1975003956-009

ABSTRACT
The Viking Mars Lander 1975 dynamic test model and Orbiter develop-
mental test model were subjected to forced vibration sine tests in November --
December 1973, at JPL's dynamic test facility. Flight acceptance (FA) and
type approval (TA) test levels were applied to the spacecraft structure in a
longitudinal test configuration using a 133,440-N (30,000-1b) force shaker.
Testing in the two lateralaxes (X, Y)was performed at lower levels using
four 667-N (150-1b) force shakers.
Forced vibration qualification (TA) test levels were successfully
imposed on the spacecraft at frequencies down to I0 Hz. JPL test equipment
and methods have been adequately checked out for use on the proof test
Orbiter.
Measured responses showed the same character as analytical predic-
tions, and correlation was reasonably good. Because of control system test
tolerances, Orbiter primary structure generaUy did not reach the design
load limits attained in earlier static testing.
A post-test examination of critical Orbiter structure disclosed no
apparent damage to the structure as a result of the test environment.
viii JPL Technical Memorandum 33-689
1975003956-010

I. INTRODUCTION
The objectives of the stack test series (Ref. l)were to
(I) Evaluate the effect of Lander/Orbiter interaction on response at
subsystem/component locations.
(2) Evaluate the adequacy of the Viking Mars Lander 1975 _,ynamic
test model (LDTM)/Orbiter developmental test model (ODTM)
secondary structure.
(3) Serve as a precursor to the proof test Orbiter (PTO) forced
vibration test, and evaluate PTO test levels.
(4) Ev _luate component sinusoidal test levels.
{5) Obtain data for comparison to analytical results.
The primary interest in the stack tests was centered in the mid- to
low-frequency regions (Z00 to 8 Hz), where component responses reach their
largest amplitudes. Forced vibration testing in the longitudinal axis was
initiated on November 5, 1973, and concluded November 29, 1973 Lateral
axis excitation started December 7, 1973, and finished December I0, 1973.
II. TEST PROGRAM
A. TEST SPECIMEN
The test article consisted of the following major hardware assemblies:
{1) LDTM.
{Z) ODTM.
(3) Viking transition adapter (VTA).
Major assemblies of the LDTM/ODTM were of night-configured hard-
ware wherever possible. Mass mockups or simulators had Jaertial propertie,
similar to the components being replaced. Thermal control hardware .*uch
as louvers and blankets was not used on the ODTM.
JPL Technical Memorandum 33-689 I
k
1975003956-011

l
k
Pressurized systems on the LDTM consisted of th_ bioshield and pro-
pellanttanks. The bioshieldwas pressurized to 249 ±224N/m 2 (I.0 _0.9 in.
of water)::=during testing. The lander propellant tanks were filledwitI.
refer__efluidsand pressurized to i37,900 N/m 2 (20 psig) with gaseous n'_tro-
gen. This pressurization was maintained throughout the entiretest series.
The only active pressurized subsystems on the ODTM was the propul-
sion module {PM), which was configured as shown in Table I.
B. IMPLEMENTATION
I. Longitudinal Test Setup
The test specimen setup for longitudinalaxis testingproceeded accord-
ing to the following sequence (Ref. Z):
(1) VTA mounted on longitudinaltest fixture.
(2) Viking spacecraft adapter (V-S/C-A) mounted on VTA.
(3) ODTMbus mated to loaded, unpressuriz_d PM.
(4) Bus/PM combination mounted on V-S/C-A.
(5) Viking Lander capsule adapter {VLCA) preassembled on handling
equipment.
{6) LDTM mated to VLCA.
(7) LDTM/VLCA combination mated to ODTM bus.
The final longitudinal test configuration is shown in Figs. 1 and 2.
Excitation was provided by a Ling 249 133,440-N {30,000-1b) force shaker.
The interface between the shaker and the VTA was provided by the test
fixture. The teat fixture, a welded magnesium struct" "e, was stabilized by
a restraining system consisting of three steel piers on which hydrostatic
bearings were mourted {Fig. 3). The bearings allowed vertical movement
only, while the piers provided the reaction points for the spacecraft over-
turning moment predicted by response a:laLysis {Appendix A).
i
_Customary U.S. units were used for primary measurements and calculations.
2 JPL Technical Memorandum 33-b89
o 4
,
1975003956-012
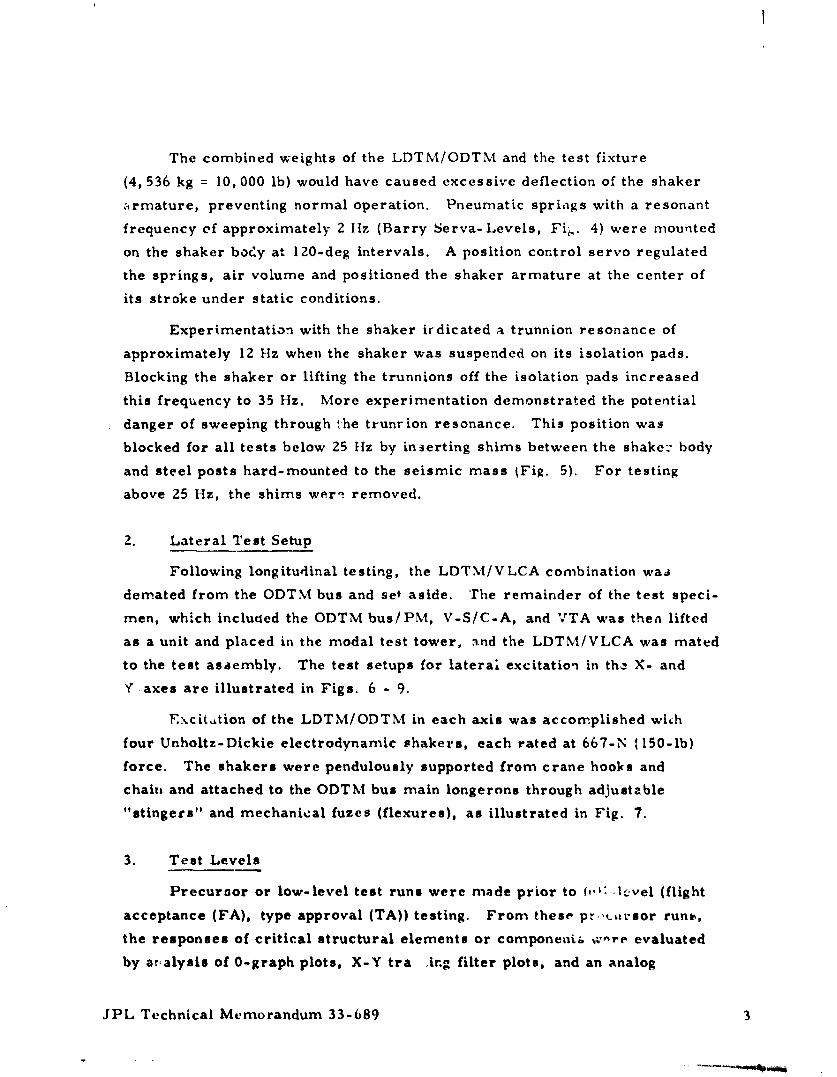
The combined veights of the LDTM/ODTM and the test fixture
(4,536 kg = 10,000 lb) would have caused excessive deflection of the shaker
armature, preventing normal operation. Pneumatic springs with a resonant
frequency of approximately 2 ttz (Barry Serva-Levels, Fi_.. 4) were mounted
on the shaker body at 120-deg intervals. A position control servo regulated
the springs, air volume and positioned the shaker armature at the center of
its stroke under static conditions.
Experimentation with the shaker irdicated a trunnion resonance of
approximately 12 Hz when the shaker was suspended on its isolation pads.
Blocking the shaker or lifting the trunnions off the isolation pads increased
this frequency to 35 Hz. More experimentation demonstrated the potential
danger of sweeping through the trunrion resonance. This position was
blocked for all tests below 25 ttz by in_erting shims between the shake.-" body
and steel posts hard-mounted to the seismic mass _Fig. 5). For testing
above 25 Hz, the shims w_,r_ removed.
2. Lateral Test Setup
Following longitudinal testing, the LDTM/VLCA combination wa,J
demated from the ODTM bus and se_ aside. 'rhe remainder of the test speci-
men, which inclucted the ODTM bus/PM, V-S/C.A, and 'TTA was then lifted
as a unit and placed in the modal test tower, and the LDTM/VLCA was mated
to the test assembly. The test setups for lateral excitation in the X- and
Y axes are illustrated in Figs. 6 - 9.
Excitation of the LDTM/ODTM in each axis was accomplished wi_h
four Unholtz-Dickie electrodynamic shakers, each rated at 667-N t l50-1b)
force. The shakers were pendulously supported from crane hoolcs and
chai, and attached to the ODTM bus main longerons through adjustzble
"stingers" and mechanical fuzes (flexures), as illustrated in Fig. 7.
3. Test Levels
Precuroor or low-level test runs were made prior to f,,_:_Icvel (flight
acceptance (FA), type approval (TA)} testing, From these pr ,,.t_rsor run_,
the responses of critical structural elements or components, _,-,.e evaluated
by at0alysls of 0-graph plots, X-Y ira ing filter plots, and an analog
JPL Technical Memorandum 33-689 3
1975003956-013
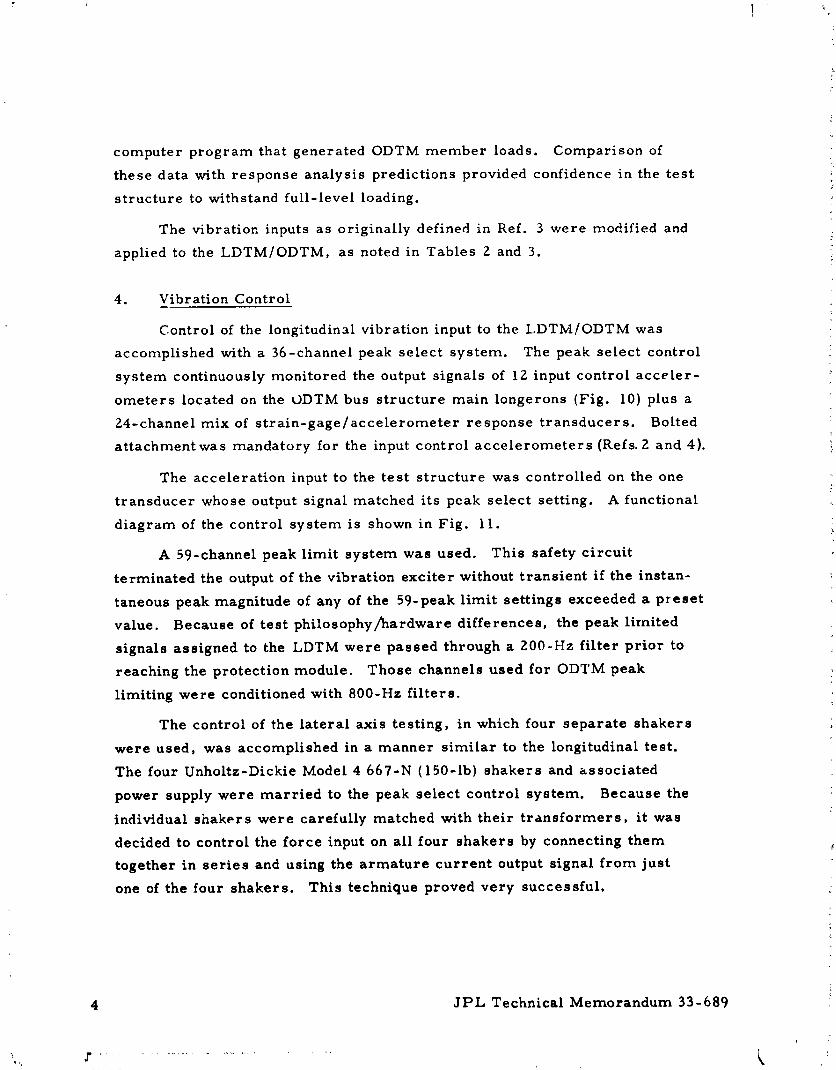
computer program that generated ODTM member loads. Comparison of
these data with response analysis predictions provided confidence in the test
structure to withstand full-level loading.
The vibration inputs as originally defined in Ref. 3 were modified and
applied to the LDTM/ODTM, as noted in Tables 2 and 3.
4. Vibration Control
Control of the longitudinal vibration input to the LDTM/ODTM was
accomplished with a 36-channel peak select system. The peak select control
system continuously monitored the output signals of lZ input control acceler-
ometers located on the ODTM bus structure main Iongerons (Fig. 10) plus a
24-channel mix of strain-gage/accelerometer response transducers. Bolted
attachmentwas mandatory for the input control accelerometers (Refs. Z and 4).
The acceleration input to the test structure was controlled on the one
transducer whose output signal matched its peak select setting. A functional
diagram of the control system is shown in Fig. 1 1.
A 59-channel peak limit system was used. This safety circuit
terminated the output of the vibration exciter without transient if the instan-
taneous peak magnitude of any of the 59-peak limit settings exceeded a preset
value. Because of test philosophy/hardware differences, the peak limited
signals assigned to the LDTM were passed through a Z00-Hz filterprior to
reaching the protection module. Those channels used for ODTM peak
limiting were conditioned with 800-Hz filters.
The control of the lateral axis testing, in which four separate shakers
were used, was accomplished in a manner similar to the longitudinal test.
The four Unholtz-Dickie Model 4 667-N (150-lb) shakers and associated
power supply were married to the peak select control system. Because the
individual shakers were carefully matched with their transformers, it was
decided to control the force input on all four shakers by connecting them
together in series and using the armature current output signal from just
one of the four shakers. This technique proved very successful.
4 JPL Technical Memorandum 33-689
1975003956-014

5. Data Recording, Reduction
Control and response amplitude of the LDTM/ODTM were measured
with strain gages and accelerometers. The allocation of dynamic recording
channels is shown in Table 4. The overall instrumentation flow is presented
in Fig. lZ.
The Z74 output signals noted in Table 4 were recorded on electromag-
netic tape for all test runs. In addition, approximately 48 channels of control
and housekeeping data were recorded in real=time display on oscillographs
for each test run. Following each test run, qu;...-look data reduction was
ac:omplished according to the sequence shown in Fig. 13. More formal data
reduction consisted primarily of X=Y plots of all component responses for
the FA and TA test runs.
A large number of static measurements were made on the ODTM during
buildup and always following each test run. These strain measurements
(approximately 140 to 175} were in printed paper tape format. Monitoring of
dc offsets in this manner contributed greatly to test confidence where the
integrity of ODTM structure was concerned.
Detailed measurement assignment sheets and patch assignments are
contained in Appendix C.
6. Test Run Summary
Test sequencing and run parameters are shown in Table 5. A total of
44 separate test runs were made on the LDTM/ODTM during the period of
November 5 through December 10, 1973--a span of 24 days. Actual test
runs were short-- a matter of several minutes. Test preparation, control
console setup, and trouble-shooting made the largest demands on the time
budget.
J PL Technical Memorandum 33-689 5
1975003956-015

III. DISCUSSION OF TEST RESULTS
A. DATA REDUCTION
The response characteristics of the test structure were derived from
analysis of recorded test data. As originally planned, the bulk of ODTM
test data on electromagnetic tape was to be reduced from analog to digitized
format, manipulated by program, and output in a tab run form. These tab
runs were to furnish the following information for each test run:
(1) Identification of control or response limiting channel at each
0.1 Hz of selected bandwidths of interest.
(Z) Display of maximum amplitudes of response channels and fre-
quencies of maximum response.
(3) Manipulated data from maximum response channels {loads,
moments, cumulative damage ratios).
From examination of these tab runs, selected X-Y plots of amplitude versus
frequency were to be selected for comparison with response analysis plots.
Manual reduction of on-line (real-time) oscillographs was to be accomplished
on a quick-look basis to assess the adequacy of a test run.
During the initial test runs, it became apparent that the fo mat speci- 1fled in steps (1), (Z), and (3) could not be achieved because of equipment 1
tlimitations. Existing capability did not include the possibility of identifying
the controlling channel or maximum response in a digitized, tab run format. 1
Since confidence was lacking in these basic data, attempts to perform i
step (3) were abandoned in favor of an analog computer. _ :i'
Another major change that became apparent as testing progressed was i
that the original plan for processing and evaluating LDTM data was _nade- 1
quate. The initial scheme was to rely on real-time oscillograph records ]
for test evaluation and accomplish final data reduction following completion 1 '
of all testing. Since this level of effort could not support the LDTM, the 1entire concept of data reduction was redirected and typically accomplished ! °
in the manner shown in Fig. 14. i
Following a typical test run, the test team would gather in the data
i acquisition facility to review the 48 channels of on-line oscillograph records.t
i
6 .[PL Technical Memorandum 33-689 _
l
1975003956-016
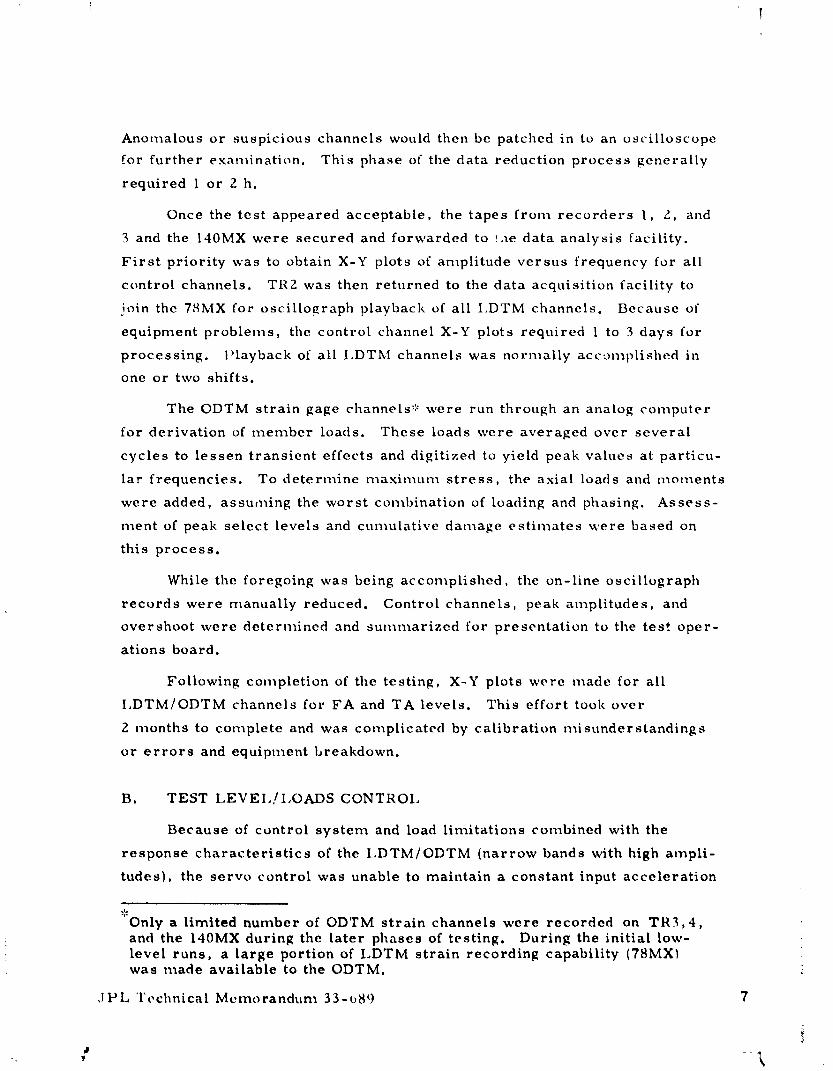
Anomalous or suspicious channels would then be patched in to an oscilloscope
for further exan_ination. This phase of the data reduction process generally
required 1 or Z h.
Once the test appeared acceptable, the tapes from recorders 1, 2, and
3 and the 140MX were secured and forwarded to tae data analysis facility.
First priority was to obtain X-Y plots of amplitude versus frequency for all
control channels. TR2 was then returned to the data acquisition facility to
ioin the 78MX for oscillograph playback of all I,DTM channels. Because of
equipment problems, the control channel X-Y plots required 1 to 3 days for
processing, l_layback of all I,DTM channels was normally accomplished in
one or two shifts.
The ODTM strain gage channels':' were run through an analog computer
for derivation of member loads. These loads were averaged over several
cycles to lessen transient effects and digitized to yield peak values at particu-
lar frequencies. To determine naaxinauna stress, the axial loads and naot_ents
were added, assuming the worst combination of loading and phasing. Assess-
ment of peak select levels and cumulative damage estimates were based on
this process.
While the foregoing was being accomplished, the on-line oscillograph
records were manually reduced. Control channels, peak amplitudes, and
overshoot were determined and sunamarized for presentation to the test oper-
ations board.
Following completion of the testing, X-Y plots were made for all
I,DTM/ODTM channels for FA and TA levels. This effort took over
2 months to complete and was complicated by calibration naisunderstandings
or errors and equipment breakdown.
B. TEST LEVEI,/I,OADS CONTROl,
Because of control system and load limitations combined with the
response characteristics of the LDTM/ODTM (narrow bands with high ampli-
tudes), the servo control was unable to maintain a constant input acceleration
"Only a limited number of ODTM strain channels were recorded on TR3,4,and the 140MX during the later phases of testing. During the initial low- ilevel runs, a large portion of LDTM strain recording capability (78MX)was made available to the ODTM. :
,IPL Tochnical Memorandum 33-t_89 7
1975003956-017

at any one of the twelve control accelerometers. This was not unexpected
since similar behavior had been observed in earlier spacecraft testing. In
addition, studies conducted at the dynamic test facility using instrumented
cantilevered beams and the proposed control hardware disclosed that control
might be difficult at frequencies below 17 Hz. That is, during the switching
from one control channel to another, overshoot errors could occur resulting
in a possible overtest. Overshoot is defined as maximum observed test
amplitudes greater than the peak desired select control level.
Two basic sources contribute to overshoot: RC time constant ofac to
dc conversion, and deadband. The time constant is simply the time required
to convert the ac signal from the transducer into adc voltage. This is done
in two places: in the ACS-6 (peak selector) and in the servo. The time con-
stant is a function of frequency and is longer at low frequency than high.
Deadband may be defined as the amount that one signal must exceed another
in order to cause a switch of the ACS-6 output from the latter to the former.
Of the above two overshoot sources, the RC time constant was the more
significant.
Although a definitive model of the control system capability is not
available, the overshoot appeared to be dependent on the following
parameters:
( 1 ) Resonant frequency.
(2) Slope or O of the resonance.
(3) Sweep rate.
(4) Direction _,f sweep (up or down).
Significant overshoots were observed during the test runs. Low-level
(precursor) test runs were made and the peak select control levels carefully
monitored to evaluate this phenomenon. Examination of on-line oscillograph
records uf response control strain gages disclosed initial amplitudes of
I. 00 to I. 52 times the peak select level established for these transducers.
The stress values from these low-level test runs were used to derive
internal loads in the ODTM structural members. The peak limit and peak
select load ,,alu¢s were established based on these low-level runs and applied
B JPL Technical Memorandum 33-689
1975003956-018

i
to full FA and TA test levels. The formulation shown in Fig. 15 was used
to derive these control levels.
C. RESPONSE MEASUREMENTS
All forced vibration test runs on the LDTM/ODTM were controlled by
ODTM bus input accelerometers or by various strain-gage/accelerometer
response measurements. The characteristics of this 36-channel peak select
control system were not included in the response analysis. In addition, the
type approval control values selected for load limiting were approximately
two-thirds of the limit values used in the analysis. Th,_refore, extremely
close correlation between test and analysis cannot be expected. Neverthe- !
less, some typical accelerometer and strain-gage response measurements
have been compared with analytical predictions and are presented in Tables 6
and 7. In general, the correlation appears reasonably good (Kef. 5).
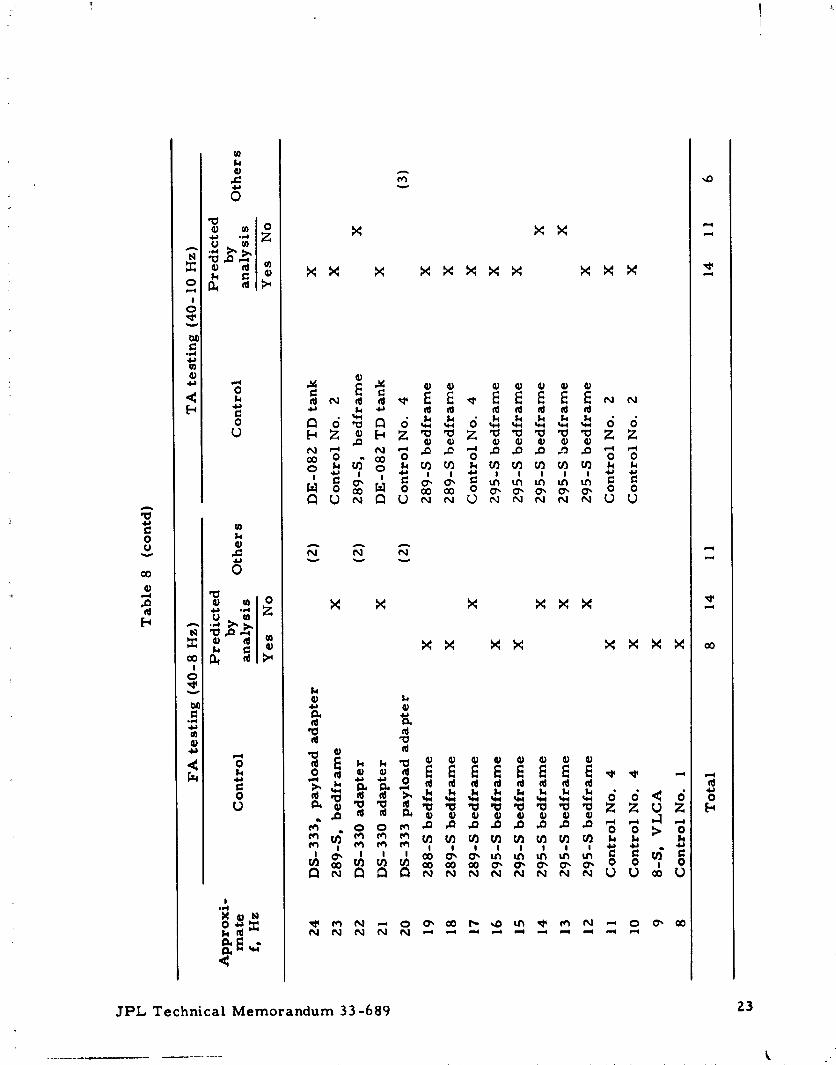
The response analysis of the coupled LDTM/ODTM math models was
very helpful in estimating potential response control channels. Examination
of Table 8 gives an approximate indication of the actual versus predicted
control channels. At first glance, it would appear that the correlation is
not good. However, the agreement between analysis and test is better than
casual observation indicates for the following reasons:
(I) These frequencies marked (I) represent conditions where the
terminal descent (TD) tank peak select levels were set substan-
tially lower than the values used in the analysis. Consequently,
the TD tanks were biased to attain greater control during actual
testing. The sensitivity of the control system to lower TD tank
control levels is demonstrated by comparison of the FA and TA
runs in the table. DE-D79 used in the FA tests was replaced by
DE°08Z, with a peak select setting approximately 80°/0 of its
initial TA level. This channel assumed control so effectively
that no other Lander controls appeared in the TA switching
sequence.
(7) The (2) notation in FA testing represents Lander payload adapter
strains that were never included in the response analysis.
JPL Technical Memorandum 33-689 9
¢ i _,'
1975003956-019

(3) Precision in determining exactly when a control accelerometer
will take over (other than for rigid-body modes) is beyond the
capability of present analysis. This is particularly true when
the actual control system constraints are considered (i.e., over-
shoots, time constants, etc.).
: (4) The upper plane truss 134-S was shown by analysis to be at 80%
of its limit.
Some typical measured load values have been compared with their
! analytical counter parts (Table 6). Based on that sample, 50% of the meas-
ured frequencies were higher than predicted and 50% ]nwer. Approximately
two thirds of the measured loads were somewhat lower than predicted values.
This was not unexpected because of the tolerances used in establishing peak
limit/select values; i.e., the analysis limits did not include test tolerances.
Examination of typical response accelerations (Table 7) reveals that
measured frequencies were usually higher than those predicted by analysis.
Amplitudes were generally lower than predicted by approximately that
amount established by test tolerances.
IV. CONCLUSION
The following remarks may be made based on the stack testing
experience and review of the test data:
(1) Test implementation went better than anticipated. This was
due, in large part, to the careful preparation leading up to the
test and the long hours of overtime donated by the test team.
(2) Forced vibration qualification levels were successfully imposed
on the LDTM/ODTM Orbiter primary structure. Load levels
generally did not reach design load limits attained in static test-
ing because of the control system test tolerances,
(3) Test predictions based on the Viking mathematical model corre-
lated reasonably well with the test data. In general, test fre-
quencles were _lightly higher than analytical predictions and
I0 JPL Technical Memorandum 33-689
i
q97500395G-020

amplitudes lower. This further demonstrates that the coupled
Viking spacecraft mathematical model has no major errors.
(4) JPL test equipment and methods have been checked out for use
on the proof test Orbiter. The test was controllable down to
10 Hz at TA levels.
REFERENCES
1. Snyder, R.E., Summary of LDTM/ODTM Stack Test Results forViking Management Council. Langley Research Center, ttampton, Vs.,Feb. 1¢}74.
2. Morgan, N., and Fortenberry, J., Vikin8 75 ODTM/RL and LDTM/ODTM Forced Vibration Test Plan and Procedures, Project Docu-ment611-51. Jet Propulsion Laboratory, Pasadena, Calif., Dec. 1973(Internal document. )
3. Rader, W.P., Test Specification for LDTM/ODTM Sinusoidal VibrationTest, Document No. 837J20001-tl. Martin Marietta Corporation,Denver, Colo. Oct. 1 }_3.
4. Milder, G.J., Structures and D)'namics Section Viking 1t_75 ODTM/LDTM Forced Vibration Test Procedure Longitudinal Axis (Z), 'restProcedure 507000. Jet Propulsion Laboratory, Pasadena, Calif.,Oct. 1973. {Internal document.)
5. Vigil, R.A., LDTM/ODTM Forced Vibration Test Anal)'tical and TestData Comparison, Document No. 0433/74-044. Martin MariettaCorporation, Denver, Colo., Feb. 1'_74.
6. Milder, G.J., and Valtier, H., Viking 1t_75 ODTM/RL and Viking 1q75ODTM/LDTM Forced Vibration Test, October 26 -December 10, 1t}73.Test Report VO75-35-100. .Tet Propulsion Laboratory, Pasadena,Calif., Jan. 1t}74. (Internal document.)
7. Valtivr, H., Accelerometer t_:able Test, Interoffice Memorandum
354/HV/Z-74. Jet Propulsion Laboratory, Pasadena, Calif.,Jan. 1974. {Internal document.)
JPL Technical Memorandum 33-68q 11
1975003956-021

; 1
Table 1. ODTM propulsion module mass configuration,294 K (70 ° F)
Referee Fluid, weight, Ullage, Pressure,T ankfluid kg {lb) % N/m 2 (psia) a
Oxidizer Freon TF 935.6 16. 8 723,950(2,063) (105)
Fuel Isopropyl 504. 3 10. 1 723,950alcohol (1, 112) (105)
Pr es surant - -- - Atmo sphe r ic
aODTM propellant tank pressures were closely monitored during thestack test series (Appendix C).
Table 2. Forced vibration test levels, longitudinal (Z) axis
Amplitude, g peak
Level 200- 20- 128- 20 - 200- 128-25-7 Hz 22-8 Hz 22-10 Hz 200 Hz 128 Hz 200 Hz
Precursor 0. 5 -- -- 0.5 -- --
Flight -- 1.0 -- -- 1.0 0. 00003 m(0.0012 in.)acceptancedouble
amplitude
Type -- -- 1.5 -- 1. 5 0. 00046 mapproval ( 0.0018 in. )
doubleamplitude
12 JPL Technical Memorandum 33-689
1975003956-022
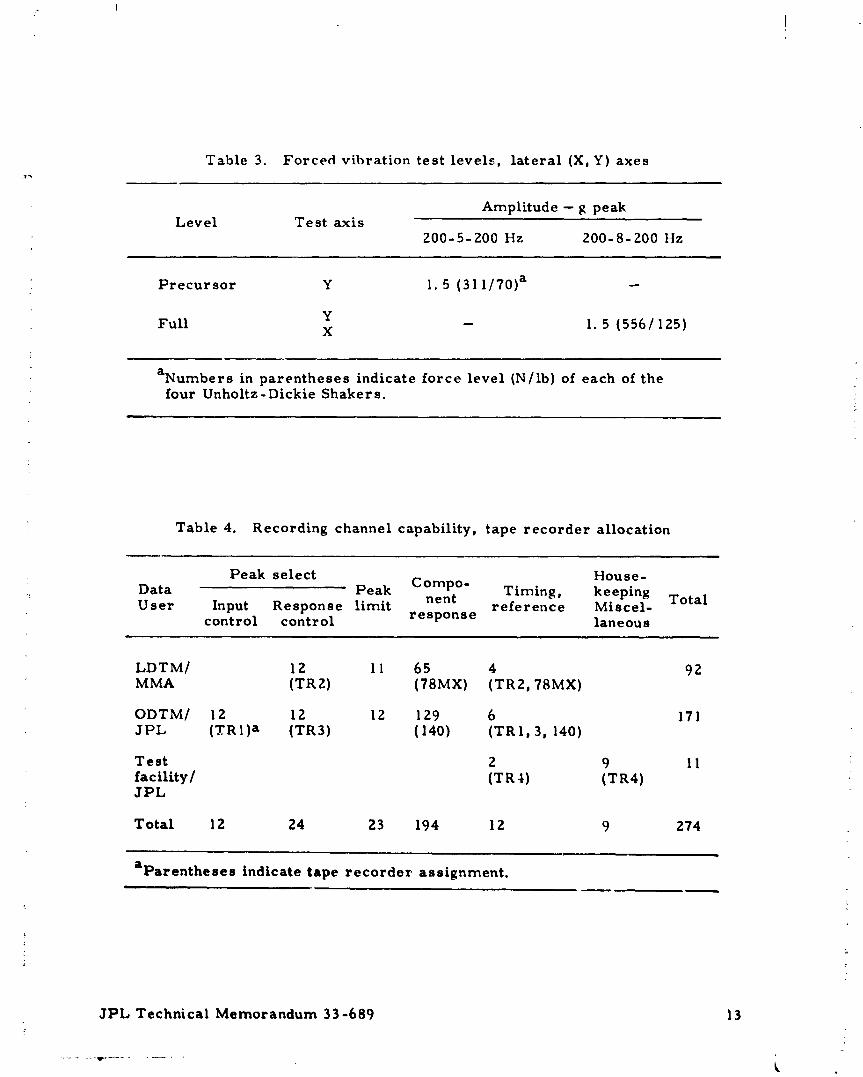
Table 3. Forced vibration test levels, lateral (X,Y) axes
Amplitude -- g peakLevel Test axis
200-5-200 Hz 200-8-200 Hz
Precursor Y 1.5 {311/70) a -
YFull X -- I.5 (556/125)
aNumbers in parentheses indicate force level (N/lb) of each of thefour Unholtz- Dickie Shaker s.
Table 4. Recording channel capability, tape recorder allocation
Peak select House-
Data Peak Compo- Timing, keepingUser Input Response limit nent reference Miscel- Total
control control response laneous
LDTM/ I2 lI 65 4 92MMA (TR2) (78MX) (TR2, 78MX)
ODTM/ 12 12 12 129 6 17]JPL (TRI) a (TR3) (140) (TRI, 3, 140)
Test 2 9 1!facility/ (TR 4) (TR4)JPL
Total 12 24 23 194 12 9 274
al_arentheses indicate tape recorder assignment.
JPL Technical Memorandum 33-689 13f
....... t ...........
1975003956-023
_ _0_. _ _ _ .o
...oo__ N
0_
u_ 1_ u_ u_ urt u_ m u_ 0 0
0
['4e_
I
o o . }
_ U '
N _ _
_I_ _ I_, I I _ii ! '_ I I I _ _
N N N N N N N N _ t_ _ "
" i_._o_ =o
M" N N N N N N N N N N e _".ml_.
C_
I I I
t 14 3PL Technical Memorandum 33-689 |
1975003956-024

!
_N N
',,,D _ _0 0 _' 0" 0_. 0" 0
..,=¢ =,=.= _ ,,i¢ _ .=,.¢ =,if
N _ '_ ul_ _0 h. O0l I I I I I I
; 3PL Technical Memorand'am 33-6Rq 15
1975003956-025
!
I_r-,
0 _1 .........
u_
0
GO N N ,"* I m
• _ N _ N N N N N N N
0 0 r.- I _. r.- _o co _o
eP-- N N N N _ N _ N N
i_ ___ I I I I
U'1 U_ _0 *0 qO ,_D qO I'_ I'.-
i 16 JPL Technical Memorandum 33-689
| __, i
] 975003956-026

J t
Iel
_w
0 _ _ NO_ O_ 0 _ @.
• E_ N N N N N _-m m sis _It _it _
N I_ _1' th "*
JPL Technical Memorandum 33-689 17
t ,
1975003956-027

0
O_i_-- ,,0 ur_ ,-_ ,-_ ,-_
N N N N ¢'_ N
0 0 0 0 0
I_ ,"'_ N N N N N N
I I I I
!, _; o o o o o oN N N N N N
18 31_L Technical Memorandum 33-689
1975003956-028

, !
N N0
N N N O0
I
0 0 0 0
I_ N N N N_ V
_Z o o oN t'_ e_ e_
2
JILL, Technical Memorandum 33-689 19 i '
1975003956-029

Z0 J_L Technical Memorandum 33-689
1975003956-030

f
++.
' Eo _
: °11 _o _ _
.,¢
_I gg °'+o _ -:-' _ _ .........,.,,+ _ I,< .E
-g_ - = i2
¢I + _ _'" -" " ++ +
m+ " +u :
UIll =
II
•_._ < o _.=.,_ _< ..+• _1 >_ _'_ "_'. _ ,,
l", ._-_ O,_Ox_N r+--- ,-,.._ I-, x ," I_ x :" t-_,-,< X ;,,-,,-,s, X ,.-,x X ;.'-'N
; -_
i
+
3PL Technical Memorandum 33-689 21
,!J
1975003956-031
I 1
ZZ 3PI_ Technics} Memorandum 33-689
1975003956-032
3PL Technical Memorandum 33-689 23
k
1975003956-033

Fig. 1. View from balcony of LDTM/OI)TM longitudinal(Z) axis test setup
24 JPL Tectmlcal Memorandum 33-689
t
1975003956-034

1
1975003956-035

b'lg. _. 'l'yvic,_l hydrostatic be,lrin_ installation
26 ,l I_I, T_'chnic,ll M_,m_)r,lndum 33-),8')
X.
1975003956-036

Fi R . 4. Pneumatic spring support system
JPL Technical blemorandum 33-t)89 27
1975003956-037

Fig. 5. Shaker body blockingsystem
Z8 JPL TechnicalMemorandum 33-689
8
\
1975003956-038
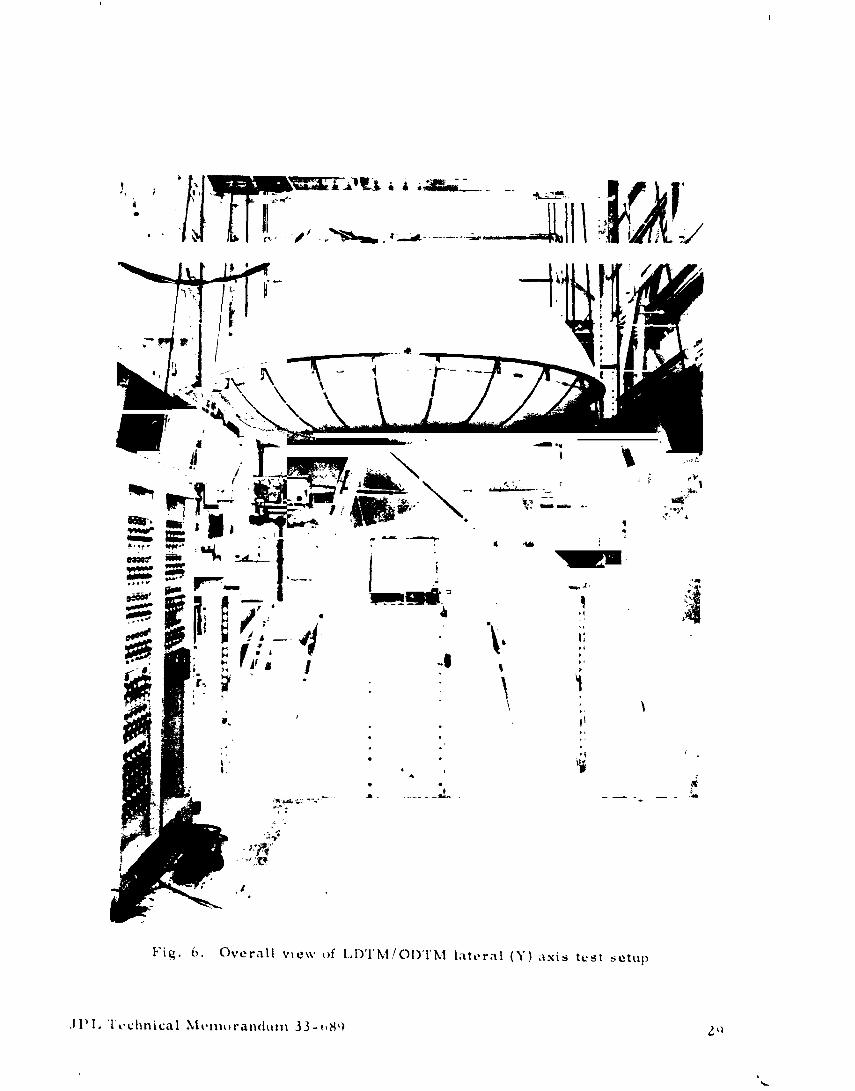
FiR. (>. Overall view of I,IYl'k.IIOI)TM lateral (Y) axis test setup
,1t_I, T_..chnical kl,_,nl_,ranclulli 33 - l>S't ,_,l
1975003956-039

d
1975003956-040
1975003956-041

32 ,IPI, T_,chnical iMemorandun', 33-_,89
1975003956-042


CONSTANT DtFFSINEREF CONTROL AM_"_Pn_u'renl :
[ ...... = ----n
[ . .',x_xi,i-.PU-;I_'_I,_sI _"'
i CONVERTER
!_ S/CSTRAINPEAKLIMITi I
H 6&K2416 < Zk-.-. ELECT.
VOLTMETER
L_........ ._ ..... __--J_
PEAKSELECT
F - _I ' _1 _[ i
i
't ilI _ U,D.ACC....CONTROL U.D. ACS-6MASTER CONTROL,
J SELECTO|
I '
J I PEAKf
J i CI INDIC_
L -Fig. II. LDTM/OD_.
F-Q_X_J.I _ FOLDOUT,3PL Technic&l Memorandum 33-689 '_
197500:3956-044

DIFF
__ CONTROL TO INSTRUMENTATION
DIFF
CURRENT _ TO INSTRUMENTATIONTO INSTRUMENTATION POWERAMPLIFIER
I ...._',_" I I " " -- ; =; POWERAMPLI- SWITCHING MATCHING
_-[ .... II II ,.,, cu.icL, T,ANs,o_,l1--.J _ ........F PEAKLIMITERS
[-_ ..... .... 1 LING_,,VIBRATION
JPL VIB PROTECT. J IMODULE _K LIMIT) J I J I I I i OVERTRAVEL_9 CHANNELS HOUSEKEEPING _"" I _1 ,,,_.M.ERI'-I i. i "O,._ONTALOV_'TRAV'L
t t o,- / I--I '_ _ o,LPRESS,.,,.TEAM,,,.,,NGS
: TO OIL PRESSURE/AIRPRESSUREINTERLOCKS VO'75 SPACECRAFT
// /EXCITER STRAIN GAGE SYSTEM,ROOM 100 LDTM,/ODTMHEAD .........
ll SPEAK O J- 1 CHANNELS36CONTROL
/ I_CSTRA,NPEAK.M,TL,M,T_ I S_"NGAG'II S_,NGAG'l i C.ANNELs"PEAKL'M'T_/ , J | AMPLIFIERS _ EXCITERSAND lel i --O--/ / GAIN = 200 I I BRIDGE I •,,_/ I I"1 I I I I
1 1 1_/ - 1. ...J. PEAKSELECT GALVO OUT
1 ACCELEROMETER e.---/ CHARGE AMPLIFIER,
:_ t I_I sER,,oout I'ODEJ
_, CONTROLSELECTOR IJ 120-Hz _ '
p,. (6 SLAVES) I I.,..J LOW-PASSFILTER TAPEOUT TO
,,,, J J 36CHANNELS 37CH INSTRUMENTATION
i FILTERING
CHANNEL J
INDICATOR D TO INSTRUMENTAo,_ "_ (7 UNITS) TION (ANALOG)
, I-ig. 1 I. LDTM/ODTM longitudinal (Z) axis vibration test control circuit, functional block diagram ;_
rOLl)OUTFI_AME3S
197500:3956-045


! !
REVIEWBYPLAYBACKOF | TESTTEAM
SELECTED I (LDTM/O DTM)
CHANNELS ONOSCILLOSCOR
L .. REVIEWBYTESTTEAM
I SUMMARIZEDBY
ON-LINE TESTCONDUCTORO-GRAPHS(TRI,2,3o4) EVALUATION OF TEST
DECISION TO PROCEEDTO NEXT TEST
REVIEWBY IDI O-GRAPH PLAY- J TESTTEAM
BACKOF LDTM _ (LDTM)CONTROL RESt_ONSEJCHANNELS (TR2, I
711_X) J
REVIEW|Y
J t TESTTEAM
X-Y PLOTSOF (LDTM/ODTM)ALLCONTROLCHANNELS (TR1,2,3)
Fig. 13. Sequence of quick-look datareduction for testrun evaluation
REAL-TIMEEVALUATION FI REVIEW,WRITTENSUM-J
OF ON-LINE O-GRAPHS MARY OF ON-LINE JO-GRAPHS BYTEST [
(48 CHANNELS, TAPE CONDUCTOR JRECORDERSIw2,3,4)
tPLAYRACKOF CHANNELSOF INTERESTON OSCIL-LOSCOPELTAffi[RECORDERS
1,2,3,4 71tMX) t OSCILLOGRAPHPLAY- ]
IINITIATE I t RACK OF TR2, 7IMXAT DATARECORDINGACTION FOR JNEXT TEST J | DECISION FACILITY
TRI,2,3,14QMX TOYES DATA REDUCTION
FACILITY FOR X-YNO PLOTS
tREMEDIALACTION; E. G. , 1 ANALOG/DIGITAL "J
CHANGE RESPONSECON- _ COMPUTATION OF
TROLCHANNELS AND/OR ODTM LOADS,PEAKSELECT/LIMiT MOMENTS, CUMU-VALUES LATIVE DAMAGE
Fig. 14. Typical data reduction sequence
38 3PL Technical Memorandum 33-689
1975003956-047

am
I_°w_°_°'°" I l I(DERIVED FROM ] × (STD TEST TA PEAK LIMITTOLERANCE) J
LOA0 ANALYSIS) I VALUE
If
I 1°_ I I ITA PEAK x (30_6 OVER- _ TA PEAK
LIMIT VALUE SHOOT FACTOR) J SELECT VALUE
f I
I I°" I i ITA PEAK FA PEAKSELECT VALUE x (STO TEST
TOLERANCE) LIMIT VALUE
It
I loo I I IFA PEAK (30% OVER- = FA PEAKLIMIT VALUE x SHOOT FACTOR) SELECT VALUE
F[ 8. 15. Flow plan for establishingpeak limit/select values
JPL Technical Memorandum 33-689 39
" '' k
1975003956-048

ti
APPENDIX A
SUPPORTING ANALYSES
The complexity, scope, and tight schedule of the stack test left no
time for surprises or emergencies. As a result, significant effort was
devoted to pretest analysis. The analyses were divided into four categories:
test fixture, overturning moment, response or test simulation, and fatigue
damage.
I. TEST FIXTURE ANALYSIS
The predesign of the magnesium Z-axis test fixture was evaluated as
a first step in the analysis of the stack test setup. The objective of this
analysis was to determine characteristics of the basic fixture and to ascer-
tain the level of fixture representation required for the response analysis.
The analytical configuration consisted of a simplified 12-degree-of-
freedom (DOF) model of the spacecraft (6 DOF each for Lander and Orbiter),
combined with a dynamic model of the test fixture. The VLCA and V-S/C-A
were elastically modeled. The fixture was considered fixed at the base of
its core.
Two types of analyses were performed: static and modal. Static loads
applied to the combined system yielded only a qualitative estimate of the
fixture strength since boundary conditions were not represented in this
analysis. Modal analysis was performed on the combined fixture/spacecraft
model and also on the spacecraft model cantilevered from the base of the
V-S/C-A. The comparison of combined system modes with cantilevered
spacecraft modes gave an indication of fixture rigidity.
The first fixture mode (torsional) occurred at 36 Hz, with five addi-
tional modes between 100 and 200 Hz. Since a design goal was to keep fix-
ture resonances close to 200 Hz, considerable changes were made to the
proposed test setup. These modifications included a pair of V-type hydro-
static bearings at one location around the fixture. A further refinement of the
i analysis disclosed that the addition of torsional restraint flexures did not con-
tribute enough stiffness to be cost-effective. The results are summarized in
_ Table A- 1.• PR_CKDh_ PAGE BLANKNOTFILMED
JPL Technical Memorandum 33-689 41
1975003956-049
II. OVERTURNING MOMENT
Early in the program, it became apparent that the longitudinal test
buildup, its stack height coupled with the spacecraft CG offset, would be
subject to large overturning moments. Estimates of these moments ranged
from 56,000 to 113,000 Nm (500,000 to I, 000,000 Ib-in.) applied to the
VTA/test fixture interface.
For this analysis, the Orbiter elastic model was coupled to a rigid
lander. This combination, in turn, was mated to a rigid longitudinal fixture
model restrained at three locations by hydrostatic bearings of known stiff-
ness. The results of the analysis offered the first positive indication that
the stack test could be implemented. Angular deflection limits of the shaker
armature, a source of concern, were shown to be no problem.
In addition, reaction forces on the hydrostatic bearings and the forces
applied to the fixture were computed and used to perform a stress/fatigue
analysis of the fixture and check the bearing adequacy. These same moment
reaction forces were applied to the piers supporting the bearings to check
their stability.
III. TEST SIMULATION, RESPONSE ANALYSIS
Response analysis of the test setup was required for the following
reasons:
(I) To obtain an estimate of the test environment, i.e., identify
member loads and locate accelerometers at critical response
points.
(2) To evaluate shaker force requirements and control levels.
(3) To provide reaction forces for fixture design.
(4) To provide an estimate of the spacecraft fatigue capability.
The analysis followed an evolutionary pattern and was accomplished
: in phases since both LDTM and ODTM elastic models were being r,,vised
and upgraded. A comparison of the character'stics of each phase is shown
in Table A-2 for longitudinal excitation.
42 JPL Technical Memorandum 33-689
1975003956-050

!
1!
Simulation of lateral axis excitation was noteworthy because of a
change in test philosophy. Preliminary analysis had indicated excessive
coupling of the lateral _nd torsional modes of the spacecraft. This was due
to the combination of spacecraft CG offset and the application of unrestrained
driving forces at the bus main longerons. As a result, an intermediate
analysis using restrained or guided input forces was performed; it appeared
to solve the coupling problem at all but the lowest frequencies (5-10 Hz).
In this bandwidth, analysis indicated that the driving forces required were
so small that control might be difficult to achieve.
Finally, at the Test Readiness Review meeting, members of the Engi-
neering Steering Group objected to the restraint of spacecraft torsional
motion due to the massive lateral test fixture connected to a Ling 249 shaker.
The fixture was to be constrained by hydrostatic bearings to move only in
one direction. As a result, the test team was directed to seek a lateral
driving scheme with minimum restraint. The final choice (and analysis) con-
siste.d (,f using the four (_67-N (I 50-1b) shakers discussed in Section II-B-2.
IV. ESTIMATE OF FATIGUE DAMAGE
The objective of the fatigue analysis was to monitor and enable predic-
tion of possible fatigue damage so that vibration test levels could be con-
trolled to prevent cracks from forming in the ODTM primary structure.
The cumulative damage ratio (CDR) used to determine fatigue damage
can be stated as
J n.
0.z0i=l
wheren i= number of cycles experienced at a particular stress level ei and
N i = allowable number of cycles at that same stress level. The number of
cycles n in any frequency bandwidth is given by the expression
n = 60_fkin 2
where Af = bandwidth (Hz) and k = sweep rate (oct/rain).
JPL Technical Memorandum 33-689 43
1975003956-051

The CDR of 0.20 (failureis assumed at I,00) was feltto be conserva-
tiveyet generally consistent with prevailingpractice in industry at present.
Since the ODTM was scheduled for ultimate statictestingfollowing the
vibrationtest, every efforthaa to be made to assure a healthy test struc-
ture. The analysis, performed in two phases, consisted of the following
baaic steps: i
(I) i,4entification of critical primary structure.
(2) Sur_'ey of parts for material, notch-sensitive areas.
(3) Compilation of S/N curves, derivation of curve fitting equations.
(4) Obtaining loading spectrum (predicted or test).
(5) Computation of CDRs.
Phase I of the analysis, FA I, was designed to take computer-generated
(response analysis)loads combined with geometric and material properties
and compute the CDR. FAII did the same but was designed to accept data in
digitizedformat. In addition,FAII would print out the contributionof each
frequency intervalto the totalCDR for the member.
FA I performed itsfunctionas intended. FAII fellprey to the limita-
tion noted in Subsection Ill-A,Data Red,.ction.Namely, manipulated load
data was to be provided in digitizedformat. The effortof converting the
analog signalson the tapes to digitalform was finallyabandoned in favor of
the analog setup shown in Fig. A-I.
The net result of the fatigueanalysis was that the ODTM possessed
substantialmargin to withstand a moderate number of FA and TA level
vibration sweeps Without exceeding the CDR of 0. Z0. This provided consider-
able confidence in the conduct of the test since earlier approximate hand
analyses had indicatedpotentialproblems in the VLCA and bus main longe-
tons. This confidence was borne out when a rigorous post-testdye-penetrant
examination disclosed no apparent fatiguecracks.
44 JPL Technical Memorandum 33-689
k .
1975003956-052
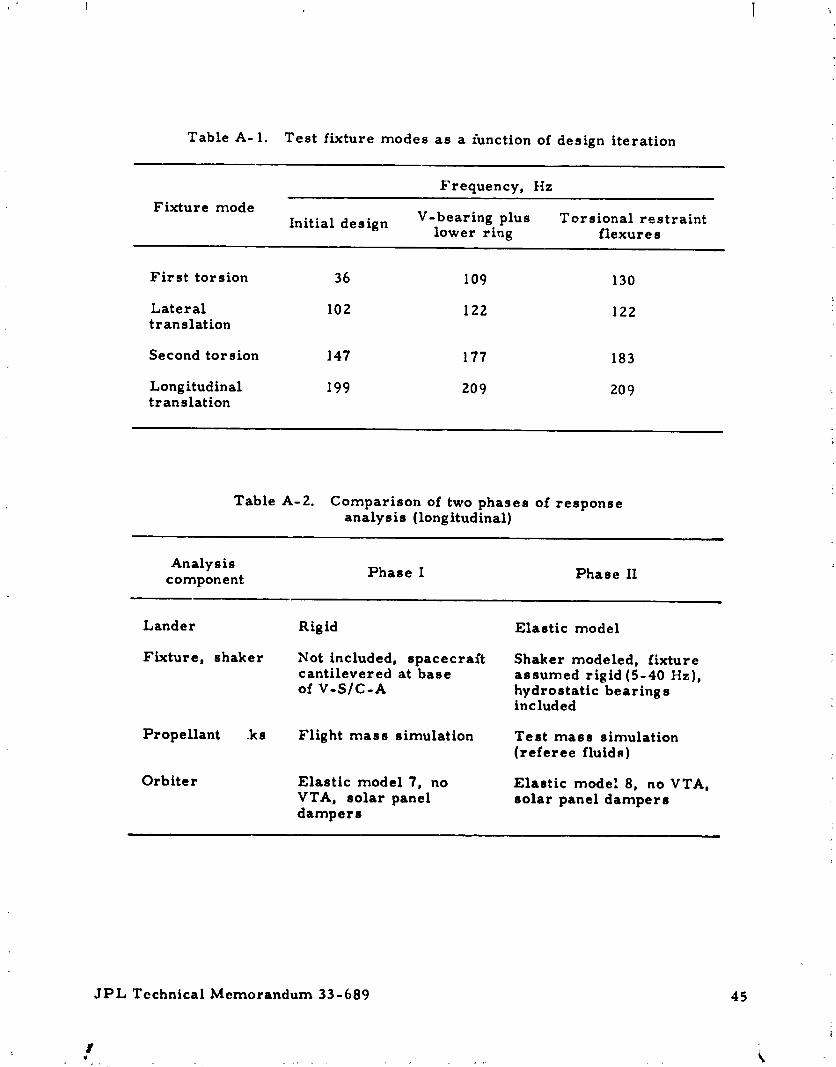
Table Ao 1. Test fixture modes as a £unction of design iteration
Frequency, HzFixture mode
Initial design V-bearing plus Torsional restraintlower ring flexure s
First torsion 36 109 130
Lateral 102 122 122translation
Second torsion 147 177 183
Long itudinal 199 209 209translation
Table A-2. Comparison of two phases of responseanalysis (longitudinal)
Analysis Phase I Phase IIcomponent
Lander Rigid Elastic model
Fixture, shaker Not included, spacecraft Shaker modeled, fixturecantilevered at base assumed rigid (5-40 Hz),of V-S/C-A hydrostatic bearings
included
Propellant ks Flight mass simulation Test mass simulation(referee fluids)
Orbiter Elastic model 7, no Elastic mode I 8, no VTA,VTA0 solar panel solar panel dampersdampers
JPL Technical Memorandum 33-689 45
: i
1975003956-053
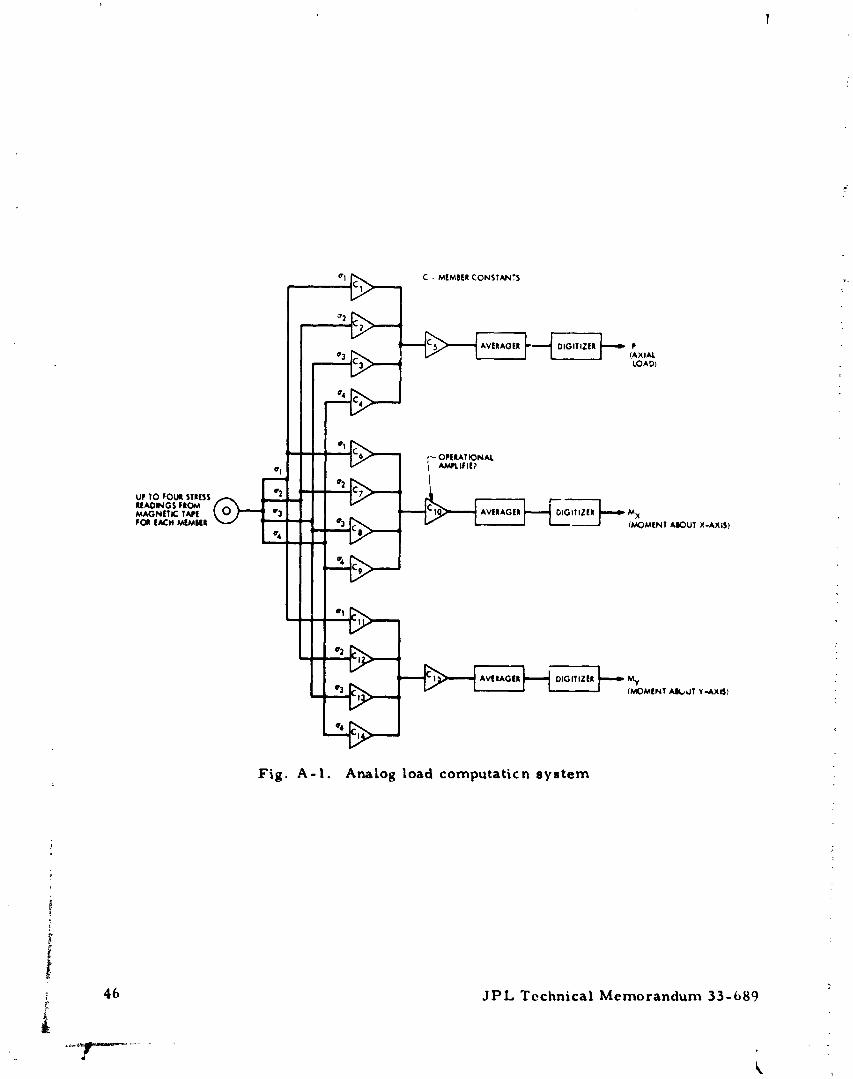
Fig. A-l. Analog load computaticn system
46 JPL Technical Memorandum 33-689
1975003956-054

Ai_ PENDIX B
RIGID LANDER TESTING
I. SUMMARY
Initial forced vik_ation testing of the Viking 75 ODTM was conducted
in the l_ngitudinal axis using a rigid lander (RL). This test, a precu_'sor to
the LDTM/ODTM (Stack) Test, was accomplished October 26 through
October 30, 1973. One third of type approval (TA) test levels were applied
to the ODTM/RL using the same dynamic test facility and equipment to be
later used on the LDTM/ODTM.
II. INTRODUCTION
The uverall objective of the ODTM/RL test was to aetermine the
readiness of JPLts dynamic test facility to conduct forced vibration testing
on the LDTM/ODTM Stack. To support this objective, the following tasks
were accomplished.
(1) Evaluation of the 36-channel peak select control channels.
(2) Determination c_¢ critical strain-gage control channels.
(3) Additional verification of the Viking Orbiter math model.
(4) Gathering of test data to s_pport future PTO testing with the RL.
(5) Demonstration that hardware and handling procedures were
adequate.
III. TEST PROGRAM
Except thatthe rigid lander was used instead of the LDTM, _he test
specin:en and longitudinaltest setup were the same as the LDTM/ODTM
test.
A. TEST SPECIMEN
i See Subsection II-A, main text.
JPL Technical Memorandum 33-689 47
" i
1975003956-055

B. IMPLEMENTATION
1. Longitudinal Test Setup
See Subsection II-B-1, main text, and Fig. B-I.
2. Lateral Test Setup
None.
3. Test Levels
All test runs on the ODTM/RL were made at 1/3 TA level or an input
of 0.5 g (peak) over a frequency range of 7 to Z00 Hz.
4. Vibration Control
See Subsection II-B-4.
5. Data Recording, Reduction
The allocation of dynamic recording channels is shown in Table B-l.
As with the LDTM/ODTM test, the 274 output signals were recorded
on electromagnetic tape for all test runs. Forty-eight channels of control
and housek_:,':ping data were recorded in real time display on oscillographs
for each test run.
The data reduction immediately following the rigid lander testing was
to have been accomplished at the 914 data reduction facility. Format was to
be as noted in Subsection IH-A. Because of the limitations noted in Subsec-
tion I!I-A, it was necessary to playback the strain-gage data on slow-speed
oscillographs and manuatly reduce the data using rulers, engineers, and
many hours. Although arduous, the structural loads derived in this manner
,-,re accurate and contributed significantly to confidence in the test.
X-Y plots of the more critical control channels were furnished by 914
on a piecemeal basis. The first complete set of 36 plots, free from errors,
was received approximately one week after delivery of the tapes to 914.
Measurement assignments and patch sheets are included in Appendix C.
48 JPL Technical Memorandum 33-689t
t
1975003956-056

6. Test Run Summary
Test sequence and run parameters are shown in Table B-Z. A total
of 15 separate test runs were made on the ODTM/RL during the period of
October Z6, 1973, through October 30, 1973. As with forced vibration
tests of this type, test runs required only a few minutes whereas preparation
for the test required hours.
IV. DISCUSSION OF TEST RESULTS
A. COMPARISON %VITH RESPONSE ANALYSIS
Examination of Tables B-3 and B-4 will show that the test correlation
with the response analysis of the ODTM/RL combination was excellent.
This is especially true since the characteristics of the 36-channel peak
select control system were not included in the response analysis.
In general, the frequency correlation was very close, often within a
Hertz or less. The measured loads tended to be slightly higher than the
predicted values.
Table P '. Recordin_ chanuel capability,
_pe recorder alloc_tti.on
Peak sele
Data Peak Compo- Timing House-nent refer- Total
user _aput Response limit keepingcontrol control response ence
ODTM/ i2 24 Z3 66 I0 264
RL (TRI) a (TR2,3,4) (78)IZ9
(140)
Test Z 8 10
facility (TR4) (TR4)
Total 12 Z4 23 195 I2 8 274
aparentheses indicate tape recorder assignment.
JPL Technical Memorandum 33-b89 49
1975003956-057

i I I o I o o t
_ o o o o o o o o o o o o o o o
50 JPL Technical Memorandum 33-689
1975003956-058

Table B-3. ODTM/RL forced vibration test comparisonof control channels
Predicted
Approximate byRun Frequency, Control analysis Comments aNo.
HzYes No
105 200-35 All control acceler- X
ometers except 5, 6
35 Control No. 5 X (1}
33 Control No. 6 X
30 Control No. 11 X
28 Control No. 8 X
26 Control No. 6 X
25 Control No. 1 X
23 Control No. 6 X
106-2 23 Control No. 1 X
22- 18 Control No. 6 X
18- 13 295-S Bedframe X (2), (3)
13- 12 Control No. 7 X
107-2 16 295-S Bedframe X {2)
15- 12 Control No. 7 X
12 355-S Siamese tab X
11-8 Control No. 1 X (4)
8-7-8 Control No. 7 X
8-11 Control No. 1 X {4}
12 355-S Siamese tab X
a(1) Bus main longeron stress control predicted at 34.4 to 35.0 Hz.Maximum stress reached 80% of peak select stress at 36 Hz.
(2) Bedframe predicted to be within 2% of controlling; i.e., at 98% oflimit level.
(3) Solar panel outrigger stress control predicted at 13.77 to 13.83 Hz.
(4) Bus main longeron stress control predicted at 8.74 to 8.76 Hz.
JPL Technical Memorandum 33-689 51
1975003956-059

I Table B-4. Typical ODTM/RLloads derived from strain-gage measurements, corn
Comparison set I Cor._parison
Member Frequency, Hz Load, N (ib) Frequency, Hz
Analysis Measured Analysis Measured Analysis Measured Ana
VLCA
752 13 12 3110 (700) 6000 (1350) 17 18-19 2670753 9 9 4140 (930) 4000 (900) 15 15 3560755 12 12 3690 (830) 5430 (1220) -- _ --
Upper plane truss727 13 13 1110 (250) 670 (150) 14 14 580730 8 8 1780 (400) 1510 (340) 15 15 440732 .......742 9 9 I160 (260) 1200 (270) 13 15 1020
Main longeronUpper
808 9 9 2800 (630) 3250 (730) 12 12 2670837 9 9 3830 1860) 4000 (900) 12 12 2670818 9 9 3420 (770) 3200 (720) 13 12 2800828 8 8 3690 (830) 3650 (820) 12 12 3110806 .... 12 12 6360
Lower
835 .... 12 12 6540816 .... 13 12 5340
Lower diagonal839 12 12 2800 (630) 3020 (680) 15 15 2580830 13 13 1330 (300) 1160 (260) 15 15 2670
Bedframe
660 7-16 7-16 756 (170) Low -- - --664 18 13 2540 (570) 2400 (540) 18 18 2540
Propulsion moduleSide bipodsP41 13 IZ 7250 (1630) 8980 (2020) 14 14 6230P36 12 12 7700 (1730) I0,720 (2410) 13 13 5780P04 12 13 5780 (1300) 7780 (1750) 14 14 5340
Top bipods
- • 7 12 12 4450 (1000) 6980 (1570) 16 18 3870- P03 12 12 1960 (440) 630 18 18 4230
Connectors
PI8 7-8 7-8 2670 (600) 2800 (830) 14 13 4090P08 13 13 2670 (600) 3900 (880) 13 14 2670P43 13 13 580 (130) 620 (140) -- -- _
V-S/C =A
686 9 8 2220 (500) 3830 (860) 12 12 4140
687 9 8 2400 (540) 3910 (880) 12 12 3870688 8, 9 8 1910, (430, 4670 (1050) 12 12 5920
2800 630)
FOL.oOUTFRAM£FOLuTJPL Technical Memorandum 33-689
1975003956-060

easurements, comparison with analytical predictions, 1/3 TA input, Z-axis, 8- 40 Hz
Comparison set 2 Comparison set 3J
ency, Hz Load, N (Ib) Frequency, Hz Load, N (ib)Measured Analysis Measured Analysis Measured Analysis Measured
i
18-19 2670 (600) 4000 (900) 24 22 3110 (700) 3690 (830)15 3560 (800) 3960 (890) 24 22 4000 (900) 3420 (770)- -- - 20 22 3250 (730) 2890 (650)
14 580 (130) 670 (150) 22 ZZ 3250 (730) 2000 (450)15 440 (I00) Low 23 23 2490 (560) 2050 (460)- -- -- 22 Z2 2670 (600) 2580 (580)15 1020 (230) 1250 (280) 33 23 490 (1I0) Low
12 2670 (600) 4890 (II00) 24 23 2540 (570) 3110 (700)12 2670 (600) 4000 (900) 19 19 2540 (570) 3110 (700)IZ 2800 (630) 3380 (760) 24 22 3110 (700) 3200 (720)12 3110 (700) 3560 (800) 22 22 1780 (400) 1600 (360)12 6360 (1430) 10,850 (2440) 21 19 3380 (760) 2300 (520)
12 6540 (1470) 9340 (2100) 20 19 890 (200) Low12 5340 (1200) 8140 (1830) Z0 19 1330 (300) 1070 (240)
'5 2580 (580) 2620 (590) ZO 21 1600 (360) 980 (220)15 2670 (600) 1600 (360) Z2 21 1330 (300) 1380 (310)
- - - Z0 ZZ 2540 (570) 2400 (540)18 2540 (570) 2800 (630) ....
14 6230 (1400) 6810 (1530) ....13 5780 (1300) 6850 (1540) 24 22 4890 (II00) 5960 (1340)14 5340 (1200) 6540 (1470) 23 22 5470 (1230) 8450 (1900)
18 3870 (870) 6490 (1460) -- -- -- ""18 4230 (950) (1040) ....
13 4090 (920) 4630 (880) ....
14 2670 (600) 3600 (810) 23 22 2220 (500) 3900 (880)- - - 23 23 580 (130) 890 (ZO0)
IZ 4140 (930) 4230 (950) 13,16 14 3670,236012 3870 (870) 3690 (830) 12,13 14 3670,2540 (870,530) 2980 (670)(870,570) 4180 (940)
12 5920 (1330) 5070 (1140) 12 15 5920 (1330) 5600 (1260) '
t
: FOI._IjT._ FRI_CEDINOPAOE BLANK NOT FILMED 53 "
1975003956-061

I ,
T ._
• _ ...... ., -,--_/
_ ,\
Z
: If
/
Fig, B-I. Viking 2975 ODTM/RL longitudinal (Z) ax_ test setup
_PL Technical Momorandum 33-689 __/i_'0 PAGE BLAN/¢ NOT Pl/_p_ 55

t
_r
!,
,h
APPENDIX C
MEASUREMENT ASSIGNMENT SHEETS AND PATCH ASSIGNMENTS !:
_
g
: i
i PP.ECEDINGPAGE BLANK NOT FILMF._
i
!i JPL Technical Memorandum 33-689 57
1975003956-063
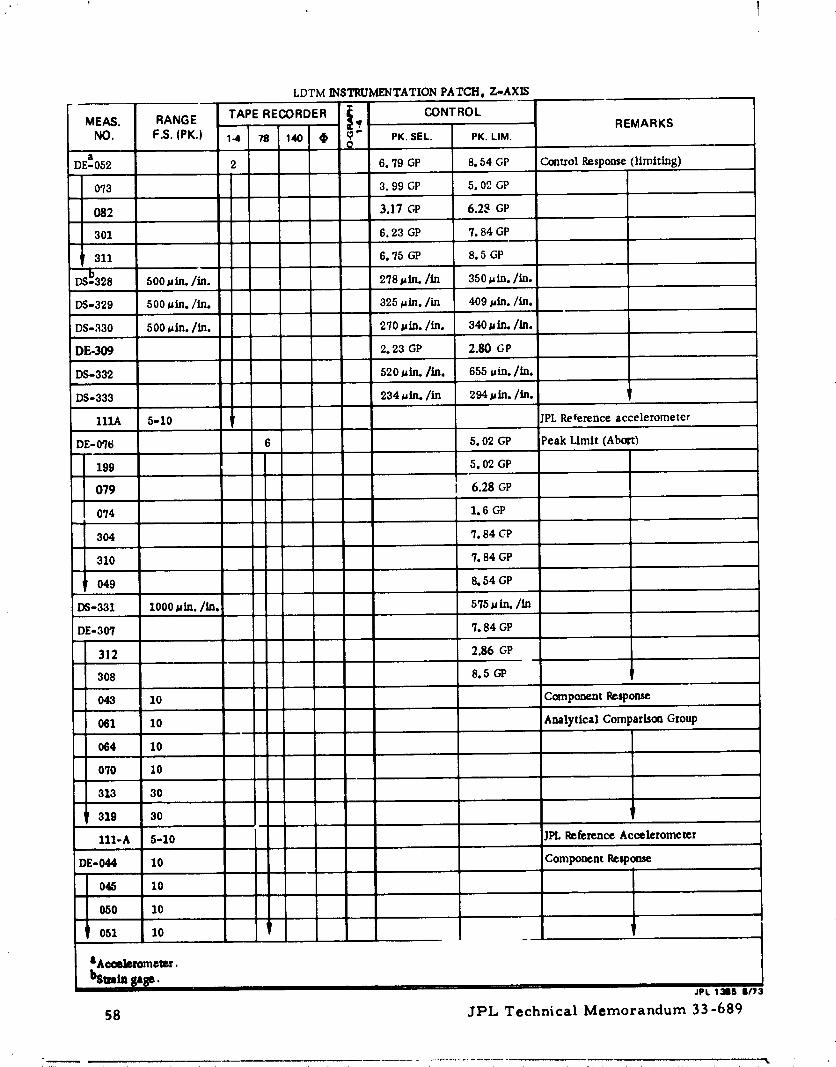
LDTM INSTRUMENTATION PATCH, 7-AXIS
TAPE RECORDER _ CONTROLMEAS. RANGE '_ REMARKS
NO. F.S. (PK.) 1.4 78 140 _ (_" PK. SEL. PK. LIM.Oa
3E-052 2 6.79 GP 8, 54 GP Control Response (limiting)
073 3.99 GP 5.02 GP
082 3.17 GP 6.2_ GP
301 6.23 GP 7.84 GP
311 6. 75 GP 8. 5 GP
Dsb328 500 Uin./in. 278 _in./in 350 _ in./in.
D$-329 500 _in./in. 325 _in./in 409 _in./in.
DS-330 500 ,=in./in. 27O _in./in. 340 _ln./In.
DE-_)9 2. 23 GP 2.80 GP
DS-332 520 uin./in. 655 uin./in.
DS-333 234 _in./in 294 _in./in.
111A 5-10 'PL Reference accelerometcr
DE-076 6 5.02 GP Peak Limit (Abort)
199 5.02 GP
079 I 6.28 GP
074 1, 6 GP
304 7, 84 GP
310 7. 84 GP
049 8. 54 GP
D$-331 1000 uin./in, 575 u in,/in
DE-307 7.84 GP
312 2.86 GP
308 8. 5 GP
043 I0 Component Response
081 10 Analytical Comparbon Group
064 I0
070 10
313 30
319 30
III-A 5-10 IPL Reference Accelerometer
DE-044 I0 Component Re=pome
045 I0
050 10
051 I0
IA_leaom_mr.
bsm/a gage.JPL 13118 |/73
58 3PL TechnicalMemorandum 33-689
Lk
1975003956-064
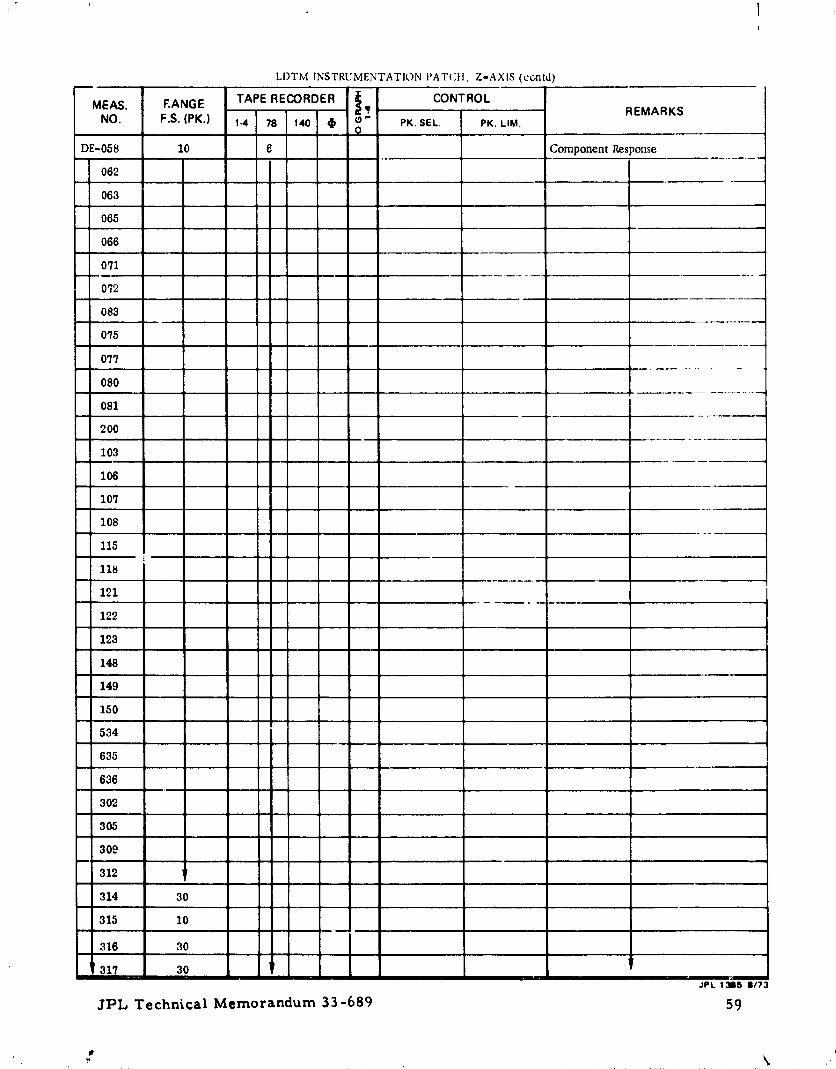
LDTM INSTRUMENTATION PAT(;tl, Z-AXIS (cGntd)
TAPE RECORDER _ CONTROLMEAS. RANGE'¢ REMARKS
NO. F.S. (PK.) 1-4 78 140 _ o,- PK. SEL. PK. Eta.O
DE-058 10 6 Component Response
062
063
065
066
071
072
083
075
037
08O
081
200
103
106
107
108
115
121
122
123
148
149
150
534
635
636
302
305
309
312
314 30
315 10
316 30
317 30 tJPL 1305 8/73
JPL Technical Memorandum 33-689 59
k
1975003956-065
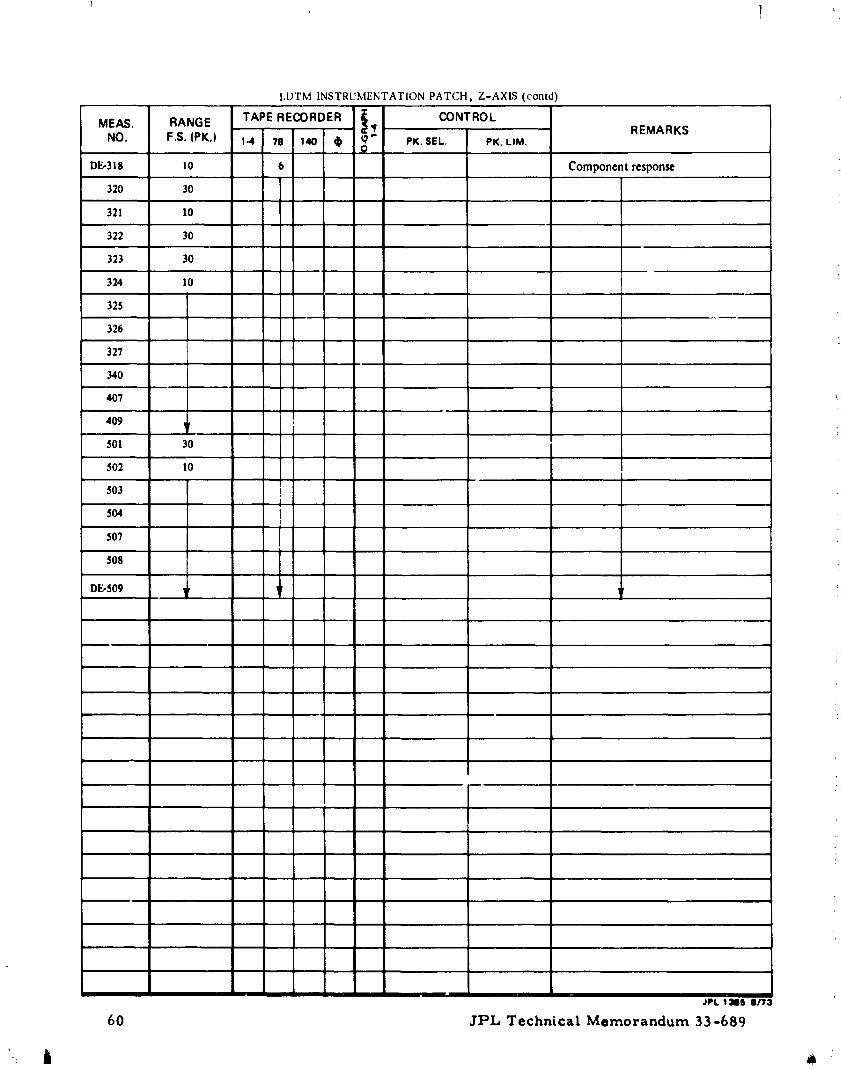
LDTM INSTRUMENTATION PATCH, Z-AXIS (contd
MEAS. RANGE TAPE RECORDER CONTROLREMARKS
NO. F.S. (PK.) PK.SEL. PK. ElM.
DE-318 10 Component response
320 30
321 10
322 30
323 30
324 10
325
326
327
340
407
4O9
501 30
502 10
503
5O4
507
508
DE-509
JPL t31BB|/?3
60 ffPL, Technical Memorandum 33-689
j
1975003956-066

LDTM INSTRUMENTATION PATCH, X AND Y AXES
MEAS. RANGE TAPE RECORDER CONTROLREMARKS
NO. F.S. (PK.) PK. SEL. PK. LIM.
DEa-050 2 1o13 g 1.43 g Cool, o| Pcs ponse (limiting)
2
2
2
2
2 ,:
10
5
5
10
Dsb-330 500/ain./in. _70 uin./in. 340 _in./_n.
rPLPtfercnee Force Gage
DE-077 2 1.43 g Peak Limit (Aboct) :
2
10
5
10
5
500 _in./in. 350 _in./in.
DE-066 Analytical Comparison Group
DE- 043 Component Input
aAcceleromemr,
bs_ain gage.JP_. 131B6 11/'/3
JPL Technical Memorandum 33-689 _,I
1975003956-067
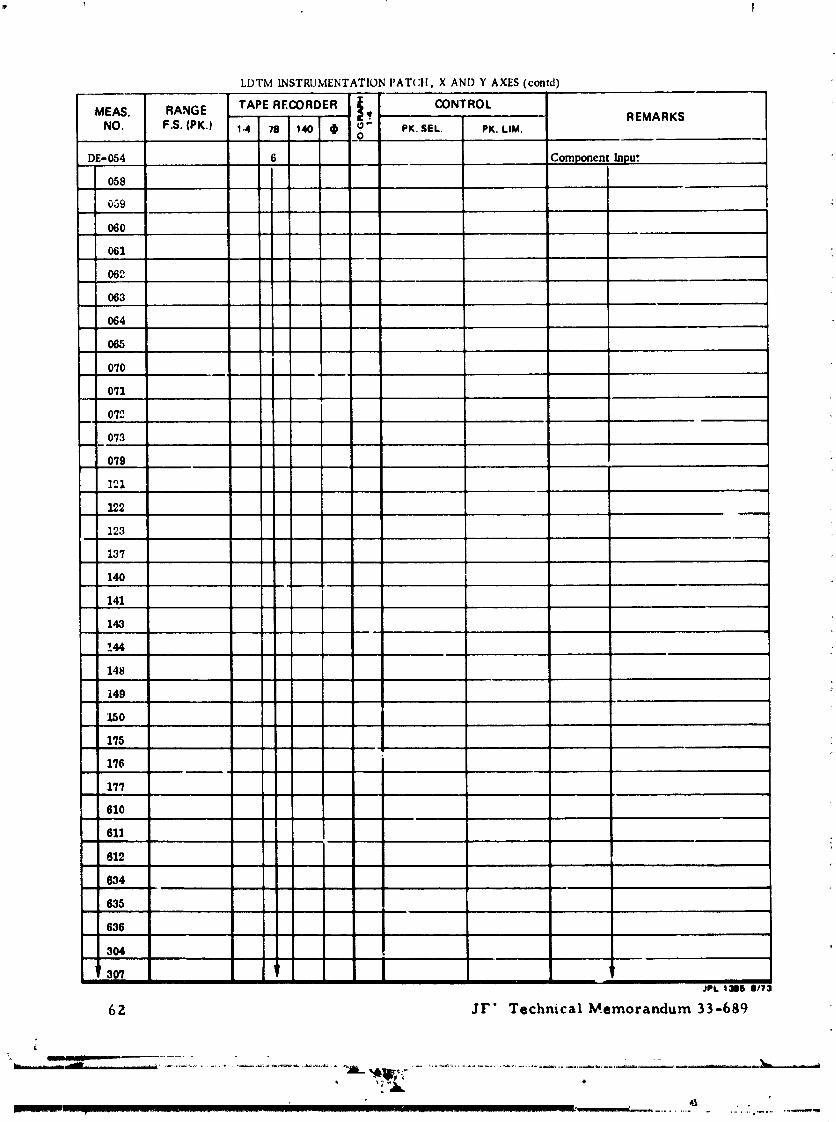
LDTM INSTRUMENTATION PATCIT, X AND Y AXES (contd)
TAPE RECORDER _ CONTROLMEAS. RANGE
q. REMARKSNO. F.S. (PK.) 14 78 140 _ o " PK. SEL. PK. LIM.O
DE-054 6 Component ]npu'. ,,
O58
059
O60
061
O62
O63
O64
O65
07O
O%
072
073
079
121
122
123
137
140
141
143
!44
148
i49
150
175
176
17'7
610
611
612
634
635
636
304
JPL 13M6 11/73
62 jr,, Technical Memorandum 33-689
] 975005956-068

LDTM INSTRUMENTATI()N PATCtl, X AND Y AXES (contd)
TAPE RECORDER _ CONTROLMEA& RANGE..... _ _ "'- REMARKS
NO. F.S. (PK.) 1.4 78 140 _) _ " PK.SEL. PK. ElM.,,, 0
"" -313 6 Component Input
314
316
317
318
322
323
324
325
326
321
086
087
342
106
_ 107 .jl
108 ,
m
JPL tie 8/73
3PL Technical Memorandum 33-689 63
1975003956-069
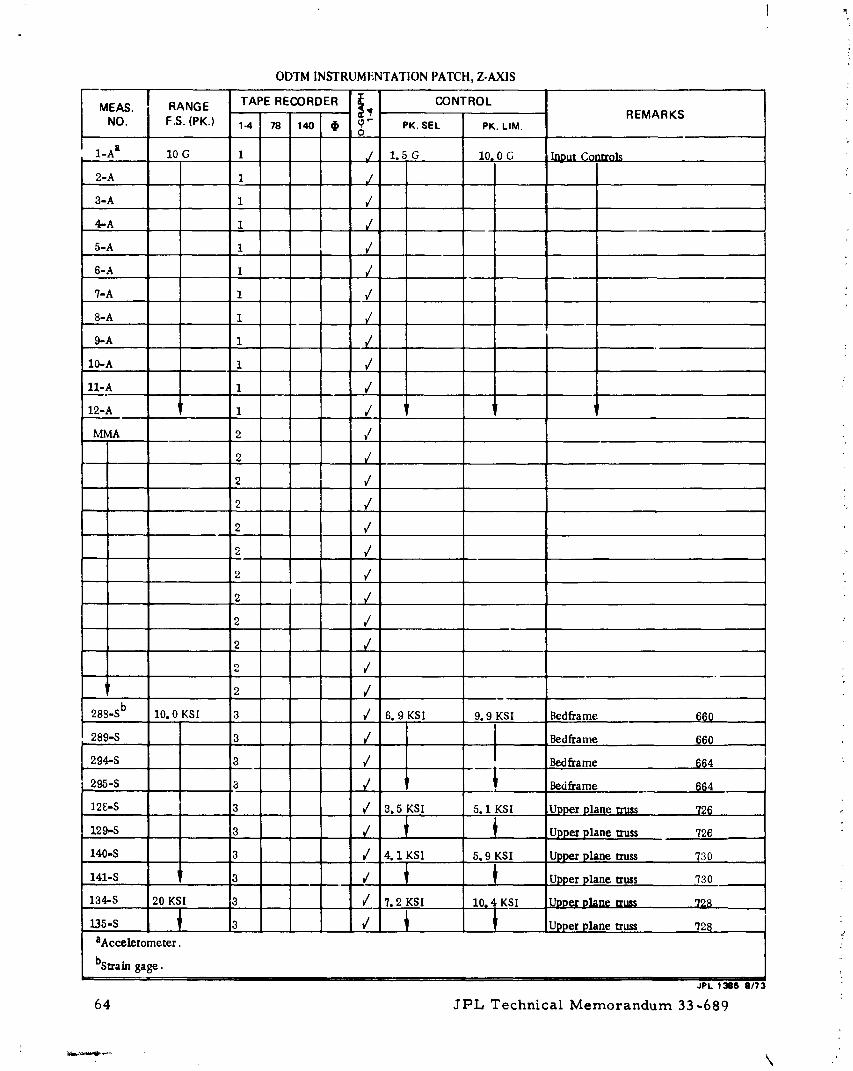
ODTM INSTRUMENTATION PATCH, Z-AXIS
MEAS. I RANGE TAPE RECORDER ! CONTROL
ff REMARKSNO. F.S. (PK.) 1.4 78 140 _ _" PK. SEE PK. LIM.o
1-A a 10 G 1 J 1.8 G I0, 0 G Inout Controls
2-, 1 ¢a-A 1 ¢
4-^ z /
s-A z ¢
6-,, _ ¢
7-a z e'
8-A 1 i/
9.-A I _/
zo-, z ¢
II-A 1 /
Z2-A Z /
MMA 2 /
2 ¢
2 ¢
2 /
2 /
2 ¢
.... 2 r/
2 ¢
2 /
2 ¢
28S-S b 10. 0 KSI 3 _/ 6. 9 KSI 9. 9 KSI Bedframe 660
289-S 3 / Bedftame 660
294-S 3 ,/ __dframe _4 :l
295-S 3 V/ t Bedf_ame _ (_64
12_-S 3 _/ 3.5 KSI 5. i KSI Upper plane truss 726I !
129-s 3 / _ I up.o=plane_u. 72_140-S 3 / 4. 1 KSI 5.9 KSI Upper plane truss '730
| !
141-S 3 _/ _ I Upper plane truss '730
134-S 20 KSI 3 v/ 7, 2 KSI , 10, 4 KSI ..Up_vetvlane Izuss '/28! !
aAccelerometer. _"
bstraia gage.
JPL 1315 8173
64 JPL Technical Memorandum 33-689
1975003956-070

I
i
ODTM INSTRUMENTATION PATCH, Z-AXiS (contd)
MEAS. RANGE TAPE RECORDER CONTROL REMARKSNO. F.S. (PK.) PK.SEE. PK. LIM. •
10-S 20 KSI q. 2 KSI 10. 3 KSI VLCA 753
12-S VLCA 753 :
137-S 10. 0 KSI 9. 9 KS' Upper plane truss 728 =
V-S/C-A "urnc
563-P Oxidizer tank j?ressure
564-P Fuel tank j?ressureShakerhead Housekeeping ;
Armature
PA input
Servo input
Master '
Slave I I
58-S 15 KSI-200 % 808
59-S 808
60-S 808 i
560-S 837
561-S 837
562-S 837
75-S 818
76-S 813
77-S 818
91-S 828[-
92-S 828
93-S 828
302-S 20 KSI _ 12.0 KSI Primarytrussbipod H P03I
304-S 12.0 KSI P03
310-S 12.0 KSI Pll
312-S 12.0 KSI Pll
318-S 12.0 KSI 1"37
320-S 12.0 KSI P37
346-S 15 KSI-200 pressurant tank P28
347-S P28
348-S P28
349- S P28
e Pressure transducer.
JPL 1305 8/7_
JPL Technical Memorandum 33-689 65
r %" :
1975003956-071

ODTM INSTRUMENTATION PATCH, Z-AXIS (contd
TAPE RECORDER _, CONTROLMEAS. RANGE REMARKSNO. F.S. (PK.) 1.4 78 140 (]D _" PK. SEL. PK.LIM.0
tlelium prcssurant tank342-5 15 KSI-200 */ support P82
343-5 v/ P82
344-5 ¢' P82
345-5 / P82
131-5 10 KSI ,/ 7.0 KSI upper plane truss 727
132-5 6 KSI-200 ,/ '/27
,/ 727133-5
1-S 20 KSI _/ 13.5 KSI VLCA 750
2-5 _/ 13.5 KSI 750
3-S et 13.5 KSI 750
7-S / 11. 0 KSI 752
8-S / 11.0 KSI 752
9-S 15 KSI-200 ,/ 752
533-S ,/ _¢an platformmagona_ support 182
534-5 ¢ z82535-S ¢t 182
536-5 ,/ 183
537-5 / 183
538-5 / 183
138-S ,/ Upper plane mass 728
139-S / 72S
145-S 20 KSI ,/ 14.0 KSI 732
146-5 15 KSI-200 ,/ 732
350-S 6 KSI-500 ,/ Helium pressuranttank supra rt P32
351-5 ¢' P02
352-5 _/ P49
353-5 ,/ Shear link P47Scan platform
539-5 15 KSI-200 / lateral brace 181
540-5 ¢' Scan platformlateral brace 18_
[ 541-5 */ Seaa platform_Imb_ll sunnort lqR
542-5 ¢' 176
543-5 _/ 177
544-s ¢ 177
13-A 10 G / Bus comer longeron
IS-A ¢ , .JPL 1385 8/73
66 ffPL Technical Memorandum 33-689
1975003956-072

ODTM INSTRUMENTATION PATCH, Z-AXIS (contd)
TAPE RECORDER _ CONTROLMEAS. RANGEq. REMARKS
NO. F.S. (PK.) 1-4 78 140 (l:J L__ PK.SEL. PK. ElM.0
16-A 10 G _/ Bus Comer longeron
17-A /
ZS-A /
z9-A /
20-A /
2Z-A /
22-A _/ Power regulator
23-A _/
24-A J
25-A ¢ DSS
26-A ;/ FDS
27-A ,/ Scan platfom} VIS
28-A ,/{29-A /
3O-A /
34-A /
35-A _/
36-A ¢
32-A _/ MAWD
83-A ;/
40-A _/
41-A _/
42-A _/
37-A _/ IRTM
38-A /
39-/ /
_-A / Solar panels Outriggers
44-A ¢'
¢5-A /
46-A /
47-A ¢
48-A ¢
49..A J
50-A ¢
51-A /JPL 1385S/73
JPL TechnicalMemorandum 33-689 67
1975003956-073
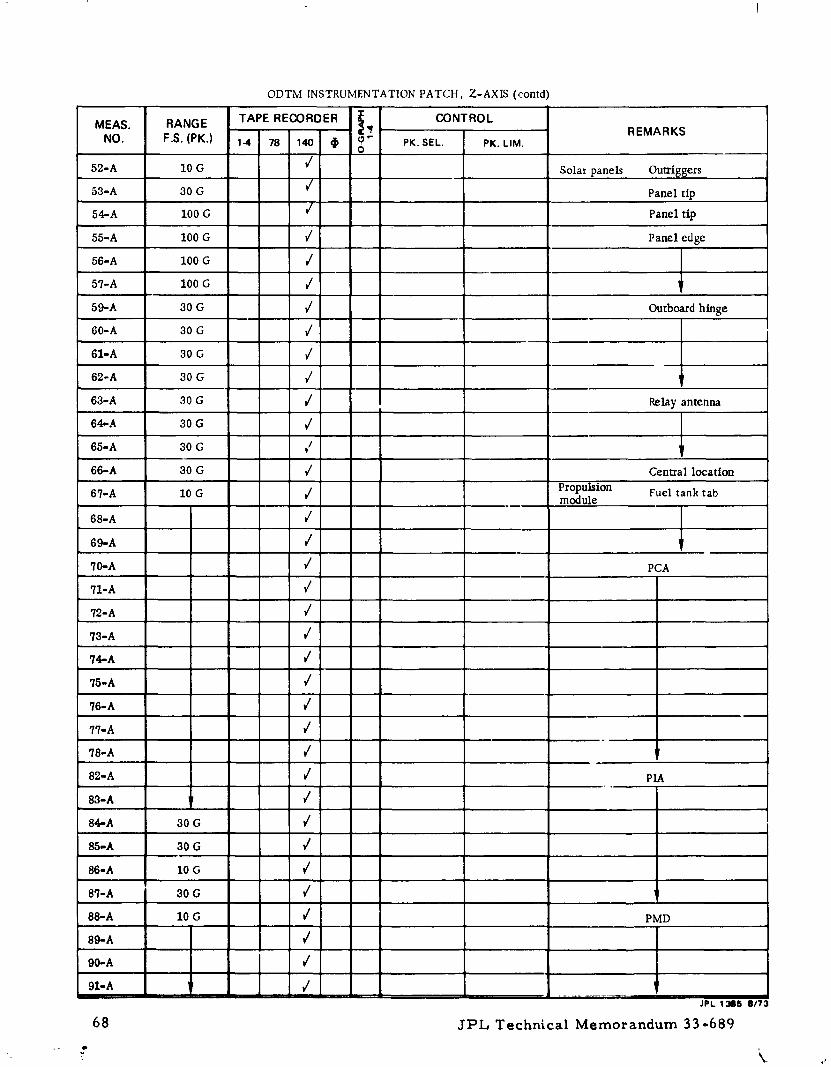
ODTM INSTRUMENTATION PATCH, Z-AXIS (contd)
TAPE RECORDER _ CONTROLMEAS. RANGEff REMARKS
NO. F.S. (PK.) 14 78 14o _ _ _ PK,SEL. PK. ElM.O
52-A 10 G _/ Solar panels Outriggers
53-A 30 G _/ Panel tip
54-A 100 G _/ Panel tip
55-A 100 G _/ Panel edge
56-A 100 G /
5%A I00 G _/
59-A 30 G _/ Outboard hinge
60-A 30 G _/
61-A 30 G /
62-A 30 G /
63-A 30 G / Relay antenna
64-A 30 G _/
65-A 30 G _/
66-A 30 G / Central location
Propulsion Fuel tank tab67=A I0 G / module
68-A /
69-A /
70-A / PCA_Z-A /
_2-A /
_Z-A /
74-A /
7S-A /
76-A J
7'I-A /
7S-A /
82-A / pm8Z-A /
84-A 30G /
8S-A zoG ¢
8S-A zo_ /
87-A 30G /
88-A 10 G v/ PMD
Sg-A /
90-A _/
9Z-A /JPL 1365 8/73
68 JPL Technical Memorandum 33-689
1975003956-074
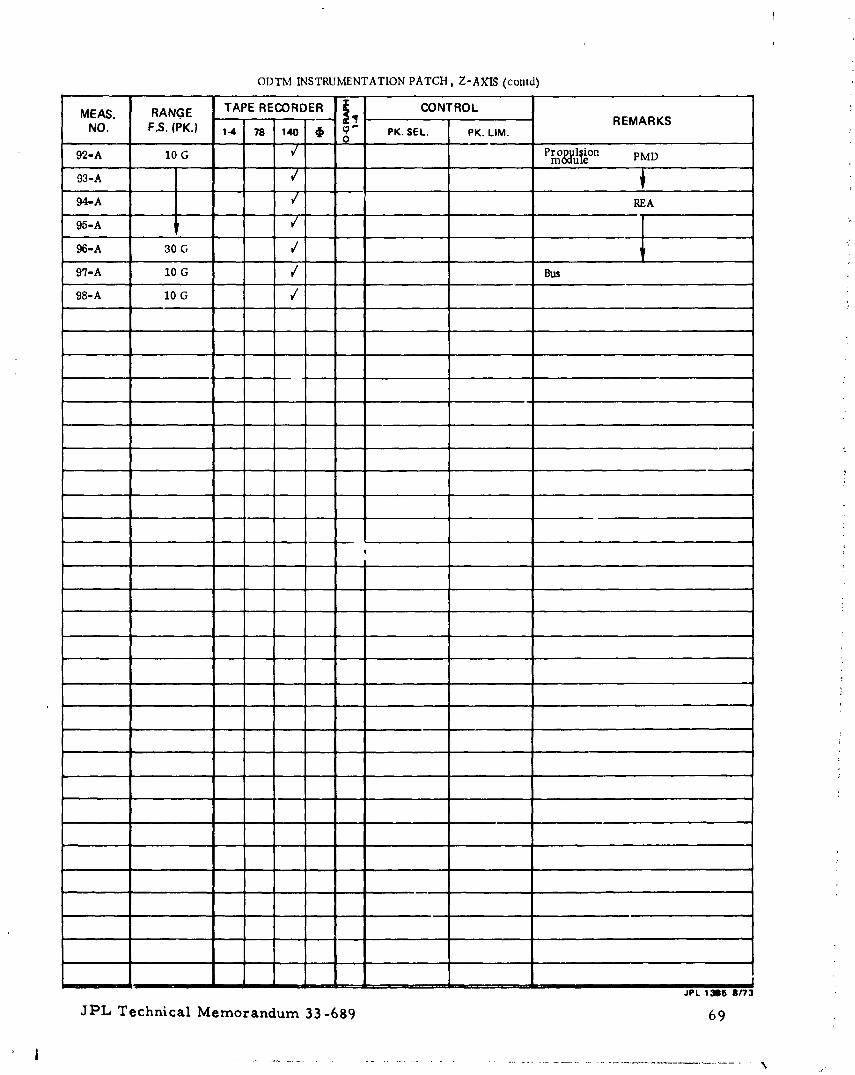
ODTM INSTRUMENTATION PATCH, Z-AXIS (contd)
TAPE RECORDER _ CONTROLMEAS. RANGE• ;_'_ REMARKS
NO. F.S. (PK.) 14 78 14o _ _ P PK.SEL. PK. ElM.0
92-A 10 G v/ Pr optfl_ion PMDmoclule
" 93-A J
94-A J REA
95-A _/
9_-A 30 G J _"
97-A 10 G _/ Bus
98-A 10 G .....w/
I
t
!
JPL13B6 8/73
JPL TechnicalMemorandum 33-689 69
I
1975003956-075

ODTM INSTRUMENTATION PATCH p X AND "V AXES
MEAS. RANGE TAPE _'_ECORDER _qlPCONTROL
REMARKSI gET
I L__ PK.SEE. PK. ElM.NO. F.S. (PK.) 1-4 78 140 _ 0=
I-A a 5.0 1 ,/ 1, 5 4, 0 Input control
2-A i /
a-A 1 ¢4-A 1 ¢
_-A 1 ¢
S-A 1 ¢
7-a 1 V'
s-a 1 ¢'
9-A z ¢'
10-A 1 ,/
l:-a Z ¢'B
:>A _ : ¢MMA 2 V/
2 ,,'
2 ¢
2 ¢'
e v'
2 ,/
2 v'
2 ¢
2 ,/
2 ¢'
2 ¢
2 ¢
288-S 10 KSI 3 v/ 6, 9 KSI 9. 9 KSI Bedframe 660
289-S 3 v/ Bedframe 660
290-S 3 v/ Bedframe 660
58-S 3 V/ 3, 7 KSI 5.2 KSI Main longeron 808
59-S 3 _/ Main longeron 808
60-S 3 v/ Main lonseron 808
75-S 3 _/ Main longeron 818
'/6-S 3 t/ Main longeron 818 o
77-S _ 3 ¢' Main longeron 818 ;
336-S 5 KSI 3 ! vI I. 6 KSI 2, 3 KSI Propulsion module bottom connectorP4,3
176-S 10 KSI 3 Vt 6. 7 KSI 9. 5 KSI Bus ring 484
_Aeeelerometer.Strain gage. _ ....
JPL 131B5 8173
70 JPL Technical Memorandum 33-689
,- k
1975003956-076

ODTM INSTRUMENTATION PATCH, X AND Y AXES (contd)
TAPE RECORDER _ CONTROLMEAS. RANGE'_ REMARKS
NO. F.S. (FK.) 1.4 78 140 _) _" PK.SEE. PK, ElM.O
3 V/ Armature current
193-S I0 KSI 4 6.7 KSI Busring 620
563-P 4 Oxidizer tank pressure
564-P 4 Fuel tank pressure
4 Armature current /,11
4 Armature current ¢i12
4 Armature current #13
4 Armature current h14
4 Power amplifier input
4 Servo input
4 Master
4 Slave
Main longeron .EL560-S 10 KSI / 5.2KSI S_ction A 837
561-S 6 KSI-500 t/ 837
562-S I0 KSI / 5.2 KSI 837
91-S I0 KSI / 5.2 KSI 828
92-S 6 KSI-500 / 828
93-S 10 KSI / 5.2 KSI 828
94-S 15 KSI-200 / Main longeronSectionq3 - -- 830
95-S 10 KSI / 8.0 KSI 830
96-S 15KSI-200 v/ 830
551-S 10 KSI / 8.0 KSI 830
301-S 24 KSI-200 / P03
302-S 20 KSI ¢t 12.0 KSI P03
303-S 24 KSI- 200 I/ P03
304-S 20 KSI / 12.0 KSI Primary truss blpod H P03 _
309-S 24 KSI-200 _/ Pll
310-S 20 KSI / 12.0 KSI PII
311-S 24 KSI-200 / PI1
312,-S 20 KSI _/ 12.0 KSI PI1
346-S 15 KSI-200 V' Helium pressurant P28__ tank sugport
347-S ¢' P28
348-s / p2s
349-S _/ P28
342-s I/ P82
I I i i * a
JPL 13B§ 8/73
3PL Technical Memorandum 33-689 71
1975003956-077

ODTM INSTRUMENTATION PATCH, X AND Y AXIS (contd)
TAPE RECORDER _ CONTROLMEAS. RANGE
'_ REMARKSNO. F.S. (PK.) 1-4 78 140 _ _ " PK.SEE. PK. ElM.O
344-s / P82
345-S v/ P82
131-S 6 KSI..500 ¢, Upper plane truss 727
132-S 6 KSI.500 _/ Upper Diane _'USS 327
,33-s / _ 727l-S 20 KSI / 13.5 KSI VCLA 750
2-S ,/ 13, 5 KSI 750
3-S / 13.5 KSI 750
7-S 15 KSI-200 Vt 752
s-s / 752
9-s / 7_2Scan platform
533-S ¢' diagonal support 182
534-S / 182 :
535-S / 182
536-S i/ 183
537-S 15 KSI-200 / 183
538-S / 183
= 138-S l '/ Upper plane truss 728
139-S [ / 728
145-S _ 732
146-S v/ 732
Heliu' pressurant350-S 6 KSI-200 ¢' tanl, support P32
351-S ,/ P02
352-S / P49
353-S / Shear link P47
, Scan platform 181539-S 15 KSI-200 _ lateral brace
540-S / _ 181Scan platform
541-S / _imbal support 176
542-S Vt 176
543-S ,/ 177
5,_.-s / 177
13-A 10 G / Bus Corner longeron
14-A /
15-A /
16-A ,/
--^ I /3PL t'm6 0/73
72 3PL Technical Memorandum 33-689
1975003956-078

ODTM tNSTRUMENTATION PATCH, X AND Y AXES contd)
TAPE RECORDER _ CONTROLMEAS. RANGE { ff REMARKSNO. F.S. (PK.) 1.4 78 140 _ L_" PK. SEE PK. ElM.
0 ....
18-A 10 G / ]
19-A ¢• L
20-A f
21-A _/ Bus Corner long.eron ..
22-A / Power regulator
2_-A ¢
2,l-A /4
25-A / Dss
26-A i ¢ _'DSI
27-A _/ Scan platform V'S
2S-A /I
29-A /
3O-A /
3_-A /
34-A /.% - ,w_
35-A ¢
36-A /
32-A ¢¢ MAWD
33-A _/
40-A /
41-A /
42-A I/
37-A / IRTM
38-A ¢
:_9.-A ¢
43-A ,/ Solar panels Outriggers
44-A /
4S-A ¢
4e-A ¢
47-A _/
4S-A ¢
49-A _/
5o-A ¢51-A _/
52-A ¢
53-A 30 G / . Panel tipJPL 116 an3
31=LTechnical Memorandum 33-689 73
1975003956-079

ODTM INSTRUMENTATION PATCH, X AND Y AXES (contd)
TAPE RECORDER _ CONTROLMEAS. RANGE'_ REMARKS
NO. F.S. (PK.) 1.4 78 1140] _ _" PK.SEL. PK. UM.1 I o
59-A 30 G v/ Outboard hinge
SO-A /
61-A ,/
62-A _/ Solar panels Outboard hinge
63-A _/ Relay antenna
64-A /
65-A ¢
66-A _/ Central location
67-A 10 G _/ Propulsionmodule Fuel tank tab
6S.A /
Gg-A /
?0-A / PCA
71-A '/
72-A /
73-A _/
74-A /
7_-A ¢
76-A /
77-A /
78-A ,/
82-A v/ PIA
83-A v/
84-A aoG /
" s_-A _ /v
86-A 10 G _/
87-A 30 G _/
SS-A Z0G ,/ PMD89.-A /
9o-A /
91-A V'
92-A /
9a-A /
96-A 30 G /
97-A 10 G _/ Busg I •
JPL 1rob |173
74 3PL Technical Memorandum 33-689
1975003956-080

ODTM INSTRUMENTATION PATCIt, X AND Y AX['S (colltd)
TAPE RECORDER _, CONTROLMr.-AS. RANGEff REMARKS
NO. F.S. (PK.) 1-4 78 140 _ _" PK.SEL. PK. LIM.O
98-A 10 G _ /
_/ Force No. 11,,,1
_/ Force No. 12
_/ Force No. 13
¢' Force No. 14
I
!
L IJpt t"llll_ 11173 ',"
JPL Technical Memorandum 33-689 75 _, :
t i, . k I
] 975003956-08 ]

ODTM/R1GIDLANDER INSTRUMENTATIONPATCH, Z-AXIS
TAPE RECORDER _ CONTROLMEAS. RANGE _ q, REMARKSNO. F.S. (PK.) 1.4 78 140 _) (Q" PK. SEL. PK. LIM.
0
I-A 1.0 g I _ 0.50 g 0.758 Input Control
2.A I _/
3-A ! _/
4-A I %/
._.A i _/6.t, 1 _/7-A 1 _/
S.A 1 _/
9-A 1 _/
10-A I _/
II.A l x/
12-A I _/ _!
ODTMPeak/ MainLongeron I | 8085&S 5.0 KSi 2 _/ 2.3 KSI 4.0 KSi Select __ Sec ^ -_. ---
59-S 2 _/ 808
60-S ? _/ 2.3 KS! 808
560-S 2 _/ 2.3 KS! 837
561-S 2 _/ 837
562-S 2 x/ 2.3 KS1 837
75-S 2 _/ 2.3 KSI _ 1S
76-S 2 x/ _ J8
77.S 2 _/ 2.3 KS! 818
91.S 2 _/ 2.3 KSI 828
92.S 2 _/ 828
93-S 2 _ 2.3 KSi 828
569.S 3 Run 107.2 _/ 2.5 KS! 3.5 KSi Outriuen 721
268-S 3 354 S _/ 2.3KS! 4.0KS! _/i_'_nn_r_ 809
277.s 3 355s ,/ 23Ks, 40Ks, 83s288-.g 10.0 KS! 3 %/ 3.5 KSI 5.2 KSI Bedframe 660
289-S 3 _/ 660
294.s 3 _/ 664]
_s.s _ _/ 664
336-S 5.0 KSI 3 _/ 1.5 KSI 2.5 XSI _Ol_r.' S/S¢e P43
337-$ 3 _/ P43! I
338.$ I 3 ii'43
JPL 1_m6 1/73
:;' 76 3PL Technical Memorandum 33-689
it
1975003956-082

ODTM/RIGIDLANDER INSTRUMENTATIONPATCH,Z-AXIS (contd)
TAPE RECORDER _ CONTROLMEAS. RANGEq_ REMARKS
NO, F.S. (PK.) 14 78 140 _ (.7" PK. SEL. PK. LIM.O
4 _/ Housekeeping
4 d
4 x/4 d
4 d
563-P 200 PSi 4 _/ Oxidizer Tank Pressure
564-P 200 PSI 4 _/ Fuel Tank PressureRn
566-S 5 KS! 4 3_.S!07-2 _/ 2.5 KS! 3.5 KS! Otttrigsers(Axia_) 712
567.5 4 %/ 706
568.5 4 _/ 708
57o-s 4 %/ 1 1 _lo55.5 6 KSI- 500 %/ Mai,.,Longeron Se¢. A 11 806
56.s d SObS_-S d SOb
lo4.5 %/ b3s
105-5 %/ 835
106.5 %/ 835
72-5 %/ 816
73-5 _/ 816
74-S " 816
88.5 '_ 826
89-5 _' 826
90.5 _/ 826
Q- _u
107-5 I._gSi- 200 %/ MainLonltemn Sec. B 839 .
10s.5 %/ 839
109-5 I %/ 839
11o.5 I %/ s39
9,_ %/ 83o
95-5 %/ 830
9_s %/ s3ossl.5 is_sl.2oo %/ 830
JPL 1386 11/73
JPI., Technical Memorandum 33-689 77
1975003956-083

ODTM/RIGID LANDER INSTRUMENTATION PANEL, Z-AXIS (contd)
MEAS. RANGE TAPE RECORDER CONTROL REMARKSNO. F.S. (PK.) PK.SEL. PK.LIM.
I I
297-S 20.0 KSI 12.0 KSI Primary Truss Blood 1-'-1 P04
298-S 20.0 KSI 12.0 KS1 1 P04
299-S P04
300-S P04
301-S P03
302-S P03
303-S P03
304-S P03
321-S 12.0 KSI P41
322-S 12.0 KSI P41
323-S P41
324-S P41
325-S P40
326-S P40
327-S P40
328-S P40
305-S P12
306-$ PI2
307-S PI2
308-S P12
309-S PI 1
310-S PI 1
311-S PI 1
312-S PI I
313-S P36
314-S P36
315-S P36
316-S P36
317-S P37
318-S P37
319-S P37
320-S P37
332-S 15 KSI- 200 Heavy Connector ["] PI8
Heavy Connector [_] PI815KS1- 200
J°t 1.'_R 8173
';8 ffPI., Techn_.cal Memorandum 33-689
1975003956-084

!
ODTM/RIGID LANDER INSTRUMENTATION PANEL, Z-AXIS (contd)
MEAS. RANGE TAPE RECORDER {.CONTROL
REMARKSNO. F.S.(PK.) 1-4 78 140 (_ O _ PK. SEL. PK. ElM.
tl;=
O
334-S 15 KSI- 200 _/ HeavyConnector [""] P!8
335-S X/ Heavy Connector ['-'] P18
291-S X/ Bedframe O 662
292-S x/ 662
293-S x/ 662
285-S x/ 658
286-S x/ 658
287-S x/ ] C) 658
329-s x/ Top Lateral Brace O P08
330-S _/ P08
331-S x/ C) P08
131-S 6 KS1- 500 x/ Upper Plane Truss O 727
132-S x/ 727
133-S x/ 727
128-S _/ 726
129-S x/ 726
130-S x/ 723
149.S x/ 742
150-S x/ 742
151-S X/ 742., ,,.
152-S _/ 746
153-S X] 746
154-S x/ 746
I 0-S x/ 730
141-S ",¢ 730
142-S .- X/ 1 O 730
19-S j' ' V-S/C-A O 686
20-S _/ 686
21-S _ ' 686
22-S 15 KSI- 200 _/ 687
23-S x/ 687
24"S t X/ . 68725.S _/ 688
26-S _/ 688
27-S x/ 688
,'[ ©JPL 138§ 8173
3PL Technical Memorandum 33-689 79
\
1975003956-085
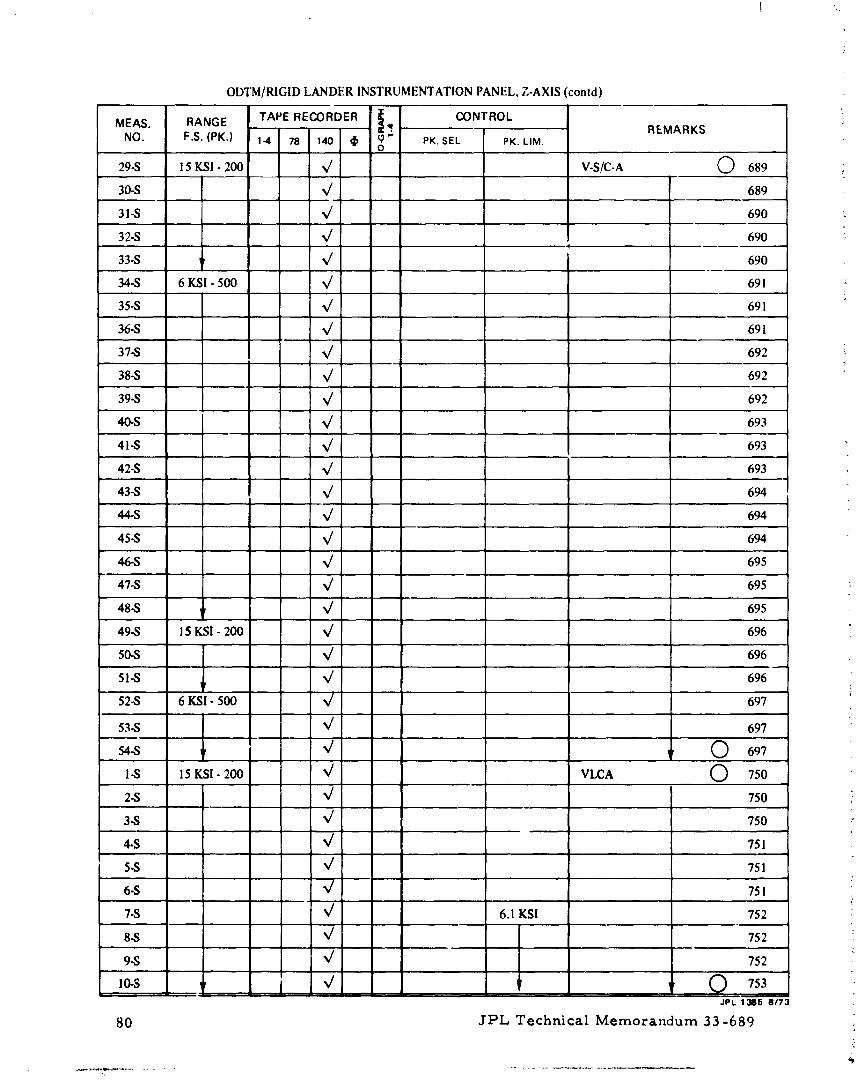
ODTM/RIGID LANDER INSTRUMENTATIONPANEL, Z-AXIS (contd)
TAPE RECORDER _ CONTROLMEAS. RANGE_, REMARKS
NO. F.S. (PK.) 1-4 78 140 _ _" PK. $EL PK. LIM.O
29-S 15 KSI. 200 x/ V-S/C-A O 689
30-S _/ 689
31-S x/ 690
32-S x/ 690
33-S x/ 690
34-S 6 KSI- 500 x/ 691
35-S %/ 691
36-S x/ 691
37-S x/ 692
38-S x/ 692
39-S x/ 692
40-S x/ 69.';
41-S x/ 693
42-S x/ 693 !
43-S x/ 694
44-S X/ 694
45-S x/ 694
46-S x/ 695r
47-S x/ 695
4S-S x/ 695
49-S !5 KSI- 200 x/ 696
50-S %/ 696
51-S X/ 696
52-S 6 KSI- 500 x/ 697
53-S x/ 697
54-S X/ O 697
I-S 15 KSI- 200 x/ VLCA O 750 :
2_S _/ 750 :
3.s x/ 750 :
4-S x/ 751
5-S V 751
6.s V 75l,, ..,
7.S x/ 6.1 KSI 752
S-S x/ 752
9-S _/ 752I
10-S 1 _/ O 753JPL 13e5 8/73
80 JPL Technical Memorandum 33-689 :
1975003956-086

ODTM/RIG1D LANDER INSTRUMENTATION PANEL, Z-AXIS (contd)
TAPE RECORDER _ CONTROLMEAS. RANGE REMARKSNO. F.S.(PK.) 1.4 78 140 _ _" PK. SEE. PK. LIM.
O
I l-S 15 KSI- 200 %/ 6.1 KSI VLCA O 753
12-s x/ 61 KSl 753
13-S %/ 754
14-S x/ 754
15-S %/ 754
163 x/ 755
17-S x/ 755
18.S %/ I O 755
/
136-S 6 KSI- 500 X/ Upper Plane Truss IT 728 "
]
137-S x/ 728
138-S x/ 728
139-S x/ 728
145.S x/ 732
146-S x/ 732
147-S %/ 732 ,_
148-S %/ Run 107-2 iT 732
354.s 20.0 KSI _/ 10.0 KSI 18.0 KSI Siamese Tab /_ B33
355-S %/ B34
356-S _/ B35
357-S 48 KSI- 100 _/ B33A
358-S %/ B34A
359-S x/ ,_ B35A
134-S 6 KSI- 500 %/ Upper Plane Truss (Axial) 728
135-S _/ 728
143-S x/ 732
144-S _x / 1 (Axial) 732
552-S 2000 lb x/ 2000 lb Separation Bolts Upper Plane
553-S X/ "
554-s V{
555.s x/JPL 13aft 8173
JPL Technical Memorandum 33-689 81
1975003956-087

ODTM/RIGID LANDER INSTRUMENTATION PANEL, Z-AXIS (contd)
TAPE RECORDER _ CONTRGLMEAS. RANGE REMARKS
O_ PK SEE. ] PK. LIM.NO. F.S. (PK.) !-4 78 140 _ b
556-S 2000 Ib X/ 2000 Ib Separation Bolts Lower Plane
557-S x/
558-s ,/559-S x/
70.A 2.5 g x/ Accelerometers PCA
71-A 1.5 g x/
72-A 3.0 g x/
76-A 2.0 g x/
77-A 1.3 g x/
78-A 2.8 g x/
73-A 2.5 g x/
74-A 1.5 g X/
75-A 3.0g X/
79-A 2.5 g X/
80-A 1.5 g x/
81-A 3.0g X/
99-A 2.5 g X/
100-A 1.5 g x/
101-A 3.0g V85-A 2.6 g X/ VIA
86-A 3.1 g X/
87-A 3.1 g x/
88-A 1.5 g x/ PMD
89-A 2.0 g x/
90-A 3.0 g %/
91-6 1.5 g %/
92.A 2.0 g _/
93-A 3.0 g X/
67-6 1.2 g X/ Fuel Tank Tab
68-6 1.9 g _/
69-A 2.8 g X/
27-A 5.7 g x/ Scan Platform
32-A 8.1 g X/
33-A 5.8 g x/
37-A 5.4 g x/
38-A 6.8 g x/ 1JPL 1385 8/73
82 .rPL Technical Memorandum 33-689
1975003956-088

ODTM/RIGID LANDER INSTRUMENTATIONPANEL, Z-AXIS (contd)
TAPE RECORDER _ CONTROLMEAS. RANGE q, REMARKSNO. F.S. (PK.) 1.4 78 140 _ _, " PK. SEL. PK, LIM.
O
3C3-A 8.5 g x/ Acceleromelers Scan Platform
43-A 1.7 g x/ Outrigger
44-A 3.3 g x/ ]
i
45-A 4.8 g X/1
46-A 1.7 g X/
47-A 5.5 g /
48-A 5.7 g X/
49,A 2.7 g X/I"
50-A 13.5 g X/
5I-A 3.0 g X/
52-A 14.0 g x/
53-A 2.9 g X/ Solar Panels
54-A 5.2 g x/ Solar Panel_
94-A 2.4 g X/ PEA
95-A 3.0g X/
96-A 2.7 g X/
28-A 9.6 g _/ Scan Piatform
29-A 5.6 g _/ Scan Platform
JPL 1385 8/73
EPL Technical Memorandun 33-689 83NASA-JPL-ComI., L. A, Calif.
1975003956-089