Embed Size (px)
Citation preview
UNIVERSIDADE FEDERAL DO RIO GRANDE DO SULINSTITUTO DE INFORMÁTICA
PROGRAMA DE PÓS-GRADUAÇÃO EM COMPUTAÇÃO
VINÍCIUS FRITZEN MACHADO
Visual Soccer Match Analysis
Dissertação apresentada como requisito parcialpara a obtenção do grau de Mestre em Ciência daComputação
Orientador: Prof. Dr. João Luiz Dihl Comba
Porto Alegre2016
CIP — CATALOGAÇÃO NA PUBLICAÇÃO
Machado, Vinícius Fritzen
Visual Soccer Match Analysis / Vinícius Fritzen Machado. –Porto Alegre: PPGC da UFRGS, 2016.
65 f.: il.
Dissertação (mestrado) – Universidade Federal do Rio Grandedo Sul. Programa de Pós-Graduação em Computação, Porto Ale-gre, BR–RS, 2016. Orientador: João Luiz Dihl Comba.
1. Visual Knowledge Representation. 2. Visualization Systemand Toolkit Design. 3. Flow Visualization. I. Comba, João LuizDihl. II. Título.
UNIVERSIDADE FEDERAL DO RIO GRANDE DO SULReitor: Prof. Carlos Alexandre NettoVice-Reitor: Prof. Rui Vicente OppermannPró-Reitor de Pós-Graduação: Prof. Vladimir Pinheiro do NascimentoDiretor do Instituto de Informática: Prof. Luis da Cunha LambCoordenador do PPGC: Prof. Luigi CarroBibliotecária-chefe do Instituto de Informática: Beatriz Regina Bastos Haro
ACKNOWLEDGEMENTS
I would first like to thank my thesis advisor PhD João Luiz Dihl Comba. The
door to Prof. Comba office was always open whenever I ran into a trouble spot or had a
question about my research or writing. He consistently allowed this thesis to be my own
work, but steered me in the right the direction whenever he thought I needed it.
I would also like to thank all who were involved in the validation survey for this
research project, which includes teammates, PhD Filip Sadlo, MSc Roger Almeida and
MSc Gerson Groth. Without their passionate participation and input, the validation survey
could not have been successfully conducted.
Finally, I must express my very profound gratitude to my uncle, PhD Birajara
Soares Machado, and to my girlfriend Tatiane dos Santos Costa for providing me with
unfailing support and continuous encouragement throughout my years of study and th-
rough the process of researching and writing this thesis. This accomplishment would not
have been possible without them. Thank you.
ABSTRACT
Soccer is a fascinating sport that captures the attention of millions of people in the world.
Professional soccer teams, as well as the broadcasting media, have a deep interest in
the analysis of soccer matches. Statistical summaries are the most-used approach to de-
scribe a soccer match. However, they often fail to capture the evolution of the game
and changes of strategies that happen. In this work, we present the Visual Soccer Match
Analysis (VSMA) system, a tool for understanding the different aspects associated with
the evolution of a soccer match. Our tool receives as input the coordinates of each player
throughout the match and related events. We present a visual design that allows to quickly
identify relevant patterns in the match. Our approach was developed in conjunction with
colleagues from the physical education field with expertise in soccer analysis. We vali-
dated the system utility using several matches together with expert evaluations.
Keywords: Visual Knowledge Representation. Visualization System and Toolkit Design.
Flow Visualization.
RESUMO
Futebol é um esporte fascinante que capta a atenção de milhões de pessoas no mundo.
Equipes de futebol profissionais, bem como os meios de comunicação, têm um profundo
interesse na análise de partidas de futebol. Análise estatística é a abordagem mais usada
para descrever um jogo de futebol, no entanto, muitas vezes eles não conseguem captar a
evolução do jogo e as mudanças de estratégias que aconteceram. Neste trabalho, apresen-
tamos Visual Soccer Match Analysis (VSMA), uma ferramenta para a compreensão dos
diferentes aspectos relacionados com a evolução de um jogo de futebol. A nossa ferra-
menta recebe como entrada as coordenadas de cada jogador durante o jogo, bem como os
eventos associados. Apresentamos um design visual que permite identificar rapidamente
padrões relevantes em jogo. A abordagem foi desenvolvida em conjunto com colegas da
área da educação física com experiência em análise de futebol. Validamos a utilidade
da nossa abordagem utilizando dados de várias partidas, juntamente com avaliações de
especialistas..
Palavras-chave: Visual Knowledge Representation. Visualization System and Toolkit
Design. Flow Visualization.
LISTA DE FIGURAS
Figura 2.1 Football Drawing ...........................................................................................14Figura 2.2 Match Insight system - SAP .........................................................................15Figura 2.3 Oliveira et. al. developed visualization .........................................................16Figura 2.4 System visualization of cars movement in a city...........................................16Figura 2.5 Entropy Maps.................................................................................................17Figura 2.6 Faceted Views System from INRIA ..............................................................18Figura 2.7 Feature Driven System overview...................................................................19
Figura 3.1 PAH construction...........................................................................................21Figura 3.2 Examples of 1D and 2D color mapping ........................................................22Figura 3.3 PAH based on positions and speed ................................................................22Figura 3.4 PAH ordering .................................................................................................24Figura 3.5 PAH time filter approach ...............................................................................24Figura 3.6 Zoom mode....................................................................................................25Figura 3.7 Draw mode examples ....................................................................................26Figura 3.8 Tactical schemes automatically detected. .....................................................27Figura 3.9 Tactical scheme heatmap and scheme histograms.........................................28Figura 3.10 Multiple heatmaps. ......................................................................................29Figura 3.11 Heatmaps comparison for two players ........................................................30Figura 3.12 Pahthline Trajectories construction .............................................................31Figura 3.13 Different approaches to Pathline Trajectories..............................................32Figura 3.14 Pathline Trajectories with different parameters ...........................................33Figura 3.15 Pathline 3D approach...................................................................................33Figura 3.16 VSMA Timeline .........................................................................................34Figura 3.17 Pass adjacency matrix .................................................................................35Figura 3.18 Graph of passes ...........................................................................................35Figura 3.19 Voronoi diagram .........................................................................................37
Figura 4.1 Lucey et al. approach to ball estimation .......................................................39Figura 4.2 Complete VSMA Tool ..................................................................................41Figura 4.3 PAH of four complete games of team A playing at home. ...........................42Figura 4.4 PAH evaluation of players .............................................................................43Figura 4.5 Histograms of team behaviors .......................................................................44Figura 4.6 TSH example .................................................................................................45Figura 4.7 Multiple occupancy maps example ...............................................................45Figura 4.8 Diferent players selected in multiple occupancy maps..................................46Figura 4.9 Voronoi diagram for six moves......................................................................47Figura 4.10 Comparison between heatmaps and pathline trajectories approach ............48Figura 4.11 Pathline analysis for 10 players ...................................................................49Figura 4.12 Pathline 3d in different views ......................................................................50

LISTA DE ABREVIATURAS E SIGLAS
FIFA Federation Internationale de Football Association
PAH Player Attribute Heatmap
TSH Tactical Scheme Heatmap
VSMA Visual Soccer Match Analysis
SDLC Software Development Life Cycle
SUMÁRIO
1 INTRODUCTION.........................................................................................................91.1 Research Questions and Hypotheses .....................................................................101.2 Document organization ..........................................................................................112 RELATED WORK .....................................................................................................122.1 Historical Evolution of Soccer ...............................................................................122.2 Group and Soccer Visualization ............................................................................132.3 Trajectory Visualization .........................................................................................153 VISUAL SOCCER MATCH ANALYSIS .................................................................203.1 Player Attribute Heatmap......................................................................................203.2 Tactical Scheme Detection and Heatmap..............................................................263.3 Multiple Occupancy Heatmaps .............................................................................283.4 Pathline Trajectories...............................................................................................293.5 General techniques..................................................................................................344 EXPERIMENTS AND RESULTS.............................................................................384.1 Dataset......................................................................................................................384.2 Results ......................................................................................................................394.3 Expertise feedback..................................................................................................505 CONCLUSION AND FUTURE WORK ..................................................................54REFERÊNCIAS.............................................................................................................55APÊNDICE — RESUMO DA DISSERTAÇÃO .........................................................59.1 Introdução .................................................................................................................59.2 Visual soccer match analysis ....................................................................................60.2.1 Player Attribute Heatmap ........................................................................................61.2.2 Tactical Scheme Detection and Heatmap.................................................................62.2.3 Multiple Occupancy Heatmaps................................................................................63.2.4 Pathline Trajectories ................................................................................................64.3 Conclusion .................................................................................................................65
9
1 INTRODUCTION
For a long time, soccer and team sports have been practiced and seen as pure
art. Billions of dollars are spent to construct winning teams and increase their fan base.
Recent approaches in scientific analysis showed potential to assist coaches in their de-
cisions, before and during a soccer match(SAP, a), to improve their team performance
and take advantage of weaknesses of the opponent team. Match analysis is costly to te-
ams in different sports, such as basketball (GOLDSBERRY, 2012) and soccer (PERIN;
VUILLEMOT; FEKETE, 2013).
The analysis of groups is used to understand how they work and behave in various
situations (MISUE, 2013). This can be specially useful in the case of soccer, due to the
widespread capture of data. Most soccer analysis tools focus on the statistical analysis
of the game (LAGO-PEÑAS et al., 2010; CASTELLANO; CASAMICHANA; LAGO,
2012) while in another aspect (SILVA et al., 2013a; SILVA et al., 2013b) propose com-
plex models to evaluate players perfomance and game results. The visual analysis of
soccer data often relies on simple graphs and heatmaps (LUCY et al., 2013; GADE; MO-
ESLUND, 2013). Few tools today analyze the positions of players and events during a
soccer match (JANETZKO et al., 2014).
Searching and working with specialists, we realized that the technical team spent
a lot of time understanding how the match evolves. They watch the entire game many
times, looking for situations and analyzing different players and their behavior. There-
fore, we see a high potential for developing novel visualization techniques, tailored to
the properties of soccer and ease their analysis. In this work, we want to establish new
approaches to evaluating and analyzing the groups dynamic. These techniques are visual
representations of the data, enabling the extraction of non obvious information, e.g. beha-
vior of the tactical scheme at the time. Also, we will improve the necessary time spent by
specialists during the analysis of matches and enable they to focus on important events.
In summary, our contributions are:
• A novel heatmap-based technique to evaluate the evolution of soccer matches as a
function of the speed and position of players;
• An automatic way to detect tactical schemes along with a heatmap approach to
visualize the changes in tactical schemes during a match;
• A small multiple approach that allows finer comparison of positional heatmaps
• An adaptation of a technique known as pathline glyphs to allow the analysis of
10
soccer player trajectories;
• Validation of our approach with several examples and evaluation by soccer experts.
To develop a more complete tool, we added some well-known visualization tech-
niques. We will discuss and display each of them in next chapter, it includes:
• A miniature field for instant view;
• A Voronoi approach to establish new metrics about the quality os passes, dominance
of field and movement of players;
• Two graph-based views for passes evaluation;
• A 3D chart, extending the pathline glyphs technique to analysis events in a given
time interval.
1.1 Research Questions and Hypotheses
Soccer is a complex game, with many intricate analysis demands. To drive our
development, we elaborated, in cooperation with the soccer experts, a set of requirements
to be supported by our analysis tool. One difficulty raised by the experts was the fact
that most analysis tools offered only a statistical summary of a match, with no or little
insight over how the game evolved over time. Finding appropriate approaches to enable
such analysis was the main motivation in the development of our tool, and involved an ap-
proach for a global space-time representation of a match, that allows to grasp quickly the
main events through time, and provides context and guidance for in-depth visualization
components.
The following list includes the outlined requirements:
• R1: a compact view of the evolution of the behavior of both teams, to reveal global
patterns in the match;
• R2: individual and team evolution for different directions, such as vertical move-
ments (attack–defense) and horizontal movements (left–center–right), or at specific
parts of the field (middle-field, box, etc.);
• R3: automatic identification of the tactic formation at a given instant of time, and
visualization of the evolution of the tactical formation;
• R4: visualization of the trajectories of players in given parts of the match and regi-
ons of the field;
11
• R5: comparative analysis of player’s trajectories to identify marking patterns;
• R6: ability to filter the data to narrow the analysis before important events, such as
goals, counter-attacks, etc.
Using these requirements as guidelines, we designed a tool to support soccer experts in
the analysis of individual matches in all its aspects, but with emphasis on the visualization
of the evolution of the match.
1.2 Document organization
This thesis is organized as follows. The second chapter organize related works
selected during the development, those works clarify our ideas and give us references in
soccer analysis. In the third chapter, we introduce the Visual Soccer Match Analysis, a
tool developed together with specialists to assist them during soccer analysis. In chapter
four there is a full commentary about experiments, results and also, feedback from an
expert is given. In the last section, we conclude this work, summarizing the results and
presenting future ideas.
12
2 RELATED WORK
In this chapter, we describe works related to our project divided into sections ac-
cording to each theme. Initially, we give a historical analysis of soccer matches. After
we separate the visualization techniques concentrated on groups and sports, in particular,
soccer.
2.1 Historical Evolution of Soccer
A good source for historical facts about soccer is the Federation Internationale de
Football Association (FIFA) website(FIFA, ), the entity that controls and organize soccer
leagues and championships in the world. We give below a summary of interesting events
described there.
The first historical events involving football are dated before Christ (MASSA-
RANI; ABRUCIO, ; CASTRO, ), but soccer became popular much later. The rules of
soccer changed gradually throughout the years when new elements were added. For exam-
ple, in 1869 goal-kicks and 1872 corner-kicks were added to the game. Until 1878, there
are no records of referees using whistles. The penalty, originally called ‘the kick of de-
ath’was introduced only in 1891. At that time, there was an agreement that the gentleman
would never commit a fault. With the increasing competitiveness emerged a collection of
rules known as Laws of the Game in 1891.
In 1904, FIFA was created to organize soccer matches and leagues in the world.
Meanwhile, soccer style of play evolved the time. In the early 19th century, soccer was
slow and unmarked, with lots of goals in matches (ANDERSON; SALLY, 2013). At that
time it was common to see tactical schemes with two defenders, three midfielders, and five
attackers, also know as 2-3-5. This formation was predominant until 1938 approximately.
The physical part of the match evolved drastically and by the 80’s the number of goals
decreased due to the improvement in tactical and conservative schemes. One reason for
this was the fact that the draw and win corresponded to one and two points respectively.
In 1994, FIFA to three points the value of a win, while a draw still valued one point. As a
result, these changes created a more competitive game with players focused in scoring and
creating opportunities to score. Other changes occurred in 1994, such as the prohibition
to pass the ball back to goalkeepers using the feet, in 1998, the fierce tackle from behind
became a red-card offense.
13
The improvement in performance of the players, growing investment and change
of rules, soccer became widespread, drawing the attention of billions of people in the
world. Since the match became more organized, teams started to use technology to sup-
port their decisions on the pitch, and soccer coaches today receive the help of a big sup-
porting staff. Teams started to record training and matches in different angles of view,
getting information such as position, speed, and events. Also, following the advances
in medicine, the technical support knows everything about each player and how to im-
prove their abilities. Teams around the world start to use such information to play in a
more competitive way, considering all aspects of the match: player performance, team
organization, and others.
2.2 Group and Soccer Visualization
The visual analysis of group must consider all members, but also provide an in-
dividual collection of information. Misue (MISUE, 2013) presented an approach where
skills data of individual players, as well as team data, can be analyzed by several represen-
tations, enabling the identification of each feature. For the representation of relationships,
the matrices are a prominent choice. Henry and Fekete (HENRY; FEKETE, 2007) pre-
sent a matrix-based visualization technique to analyze social networks, while Dinkla et
al. (DINKLA; HENRY-RICHE; WESTENBERG, 2015) represent groups with a dual
adjacency matrix.
Page and Moere (PAGE; MOERE, 2006) provide a review of applications related
to visualizations in a sports context. They also propose a model to classify techniques
for sports visualization. Different works have been proposed over the years, MatchPad
(LEGG et al., 2012) presents a visual timeline with glyphs to analyze the performance
of players in a rugby match, and Chung et al. (CHUNG et al., 2015) proposed a sys-
tem to organize and visualize results of data in the sports context, allowing interactive
exploration.
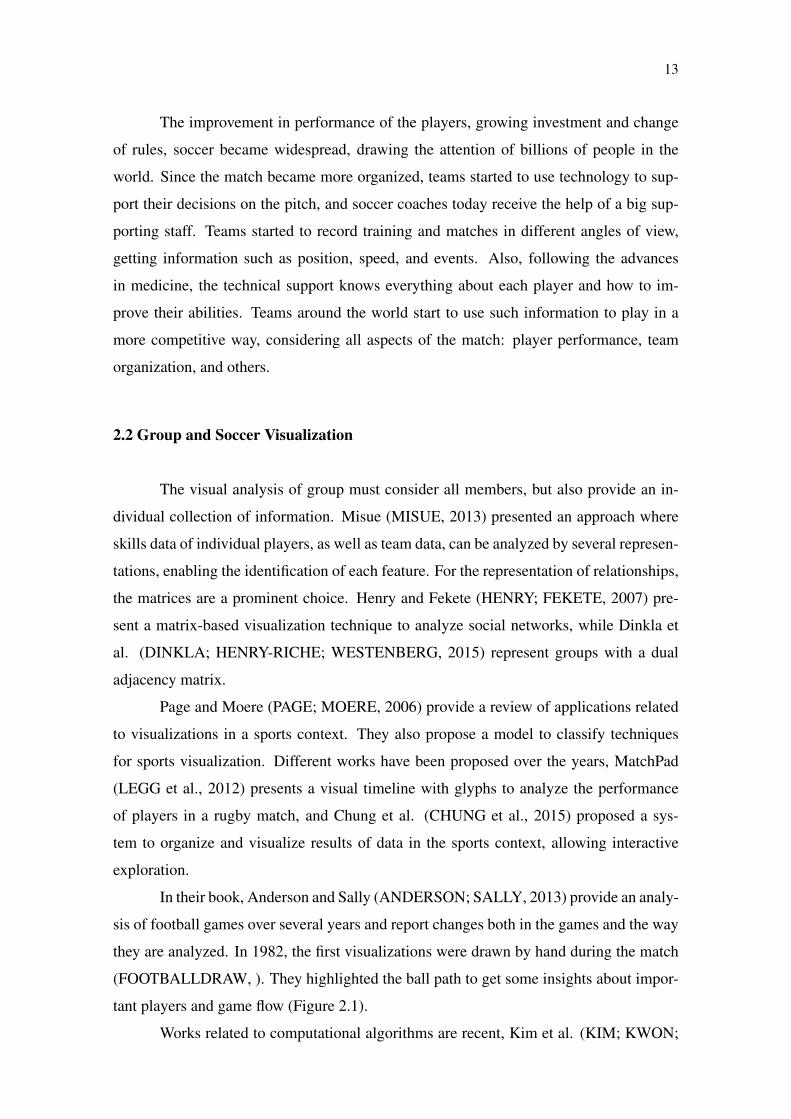
In their book, Anderson and Sally (ANDERSON; SALLY, 2013) provide an analy-
sis of football games over several years and report changes both in the games and the way
they are analyzed. In 1982, the first visualizations were drawn by hand during the match
(FOOTBALLDRAW, ). They highlighted the ball path to get some insights about impor-
tant players and game flow (Figure 2.1).
Works related to computational algorithms are recent, Kim et al. (KIM; KWON;
14
Figura 2.1: Football Drawing
Ball movement drawing during a match. Portugal-Greece, Final Match. Series EURO2004 in Portugal, Nr. 31 from 34 pencil drawings, 44x66 cm Source: http://www.susken-rosenthal.de/fussballbilder
LI, 2011) proposed a model to specify how the line of defenders is organized. This sup-
ports the understanding of their strategy, as well as the changes over time. Fonseca et al.
(FONSECA et al., 2012) used the Voronoi diagram (AURENHAMMER, 1991) to esta-
blish metrics about the occupied area in defensive and offensive moments. In this context,
analyzing the geometry of match configurations, Duarte et al. (DUARTE et al., 2013) use
geometric statistics, like the convex hull and circumference to analyze football teams.
Statistical measures are used by Peñas et al. (LAGO-PEÑAS et al., 2010) to de-
monstrate in which aspects of the game there are differences between the winning and the
losing team. Also, statistics was used by Salvo et al. (SALVO et al., 2007) to provide a
detailed description of the demands placed on elite soccer players, according to their po-
sitional role at different work intensities, allowing for a comparison of the performance of
a given player in different matches. Nowadays, companies such as OptaPro (OPTAPRO,
), Prozone (PROZONE, ) and STATS (STATS, ) start to sell detailed data about matches,
enabling and requiring dedicated and advanced visualization techniques. Nevertheless,
most of these data are still purely statistic, and there are only a few visualization tools
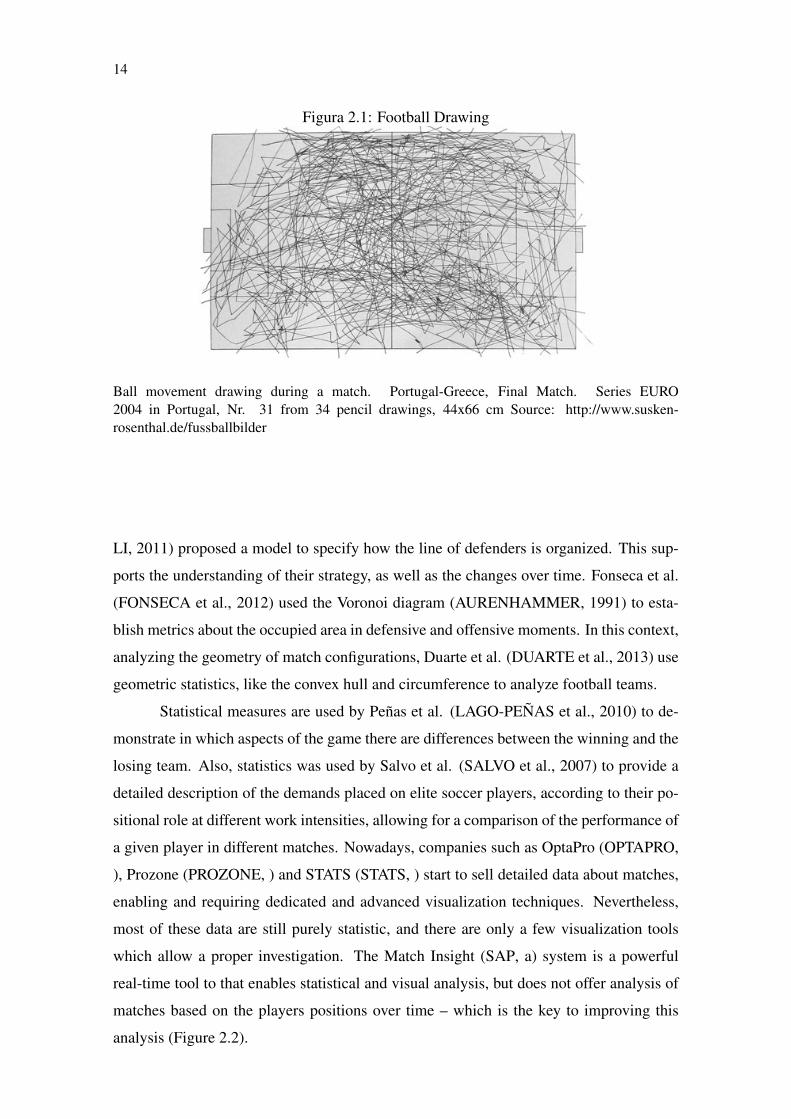
which allow a proper investigation. The Match Insight (SAP, a) system is a powerful
real-time tool to that enables statistical and visual analysis, but does not offer analysis of
matches based on the players positions over time – which is the key to improving this
analysis (Figure 2.2).
15
Figura 2.2: Match Insight system - SAP
SAP System overview. Source: (SAP, b)
2.3 Trajectory Visualization
An important part of soccer visualization is the evaluation and exploration of dyna-
mic trajectories of players on the pitch. Therefore, we investigate which are the adequate
references in this area, extending and applying in a soccer context. Also, recent works
using spatiotemporal data related to the position of the players will be cited and discussed.
In according to Andrienko et al. (ANDRIENKO et al., 2013), an important key
to conduct path analysis is to find semantically-correct representations of such dynamic
trajectories. In this work, they proposed a methodology and visualization for analyzing
movement patterns of individual and groups, applying space transformation to found the
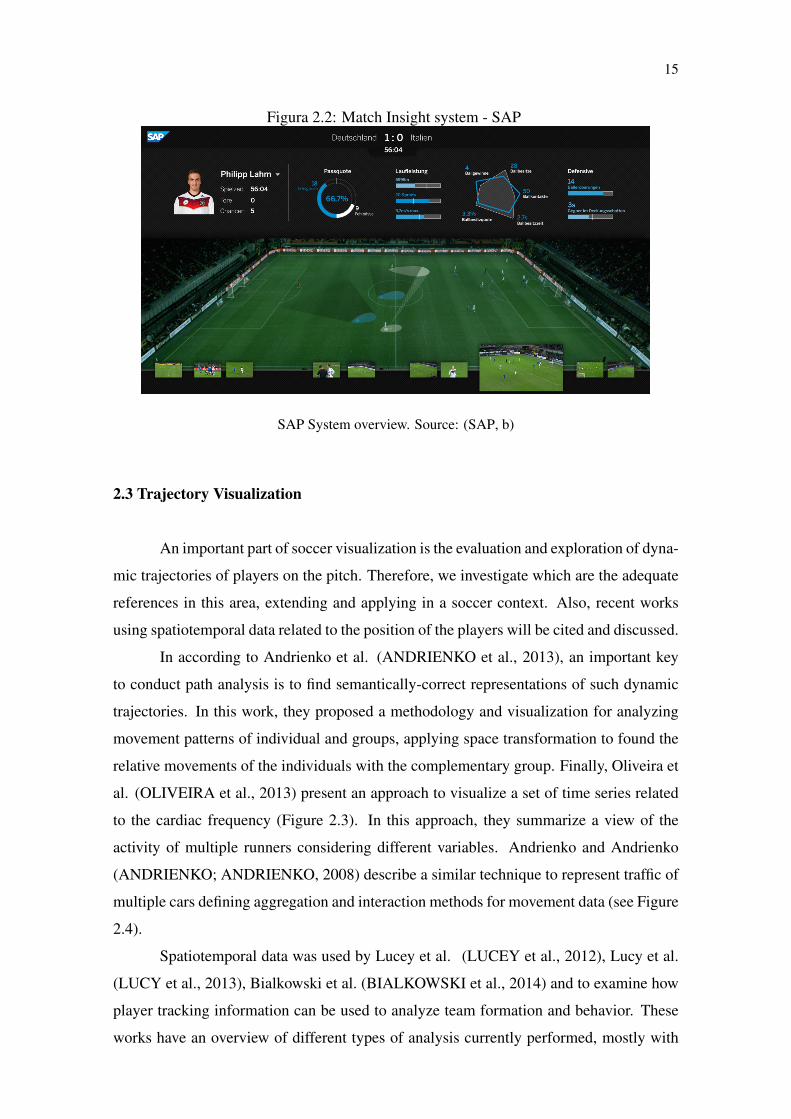
relative movements of the individuals with the complementary group. Finally, Oliveira et
al. (OLIVEIRA et al., 2013) present an approach to visualize a set of time series related
to the cardiac frequency (Figure 2.3). In this approach, they summarize a view of the
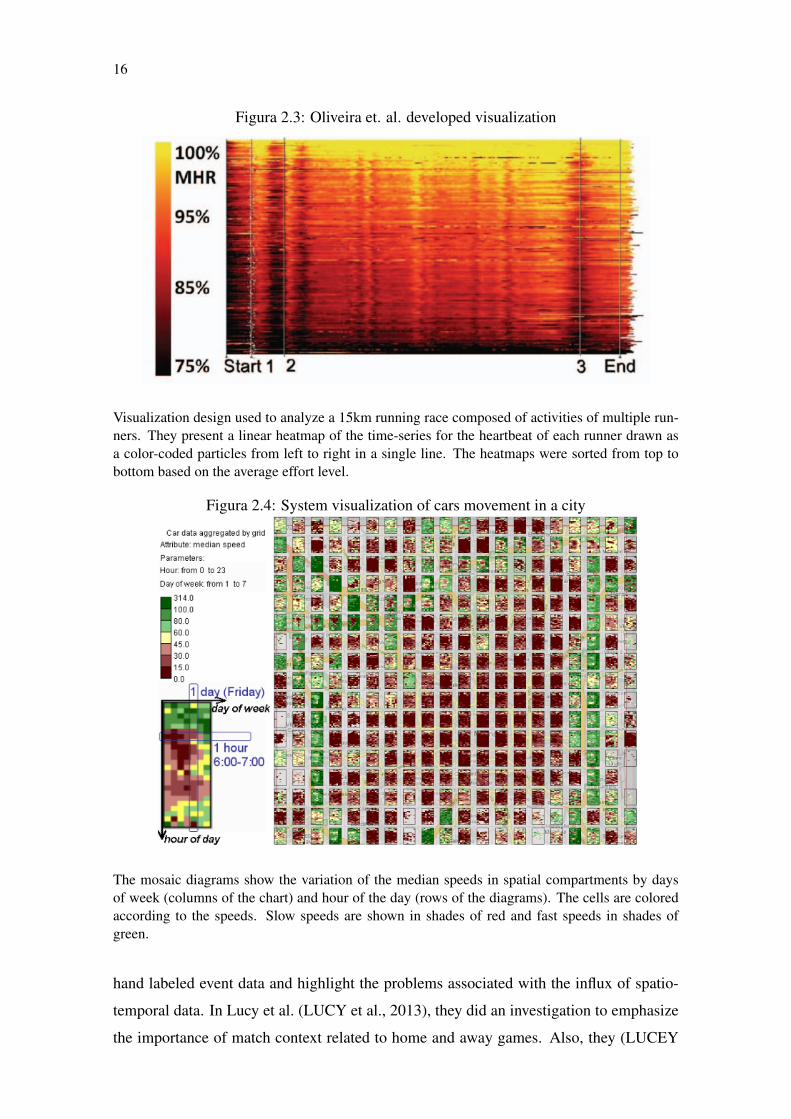
activity of multiple runners considering different variables. Andrienko and Andrienko
(ANDRIENKO; ANDRIENKO, 2008) describe a similar technique to represent traffic of
multiple cars defining aggregation and interaction methods for movement data (see Figure
2.4).
Spatiotemporal data was used by Lucey et al. (LUCEY et al., 2012), Lucy et al.
(LUCY et al., 2013), Bialkowski et al. (BIALKOWSKI et al., 2014) and to examine how
player tracking information can be used to analyze team formation and behavior. These
works have an overview of different types of analysis currently performed, mostly with
16
Figura 2.3: Oliveira et. al. developed visualization
Visualization design used to analyze a 15km running race composed of activities of multiple run-ners. They present a linear heatmap of the time-series for the heartbeat of each runner drawn asa color-coded particles from left to right in a single line. The heatmaps were sorted from top tobottom based on the average effort level.
Figura 2.4: System visualization of cars movement in a city
The mosaic diagrams show the variation of the median speeds in spatial compartments by daysof week (columns of the chart) and hour of the day (rows of the diagrams). The cells are coloredaccording to the speeds. Slow speeds are shown in shades of red and fast speeds in shades ofgreen.
hand labeled event data and highlight the problems associated with the influx of spatio-
temporal data. In Lucy et al. (LUCY et al., 2013), they did an investigation to emphasize
the importance of match context related to home and away games. Also, they (LUCEY
17
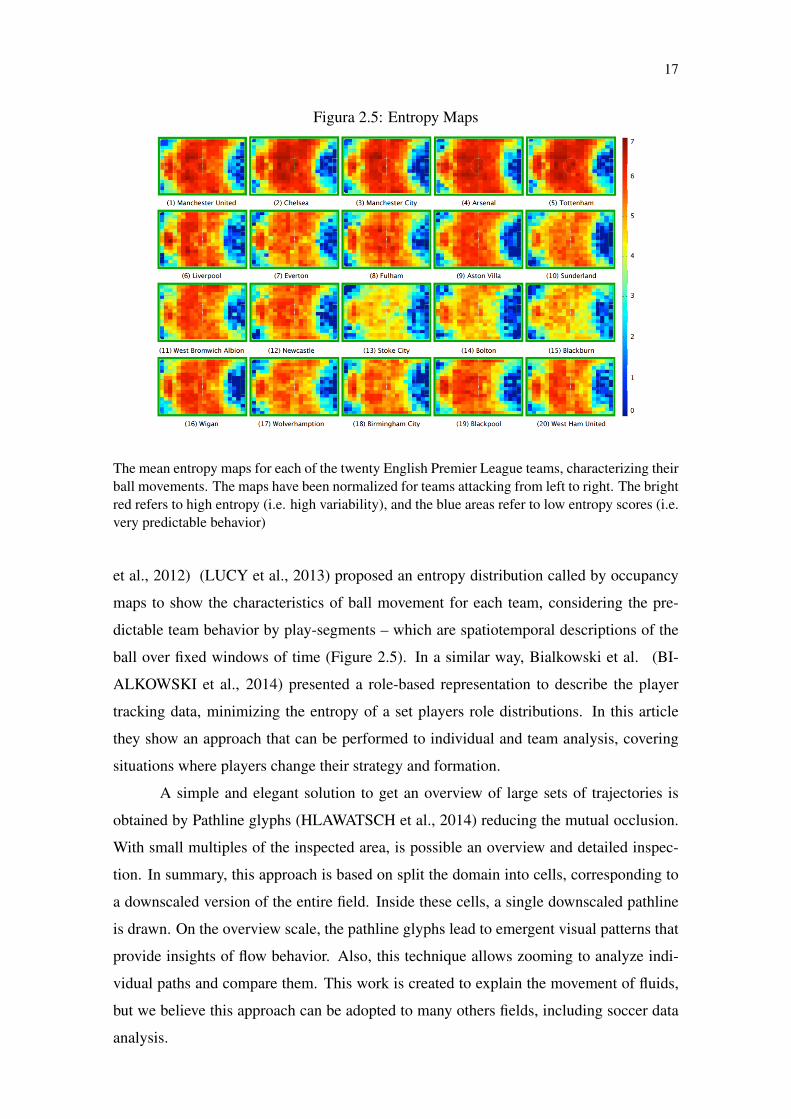
Figura 2.5: Entropy Maps
The mean entropy maps for each of the twenty English Premier League teams, characterizing theirball movements. The maps have been normalized for teams attacking from left to right. The brightred refers to high entropy (i.e. high variability), and the blue areas refer to low entropy scores (i.e.very predictable behavior)
et al., 2012) (LUCY et al., 2013) proposed an entropy distribution called by occupancy
maps to show the characteristics of ball movement for each team, considering the pre-
dictable team behavior by play-segments – which are spatiotemporal descriptions of the
ball over fixed windows of time (Figure 2.5). In a similar way, Bialkowski et al. (BI-
ALKOWSKI et al., 2014) presented a role-based representation to describe the player
tracking data, minimizing the entropy of a set players role distributions. In this article
they show an approach that can be performed to individual and team analysis, covering
situations where players change their strategy and formation.
A simple and elegant solution to get an overview of large sets of trajectories is
obtained by Pathline glyphs (HLAWATSCH et al., 2014) reducing the mutual occlusion.
With small multiples of the inspected area, is possible an overview and detailed inspec-
tion. In summary, this approach is based on split the domain into cells, corresponding to
a downscaled version of the entire field. Inside these cells, a single downscaled pathline
is drawn. On the overview scale, the pathline glyphs lead to emergent visual patterns that
provide insights of flow behavior. Also, this technique allows zooming to analyze indi-
vidual paths and compare them. This work is created to explain the movement of fluids,
but we believe this approach can be adopted to many others fields, including soccer data
analysis.
18
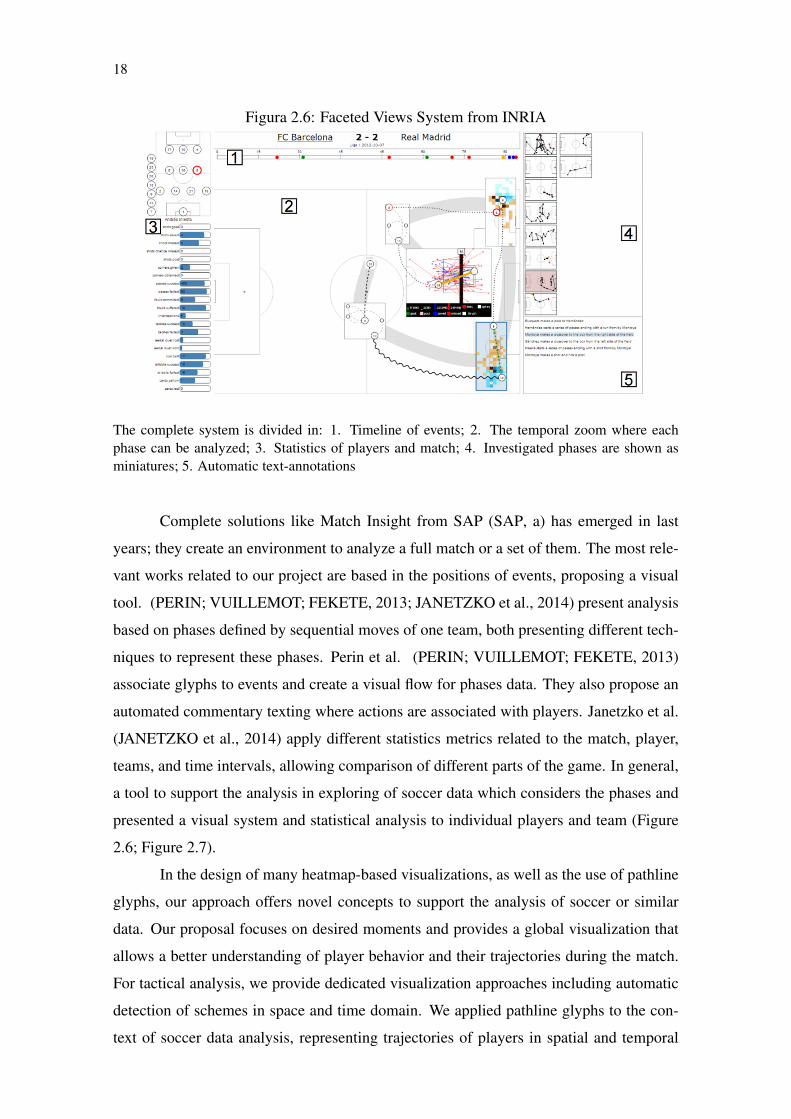
Figura 2.6: Faceted Views System from INRIA
The complete system is divided in: 1. Timeline of events; 2. The temporal zoom where eachphase can be analyzed; 3. Statistics of players and match; 4. Investigated phases are shown asminiatures; 5. Automatic text-annotations
Complete solutions like Match Insight from SAP (SAP, a) has emerged in last
years; they create an environment to analyze a full match or a set of them. The most rele-
vant works related to our project are based in the positions of events, proposing a visual
tool. (PERIN; VUILLEMOT; FEKETE, 2013; JANETZKO et al., 2014) present analysis
based on phases defined by sequential moves of one team, both presenting different tech-
niques to represent these phases. Perin et al. (PERIN; VUILLEMOT; FEKETE, 2013)
associate glyphs to events and create a visual flow for phases data. They also propose an
automated commentary texting where actions are associated with players. Janetzko et al.
(JANETZKO et al., 2014) apply different statistics metrics related to the match, player,
teams, and time intervals, allowing comparison of different parts of the game. In general,
a tool to support the analysis in exploring of soccer data which considers the phases and
presented a visual system and statistical analysis to individual players and team (Figure
2.6; Figure 2.7).
In the design of many heatmap-based visualizations, as well as the use of pathline
glyphs, our approach offers novel concepts to support the analysis of soccer or similar
data. Our proposal focuses on desired moments and provides a global visualization that
allows a better understanding of player behavior and their trajectories during the match.
For tactical analysis, we provide dedicated visualization approaches including automatic
detection of schemes in space and time domain. We applied pathline glyphs to the con-
text of soccer data analysis, representing trajectories of players in spatial and temporal
19
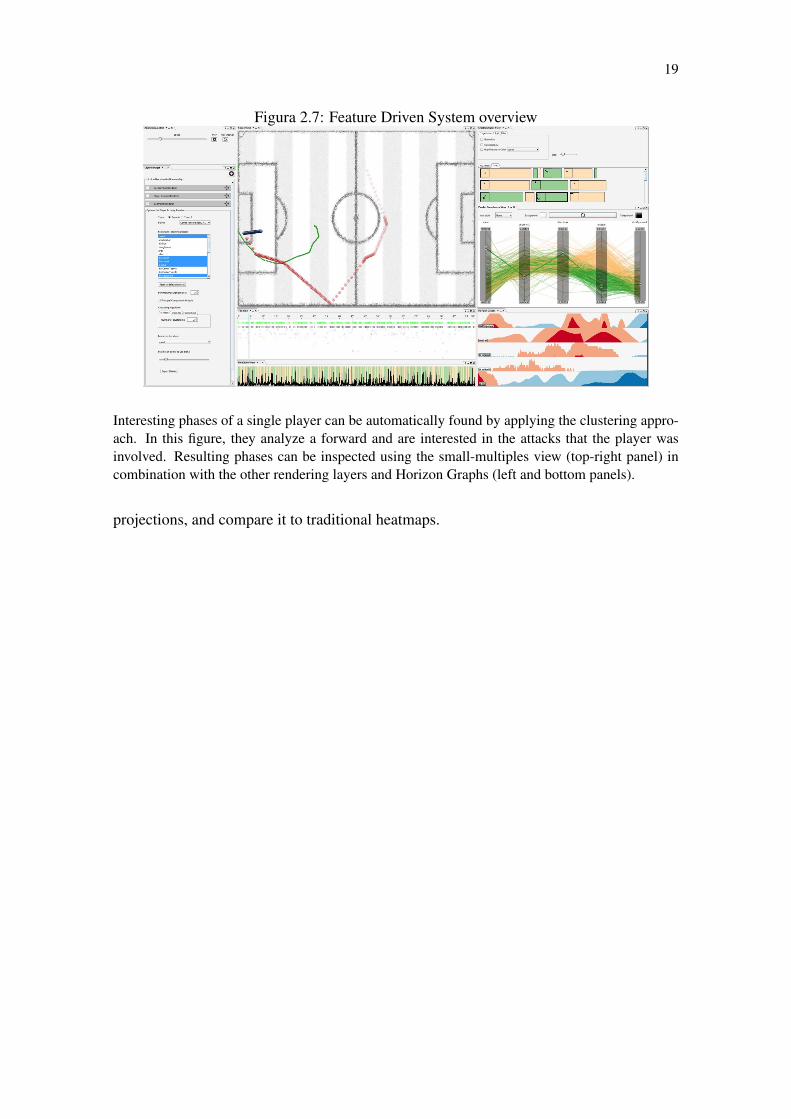
Figura 2.7: Feature Driven System overview
Interesting phases of a single player can be automatically found by applying the clustering appro-ach. In this figure, they analyze a forward and are interested in the attacks that the player wasinvolved. Resulting phases can be inspected using the small-multiples view (top-right panel) incombination with the other rendering layers and Horizon Graphs (left and bottom panels).
projections, and compare it to traditional heatmaps.
20
3 VISUAL SOCCER MATCH ANALYSIS
After the acquisition of the required properties (research questions) for a soccer
analysis approach, we decomposed the overall problem into different aspects, which were
addressed by the development of novel visualization techniques. This procedure results
in a system of visualization components, denominated Visual Soccer Match Analysis
(VSMA), which are mutually linked – by direct interrelation and additionally by com-
ponents providing a context in between them.
Below, we motivate and describe the individual components of our approach, and
explain its usage and utility to research questions presented in the chapter one. The last
section of here, we will introduce some techniques exhibited in previous studies related
to our proposed framework.
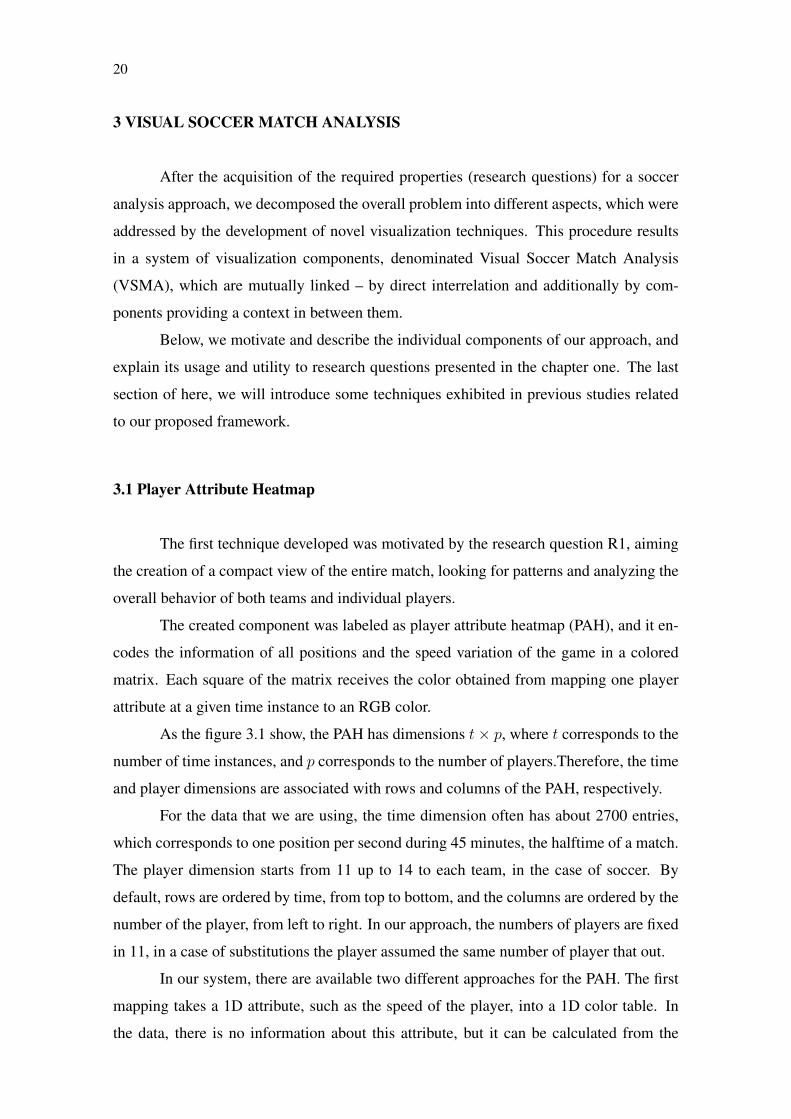
3.1 Player Attribute Heatmap
The first technique developed was motivated by the research question R1, aiming
the creation of a compact view of the entire match, looking for patterns and analyzing the
overall behavior of both teams and individual players.
The created component was labeled as player attribute heatmap (PAH), and it en-
codes the information of all positions and the speed variation of the game in a colored
matrix. Each square of the matrix receives the color obtained from mapping one player
attribute at a given time instance to an RGB color.
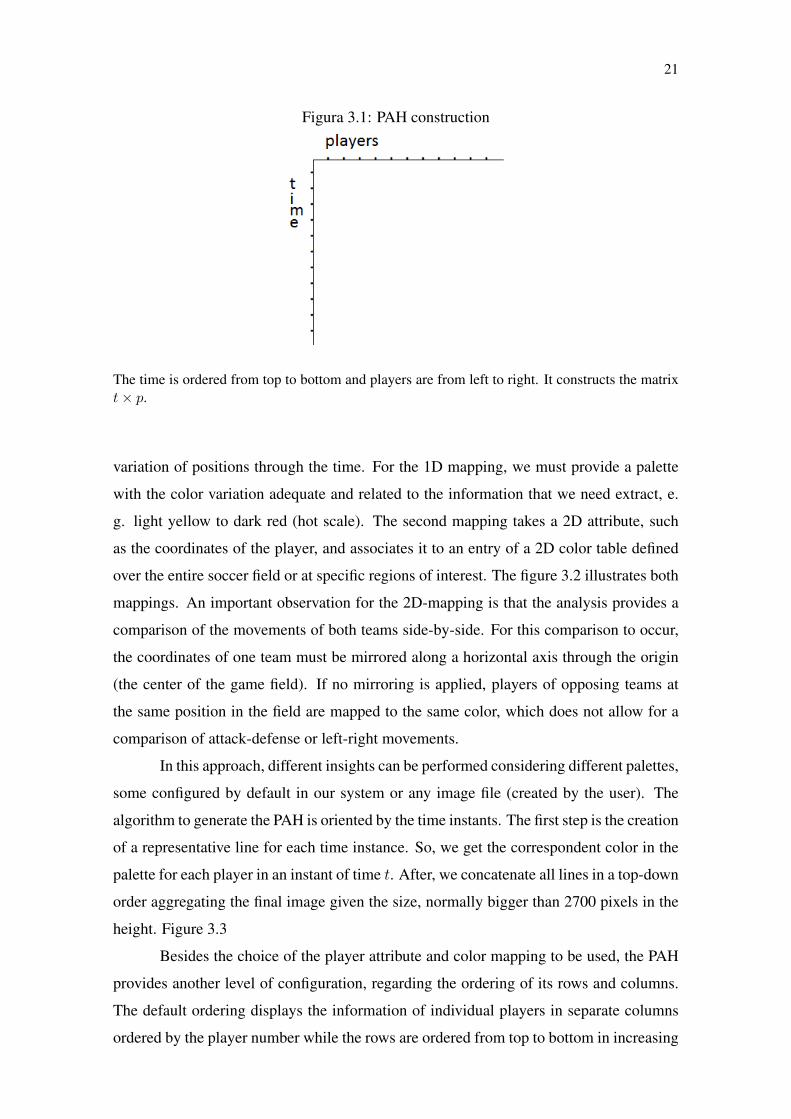
As the figure 3.1 show, the PAH has dimensions t× p, where t corresponds to the
number of time instances, and p corresponds to the number of players.Therefore, the time
and player dimensions are associated with rows and columns of the PAH, respectively.
For the data that we are using, the time dimension often has about 2700 entries,
which corresponds to one position per second during 45 minutes, the halftime of a match.
The player dimension starts from 11 up to 14 to each team, in the case of soccer. By
default, rows are ordered by time, from top to bottom, and the columns are ordered by the
number of the player, from left to right. In our approach, the numbers of players are fixed
in 11, in a case of substitutions the player assumed the same number of player that out.
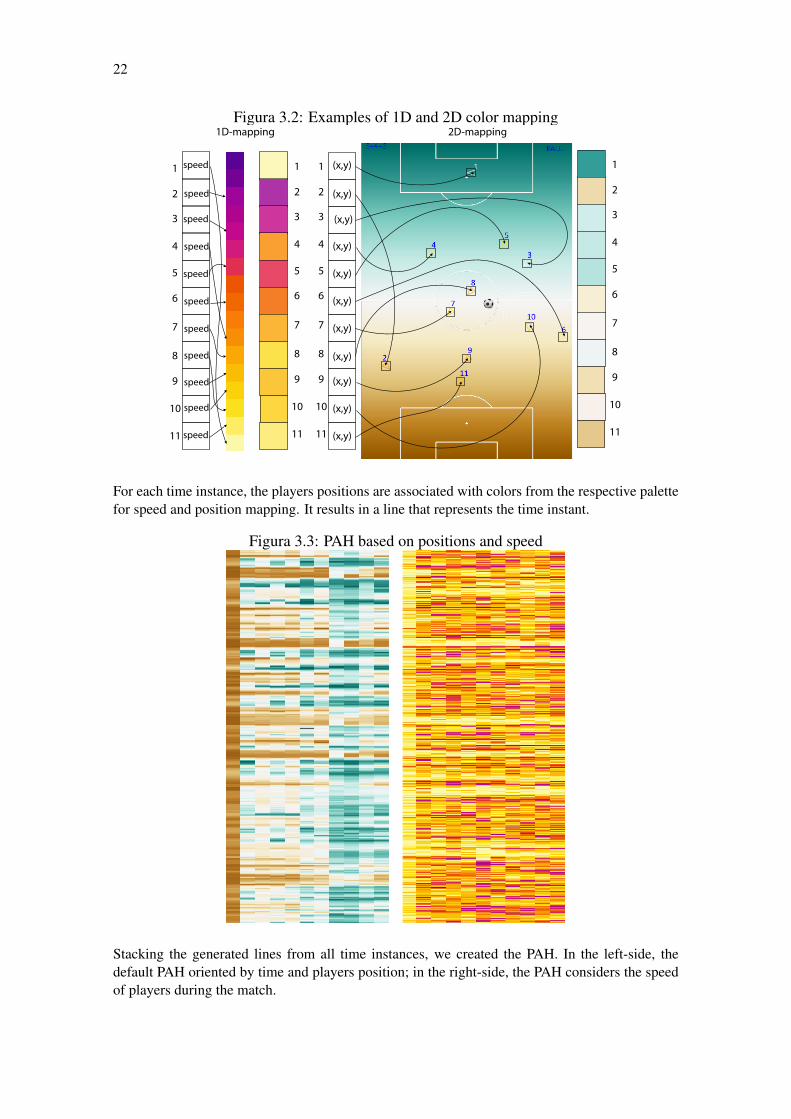
In our system, there are available two different approaches for the PAH. The first
mapping takes a 1D attribute, such as the speed of the player, into a 1D color table. In
the data, there is no information about this attribute, but it can be calculated from the
21
Figura 3.1: PAH construction
The time is ordered from top to bottom and players are from left to right. It constructs the matrixt× p.
variation of positions through the time. For the 1D mapping, we must provide a palette
with the color variation adequate and related to the information that we need extract, e.
g. light yellow to dark red (hot scale). The second mapping takes a 2D attribute, such
as the coordinates of the player, and associates it to an entry of a 2D color table defined
over the entire soccer field or at specific regions of interest. The figure 3.2 illustrates both
mappings. An important observation for the 2D-mapping is that the analysis provides a
comparison of the movements of both teams side-by-side. For this comparison to occur,
the coordinates of one team must be mirrored along a horizontal axis through the origin
(the center of the game field). If no mirroring is applied, players of opposing teams at
the same position in the field are mapped to the same color, which does not allow for a
comparison of attack-defense or left-right movements.
In this approach, different insights can be performed considering different palettes,
some configured by default in our system or any image file (created by the user). The
algorithm to generate the PAH is oriented by the time instants. The first step is the creation
of a representative line for each time instance. So, we get the correspondent color in the
palette for each player in an instant of time t. After, we concatenate all lines in a top-down
order aggregating the final image given the size, normally bigger than 2700 pixels in the
height. Figure 3.3
Besides the choice of the player attribute and color mapping to be used, the PAH
provides another level of configuration, regarding the ordering of its rows and columns.
The default ordering displays the information of individual players in separate columns
ordered by the player number while the rows are ordered from top to bottom in increasing
22
Figura 3.2: Examples of 1D and 2D color mapping
1
2
3
4
5
6
7
8
9
10
11
(x,y)
(x,y)
(x,y)
(x,y)
(x,y)
(x,y)
(x,y)
(x,y)
(x,y)
(x,y)
(x,y)
1
2
3
4
5
6
7
8
9
10
11
1
2
3
4
5
6
7
8
9
10
11
speed
speed
speed
speed
speed
speed
speed
speed
speed
speed
speed
1
2
3
4
5
6
7
8
9
10
11
1D-mapping 2D-mapping
For each time instance, the players positions are associated with colors from the respective palettefor speed and position mapping. It results in a line that represents the time instant.
Figura 3.3: PAH based on positions and speed
Stacking the generated lines from all time instances, we created the PAH. In the left-side, thedefault PAH oriented by time and players position; in the right-side, the PAH considers the speedof players during the match.
23
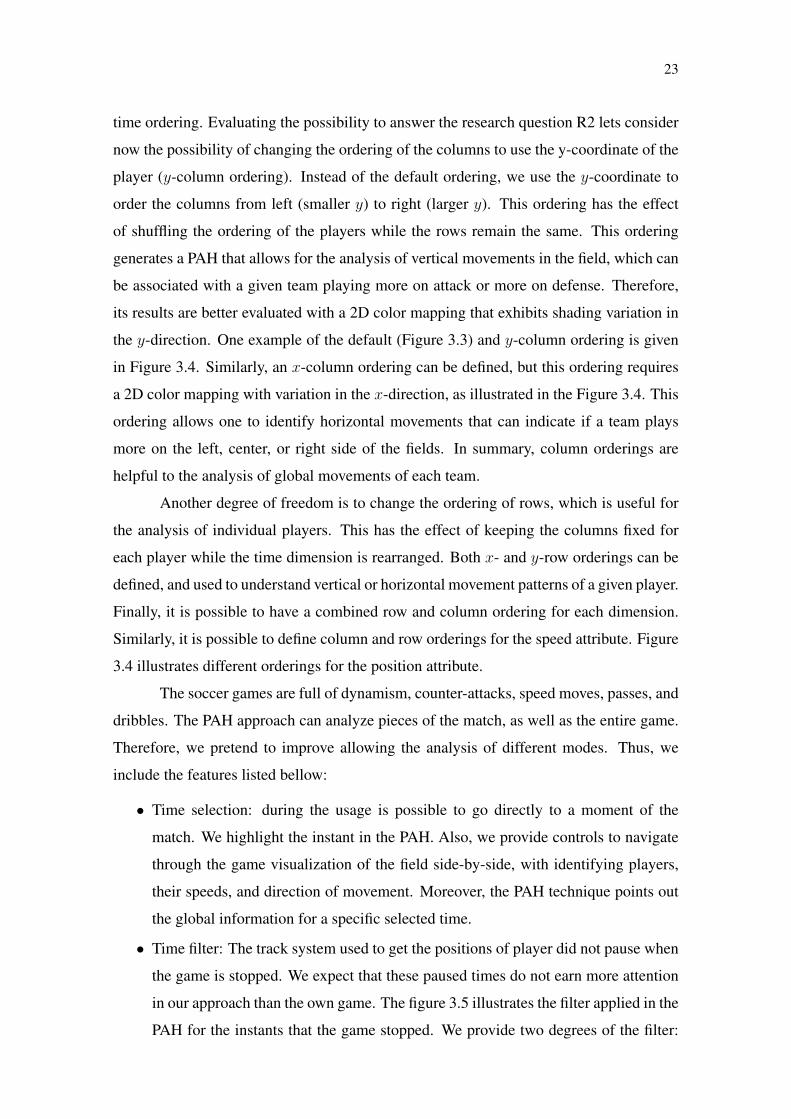
time ordering. Evaluating the possibility to answer the research question R2 lets consider
now the possibility of changing the ordering of the columns to use the y-coordinate of the
player (y-column ordering). Instead of the default ordering, we use the y-coordinate to
order the columns from left (smaller y) to right (larger y). This ordering has the effect
of shuffling the ordering of the players while the rows remain the same. This ordering
generates a PAH that allows for the analysis of vertical movements in the field, which can
be associated with a given team playing more on attack or more on defense. Therefore,
its results are better evaluated with a 2D color mapping that exhibits shading variation in
the y-direction. One example of the default (Figure 3.3) and y-column ordering is given
in Figure 3.4. Similarly, an x-column ordering can be defined, but this ordering requires
a 2D color mapping with variation in the x-direction, as illustrated in the Figure 3.4. This
ordering allows one to identify horizontal movements that can indicate if a team plays
more on the left, center, or right side of the fields. In summary, column orderings are
helpful to the analysis of global movements of each team.
Another degree of freedom is to change the ordering of rows, which is useful for
the analysis of individual players. This has the effect of keeping the columns fixed for
each player while the time dimension is rearranged. Both x- and y-row orderings can be
defined, and used to understand vertical or horizontal movement patterns of a given player.
Finally, it is possible to have a combined row and column ordering for each dimension.
Similarly, it is possible to define column and row orderings for the speed attribute. Figure
3.4 illustrates different orderings for the position attribute.
The soccer games are full of dynamism, counter-attacks, speed moves, passes, and
dribbles. The PAH approach can analyze pieces of the match, as well as the entire game.
Therefore, we pretend to improve allowing the analysis of different modes. Thus, we
include the features listed bellow:
• Time selection: during the usage is possible to go directly to a moment of the
match. We highlight the instant in the PAH. Also, we provide controls to navigate
through the game visualization of the field side-by-side, with identifying players,
their speeds, and direction of movement. Moreover, the PAH technique points out
the global information for a specific selected time.
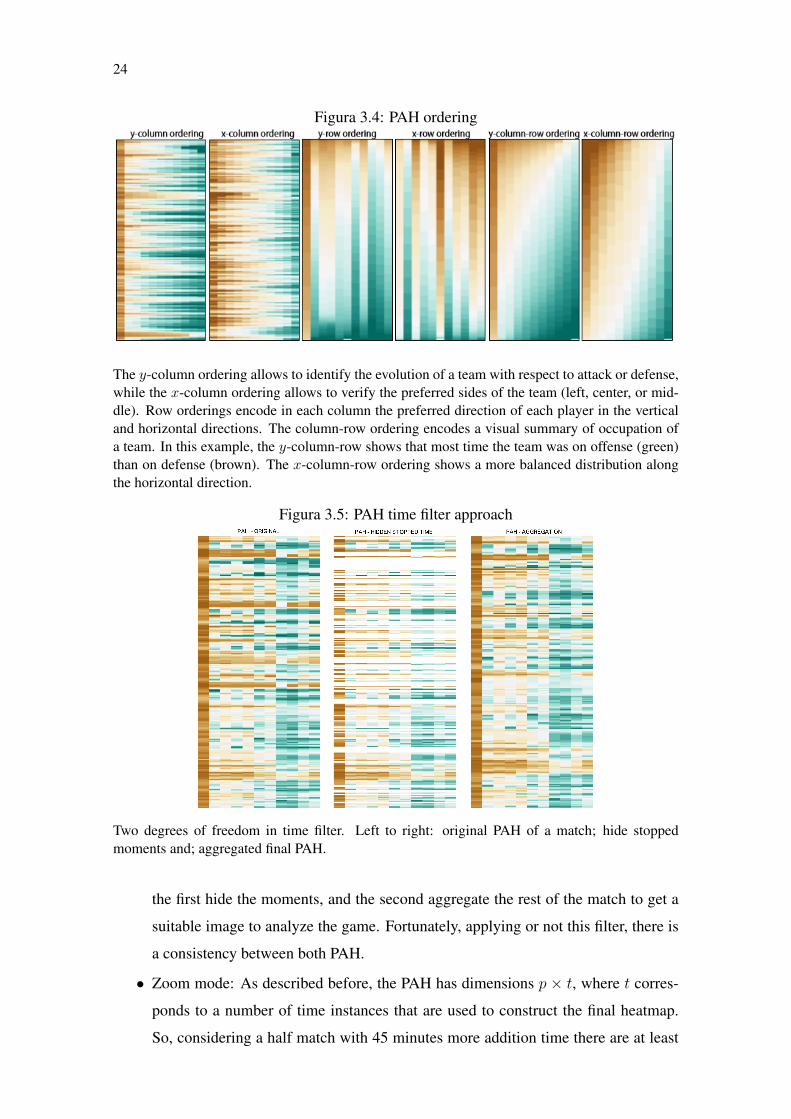
• Time filter: The track system used to get the positions of player did not pause when
the game is stopped. We expect that these paused times do not earn more attention
in our approach than the own game. The figure 3.5 illustrates the filter applied in the
PAH for the instants that the game stopped. We provide two degrees of the filter:
24
Figura 3.4: PAH ordering
The y-column ordering allows to identify the evolution of a team with respect to attack or defense,while the x-column ordering allows to verify the preferred sides of the team (left, center, or mid-dle). Row orderings encode in each column the preferred direction of each player in the verticaland horizontal directions. The column-row ordering encodes a visual summary of occupation ofa team. In this example, the y-column-row shows that most time the team was on offense (green)than on defense (brown). The x-column-row ordering shows a more balanced distribution alongthe horizontal direction.
Figura 3.5: PAH time filter approach
Two degrees of freedom in time filter. Left to right: original PAH of a match; hide stoppedmoments and; aggregated final PAH.
the first hide the moments, and the second aggregate the rest of the match to get a
suitable image to analyze the game. Fortunately, applying or not this filter, there is
a consistency between both PAH.
• Zoom mode: As described before, the PAH has dimensions p × t, where t corres-
ponds to a number of time instances that are used to construct the final heatmap.
So, considering a half match with 45 minutes more addition time there are at least
25
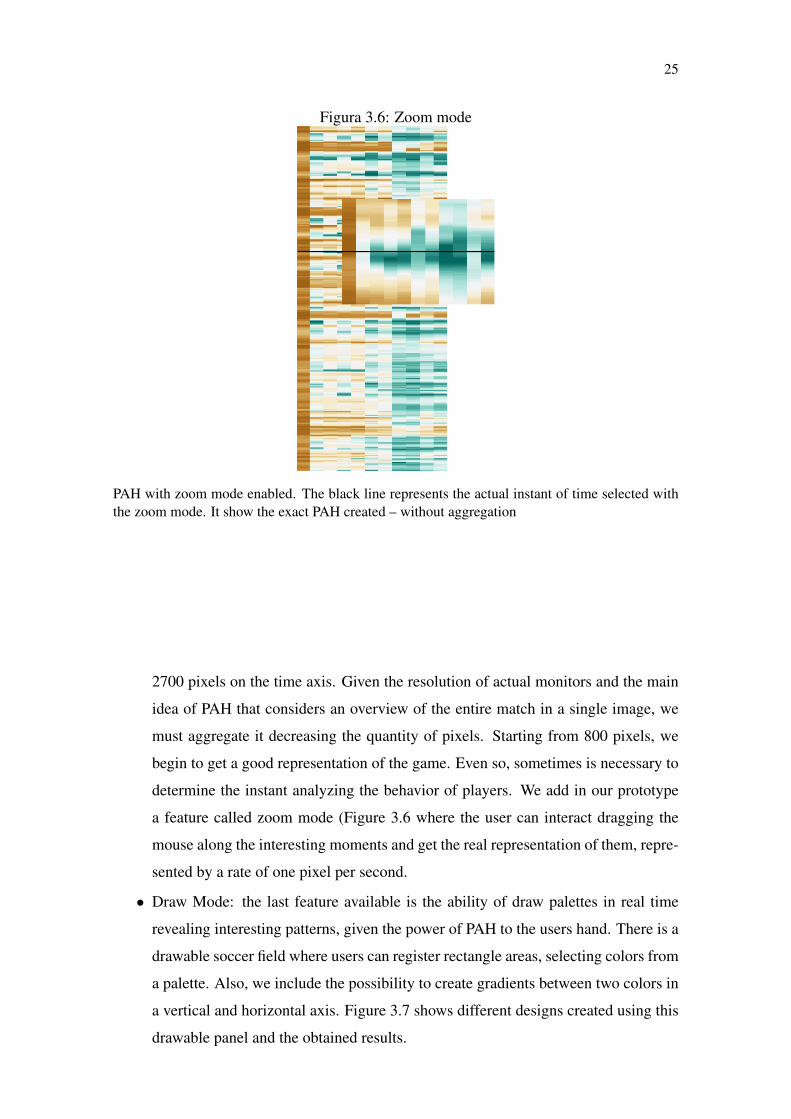
Figura 3.6: Zoom mode
PAH with zoom mode enabled. The black line represents the actual instant of time selected withthe zoom mode. It show the exact PAH created – without aggregation
2700 pixels on the time axis. Given the resolution of actual monitors and the main
idea of PAH that considers an overview of the entire match in a single image, we
must aggregate it decreasing the quantity of pixels. Starting from 800 pixels, we
begin to get a good representation of the game. Even so, sometimes is necessary to
determine the instant analyzing the behavior of players. We add in our prototype
a feature called zoom mode (Figure 3.6 where the user can interact dragging the
mouse along the interesting moments and get the real representation of them, repre-
sented by a rate of one pixel per second.
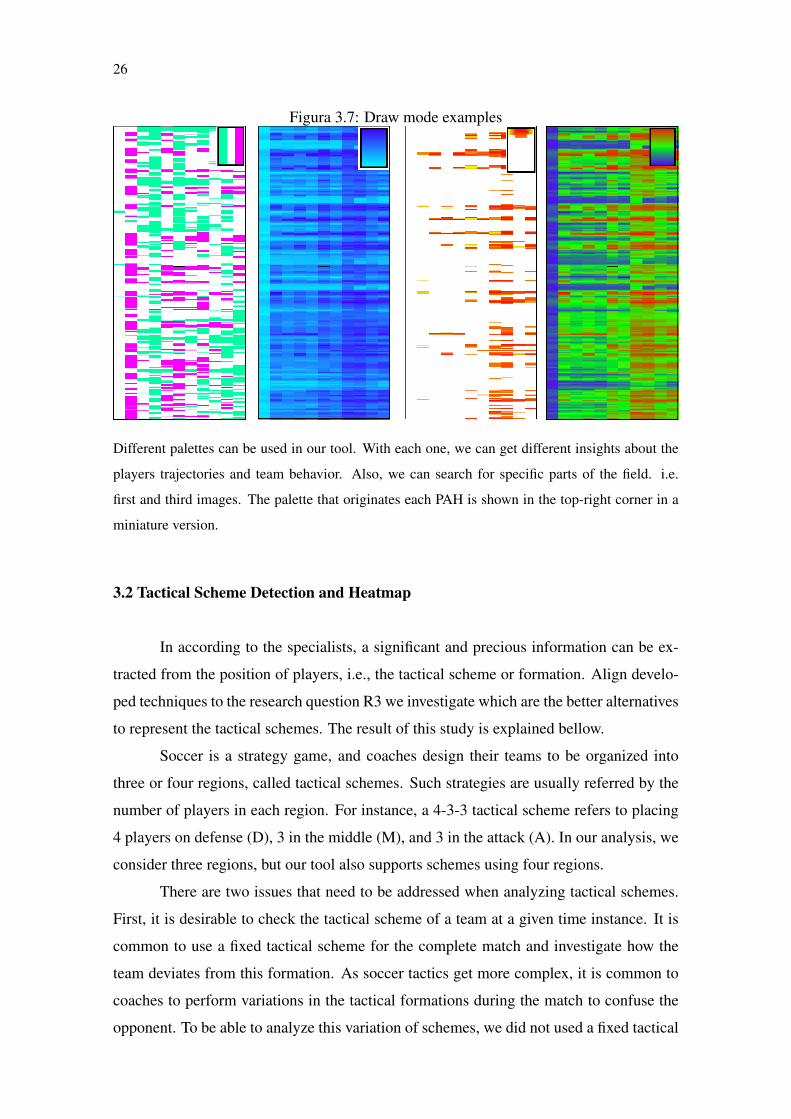
• Draw Mode: the last feature available is the ability of draw palettes in real time
revealing interesting patterns, given the power of PAH to the users hand. There is a
drawable soccer field where users can register rectangle areas, selecting colors from
a palette. Also, we include the possibility to create gradients between two colors in
a vertical and horizontal axis. Figure 3.7 shows different designs created using this
drawable panel and the obtained results.
26
Figura 3.7: Draw mode examples
Different palettes can be used in our tool. With each one, we can get different insights about the
players trajectories and team behavior. Also, we can search for specific parts of the field. i.e.
first and third images. The palette that originates each PAH is shown in the top-right corner in a
miniature version.
3.2 Tactical Scheme Detection and Heatmap
In according to the specialists, a significant and precious information can be ex-
tracted from the position of players, i.e., the tactical scheme or formation. Align develo-
ped techniques to the research question R3 we investigate which are the better alternatives
to represent the tactical schemes. The result of this study is explained bellow.
Soccer is a strategy game, and coaches design their teams to be organized into
three or four regions, called tactical schemes. Such strategies are usually referred by the
number of players in each region. For instance, a 4-3-3 tactical scheme refers to placing
4 players on defense (D), 3 in the middle (M), and 3 in the attack (A). In our analysis, we
consider three regions, but our tool also supports schemes using four regions.
There are two issues that need to be addressed when analyzing tactical schemes.
First, it is desirable to check the tactical scheme of a team at a given time instance. It is
common to use a fixed tactical scheme for the complete match and investigate how the
team deviates from this formation. As soccer tactics get more complex, it is common to
coaches to perform variations in the tactical formations during the match to confuse the
opponent. To be able to analyze this variation of schemes, we did not used a fixed tactical
27
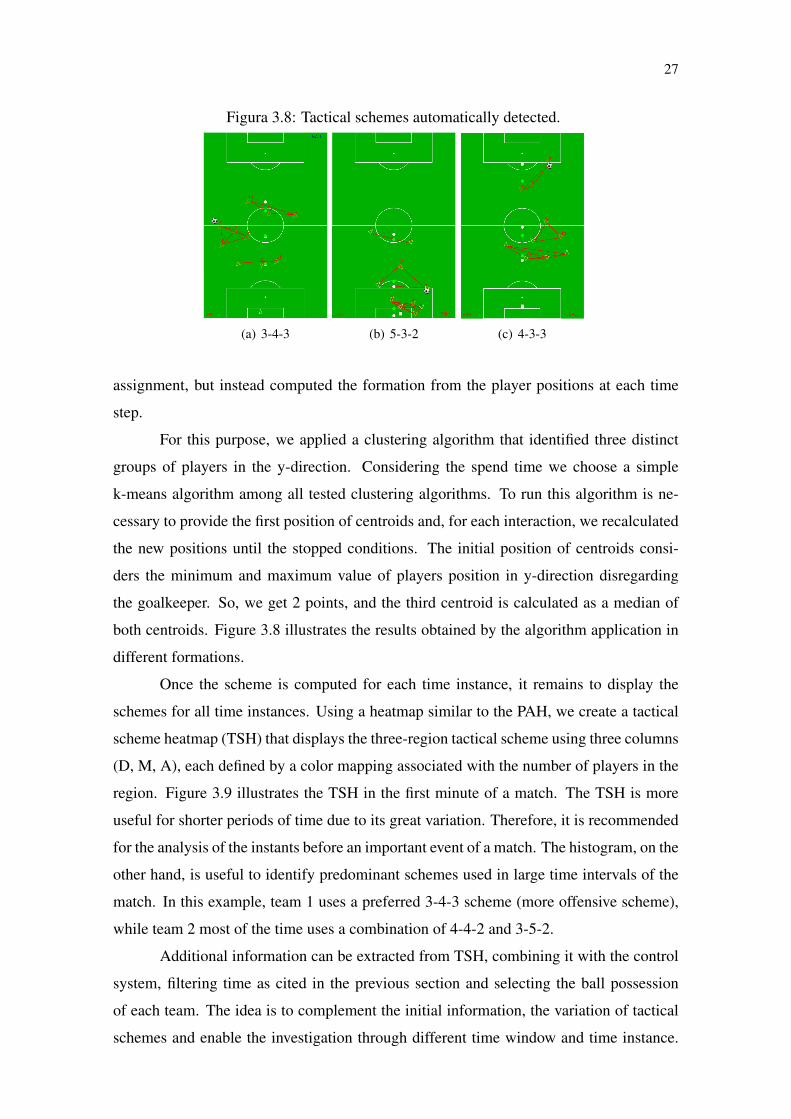
Figura 3.8: Tactical schemes automatically detected.
(a) 3-4-3 (b) 5-3-2 (c) 4-3-3
assignment, but instead computed the formation from the player positions at each time
step.
For this purpose, we applied a clustering algorithm that identified three distinct
groups of players in the y-direction. Considering the spend time we choose a simple
k-means algorithm among all tested clustering algorithms. To run this algorithm is ne-
cessary to provide the first position of centroids and, for each interaction, we recalculated
the new positions until the stopped conditions. The initial position of centroids consi-
ders the minimum and maximum value of players position in y-direction disregarding
the goalkeeper. So, we get 2 points, and the third centroid is calculated as a median of
both centroids. Figure 3.8 illustrates the results obtained by the algorithm application in
different formations.
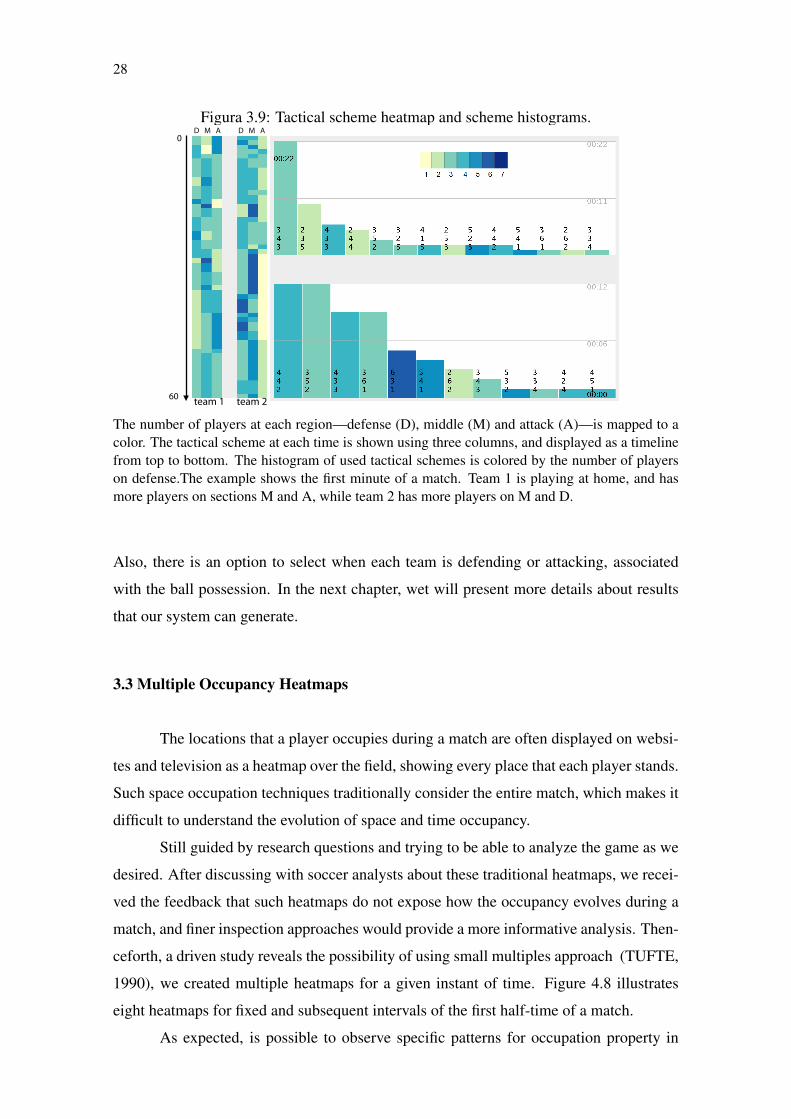
Once the scheme is computed for each time instance, it remains to display the
schemes for all time instances. Using a heatmap similar to the PAH, we create a tactical
scheme heatmap (TSH) that displays the three-region tactical scheme using three columns
(D, M, A), each defined by a color mapping associated with the number of players in the
region. Figure 3.9 illustrates the TSH in the first minute of a match. The TSH is more
useful for shorter periods of time due to its great variation. Therefore, it is recommended
for the analysis of the instants before an important event of a match. The histogram, on the
other hand, is useful to identify predominant schemes used in large time intervals of the
match. In this example, team 1 uses a preferred 3-4-3 scheme (more offensive scheme),
while team 2 most of the time uses a combination of 4-4-2 and 3-5-2.
Additional information can be extracted from TSH, combining it with the control
system, filtering time as cited in the previous section and selecting the ball possession
of each team. The idea is to complement the initial information, the variation of tactical
schemes and enable the investigation through different time window and time instance.
28
Figura 3.9: Tactical scheme heatmap and scheme histograms.
17
0
60
D M A D M A
team 1 team 2
The number of players at each region—defense (D), middle (M) and attack (A)—is mapped to acolor. The tactical scheme at each time is shown using three columns, and displayed as a timelinefrom top to bottom. The histogram of used tactical schemes is colored by the number of playerson defense.The example shows the first minute of a match. Team 1 is playing at home, and hasmore players on sections M and A, while team 2 has more players on M and D.
Also, there is an option to select when each team is defending or attacking, associated
with the ball possession. In the next chapter, wet will present more details about results
that our system can generate.
3.3 Multiple Occupancy Heatmaps
The locations that a player occupies during a match are often displayed on websi-
tes and television as a heatmap over the field, showing every place that each player stands.
Such space occupation techniques traditionally consider the entire match, which makes it
difficult to understand the evolution of space and time occupancy.
Still guided by research questions and trying to be able to analyze the game as we
desired. After discussing with soccer analysts about these traditional heatmaps, we recei-
ved the feedback that such heatmaps do not expose how the occupancy evolves during a
match, and finer inspection approaches would provide a more informative analysis. Then-
ceforth, a driven study reveals the possibility of using small multiples approach (TUFTE,
1990), we created multiple heatmaps for a given instant of time. Figure 4.8 illustrates
eight heatmaps for fixed and subsequent intervals of the first half-time of a match.
As expected, is possible to observe specific patterns for occupation property in
29
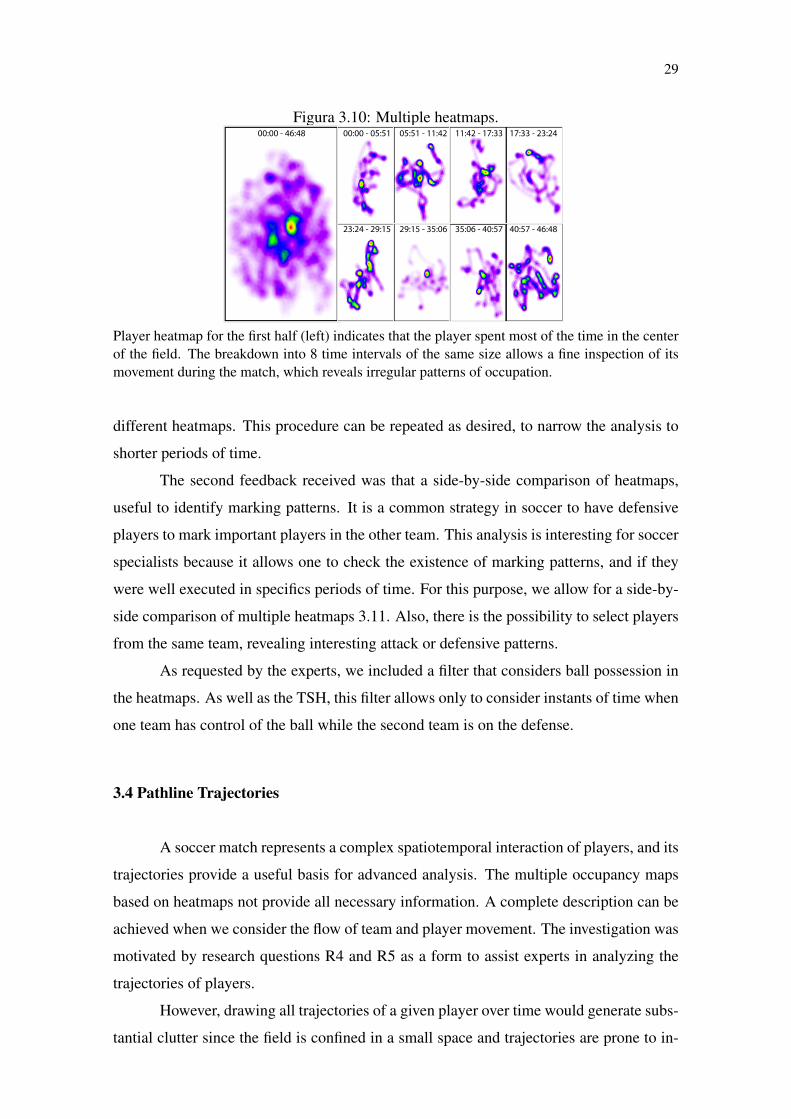
Figura 3.10: Multiple heatmaps.00:00 - 46:48 00:00 - 05:51 05:51 - 11:42 11:42 - 17:33 17:33 - 23:24
23:24 - 29:15 29:15 - 35:06 35:06 - 40:57 40:57 - 46:48
Player heatmap for the first half (left) indicates that the player spent most of the time in the centerof the field. The breakdown into 8 time intervals of the same size allows a fine inspection of itsmovement during the match, which reveals irregular patterns of occupation.
different heatmaps. This procedure can be repeated as desired, to narrow the analysis to
shorter periods of time.
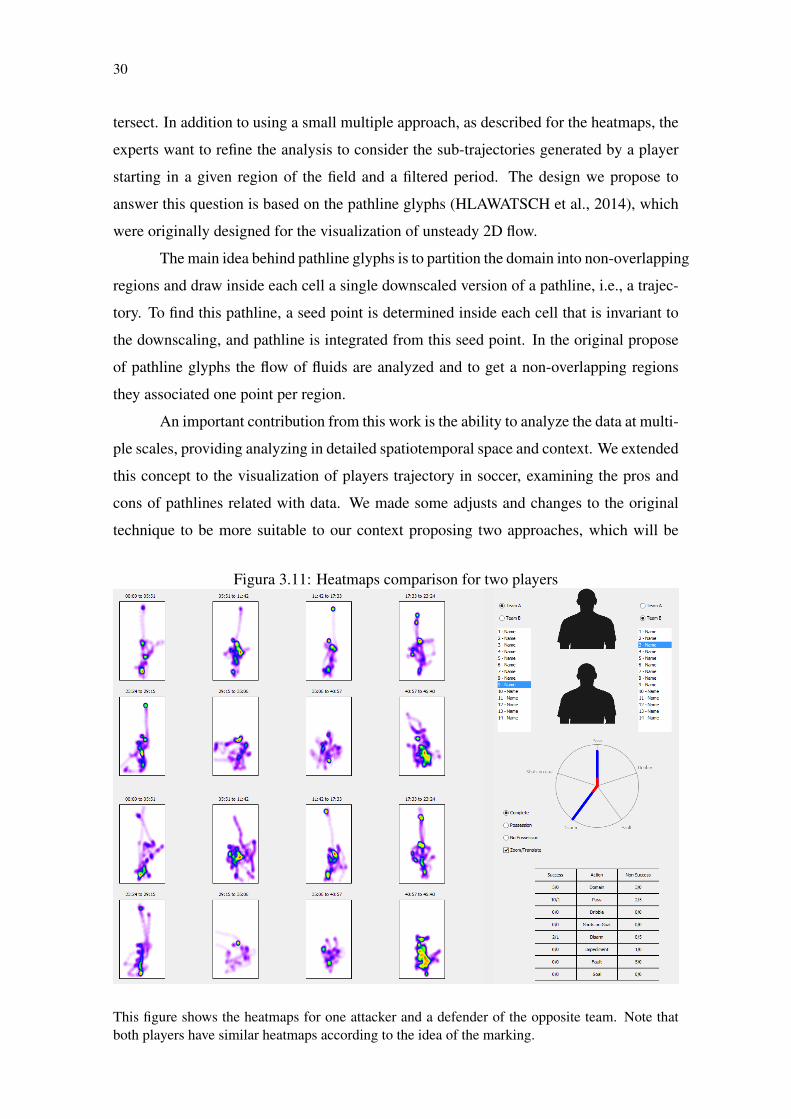
The second feedback received was that a side-by-side comparison of heatmaps,
useful to identify marking patterns. It is a common strategy in soccer to have defensive
players to mark important players in the other team. This analysis is interesting for soccer
specialists because it allows one to check the existence of marking patterns, and if they
were well executed in specifics periods of time. For this purpose, we allow for a side-by-
side comparison of multiple heatmaps 3.11. Also, there is the possibility to select players
from the same team, revealing interesting attack or defensive patterns.
As requested by the experts, we included a filter that considers ball possession in
the heatmaps. As well as the TSH, this filter allows only to consider instants of time when
one team has control of the ball while the second team is on the defense.
3.4 Pathline Trajectories
A soccer match represents a complex spatiotemporal interaction of players, and its
trajectories provide a useful basis for advanced analysis. The multiple occupancy maps
based on heatmaps not provide all necessary information. A complete description can be
achieved when we consider the flow of team and player movement. The investigation was
motivated by research questions R4 and R5 as a form to assist experts in analyzing the
trajectories of players.
However, drawing all trajectories of a given player over time would generate subs-
tantial clutter since the field is confined in a small space and trajectories are prone to in-
30
tersect. In addition to using a small multiple approach, as described for the heatmaps, the
experts want to refine the analysis to consider the sub-trajectories generated by a player
starting in a given region of the field and a filtered period. The design we propose to
answer this question is based on the pathline glyphs (HLAWATSCH et al., 2014), which
were originally designed for the visualization of unsteady 2D flow.
The main idea behind pathline glyphs is to partition the domain into non-overlapping
regions and draw inside each cell a single downscaled version of a pathline, i.e., a trajec-
tory. To find this pathline, a seed point is determined inside each cell that is invariant to
the downscaling, and pathline is integrated from this seed point. In the original propose
of pathline glyphs the flow of fluids are analyzed and to get a non-overlapping regions
they associated one point per region.
An important contribution from this work is the ability to analyze the data at multi-
ple scales, providing analyzing in detailed spatiotemporal space and context. We extended
this concept to the visualization of players trajectory in soccer, examining the pros and
cons of pathlines related with data. We made some adjusts and changes to the original
technique to be more suitable to our context proposing two approaches, which will be
Figura 3.11: Heatmaps comparison for two players
This figure shows the heatmaps for one attacker and a defender of the opposite team. Note thatboth players have similar heatmaps according to the idea of the marking.
31
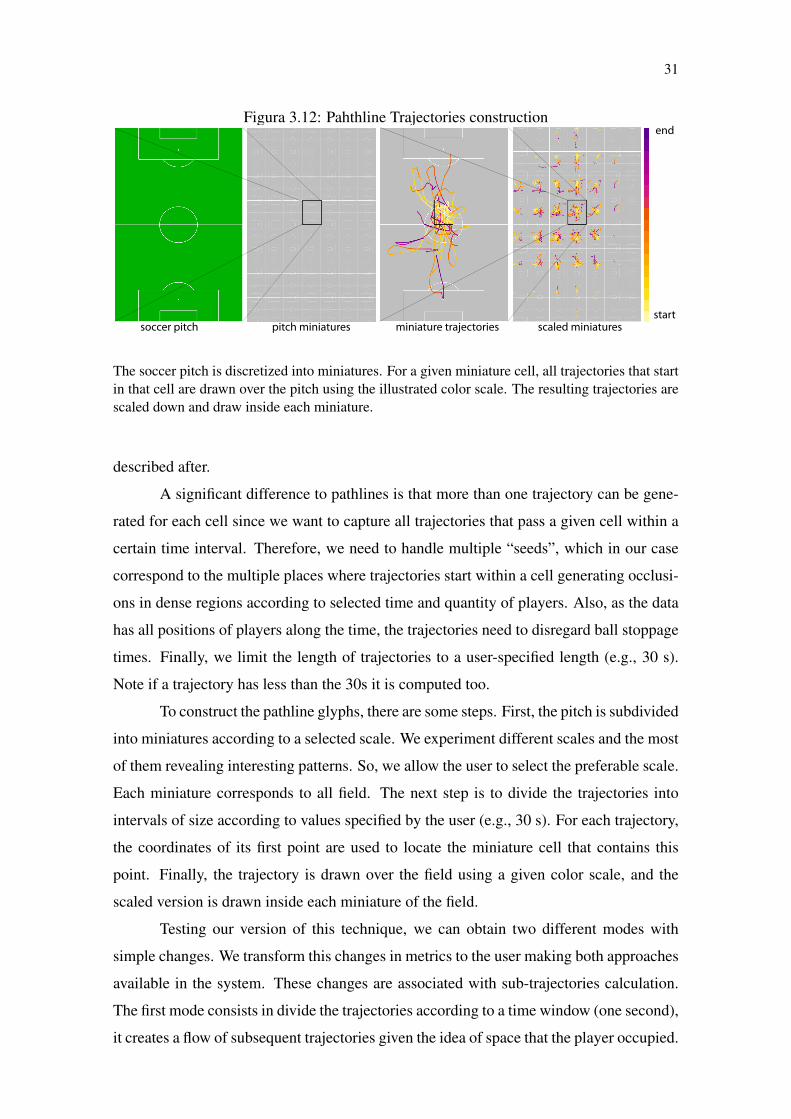
Figura 3.12: Pahthline Trajectories constructionend
startsoccer pitch pitch miniatures miniature trajectories scaled miniatures
The soccer pitch is discretized into miniatures. For a given miniature cell, all trajectories that startin that cell are drawn over the pitch using the illustrated color scale. The resulting trajectories arescaled down and draw inside each miniature.
described after.
A significant difference to pathlines is that more than one trajectory can be gene-
rated for each cell since we want to capture all trajectories that pass a given cell within a
certain time interval. Therefore, we need to handle multiple “seeds”, which in our case
correspond to the multiple places where trajectories start within a cell generating occlusi-
ons in dense regions according to selected time and quantity of players. Also, as the data
has all positions of players along the time, the trajectories need to disregard ball stoppage
times. Finally, we limit the length of trajectories to a user-specified length (e.g., 30 s).
Note if a trajectory has less than the 30s it is computed too.
To construct the pathline glyphs, there are some steps. First, the pitch is subdivided
into miniatures according to a selected scale. We experiment different scales and the most
of them revealing interesting patterns. So, we allow the user to select the preferable scale.
Each miniature corresponds to all field. The next step is to divide the trajectories into
intervals of size according to values specified by the user (e.g., 30 s). For each trajectory,
the coordinates of its first point are used to locate the miniature cell that contains this
point. Finally, the trajectory is drawn over the field using a given color scale, and the
scaled version is drawn inside each miniature of the field.
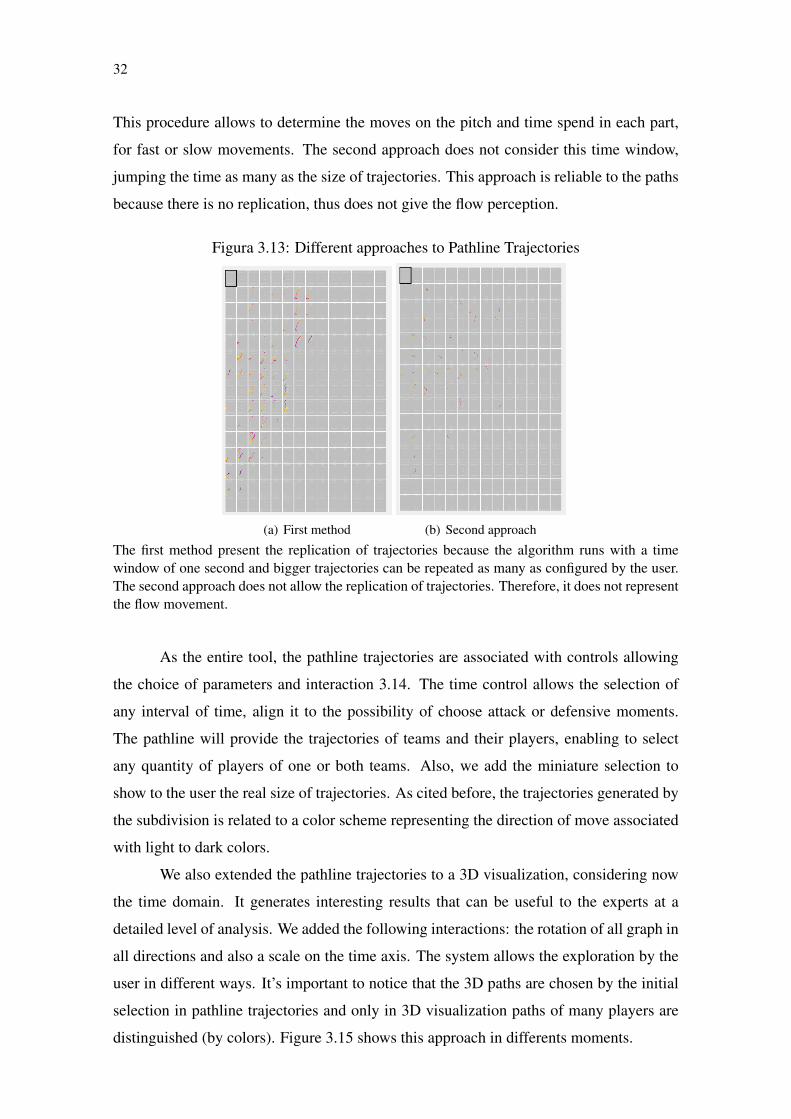
Testing our version of this technique, we can obtain two different modes with
simple changes. We transform this changes in metrics to the user making both approaches
available in the system. These changes are associated with sub-trajectories calculation.
The first mode consists in divide the trajectories according to a time window (one second),
it creates a flow of subsequent trajectories given the idea of space that the player occupied.
32
This procedure allows to determine the moves on the pitch and time spend in each part,
for fast or slow movements. The second approach does not consider this time window,
jumping the time as many as the size of trajectories. This approach is reliable to the paths
because there is no replication, thus does not give the flow perception.
Figura 3.13: Different approaches to Pathline Trajectories
(a) First method (b) Second approach
The first method present the replication of trajectories because the algorithm runs with a timewindow of one second and bigger trajectories can be repeated as many as configured by the user.The second approach does not allow the replication of trajectories. Therefore, it does not representthe flow movement.
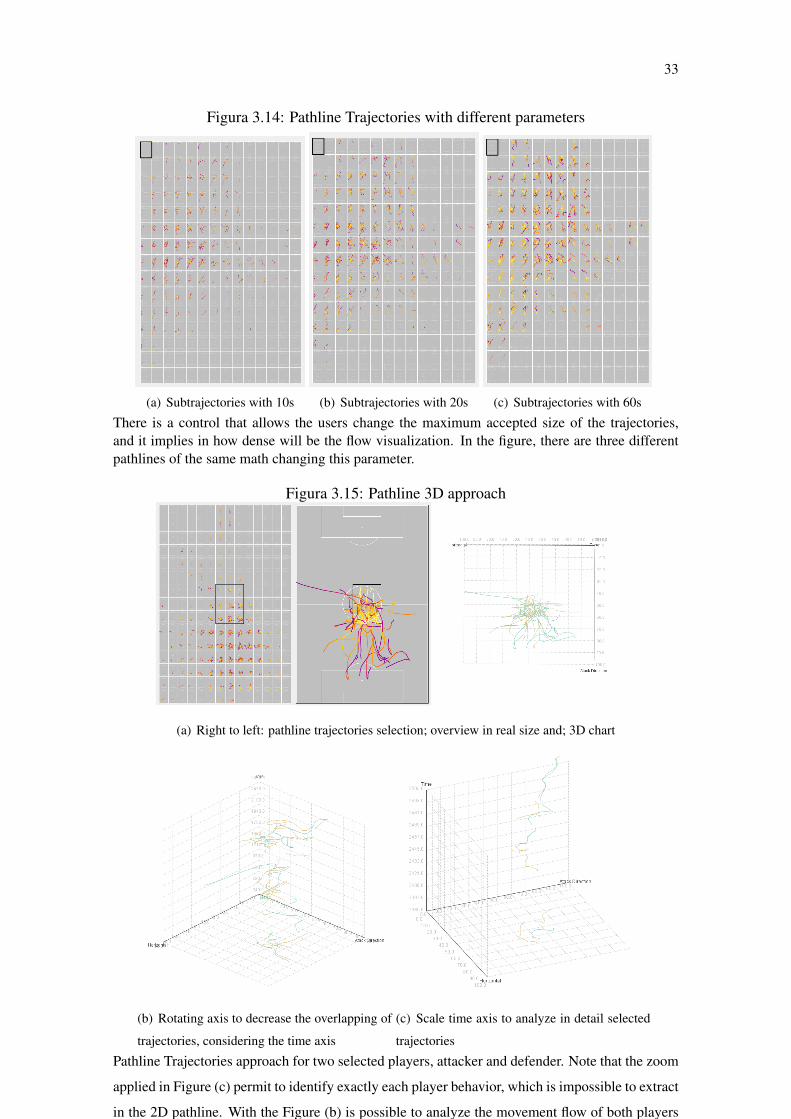
As the entire tool, the pathline trajectories are associated with controls allowing
the choice of parameters and interaction 3.14. The time control allows the selection of
any interval of time, align it to the possibility of choose attack or defensive moments.
The pathline will provide the trajectories of teams and their players, enabling to select
any quantity of players of one or both teams. Also, we add the miniature selection to
show to the user the real size of trajectories. As cited before, the trajectories generated by
the subdivision is related to a color scheme representing the direction of move associated
with light to dark colors.
We also extended the pathline trajectories to a 3D visualization, considering now
the time domain. It generates interesting results that can be useful to the experts at a
detailed level of analysis. We added the following interactions: the rotation of all graph in
all directions and also a scale on the time axis. The system allows the exploration by the
user in different ways. It’s important to notice that the 3D paths are chosen by the initial
selection in pathline trajectories and only in 3D visualization paths of many players are
distinguished (by colors). Figure 3.15 shows this approach in differents moments.
33
Figura 3.14: Pathline Trajectories with different parameters
(a) Subtrajectories with 10s (b) Subtrajectories with 20s (c) Subtrajectories with 60s
There is a control that allows the users change the maximum accepted size of the trajectories,and it implies in how dense will be the flow visualization. In the figure, there are three differentpathlines of the same math changing this parameter.
Figura 3.15: Pathline 3D approach
(a) Right to left: pathline trajectories selection; overview in real size and; 3D chart
(b) Rotating axis to decrease the overlapping of
trajectories, considering the time axis
(c) Scale time axis to analyze in detail selected
trajectories
Pathline Trajectories approach for two selected players, attacker and defender. Note that the zoom
applied in Figure (c) permit to identify exactly each player behavior, which is impossible to extract
in the 2D pathline. With the Figure (b) is possible to analyze the movement flow of both players
and observe the proximity of trajectories.
34
3.5 General techniques
The framework developed to support techniques present here was made to be a
complete tool in soccer analysis. To achieve it, we added well-known and necessary tech-
niques used in different sports, including soccer. These system parts also allow different
types of controlling and increase the accuracy of the expert analysis.
We illustrate bellow how it improve the power of our tool, itemizing each part of
our system.
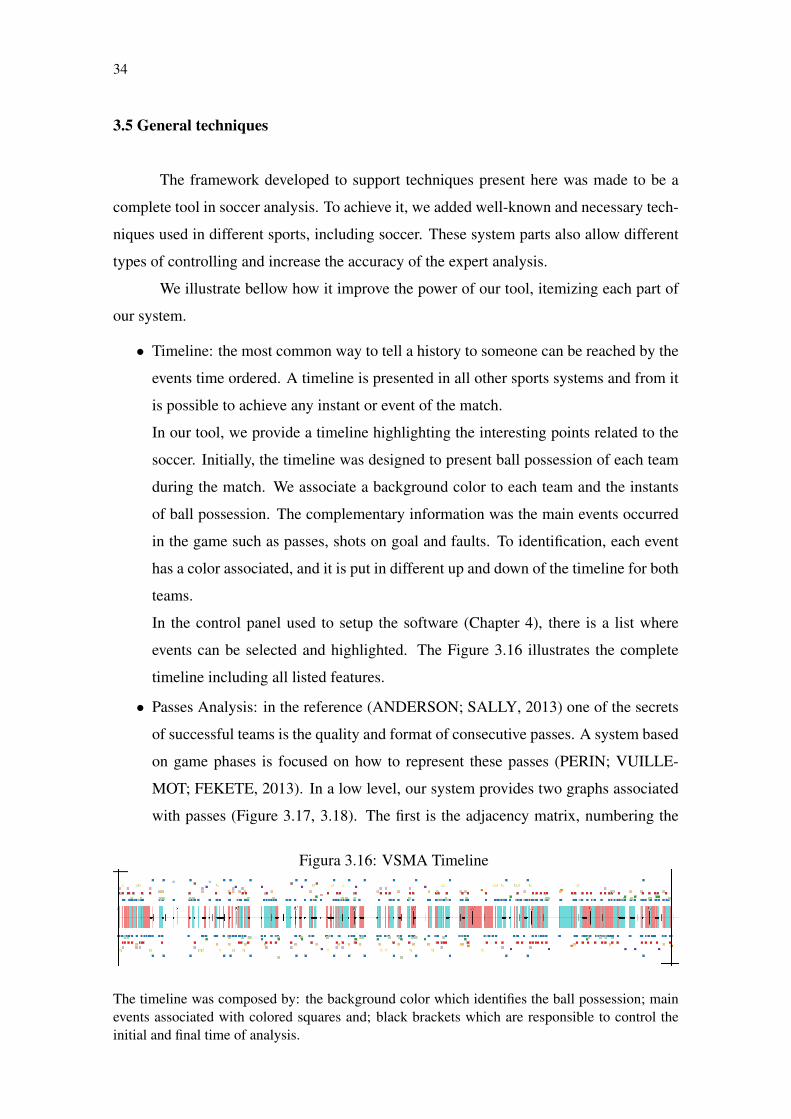
• Timeline: the most common way to tell a history to someone can be reached by the
events time ordered. A timeline is presented in all other sports systems and from it
is possible to achieve any instant or event of the match.
In our tool, we provide a timeline highlighting the interesting points related to the
soccer. Initially, the timeline was designed to present ball possession of each team
during the match. We associate a background color to each team and the instants
of ball possession. The complementary information was the main events occurred
in the game such as passes, shots on goal and faults. To identification, each event
has a color associated, and it is put in different up and down of the timeline for both
teams.
In the control panel used to setup the software (Chapter 4), there is a list where
events can be selected and highlighted. The Figure 3.16 illustrates the complete
timeline including all listed features.
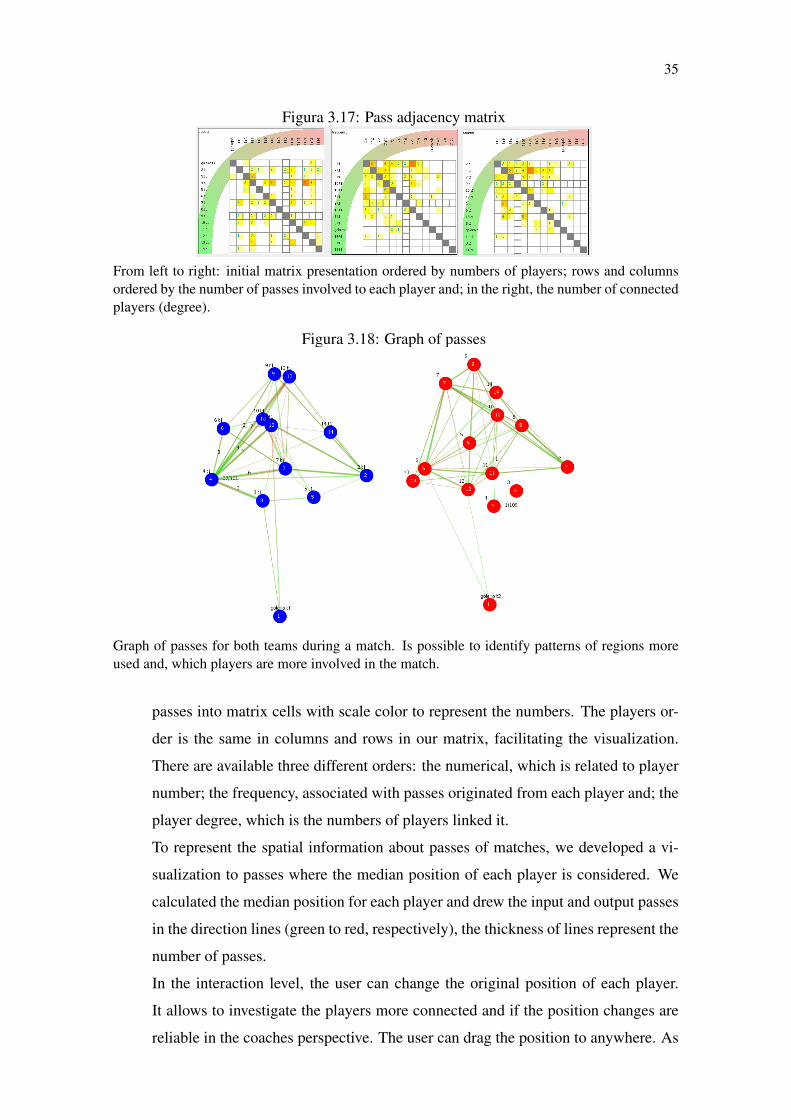
• Passes Analysis: in the reference (ANDERSON; SALLY, 2013) one of the secrets
of successful teams is the quality and format of consecutive passes. A system based
on game phases is focused on how to represent these passes (PERIN; VUILLE-
MOT; FEKETE, 2013). In a low level, our system provides two graphs associated
with passes (Figure 3.17, 3.18). The first is the adjacency matrix, numbering the
Figura 3.16: VSMA Timeline
The timeline was composed by: the background color which identifies the ball possession; mainevents associated with colored squares and; black brackets which are responsible to control theinitial and final time of analysis.
35
Figura 3.17: Pass adjacency matrix
From left to right: initial matrix presentation ordered by numbers of players; rows and columnsordered by the number of passes involved to each player and; in the right, the number of connectedplayers (degree).
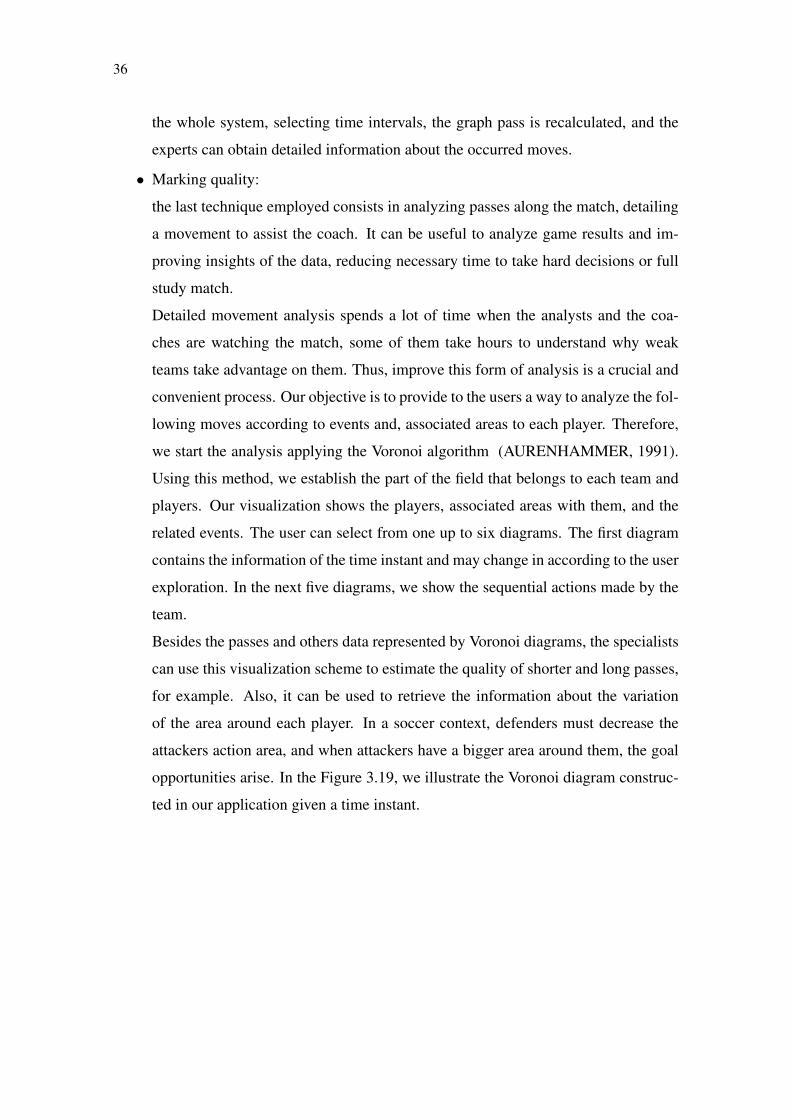
Figura 3.18: Graph of passes
Graph of passes for both teams during a match. Is possible to identify patterns of regions moreused and, which players are more involved in the match.
passes into matrix cells with scale color to represent the numbers. The players or-
der is the same in columns and rows in our matrix, facilitating the visualization.
There are available three different orders: the numerical, which is related to player
number; the frequency, associated with passes originated from each player and; the
player degree, which is the numbers of players linked it.
To represent the spatial information about passes of matches, we developed a vi-
sualization to passes where the median position of each player is considered. We
calculated the median position for each player and drew the input and output passes
in the direction lines (green to red, respectively), the thickness of lines represent the
number of passes.
In the interaction level, the user can change the original position of each player.
It allows to investigate the players more connected and if the position changes are
reliable in the coaches perspective. The user can drag the position to anywhere. As
36
the whole system, selecting time intervals, the graph pass is recalculated, and the
experts can obtain detailed information about the occurred moves.
• Marking quality:
the last technique employed consists in analyzing passes along the match, detailing
a movement to assist the coach. It can be useful to analyze game results and im-
proving insights of the data, reducing necessary time to take hard decisions or full
study match.
Detailed movement analysis spends a lot of time when the analysts and the coa-
ches are watching the match, some of them take hours to understand why weak
teams take advantage on them. Thus, improve this form of analysis is a crucial and
convenient process. Our objective is to provide to the users a way to analyze the fol-
lowing moves according to events and, associated areas to each player. Therefore,
we start the analysis applying the Voronoi algorithm (AURENHAMMER, 1991).
Using this method, we establish the part of the field that belongs to each team and
players. Our visualization shows the players, associated areas with them, and the
related events. The user can select from one up to six diagrams. The first diagram
contains the information of the time instant and may change in according to the user
exploration. In the next five diagrams, we show the sequential actions made by the
team.
Besides the passes and others data represented by Voronoi diagrams, the specialists
can use this visualization scheme to estimate the quality of shorter and long passes,
for example. Also, it can be used to retrieve the information about the variation
of the area around each player. In a soccer context, defenders must decrease the
attackers action area, and when attackers have a bigger area around them, the goal
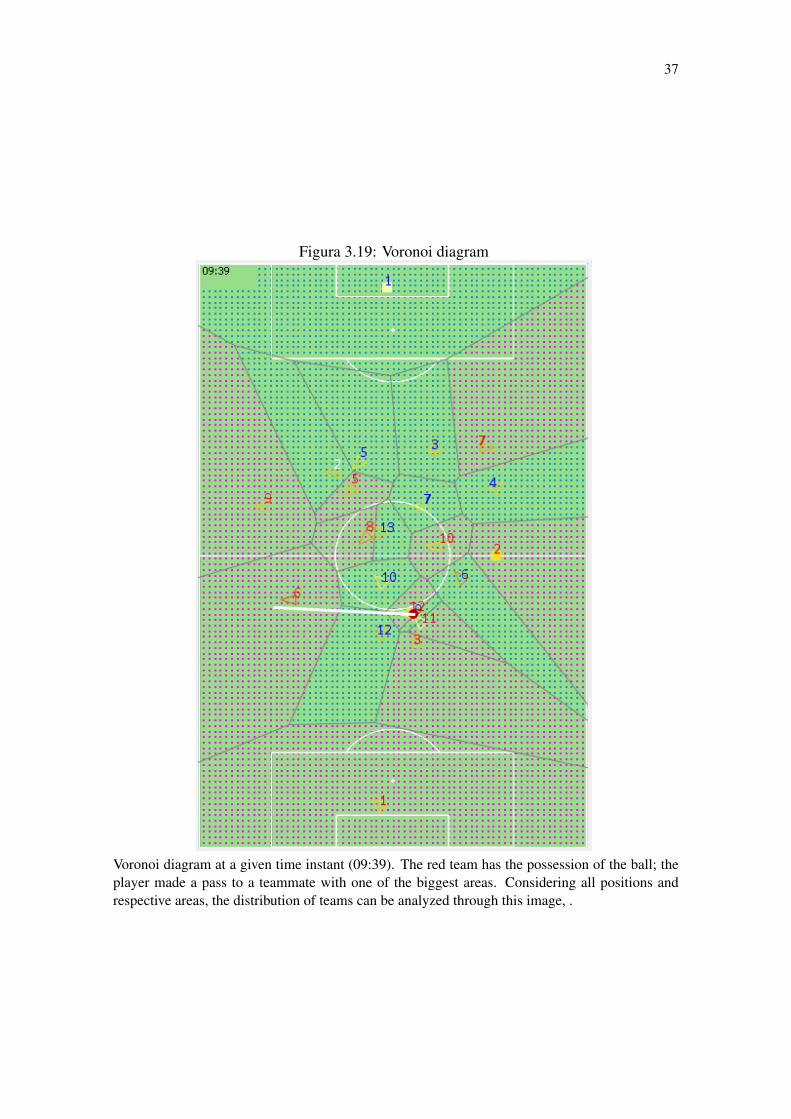
opportunities arise. In the Figure 3.19, we illustrate the Voronoi diagram construc-
ted in our application given a time instant.
37
Figura 3.19: Voronoi diagram
Voronoi diagram at a given time instant (09:39). The red team has the possession of the ball; theplayer made a pass to a teammate with one of the biggest areas. Considering all positions andrespective areas, the distribution of teams can be analyzed through this image, .
38
4 EXPERIMENTS AND RESULTS
In this chapter, we present the results obtained using VSMA tool. There is a great
number of system configuration, summarizing the results founded, revealing interesting
patterns with respect to the data. We start this chapter with describing the dataset proper-
ties; the results section will present the complete tool and finally; in the last section, we
show a positive expertise feedback.
4.1 Dataset
According to the expertises, to create the dataset they used an automatic tracking
method via a DVideo software interface (BARROS et al., 2006; BARROS et al., 2006),
they obtained the trajectories of all players in each match. DVideo software has an au-
tomatic tracking rate of 94% for the processed frame, an average error of 0.3 m for the
player position determination and an average error of 1.4% for the distance covered by
players (BARROS et al., 2006; FIGUEROA; LEITE; BARROS, 2006; MISUTA, 2009).
Prior to the games, they measured specific points on the pitch with a tape measure to
calculate image-object transformations for the calibration of the cameras. After measu-
ring the players positions from the video sequences, they constructed 2D coordinates on a
pitch coordinate system using a direct linear transformation (ABDEL-AZIZ; KARARA;
HAUCK, 2015).
A Butterworth third-order low-pass digital filter with a cut-off frequency of 0.4
Hz filtered the 2D coordinates of all of the players. After obtaining the players 2D co-
ordinates, DVideo software was used to determine the players technical actions. DVideo
software has an interface developed for studying football matches. While the operator
watches the match in DVideo software, when an event happens (passing, shot on goal,
tackle, foul, etc.), he identifies with the mouse in a bar which action was performed and
which player performed this action. Once the players 2D coordinates as a function of time
were determined, at the end of the analysis, we created a matrix that stored the technical
action information of all of the players, the instant when these actions occurred, and the
2D coordinates of where the players were positioned during the action.
The final result is a dataset organized into separate files, each representing a half-
time, consisting of approximately 2700 positions for each player. The tracking informa-
tion has been obtained by automatic tracking of video data of the respective matches,
39
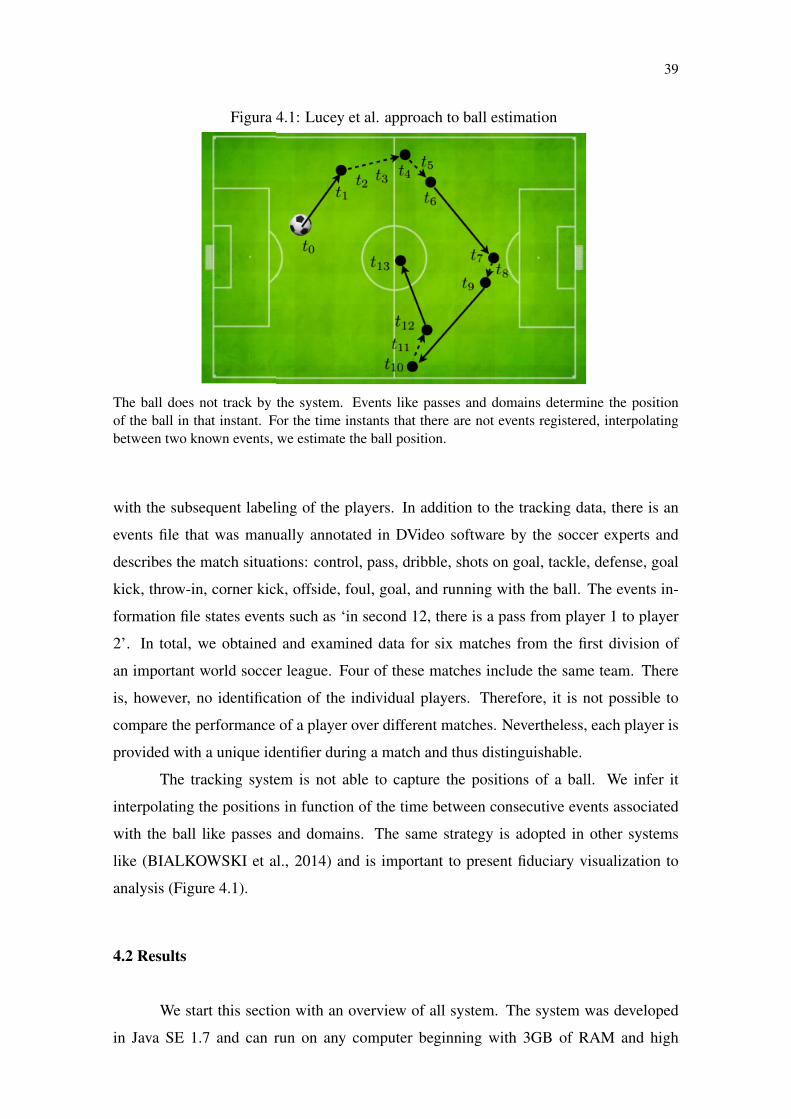
Figura 4.1: Lucey et al. approach to ball estimation
The ball does not track by the system. Events like passes and domains determine the positionof the ball in that instant. For the time instants that there are not events registered, interpolatingbetween two known events, we estimate the ball position.
with the subsequent labeling of the players. In addition to the tracking data, there is an
events file that was manually annotated in DVideo software by the soccer experts and
describes the match situations: control, pass, dribble, shots on goal, tackle, defense, goal
kick, throw-in, corner kick, offside, foul, goal, and running with the ball. The events in-
formation file states events such as ‘in second 12, there is a pass from player 1 to player
2’. In total, we obtained and examined data for six matches from the first division of
an important world soccer league. Four of these matches include the same team. There
is, however, no identification of the individual players. Therefore, it is not possible to
compare the performance of a player over different matches. Nevertheless, each player is
provided with a unique identifier during a match and thus distinguishable.
The tracking system is not able to capture the positions of a ball. We infer it
interpolating the positions in function of the time between consecutive events associated
with the ball like passes and domains. The same strategy is adopted in other systems
like (BIALKOWSKI et al., 2014) and is important to present fiduciary visualization to
analysis (Figure 4.1).
4.2 Results
We start this section with an overview of all system. The system was developed
in Java SE 1.7 and can run on any computer beginning with 3GB of RAM and high
40
resolution, for example, 1920x1080. Even so, there is no impediment to execute the
software in any resolution available. The system platform is independent, working fine
on Mac, Linux, and Windows operate systems. During the development, we incorporate
concepts from design patterns and computational interfaces. The first one was used to
facilitate the integration of new techniques along the project, many are self-sufficing and
not lose any function working alone. The final version of the interface was influenced
by many concepts and studies based on computational interfaces and user adaptability,
becoming easy to new users and non-experienced with apps.
Comparing our system and techniques with others (PERIN; VUILLEMOT; FE-
KETE, 2013; JANETZKO et al., 2014; BIALKOWSKI et al., 2014), we perceive an
increase of possible tasks. Similar to those works, we allow temporal segmentation and
include new approaches to spatial segmentation, also there is a lot of interactions concepts
based on (AIGNER et al., 2011) covering at least 8 of 9 well-known techniques proposed
with different levels of configurations according to each specifc method.
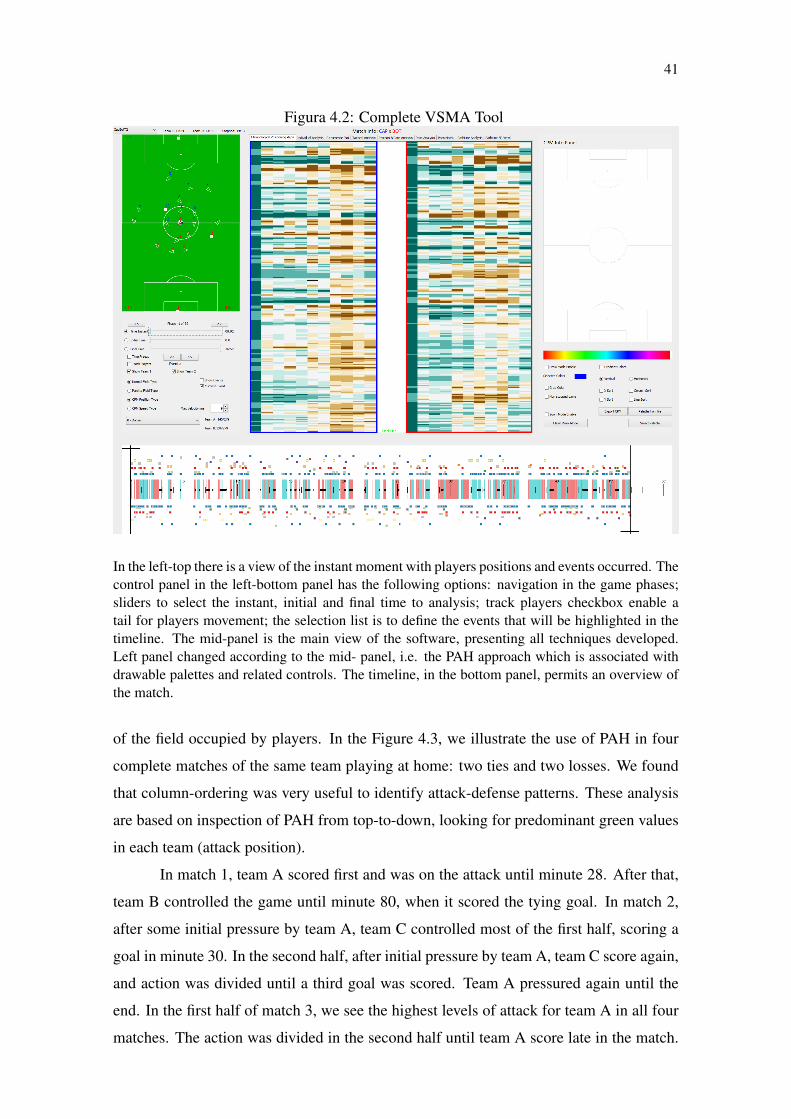
As can be seen in Figure 4.2, the system is composed of five parts: main match
view, control panel, technique overview, help side panel and timeline. The match view
is a miniature of the game moments, every change in time corresponds to a change in
this view. So, the user knows what happens in this first view, identifying the players,
movements direction, instantaneous velocities, and ball events. The control panel is a
global system control where we can select and define what moment of the match is being
analyzed. Also, we allow the selection to key points in miniature view: as the visibility
of team, the track of players, the selection of events, and more.
The techniques are developed to run in the middle panel; this is a tabbed panel
where the users can select which method they will use to analyze the game, teams or
players. The help side panel contains separated controls to each technique and change
according to mid panel selection. The last component of our interface is the timeline that
was explained in Chapter 3. Some techniques not present a full evaluation, because they
work as a helper to our project and not provide meaningful results alone, e.g. timeline.
As cited in the first chapter, we use the research questions as a guideline to develop
the entire tool. We adopt the methodology of SDLC, software development life cycle, rei-
terating the the requirements raised by expers in each iteration, evaluating the techniques
with tests and considering different designs seeking out the usability for non-experts in
computers softwares.
The first design we evaluate is the PAH, which allows one to identify the regions
41
Figura 4.2: Complete VSMA Tool
In the left-top there is a view of the instant moment with players positions and events occurred. Thecontrol panel in the left-bottom panel has the following options: navigation in the game phases;sliders to select the instant, initial and final time to analysis; track players checkbox enable atail for players movement; the selection list is to define the events that will be highlighted in thetimeline. The mid-panel is the main view of the software, presenting all techniques developed.Left panel changed according to the mid- panel, i.e. the PAH approach which is associated withdrawable palettes and related controls. The timeline, in the bottom panel, permits an overview ofthe match.
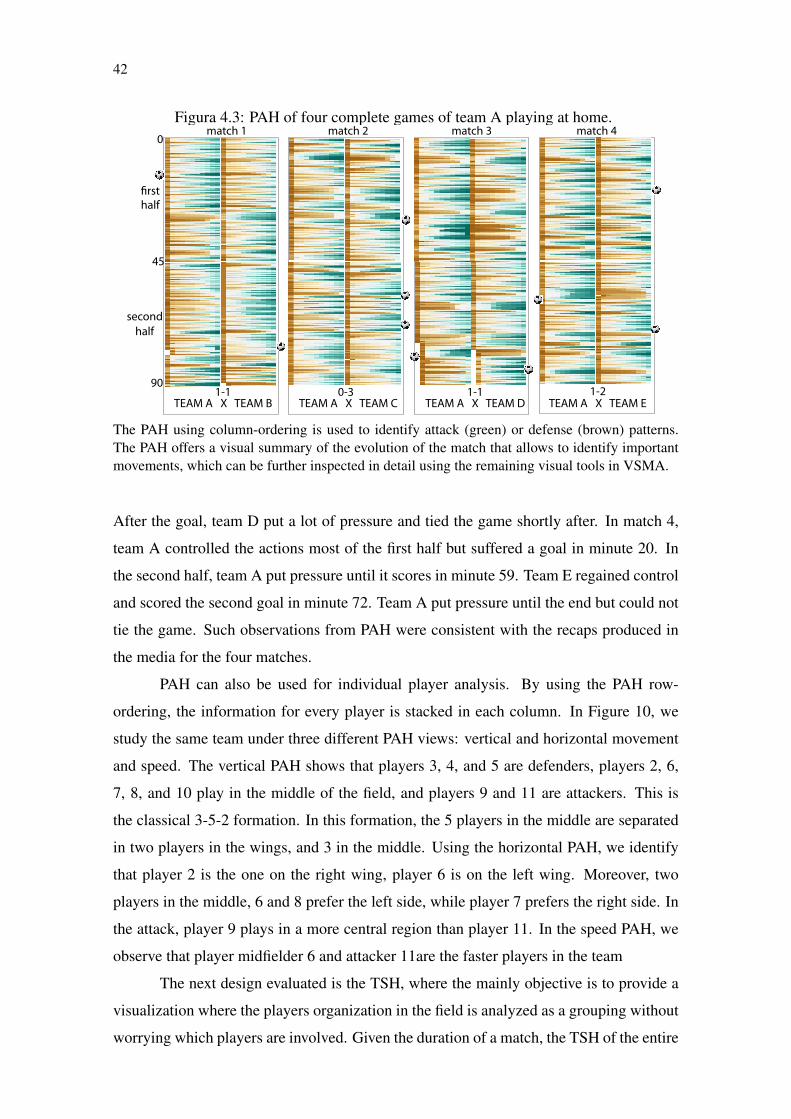
of the field occupied by players. In the Figure 4.3, we illustrate the use of PAH in four
complete matches of the same team playing at home: two ties and two losses. We found
that column-ordering was very useful to identify attack-defense patterns. These analysis
are based on inspection of PAH from top-to-down, looking for predominant green values
in each team (attack position).
In match 1, team A scored first and was on the attack until minute 28. After that,
team B controlled the game until minute 80, when it scored the tying goal. In match 2,
after some initial pressure by team A, team C controlled most of the first half, scoring a
goal in minute 30. In the second half, after initial pressure by team A, team C score again,
and action was divided until a third goal was scored. Team A pressured again until the
end. In the first half of match 3, we see the highest levels of attack for team A in all four
matches. The action was divided in the second half until team A score late in the match.
42
Figura 4.3: PAH of four complete games of team A playing at home.
12
1-1 0-3 1-1 1-2TEAM A X TEAM B TEAM A X TEAM C TEAM A X TEAM D TEAM A X TEAM E
first half
second half
0
45
90
match 1 match 2 match 3 match 4
The PAH using column-ordering is used to identify attack (green) or defense (brown) patterns.The PAH offers a visual summary of the evolution of the match that allows to identify importantmovements, which can be further inspected in detail using the remaining visual tools in VSMA.
After the goal, team D put a lot of pressure and tied the game shortly after. In match 4,
team A controlled the actions most of the first half but suffered a goal in minute 20. In
the second half, team A put pressure until it scores in minute 59. Team E regained control
and scored the second goal in minute 72. Team A put pressure until the end but could not
tie the game. Such observations from PAH were consistent with the recaps produced in
the media for the four matches.
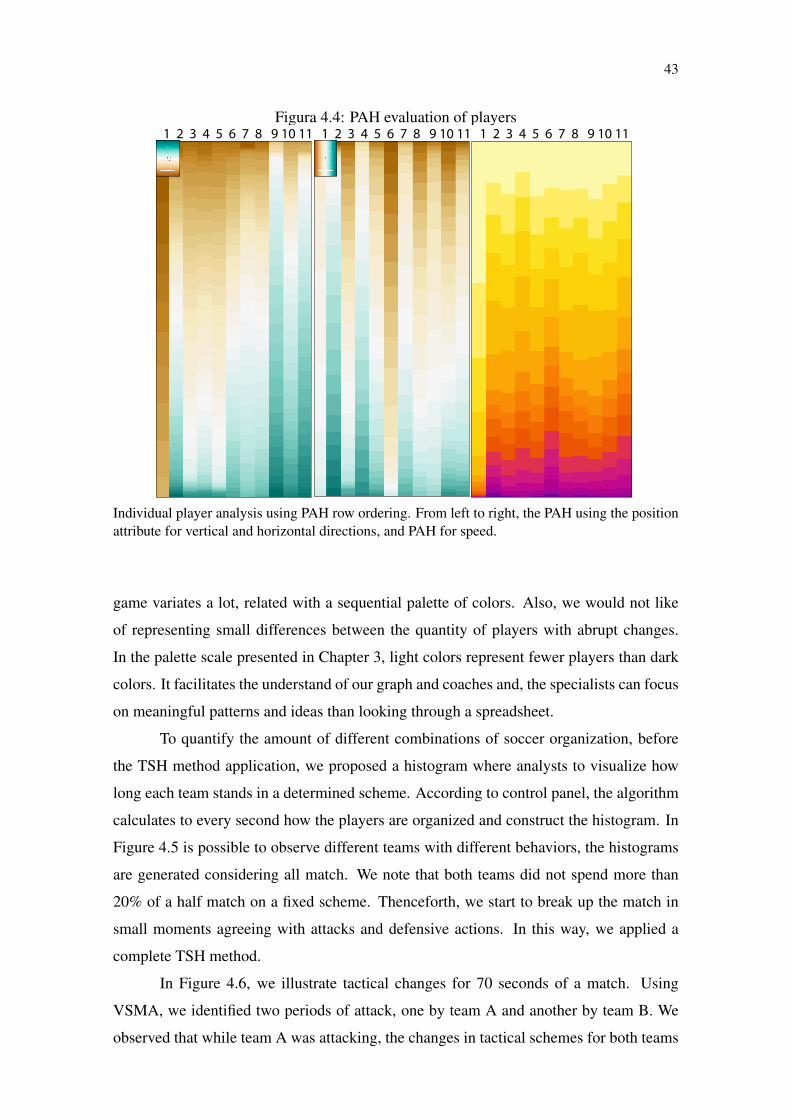
PAH can also be used for individual player analysis. By using the PAH row-
ordering, the information for every player is stacked in each column. In Figure 10, we
study the same team under three different PAH views: vertical and horizontal movement
and speed. The vertical PAH shows that players 3, 4, and 5 are defenders, players 2, 6,
7, 8, and 10 play in the middle of the field, and players 9 and 11 are attackers. This is
the classical 3-5-2 formation. In this formation, the 5 players in the middle are separated
in two players in the wings, and 3 in the middle. Using the horizontal PAH, we identify
that player 2 is the one on the right wing, player 6 is on the left wing. Moreover, two
players in the middle, 6 and 8 prefer the left side, while player 7 prefers the right side. In
the attack, player 9 plays in a more central region than player 11. In the speed PAH, we
observe that player midfielder 6 and attacker 11are the faster players in the team
The next design evaluated is the TSH, where the mainly objective is to provide a
visualization where the players organization in the field is analyzed as a grouping without
worrying which players are involved. Given the duration of a match, the TSH of the entire
43
Figura 4.4: PAH evaluation of players1 2 3 4 5 6 7 8 9 10 11 1 2 3 4 5 6 7 8 9 10 11 1 2 3 4 5 6 7 8 9 10 11
Individual player analysis using PAH row ordering. From left to right, the PAH using the positionattribute for vertical and horizontal directions, and PAH for speed.
game variates a lot, related with a sequential palette of colors. Also, we would not like
of representing small differences between the quantity of players with abrupt changes.
In the palette scale presented in Chapter 3, light colors represent fewer players than dark
colors. It facilitates the understand of our graph and coaches and, the specialists can focus
on meaningful patterns and ideas than looking through a spreadsheet.
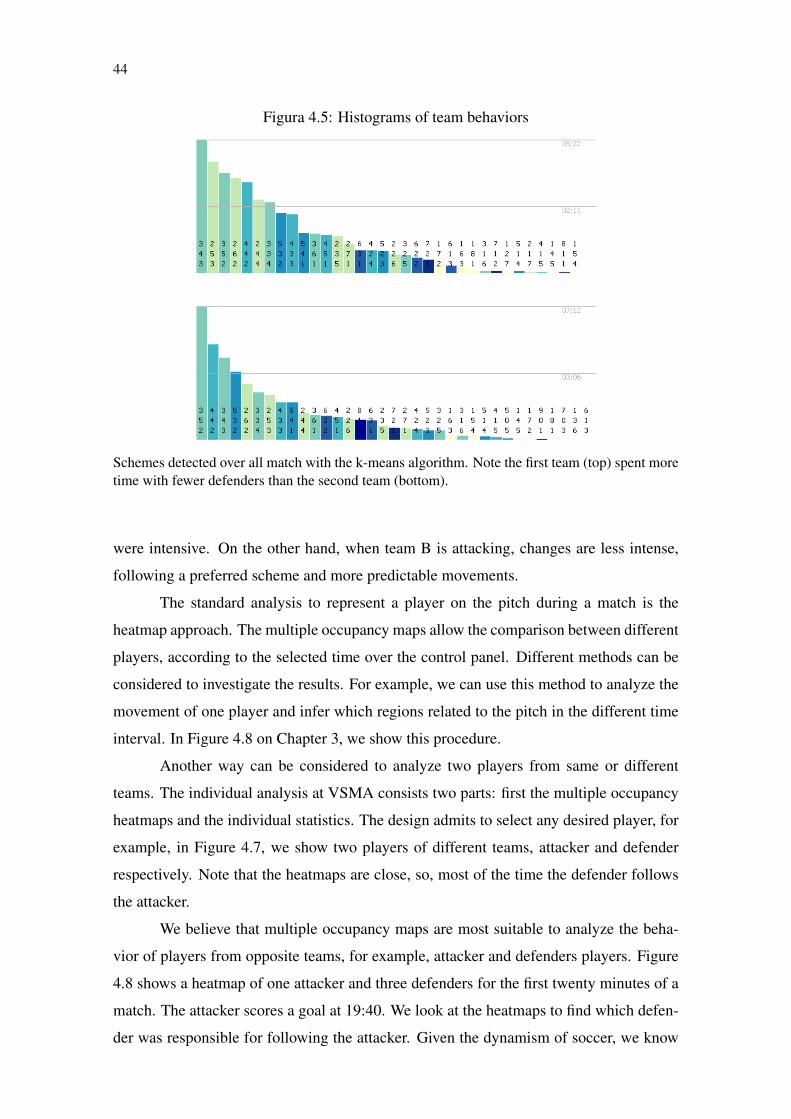
To quantify the amount of different combinations of soccer organization, before
the TSH method application, we proposed a histogram where analysts to visualize how
long each team stands in a determined scheme. According to control panel, the algorithm
calculates to every second how the players are organized and construct the histogram. In
Figure 4.5 is possible to observe different teams with different behaviors, the histograms
are generated considering all match. We note that both teams did not spend more than
20% of a half match on a fixed scheme. Thenceforth, we start to break up the match in
small moments agreeing with attacks and defensive actions. In this way, we applied a
complete TSH method.
In Figure 4.6, we illustrate tactical changes for 70 seconds of a match. Using
VSMA, we identified two periods of attack, one by team A and another by team B. We
observed that while team A was attacking, the changes in tactical schemes for both teams
44
Figura 4.5: Histograms of team behaviors
Schemes detected over all match with the k-means algorithm. Note the first team (top) spent moretime with fewer defenders than the second team (bottom).
were intensive. On the other hand, when team B is attacking, changes are less intense,
following a preferred scheme and more predictable movements.
The standard analysis to represent a player on the pitch during a match is the
heatmap approach. The multiple occupancy maps allow the comparison between different
players, according to the selected time over the control panel. Different methods can be
considered to investigate the results. For example, we can use this method to analyze the
movement of one player and infer which regions related to the pitch in the different time
interval. In Figure 4.8 on Chapter 3, we show this procedure.
Another way can be considered to analyze two players from same or different
teams. The individual analysis at VSMA consists two parts: first the multiple occupancy
heatmaps and the individual statistics. The design admits to select any desired player, for
example, in Figure 4.7, we show two players of different teams, attacker and defender
respectively. Note that the heatmaps are close, so, most of the time the defender follows
the attacker.
We believe that multiple occupancy maps are most suitable to analyze the beha-
vior of players from opposite teams, for example, attacker and defenders players. Figure
4.8 shows a heatmap of one attacker and three defenders for the first twenty minutes of a
match. The attacker scores a goal at 19:40. We look at the heatmaps to find which defen-
der was responsible for following the attacker. Given the dynamism of soccer, we know
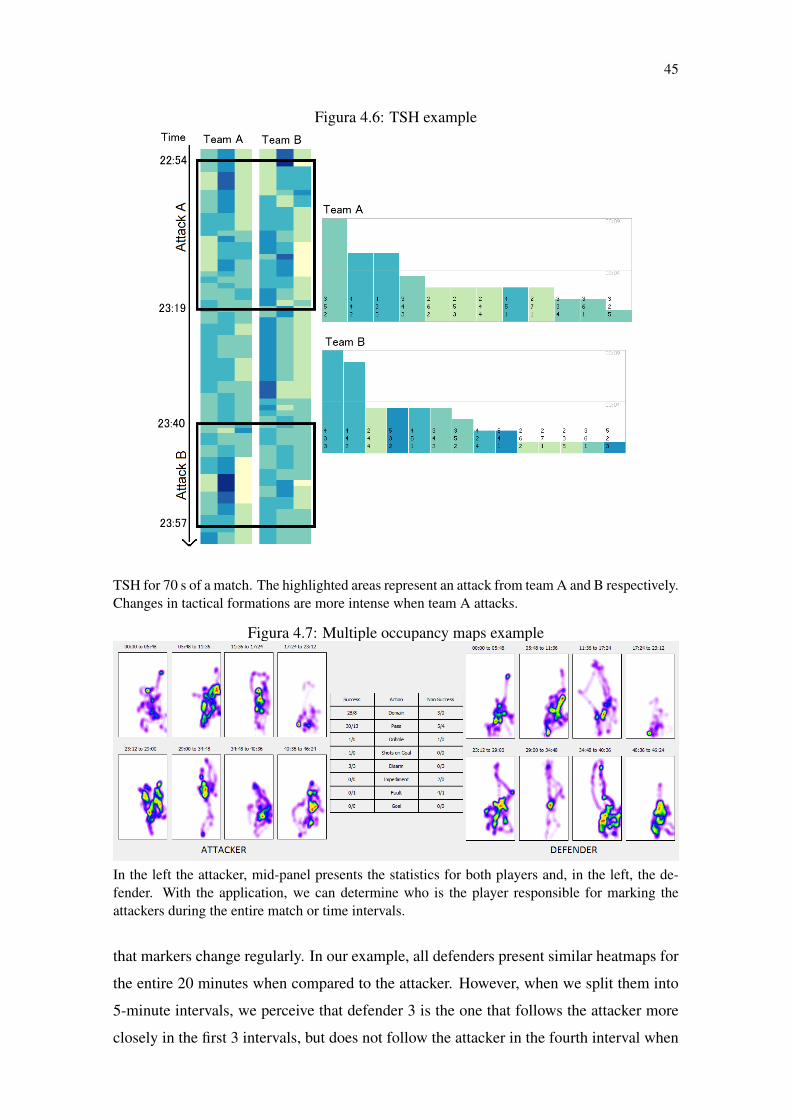
45
Figura 4.6: TSH example
TSH for 70 s of a match. The highlighted areas represent an attack from team A and B respectively.Changes in tactical formations are more intense when team A attacks.
Figura 4.7: Multiple occupancy maps example
In the left the attacker, mid-panel presents the statistics for both players and, in the left, the de-fender. With the application, we can determine who is the player responsible for marking theattackers during the entire match or time intervals.
that markers change regularly. In our example, all defenders present similar heatmaps for
the entire 20 minutes when compared to the attacker. However, when we split them into
5-minute intervals, we perceive that defender 3 is the one that follows the attacker more
closely in the first 3 intervals, but does not follow the attacker in the fourth interval when
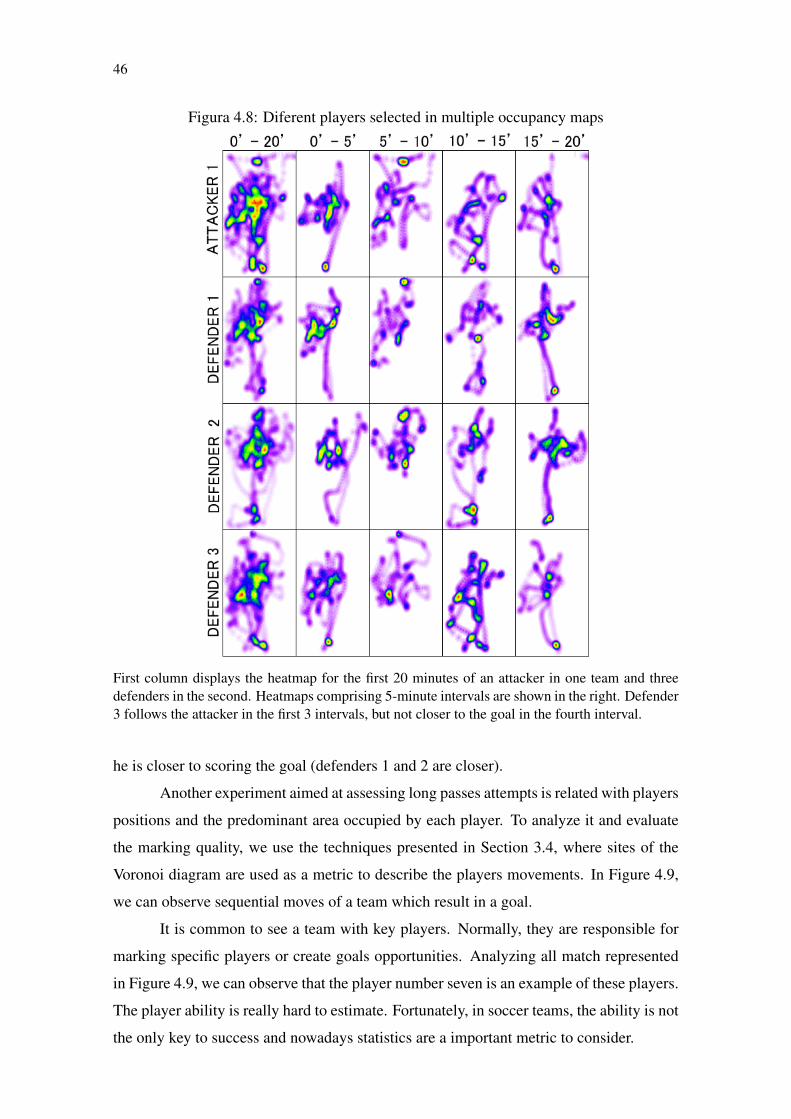
46
Figura 4.8: Diferent players selected in multiple occupancy maps
First column displays the heatmap for the first 20 minutes of an attacker in one team and threedefenders in the second. Heatmaps comprising 5-minute intervals are shown in the right. Defender3 follows the attacker in the first 3 intervals, but not closer to the goal in the fourth interval.
he is closer to scoring the goal (defenders 1 and 2 are closer).
Another experiment aimed at assessing long passes attempts is related with players
positions and the predominant area occupied by each player. To analyze it and evaluate
the marking quality, we use the techniques presented in Section 3.4, where sites of the
Voronoi diagram are used as a metric to describe the players movements. In Figure 4.9,
we can observe sequential moves of a team which result in a goal.
It is common to see a team with key players. Normally, they are responsible for
marking specific players or create goals opportunities. Analyzing all match represented
in Figure 4.9, we can observe that the player number seven is an example of these players.
The player ability is really hard to estimate. Fortunately, in soccer teams, the ability is not
the only key to success and nowadays statistics are a important metric to consider.
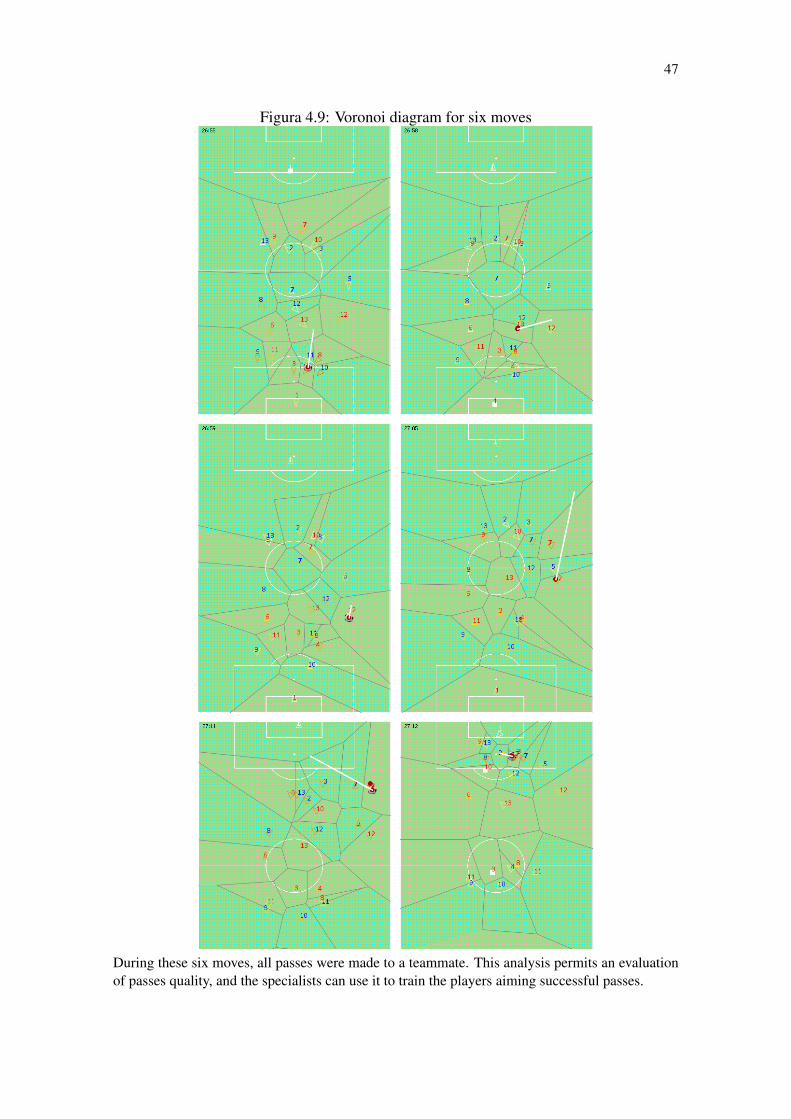
47
Figura 4.9: Voronoi diagram for six moves
During these six moves, all passes were made to a teammate. This analysis permits an evaluationof passes quality, and the specialists can use it to train the players aiming successful passes.
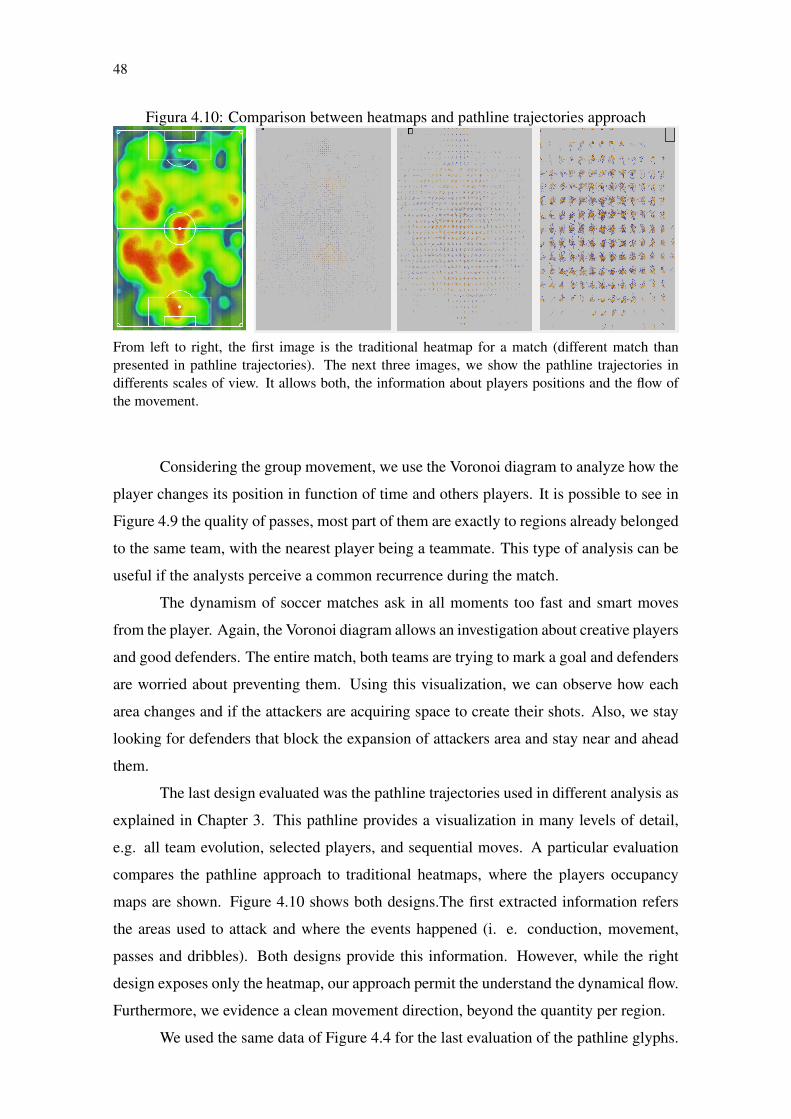
48
Figura 4.10: Comparison between heatmaps and pathline trajectories approach
From left to right, the first image is the traditional heatmap for a match (different match thanpresented in pathline trajectories). The next three images, we show the pathline trajectories indifferents scales of view. It allows both, the information about players positions and the flow ofthe movement.
Considering the group movement, we use the Voronoi diagram to analyze how the
player changes its position in function of time and others players. It is possible to see in
Figure 4.9 the quality of passes, most part of them are exactly to regions already belonged
to the same team, with the nearest player being a teammate. This type of analysis can be
useful if the analysts perceive a common recurrence during the match.
The dynamism of soccer matches ask in all moments too fast and smart moves
from the player. Again, the Voronoi diagram allows an investigation about creative players
and good defenders. The entire match, both teams are trying to mark a goal and defenders
are worried about preventing them. Using this visualization, we can observe how each
area changes and if the attackers are acquiring space to create their shots. Also, we stay
looking for defenders that block the expansion of attackers area and stay near and ahead
them.
The last design evaluated was the pathline trajectories used in different analysis as
explained in Chapter 3. This pathline provides a visualization in many levels of detail,
e.g. all team evolution, selected players, and sequential moves. A particular evaluation
compares the pathline approach to traditional heatmaps, where the players occupancy
maps are shown. Figure 4.10 shows both designs.The first extracted information refers
the areas used to attack and where the events happened (i. e. conduction, movement,
passes and dribbles). Both designs provide this information. However, while the right
design exposes only the heatmap, our approach permit the understand the dynamical flow.
Furthermore, we evidence a clean movement direction, beyond the quantity per region.
We used the same data of Figure 4.4 for the last evaluation of the pathline glyphs.
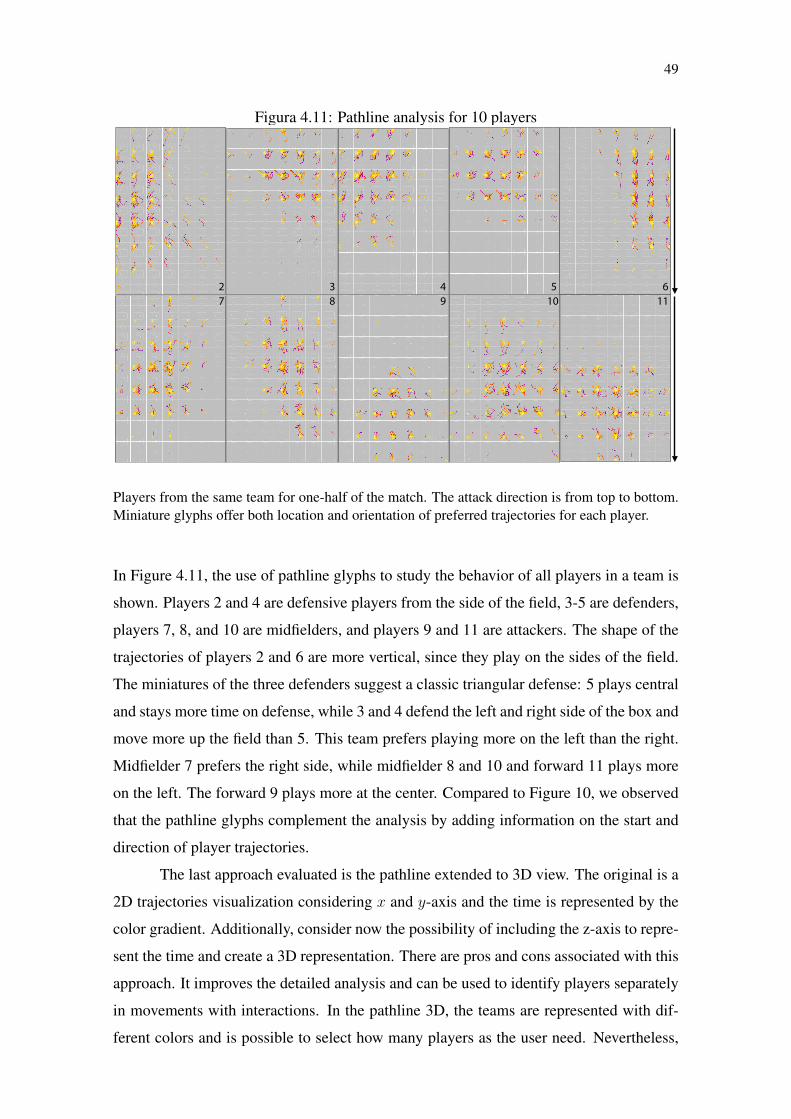
49
Figura 4.11: Pathline analysis for 10 players
2 3 4 5 67 8 9 10 11
Players from the same team for one-half of the match. The attack direction is from top to bottom.Miniature glyphs offer both location and orientation of preferred trajectories for each player.
In Figure 4.11, the use of pathline glyphs to study the behavior of all players in a team is
shown. Players 2 and 4 are defensive players from the side of the field, 3-5 are defenders,
players 7, 8, and 10 are midfielders, and players 9 and 11 are attackers. The shape of the
trajectories of players 2 and 6 are more vertical, since they play on the sides of the field.
The miniatures of the three defenders suggest a classic triangular defense: 5 plays central
and stays more time on defense, while 3 and 4 defend the left and right side of the box and
move more up the field than 5. This team prefers playing more on the left than the right.
Midfielder 7 prefers the right side, while midfielder 8 and 10 and forward 11 plays more
on the left. The forward 9 plays more at the center. Compared to Figure 10, we observed
that the pathline glyphs complement the analysis by adding information on the start and
direction of player trajectories.
The last approach evaluated is the pathline extended to 3D view. The original is a
2D trajectories visualization considering x and y-axis and the time is represented by the
color gradient. Additionally, consider now the possibility of including the z-axis to repre-
sent the time and create a 3D representation. There are pros and cons associated with this
approach. It improves the detailed analysis and can be used to identify players separately
in movements with interactions. In the pathline 3D, the teams are represented with dif-
ferent colors and is possible to select how many players as the user need. Nevertheless,
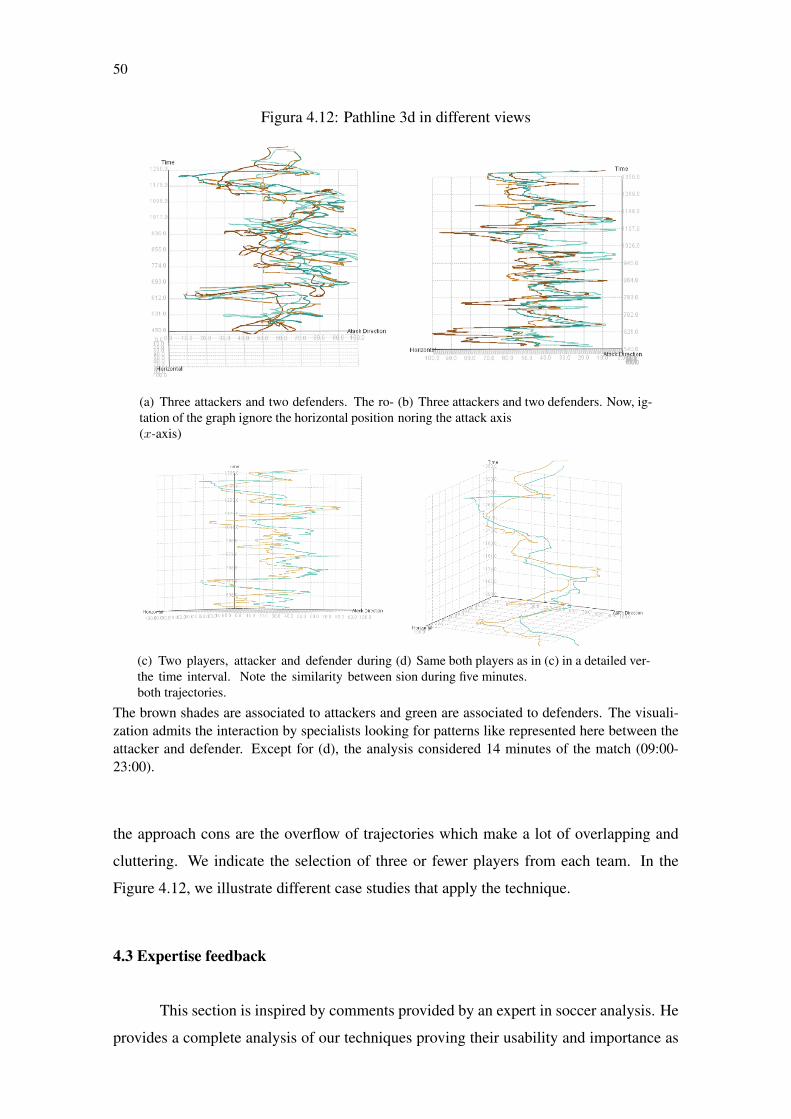
50
Figura 4.12: Pathline 3d in different views
(a) Three attackers and two defenders. The ro-tation of the graph ignore the horizontal position(x-axis)
(b) Three attackers and two defenders. Now, ig-noring the attack axis
(c) Two players, attacker and defender duringthe time interval. Note the similarity betweenboth trajectories.
(d) Same both players as in (c) in a detailed ver-sion during five minutes.
The brown shades are associated to attackers and green are associated to defenders. The visuali-zation admits the interaction by specialists looking for patterns like represented here between theattacker and defender. Except for (d), the analysis considered 14 minutes of the match (09:00-23:00).
the approach cons are the overflow of trajectories which make a lot of overlapping and
cluttering. We indicate the selection of three or fewer players from each team. In the
Figure 4.12, we illustrate different case studies that apply the technique.
4.3 Expertise feedback
This section is inspired by comments provided by an expert in soccer analysis. He
provides a complete analysis of our techniques proving their usability and importance as
51
a tool to assist technical staff.
The first feedback was about the PAH, explained in section 3.1. Second the spe-
cialist, the concept of PAH allows a comprehension of two significant features of the
soccer match, one related to physical performance, and other related to tactical aspects.
Players physical performance has received particular attention in specialized and recent
studies of the sport. To understand the physical demands of the match, the researchers
have analyzed the percentage of time or distance covered in a determined range of veloci-
ties (BARROS et al., 2007; SALVO et al., 2009). Although this is valuable information
about players performance, it provides a general feature. On the other hand, VSMA pro-
vides similar information about players velocities (1D-mapping) as a function of the time.
Furthermore, it allows comparing who are the players that maintained greater periods of
high-intensity running and, mainly, when they performed as a function of the time. If such
analysis is done during the match, it is possible to identify when a given player presented
a performance decrease that may be associated with fatigue, for example.
From a tactical perspective, the 2D-mapping yields data about where players (and,
consequently, the team) are concentrated during the match. Particularly, y-column orde-
ring provides visual information about the attacking-defending interaction between the
teams. Thus, it is possible to visualize during the entire match when teams predominated
in attacking and defending pitch. On the other hand, x-column ordering shows if there is
a predominance of players in the wings or the central part of the pitch. A possible pattern
can be detected combining the 1D-mapping and 2D-mapping. Thus, it is feasible to asso-
ciate the player position with the high-intensity running that he performed throughout the
match. Such information provides valuable insight to coaches to elaborate physical and
tactical drills that simulate real match situations.
From players position, VSMA has an important tool (TSH) that identify the cluster
of players during the match, as a collective behavior. These data has a special implication
because tactical scheme objectively. A previous study provided such information sub-
jectively from 2D-coordinates where players performed technical actions (BARROS et
al., 2006). However, the TSH has the advantage of to characterize the scheme conside-
ring players position as the function of time, not only when they performed the technical
actions. Moreover, during the match teams may change their strategies according to the
scoreline. Thus, TSH yields the frequencies of each tactical scheme used during the game.
In a more individual perspective, the multiple heatmaps approach are a useful tool
to identify the pitch regions where the players visited most, which is clearly associated
52
with the team tactical scheme. A recent study evaluated the features of heatmaps accor-
ding to players positions (COUCEIRO et al., 2014). The authors presented the idea of
stability for soccer as players capability to maintain his trajectory within a specific region
(such as his tactical position on the field). The existence of a stable equilibrium point
implies the existence of a ‘restoring force’that is directed towards the equilibrium point.
Thus, players usually converge at an equilibrium point that is defined by their tactical
position. From heatmaps, players positional variability during the competition was also
reported in literature (MOURA et al., 2015). Although VSMA also allows investiga-
ting players heatmaps during the entire match, we emphasize that heatmaps can also be
extracted for a lower range of time, for example, for each five min of the match or less.
Therefore, the system is more flexible to understand how players vary their tactical beha-
vior during the match and the, with cluster analysis described above, to understand the
consequences of this variation on the tactical scheme.
Football tactics, as an invasion on sport, not only varies in the range of playing
actions but also reproduces the relative use of space by players to determine how they use
these aspects of performance to overcome their opponents. Voronoi diagrams have been
presented in the specialized literature as an effective tool to characterize how players share
the spaces among them citetaki1996, voronoi2, geometricvoronoi. With this analysis im-
plemented in VSMA, players organization during offensive sequences can be visualized
to understand how teammates and opponent interact and how their behavior are associated
with success actions, such as a shot on goal, during the match. The adopted approach may
be extended to other match situations (e.g., when teams regain ball possession) where the
actions taken at any instant in time by each player are associated with the space they share.
With the players trajectories and the pathline proposed, it is possible to identify
flow patterns of a given player or group of teammates. In other words, pathline trajectories
may provide insights about what usually players do when they are in specific regions of
the pitch. Thus, it is possible to identify a general behavior of the players trajectories
when they are attacking and defending. For example, when a given player controls de
ball on the left side of the attack, which direction he and his teammates usually move?
Thus, such analysis can be extended to specific regions of the pitch as well as specific
players and periods of the match.
Regarding a systematic approach, during the match two complex dynamical sys-
tems, represented by the players of each team, are conflicting and interacting to reach
the same aim: to score a goal. Therefore, attempts are made to perturb the stability of
53
the opponent system (FRENCKEN; LEMMINK, 2008). Perturbation in football was
defined as an incident that changes the rhythmic flow of attacking and defending. This
incident may be a key event during the match because may lead to a shooting opportu-
nity (FRENCKEN; LEMMINK, 2008). From this perspective, movement trajectories
of attacker-defender dyads (defined as the closest opponents) have been investigated in
literature and elucidated the comprehension of the soccer match as a complex system
(TRAVASSOS et al., 2011; VILAR et al., 2014).
A more in deep analysis of the trajectories of attacker-defender dyads is provided
by VSMA. The 3D plot shows the behavior of selected players, for example, two opponent
teams during an offensive sequence. In the figure 3.15 is possible to observe that at
the beginning of the sequence players are synchronized (moving together) and close to
each other. However, during the offensive sequence, the distance between them increase,
mainly at the end of the attack. Specifically, this situation resulted in a goal scored by
the attacker, showing the meaningfulness of such analysis. The analysis can be extended
to other dyads, such as the ones that directly participated from the sequence to diagnose
scoring opportunities causes.
54
5 CONCLUSION AND FUTURE WORK
In this work, we described VMSA, a visual analytics tool for soccer matches. The
team behind the design of VMSA included soccer experts that supplied the soccer data
used in the analysis, as well as helped in all stages of development and evaluation. Central
to our ideas was the analysis of the evolution of the match from a team or individual pers-
pective. In VSMA, we proposed PAH, a heatmap based approach to summarize player
attributes such as position and speed, and offer an at-a-glance view of the match. Simi-
larly, the TSH is also a heatmap approach to allow the analysis of the changes in tactical
formation during the match. To further investigate player trajectories, we used the con-
cept of small multiples to improve the analysis of heatmaps. Finally, we extended an
approach originally proposed to analyze 2D steady flows, the pathline glyphs, to help un-
derstand the intricate trajectories taken by players during a match. Results were presented
revealing interesting information from the data, and a discussion including feedback from
expert users was given.
There are many avenues of future work. We would like to test VSMA with a
dataset comprising more matches (e.g., all matches of a premium soccer league). Also,
we would like to incorporate machine learning and data mining algorithms to support
automated analysis of further aspects of matches.
55
REFERÊNCIAS
ABDEL-AZIZ, Y.; KARARA, H.; HAUCK, M. Direct linear transformation fromcomparator coordinates into object space coordinates in close-range photogrammetry.Photogrammetric Engineering & Remote Sensing, Elsevier, v. 81, n. 2, p. 103–107,2015.
AIGNER, W. et al. Visualization of Time-Oriented Data. 1st. ed. SpringerVerlag, 2011. 286 p. (Human-Computer Interaction). Available from Internet:<http://www.timeviz.net>.
ANDERSON, C.; SALLY, D. The Numbers Game: Why Everyhing you Know AboutFootball is Wrong. [S.l.]: Penguin, 2013.
ANDRIENKO, G.; ANDRIENKO, N. Spatio-temporal aggregation for visual analysisof movements. In: Visual Analytics Science and Technology, 2008. VAST ’08. IEEESymposium on. [S.l.: s.n.], 2008. p. 51–58.
ANDRIENKO, G. L. et al. Space transformation for understanding group movement.IEEE Transactions Visualization and Computer Graphics, v. 19, n. 12, p. 2169–2178,Dec 2013.
AURENHAMMER, F. Voronoi diagrams—a survey of a fundamental geometricdata structure. ACM Comput. Surv., ACM, New York, NY, USA, v. 23, n. 3, p.345–405, sep. 1991. ISSN 0360-0300.
BARROS, R. et al. Representation and analysis of soccer players’ actions using principalcomponents. Journal of Human Movement Studies, Teviot Scientific Publications Ltd,p. 103–116, 2006.
BARROS, R. M. et al. Analysis of the distances covered by first division brazilian soccerplayers obtained with an automatic tracking method. Journal of Sports Science andMedicine, p. 233–242, 2007.
BARROS, R. M. L. D. et al. A method to synchronise video cameras using the audioband. Journal of biomechanics, Elsevier, v. 39, n. 4, p. 776–780, 2006.
BIALKOWSKI, A. et al. Large-scale analysis of soccer matches using spatiotemporaltracking data. In: Data Mining (ICDM), 2014 IEEE International Conference on.[S.l.: s.n.], 2014. p. 725–730. ISSN 1550-4786.
CASTELLANO, J.; CASAMICHANA, D.; LAGO, C. The use of match statisticsthat discriminate between sucessful and unsucessful soccer teams. Journal of HumanKinects, v. 31, p. 137–147, 2012.
CASTRO, J. d. A. História do Futebol - Estórias da Bola - Todos os campeonatos domundo. [S.l.]: Edipromo.
CHUNG, D. et al. Knowledge-assisted ranking: A visual analytic application for sportevent data. IEEE Computer Graphics and Applications, 2015.
56
COUCEIRO, M. S. et al. Dynamical stability and predictability of football players: Thestudy of one match. Entropy, Multidisciplinary Digital Publishing Institute, v. 16, n. 2,p. 645–674, 2014.
DINKLA, K.; HENRY-RICHE, N.; WESTENBERG, M. A. Dual Adjacency Matrix:Exploring Link Groups in Dense Networks. Computer Graphics Forum, TheEurographics Association and John Wiley & Sons Ltd., 2015.
DUARTE, R. et al. Capturing complex, non-linear team behaviours during competitivefootball performance. Journal of Systems Science and Complexity, Academy ofMathematics and Systems Science, Chinese Academy of Sciences, v. 26, n. 1, p. 62–72,2013. ISSN 1009-6124.
FIFA. Fifa website. Access December/2016. Available from Internet: <http://www.fifa.com>.
FIGUEROA, P. J.; LEITE, N. J.; BARROS, R. M. Background recovering in outdoorimage sequences: An example of soccer players segmentation. Image and VisionComputing, Elsevier, v. 24, n. 4, p. 363–374, 2006.
FONSECA, S. et al. Spatial dynamics of team sports exposed by voronoi diagrams.Human Movement Science, v. 31, p. 1652–1659, 2012.
FOOTBALLDRAW. Football Manual Drawing. Access December/2016. Availablefrom Internet: <http://www.susken-rosenthal.de/fussballbilder/>.
FRENCKEN, W.; LEMMINK, K. 27 team kinematics of small-sided soccer games.Science and Football VI, p. 161, 2008.
GADE, R.; MOESLUND, T. B. Sports type classification using signature heatmaps.In: The IEEE Conference on Computer Vision and Pattern Recognition (CVPR)Workshops. [S.l.: s.n.], 2013.
GOLDSBERRY, K. Courtvision: The new visual and spatial analytics for the nba. In:MIT Sloan Analytics Conference. [S.l.: s.n.], 2012.
HENRY, N.; FEKETE, J.-D. Matlink: Enhanced matrix visualization for analyzing socialnetworks. Human-Computer Interaction - INTERACT, p. 288–302, Sep 2007.
HLAWATSCH, M. et al. Pathline Glyphs. Computer Graphics Forum, TheEurographics Association and John Wiley and Sons Ltd., 2014. ISSN 1467-8659.
JANETZKO, H. et al. Feature-driven visual analytics of soccer data. In: Visual AnalyticsScience and Technology (VAST), 2014 IEEE Conference on. [S.l.: s.n.], 2014. p.13–22.
KIM, H.-C.; KWON, O.; LI, K.-J. Spatial and spatiotemporal analysis of soccer. In:Proceedings of the 19th ACM SIGSPATIAL International Conference on Advancesin Geographic Information Systems. New York, NY, USA: ACM, 2011. (GIS ’11), p.385–388.
LAGO-PEÑAS, C. et al. Game-related statistics that discriminated winning, drawing andlosing teams from the spanish soccer league. Journal of Sports Science and Medicine,v. 9(2), p. 288–293, 2010.
57
LEGG, P. A. et al. Matchpad: Interactive glyph-based visualization for real-time sportsperformance analysis. Computer Graphics Forum, Blackwell Publishing Ltd, v. 31,n. 3pt4, p. 1255–1264, 2012. ISSN 1467-8659.
LUCEY, P. et al. Characterizing multi-agent team behavior from partial team tracings:Evidence from the english premier league. In: . [S.l.: s.n.], 2012.
LUCY, P. et al. Assessing team strategy using spatiotemporal data. ACM KnowledgeDiscovery and Data Mining Conference, 2013.
MASSARANI, L.; ABRUCIO, M. Bola no pé - a incrível história do futebol. [S.l.]:Cortez.
MISUE, K. Visualization of team skills in project-based learning. The InternationalConference on Digital Information Processing, E-Business and Cloud Computing(DIPECC2013), p. 8–15, 2013.
MISUTA, M. Analysis of the automatic tracking of players in collective sports.Unpublished PhD thesis, University of Campinas, Campinas, 2009.
MOURA, F. A. et al. Analysis of soccer players’ positional variability during the 2012uefa european championship: A case study. Journal of human kinetics, v. 47, n. 1, p.225–236, 2015.
OLIVEIRA, G. et al. Visualizing running races through the multivariate time-series ofmultiple runners. Graphics, Patterns and Images (SIBGRAPI), v. 26, p. 99–106, Aug2013.
OPTAPRO. Access December/2016. Available from Internet: <http://optasportspro.com>.
PAGE, M.; MOERE, A. Towards classifying visualization in team sports. In: ComputerGraphics, Imaging and Visualisation, 2006 International Conference on. [S.l.: s.n.],2006. p. 24–29.
PERIN, C.; VUILLEMOT, R.; FEKETE, J.-D. Soccerstories: A kick-off for visualsoccer analysis. Visualization and Computer Graphics, IEEE Transactions on, v. 19,n. 12, p. 2506–2515, Dec 2013. ISSN 1077-2626.
PROZONE. Access December/2016. Available from Internet: <http://prozonesports.com>.
SALVO, V. D. et al. Performance characteristics according to playing position in elitesoccer. International Journal of Sports Medicine, v. 28(3), p. 222–227, 2007.
SALVO, V. D. et al. Analysis of high intensity activity in premier league soccer.International journal of sports medicine, v. 30, n. 3, p. 205–212, 2009.
SAP. Access December/2016. Available from Internet: <http://go.sap.com>.
SAP. SAP website. Access December/2016. Available from Internet: <http://go.sap.com/solution/industry/sports-entertainment/match-insights.html>.
58
SILVA, R. da et al. Anomalous diffusion in the evolution of soccer championshipscores: Real data, mean-field analysis, and an agent-based model. Phys. Rev. E,American Physical Society, v. 88, p. 022136, Aug 2013. Available from Internet:<http://link.aps.org/doi/10.1103/PhysRevE.88.022136>.
SILVA, R. da et al. A simple non-markovian computational model of the statistics ofsoccer leagues: Emergence and scaling effects. Computer Physics Communications,v. 184, n. 3, p. 661 – 670, 2013. ISSN 0010-4655. Available from Internet:<http://www.sciencedirect.com/science/article/pii/S0010465512003736>.
STATS. Access December/2016. Available from Internet: <http://www.stats.com>.
TRAVASSOS, B. et al. Interpersonal coordination and ball dynamics in futsal (indoorfootball). Human Movement Science, Elsevier, v. 30, n. 6, p. 1245–1259, 2011.
TUFTE, E. Envisioning Information. Cheshire, CT, USA: Graphics Press, 1990.
VILAR, L. et al. Coordination tendencies are shaped by attacker and defenderinteractions with the goal and the ball in futsal. Human movement science, Elsevier,v. 33, p. 14–24, 2014.
59
APÊNDICE — RESUMO DA DISSERTAÇÃO
.1 Introdução
Esportes em equipe tem um processo rico e complexo para análise, este é uma das
razões pelas quais tem atraídos a atenção de muitos espectadores e o crescente investi-
mento em jogadores e equipe técnica. Estes esportes também são uma fonte de conjuntos
de dados com um alto grau de inter-relação e complexidade. Por muito tempo, futebol e
outros esportes em equipe foram praticados e vistos como pura arte, bilhões de dólares
são gastos com a tentativa de construir bons times, ganhar títulos e carregar um grande
número de fãs. Abordagens recentes em análise científica destes dados demonstraram
sucesso em contribuir nas decisões técnicas em substituição de jogadores e, ainda mais
importante, obter vantagens sobre os oponentes.
No entanto, técnicos e jogadores não possuem tempo suficiente para cobrir e ana-
lisar toda a quantidade de dados gerados. Com isso percebe-se um grande potencial para
desenvolver novas técnicas de visualização que sejam guiadas pelas propriedades futebo-
lísticas e facilitem sua análise. As técnicas apresentadas ao longo do trabalho facilitam
a interação com o conjunto de dados apresentados, como a trajetória de cada jogador
durante a partida e informações adicionais referentes aos eventos ocorridos. Tais técni-
cas foram desenvolvidas pois os métodos atuais de visualização e interação não cobriam
análise de movimentos e organização de grupos que foram os focos deste trabalho.
As principais contribuições deste trabalho são:
• Uma técnica baseada em heatmap para avaliar a evolução das partidas de futebol
como uma função da posição ou velocidade dos jogadores.
• Uma método automático para detectar esquemas táticos, juntamente com uma abor-
dagem heatmap para visualizar as alterações táticas ao longo da partida.
• Uma abordagem de múltiplos heatmaps que permite a comparação mais fina entre
diferentes jogadores.
• A adaptação de uma técnica conhecida por Pathline Glyphs que nos permite a aná-
lise das trajetórias dos jogadores de acordo com regiões do campo.
Futebol é um jogo complexo, com uma análise extremamente rigorosa e detalhada.
Para guiar o desenvolvimento deste trabalho, nós criamos, em colaboração com especia-
listas, uma série de requisitos que nossa ferramenta deveria garantir. Uma das dificuldades
60
levantadas pelos especialistas estava relacionada com o fato de a maioria das ferramen-
tas apresentam somente uma análise estatística da partida, sumarizando o jogo sem dar
detalhes dos eventos ocorridos ao longo do tempo. Buscar abordagens apropriadas que
permitam este tipo de análise foi uma das maiores motivações deste trabalho durante o de-
senvolvimento da nossa ferramenta de visualização e envolveu uma abordagem para uma
representação espaço-temporal global de uma partida que permite captar rapidamente os
principais momentos que aconteceram ao longo do jogo, bem como fornecer um contexto
e orientação para visualização de cada um dos componentes de maneira mais profunda.
A seguinte lista inclui os requisitos descritos:
• R1: uma visão compacta da evolução do comportamento de ambas as equipes bus-
cando revelar os padrões globais da partida.
• R2: evolução individual e da equipe em diferentes direções tais como movimentos
verticais (Ataque-defesa) e horizontais (esquerda-centro-direita), ou buscando por
partes do campo específicas (meio-campo, caixa, etc.);
• R3: identificação automática da formação tática a um dado instante de tempo, e
visualização da evolução da formação táctica;
• R4: visualização das trajetórias dos jogadores em determinadas partes do jogo e as
regiões do campo;
• R5: análise comparativa das trajetórias do jogador para identificar padrões de mar-
cação;
• R6: capacidade de filtrar os dados para restringir a análise antes de eventos impor-
tantes, como tentativas de chute a gol, contra-ataques, etc.
Os dados utilizados neste trabalho foram gerados utilizando dispositivos de cap-
turas e fornecidos pelos mesmos especialistas que colaboraram conosco durante todo o
desenvolvimento.
.2 Visual soccer match analysis
Pensando nas perguntas levantadas durante a análise com especialistas, nós sub-
dividimos o problema em diferentes aspectos, associando a cada um deles técnicas de
visualizações adequadas ao contexto do problema. Isto resultou em um sistema de vi-
sualização com diversos componentes, chamado Visual Soccer Match Analysis (Análise
Visual de Partidas de Futebol). Estes componentes estão mutualmente ligados pela inter-
61
relação entre os dados e componentes adicionais na ferramenta que permitem interação.
Abaixo, serão apresentados, de maneira resumida, os principais componentes que inte-
gram o sistema.
.2.1 Player Attribute Heatmap
O primeiro componente desenvolvido provê uyma visualização global da evolu-
ção da partida para determinado atributo dos jogadores que tenha sido selecionado, por
exemplo, a posição ou a velocidade. Está técnica codifica a informação em uma matriz
colorida onde cada posição recebe a cor resultante do processo de mapeamento do atri-
buto relacionado ao jogador e determinado instante de tempo com uma cor RGB. Neste
trabalho, consideramos inicialmente propriedades de uma dimensão e duas dimensões.
O primeiro mapeamento leva em consideração o atributo de uma dimensão dos
jogadores, como por exemplo a velocidade. Para cada instante de tempo, o atributo ana-
lisado é codificado de acordo com a paleta de cores selecionada e adicionado à matriz. O
segundo atributo considerado foi a posição, o processo de mapeamento considera agora
uma paleta de cores 2D que define todo o campo de futebol ou regiões específicas quando
não há cores associadas. A Figura 3.2 ilustra ambos mapeamentos.
A matriz PAH tem dimensões t x p, onde t corresponde ao tempo e p, corresponde
ao número de jogadores. Sendo assim, tempo e jogadores estão associados as linhas
e colunas da matriz, respectivamente. Para os dados utilizados, a dimensão de tempo
da matriz tem em torno de 2700 entradas, os quais correspondem aos 45 minutos de
uma partida, primeiro ou segundo tempo, e a dimensão de jogadores é 11 para o caso de
futebol. Por padrão, as linhas são ordenadas pelo tempo, cima para baixo e os jogadores
são ordenados pelo número atribuído pelo sistema de captação dos dados, de 1 a 11,
da esquerda para a direita. A Figura 3.3 ilustra duas possibilidades de mapeamentos e
exemplos da matriz PAH gerados a partir dos dados utilizados ao longo do trabalho.
Uma importante observação para o mapeamento 2D é que a análise provê a com-
paração dos movimento de ambos os times lado a lado. Para que essa comparação ocorra
de maneira justa e confiável, as coordenadas de um time devem ser espelhadas. Sem o
espelhamento, jogadores de diferentes times na mesma posição seriam mapeados para a
mesma cor, o que não permitiria uma comparação de ataque/defesa ou movimentos hori-
zontais no campo.
Além da escolha do atributo do jogador e das paletas de corem a serem utilizadas,
62
o PAH proporciona um outro nível de configuração sobre a ordenação de suas linhas e
colunas. O ordenamento padrão exibe as informações de jogadores individuais em colu-
nas separadas e ordenadas pelo número do jogador, enquanto as linhas estão ordenadas
de cima para baixo de acordo com a dimensão temporal. Consideraremos agora a pos-
sibilidade de alterar a ordem das colunas utilizando a coordenada y dos jogadores como
critério para a ordenação. Esta ordenação tem o efeito embaralhar a ordenação dos joga-
dores, enquanto que as linhas permanecem as mesmas. Esta ordenação gera um PAH que
permite a análise de movimentos verticais, que podem estar associados a um equipe estar
jogando mais no ataque ou mais na defesa. Portando, seus resultados são melhores avalia-
dos com uma paleta de cores 2D que varia na direção y. Da mesma forma, uma ordenação
considerando a coordenada x da posição dos jogadores pode ser definida, desde que seja
selecionado um mapeamento de cores com variação na direção x. Esta ordenação permite
identificar movimentos horizontais que podem indicar se um time joga mais à esquerda,
centro ou direita do campo. De forma resumida, o ordenamento de colunas são úteis para
análise dos movimentos globais de cada equipe.
Um outro grau de liberdade é o de alterar a ordem das linhas, que é útil para
a análise dos jogadores individuais. Isto tem o efeito de manter as colunas fixas para
cada jogador, enquanto a dimensão do tempo é reorganizada. Ambas coordenadas x e
y podem ser definidas para compreender os padrões verticais e horizontais associados
a cada jogador. Finalmente, é possível combinar as ordenações de linha e coluna para
cada dimensão. Do mesmo modo, é possível definir ordenações de coluna e linha para
quaisquer atributos associados aos jogadores, por exemplo, velocidade. A figura 3.4
ilustra diferentes ordenamentos para o atributo posição.
.2.2 Tactical Scheme Detection and Heatmap
Uma informação importante que pode ser extraída a partir da posição de jogadores
é o esquema tático (ou formação). O futebol é um jogo de estratégia e treinadores proje-
tam suas equipes para serem organizadas em três ou quatro regiões, chamados esquemas
táticos. Tais estratégias são geralmente referidas pelo número de jogadores em cada re-
gião. Por exemplo, um esquema tático 4-3-3 refere-se a colocação de 4 jogadores na
defesa (D), 3 no meio campo (M), e 3 no ataque (A). Em nossa análise, consideramos três
regiões, mas a nossa ferramenta também suporta sistemas que utilizem as quatro regiões.
Há duas questões que precisam ser abordadas quando se analisa esquemas táticos.
63
Em primeiro lugar, é desejável verificar o esquema tático de uma equipe em um deter-
minado instante de tempo. É comum usar um esquema tático fixo para o jogo todo e,
investigar como a equipe se desvia desta formação. Como táticas de futebol se tornam
mais complexas, é comum treinadores executarem variações nas suas formações táticas
durante o jogo na tentativa de confundir o adversário. Para ser capaz de analisar esta
variação de esquemas, não consideramos uma atribuição tática fixa, mas ao invés disto,
calculamos a formação das posições dos jogadores em cada passo de tempo. Para este
efeito, foi utilizado um algoritmo de agrupamento que identificou três grupos distintos de
jogadores ao longo da direção y. Entre todos os algoritmos de agrupamento que testamos,
o algoritmo de k-means simples foi o que gerou os melhores resultados. A Figura 3.8
ilustra os resultados produzidos pelo algoritmo em diferentes formações.
Uma vez que o esquema é calculado para cada instância de tempo, ele continua a
exibir os esquemas para todas as instâncias de tempo. Usando um heatmap semelhante
ao PAH, criamos um gráfico de esquema tático (TSH) que exibe o esquema de três região
usando três colunas (D, M, A), cada uma definida por um mapeamento de cor associada
com o número de jogadores no região. A Figura 3.9 ilustra a TSH no primeiro minuto de
um partida. O TSH é mais útil para períodos mais curtos de tempo, devido à sua grande
variação. Portanto, recomenda-se para o uso em análise dos instantes antes de um evento
importante de um jogo. O histograma, por outro lado, é útil para identificar regimes
predominantes utilizadas em intervalos de tempo grandes do partida. Neste exemplo,
uma equipe utiliza um esquema preferido 3-4-3 (esquema mais ofensivo), enquanto que a
equipe 2 permanece a maior parte do tempo utilizando uma combinação de 4-4-2 e 3-5-2.
.2.3 Multiple Occupancy Heatmaps
Os locais que um jogador ocupa durante uma partida são muitas vezes apresen-
tados como um mapa de calor sobre o campo (heatmap). Tais técnicas de ocupação do
espaço tradicionalmente consideram toda a partida, o que torna difícil compreender a evo-
lução da ocupação de espaço e tempo. Depois de discutir esta questão com os analistas
de futebol, recebemos o feedback que tais heatmaps não revelam como a ocupação evolui
durante uma partida, e abordagens com controle mais fino proporcionariam uma análise
mais informativa. Usando uma abordagem de múltiplos, criamos vários heatmaps para
um determinado instante de tempo. A Figura 4.8 ilustra oito heatmaps para a intervalos
fixos e subsequentes da primeira metade de uma partida. Como esperado, é possível ob-
64
servar padrões específicos na ocupação em diferentes heatmaps. Este processo pode ser
repetido tantas vezes quantas desejadas, restringindo a análise a períodos mais curtos de
tempo.
O segundo feedback recebido era de que uma comparação lado a lado dos heat-
maps seria útil para identificar padrões de marcação. É uma estratégia comum no futebol,
ter jogadores de defesa para marcar jogadores importantes do outro time. Esta análise é
interessante para analistas de futebol, porque ela permite que se verifique a existência de
padrões de marcação, e se eles foram bem executado durante a partida. Além disso, con-
forme solicitado pelos peritos, incluímos um filtro que considera a posse de bola durante a
criação dos heatmaps. Este filtro permite considerar apenas instantes em que uma equipe
tem o controle da bola, considerando que assim, a outra equipe estará na defensiva.
.2.4 Pathline Trajectories
Dado a complexidade da interação espaço-temporal entre jogadores em uma par-
tida de futebol, as trajetórias do jogadores fornecem uma base valiosa para análise avan-
çada. No entanto, uma vez que o campo está confinado no espaço, as trajetórias são
propensas a se cruzarem, desenhar todas as trajetórias ao longo do tempo iria gerar de-
sordem substancial na visualização impossibilitando qualquer conclusão. Em adição ao
uso de uma múltiplas miniaturas, assim como nos heatmpas, os peritos desejam refinar
a análise e considerar as subtrajetórias geradas por um jogador numa determinada região
do campo. Este design busca responder esta questão baseando-se na técnica de Pathline
Glyphs, que foi originalmente concebidas para a visualização do fluxo de 2D instável.
A principal ideia por trás dos Pathline glyphs é particionar o domínio em regiões
que não se sobreponham, e desenhar dentro de cada célula uma única versão reduzida de
um pathline, isto é, uma trajetória. Para encontrar esta trajetória, um ponto semente é
determinado dentro de cada célula que é invariante à redução de escala, a trajetória é de-
senhada a partir deste ponto semente. Uma das principais contribuições deste trabalho é
a capacidade de analisar os dados em múltiplas escalas, proporcionando foco e contexto.
Nós estendemos este conceito para a visualização das trajetórias dos jogadores. Uma di-
ferença importante é que mais de uma trajetória pode ser gerada para cada célula, uma
vez que gostaríamos de exibir todas as trajetórias que passam em uma determinada célula
dentro de um determinado intervalo de tempo. Portanto, temos de lidar com várias "se-
mentes", que no nosso caso correspondem aos vários locais onde as trajetórias começam
65
dentro de uma célula. Além disso, as trajetórias precisa desconsiderar tempos de bola
parada. Finalmente, limitamos o comprimento das trajetórias por valores especificados
em tempo de execução pelo usuário (por exemplo, 30 s).
A Figura 3.12 descreve a construção do pathline glyphs. O campo é subdividido
em miniaturas de acordo com uma escala selecionada. Para cada jogador, divide-se a
trajetória em intervalos de tamanho específicos (por exemplo, 30 s). Utilizando uma janela
deslizante de um segundo, trajetórias subsequentes são processados. Para cada trajetória,
as coordenadas do seu primeiro ponto são usados para localizar a célula miniatura, que
contém esse ponto. A trajetória é desenhada sobre o campo usando uma determinada
escala de cores que indica início e fim da trajetória e, finalmente a versão reduzida é
desenhada dentro de cada miniatura do campo. A figura 4.11 ilustra os resultados obtidos
para cada jogador de um time utilizando os Pahtline glyphs.
.3 Conclusion
Neste trabalho, descrevemos VMSA, uma ferramenta de análise visual para jo-
gos de futebol. A equipe por trás do projeto de VMSA incluiu peritos de futebol que
forneceram os dados utilizados na análise, bem como ajudaram em todas as fases de de-
senvolvimento e avaliação. Central às nossas ideias foi a análise da evolução do jogo de
uma equipe ou perspectiva individual. Em VSMA, propusemos PAH, uma abordagem
baseada heatmap para resumir os atributos do jogador tais como posição e velocidade,
e oferecem uma visualização rápida da partida. Da mesma forma, o TSH é também
uma abordagem heatmap que permite análise das alterações na formação tática durante o
jogo. Para investigar de forma mais profundas as trajetórias de cada jogador, foi utilizado
o conceito de múltiplas miniaturas para melhorar a análise dos heatmaps. Finalmente,
estendemos uma abordagem originalmente proposta para analisar fluxos 2D instáveis, o
athline glyphs, para ajudar a compreender as trajetórias complexas adotadas por jogadores
durante a partida. Os resultados apresentados buscaram revelar informações interessan-
tes a partir dos dados, e uma discussão incluindo feedback de usuários experientes foi
adicionada. VSMA tem mais funcionalidades do que o descrito aqui, e há muitas pos-
sibilidades de trabalho futuro. Nós gostaríamos de testar VSMA com um conjunto de
dados que compreende mais jogos (por exemplo, todos os jogos de uma liga de futebol
Premium). Além disso, gostaríamos de incorporar algoritmos de aprendizado de máquina
e mineração de dados para apoiar a análise automatizada de outros aspectos das partidas.