Embed Size (px)
Citation preview

Visual Communication for Industrial Engineering
- How to connect strategies to the daily work
Marcus Edholm
Degree of Master Thesis (1yr)
Stockholm, Sweden 2013

i
Abstract
This thesis focuses on how to make top management strategies understandable and linked to the daily work at the Industrial Engineering FA department in Kista. Moreover, an investigation is done to see which data Global Technical Dimensioning stakeholders need and how they prefer to receive it. Input from Industrial Engineering FA colleague’s, conversations with managers, stakeholder surveys, interviews etc. have been important input to the analysis, conclusions and results in this report.
The author’s purpose was to improve his knowledge within Visual Communication and get an insight of how to use Visual Communication in the daily work at Ericsson AB. Since this was fulfilled, the hope is that this thesis also can help other people to create a more visual environment that will gain better strategy understanding in future.

ii

iii
Foreword
This is a one year Master thesis report within Visual Communication, performed at the Royal Institute of Technology (KTH) in Stockholm, Sweden. The name of the M.Sc program is “Project Management & Operational Development” and the length of the thesis work is 10 weeks. The report has been performed in Kista together with Ericsson AB during Q2 2013.
I would like to thank the Industrial Engineering FA department for letting me combine my daily work with studies at KTH. A special thanks to Markus Rudström, supervisor at Ericsson AB and Roland Langhé, supervisor and program responsible at KTH.
Stockholm, July 2013
Marcus Edholm

iv

v
Table of Contents
1 Introduction .......................................................................................................................................... 1
1.1 Background .................................................................................................................................... 1
1.1.1 Ericsson AB ............................................................................................................................. 1
1.1.2 Product description ................................................................................................................ 7
1.1.3 Visual Communication ............................................................................................................ 7
1.2 Problem description ...................................................................................................................... 8
1.2.1 Communication ...................................................................................................................... 8
1.2.2 Technical Dimensioning .......................................................................................................... 8
1.3 Goals .............................................................................................................................................. 8
1.4 Limitations ................................................................................................................................... 10
2 Methodology ...................................................................................................................................... 11
2.1 Knowledge sight .......................................................................................................................... 11
2.2 Research methods ....................................................................................................................... 11
2.2.1 Literature studies ................................................................................................................. 12
2.2.2 Open interviews ................................................................................................................... 13
2.2.3 Surveys ................................................................................................................................. 14
2.2.4 Document analysis ............................................................................................................... 14
2.2.5 Transition between theory and empirical ............................................................................ 14
2.2.6 Reliability and validation ...................................................................................................... 14
2.2.7 Action research, problem solving and theory generation .................................................... 14
3 Theoretical background ...................................................................................................................... 15
3.1 Visual Communication ................................................................................................................. 15
3.1.1 Climate change comparison ................................................................................................. 16
3.1.2 Strategy before pictures ....................................................................................................... 19
3.1.3 Relevance in Visual Communication .................................................................................... 21
3.1.4 Linear Communication Model .............................................................................................. 21

vi
3.2 Motivation and goals ................................................................................................................... 22
3.2.1 Maslow’s hierarchy of needs ................................................................................................ 22
3.2.2 Goal setting .......................................................................................................................... 23
3.2.3 Empowerment ...................................................................................................................... 25
3.3 Organizational culture ................................................................................................................. 26
3.3.1 The territory ......................................................................................................................... 29
3.3.2 West vs. East ......................................................................................................................... 29
3.3.3 Flexibility ............................................................................................................................... 31
3.3.4 What is Visual Communication? ........................................................................................... 33
3.3.5 Create a reaction system ...................................................................................................... 36
3.3.6 How to create the plan ......................................................................................................... 36
3.3.7 Visual Communication implementation ............................................................................... 37
3.4 Communicate strategies .............................................................................................................. 40
3.5 SWOT ........................................................................................................................................... 41
4Empiricaldatacollectionandanalysis ........................................................................................ 42
4.1 External study visits ..................................................................................................................... 42
4.1.1 Alfa Laval .............................................................................................................................. 42
4.1.2 Atlas Copco ........................................................................................................................... 44
4.1.3 Scania .................................................................................................................................... 45
4.1.4 Volvo ..................................................................................................................................... 48
4.2 Ericsson units within BNET Supply .............................................................................................. 50
4.2.1 Borås ..................................................................................................................................... 50
4.2.2 Katrineholm .......................................................................................................................... 52
4.2.3 Kumla .................................................................................................................................... 53
4.2.4 Linköping .............................................................................................................................. 56
4.2.5 Summary of Sweden’s BNET Supply Sites ............................................................................ 57
4.3 Survey results .............................................................................................................................. 58
vii
4.3.1 Industrial Engineering FA ..................................................................................................... 58
4.3.2 Global Technical Dimensioning stakeholder’s ...................................................................... 60
4.3.3 PIM RBS Kista ........................................................................................................................ 63
4.3.4 Top Management’s Perspective ........................................................................................... 64
4.4 Communication strategy ............................................................................................................. 68
4.4.1 PIM RBS Kista ........................................................................................................................ 68
4.4.2 BNET Supply .......................................................................................................................... 72
4.5 SWOT ........................................................................................................................................... 77
4.5.1 Summary SWOT .................................................................................................................... 78
4.6 Summary of communication strategy ......................................................................................... 78
4.6.1 Definitions ............................................................................................................................ 83
5 Results ................................................................................................................................................ 84
5.1 Visual Communication today ...................................................................................................... 85
5.1.1 Top Management Communication ...................................................................................... 86
5.1.2 Strategy perception at Industrial Engineering FA ................................................................ 87
5.2 Visual Communication problems today ...................................................................................... 89
6 Conclusions ......................................................................................................................................... 92
6.1 Visual Communication in future .................................................................................................. 92
6.2 Visual Communication Plan ......................................................................................................... 95
6.2.1 Industrial Engineering FA ..................................................................................................... 95
6.2.2 Global Technical Dimensioning stakeholders ..................................................................... 101
6.3 Validation and reliability ........................................................................................................... 104
6.4 Proposal for further investigations ........................................................................................... 104
Appendices .............................................................................................................................................. A
A ‐ Time schedule ................................................................................................................................ A
B ‐ Surveys ........................................................................................................................................... B

1
1IntroductionIn this chapter background material - such as information about Ericsson AB and Visual Communication - is provided and problem description, goals and limitations clarified.
1.1 Background
This thesis is based on two parts; the company Ericsson AB and the subject Visual Communication. The interpretation of these two parts is affected by the author’s own experiences and views - and has been treated in parallel to increase the knowledge step by step. The subject Visual Communication will be described in the theory chapter, while the empiric data from Ericsson AB and external companies will be described in the empiric chapter.
1.1.1EricssonAB
Ericsson is a world-leading provider of telecommunications equipment and services to mobile and fixed network operators. Over 1000 networks in more than 180 countries use their network equipment and more than 40 percent of the world's mobile traffic passes through Ericsson’s networks. Ericsson is working towards the Networked Society, in which everything that can benefit from a connection will have one. Ericsson’s vision is to be the prime driver in an all-communicating world1. The Global headquarter is located in Stockholm, Sweden where the President & CEO Hans Vestberg’s office is located. Over 110’000 people are working for Ericsson and the Net sales for full year 2012 were 227,8 billion SEK. PIM RBS (Product Introduction & Maintenance Radio Base Stations) Kista is part of the Business Unit Networks (BNET) and is located in Kista, Sweden. Since this report focuses on strategy and Visual Communication, the hierarchy from CEO Hans Vestberg down to Industrial Engineering Final Assembly (FA) department will be presented. This will hopefully gain a better understanding through the report.
1 Ericsson’s internal homepage

Fig 1.1
Fig 1.1 “SupporOrganiz
2 Ericsson
– Ericsson’
shows that rt Solutionszations is lo
n internal hom
’s Organizat
Hans Vestbs”, “Global cated.
mepage
tion2
berg is the CServices” a
CEO and thaand “Networ
at the three rks” (BNET
different BuT), in which
usiness Unih the Supply
2
its are y
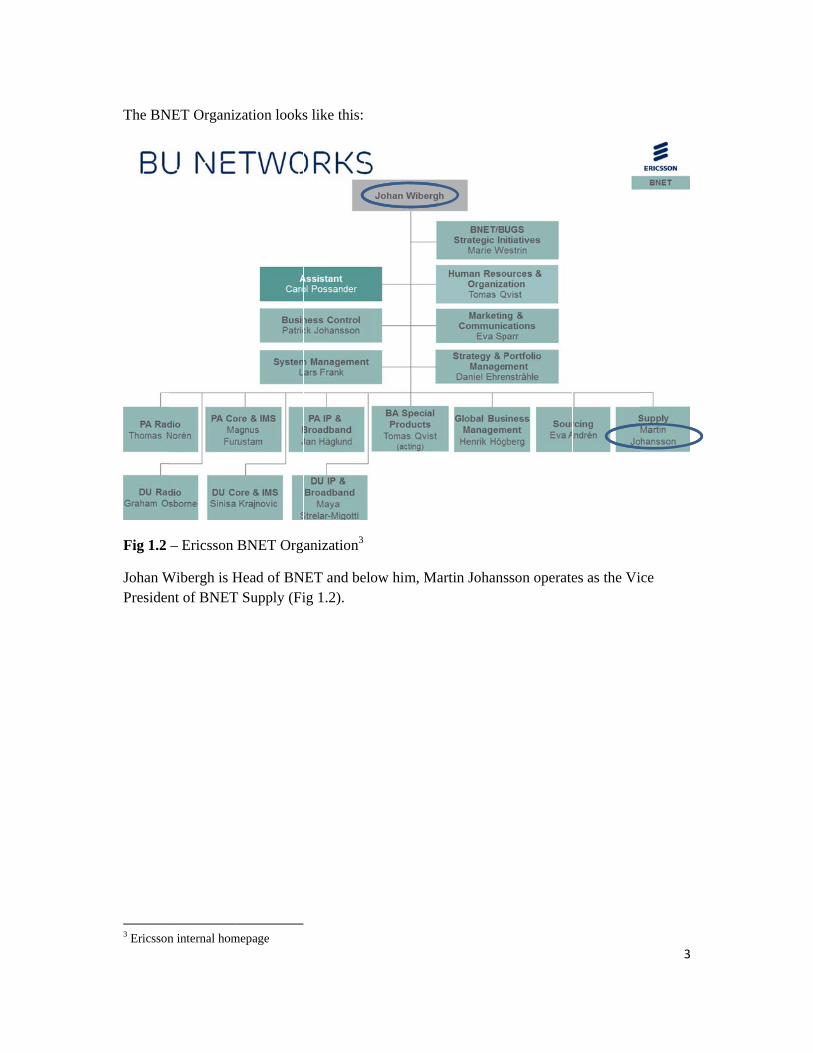
The BN
Fig 1.2
Johan WPresiden
3 Ericsson
NET Organiz
– Ericsson
Wibergh is Hnt of BNET
n internal hom
zation looks
BNET Org
Head of BNT Supply (Fi
mepage
s like this:
anization3
NET and belig 1.2).
ow him, Maartin Johanssson operatees as the Vi
3
ice
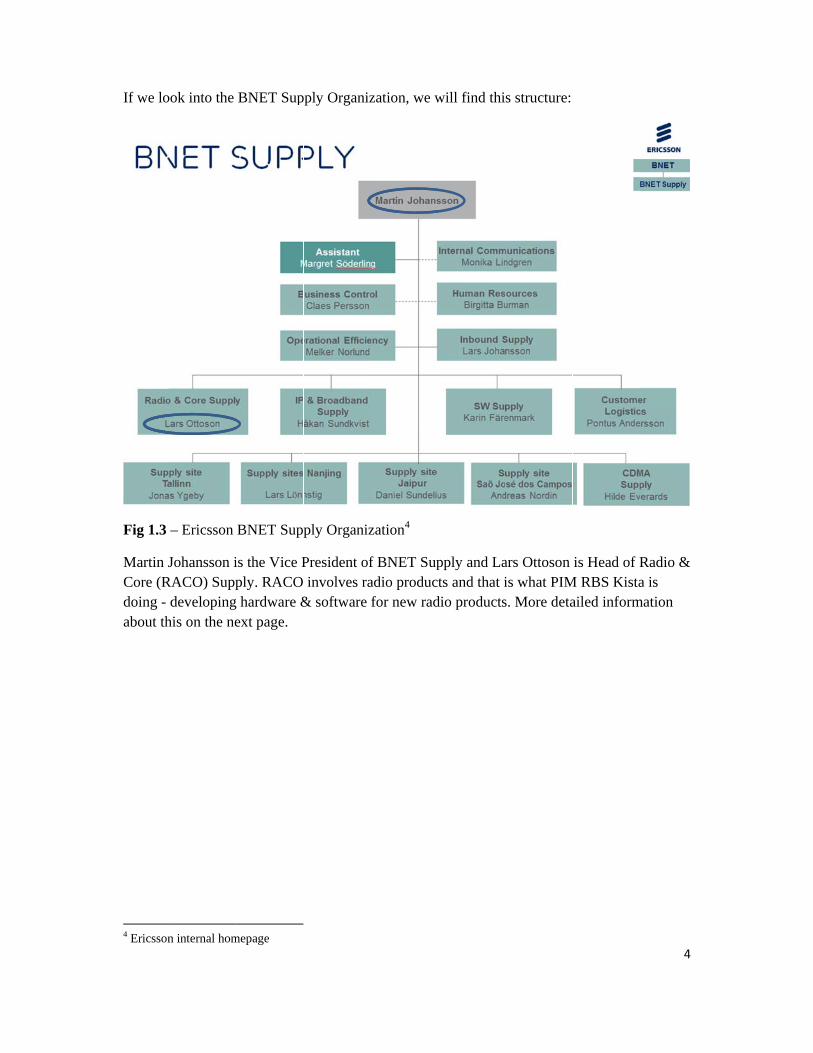
If we lo
Fig 1.3
Martin JCore (Rdoing - about th
4 Ericsson
ook into the
– Ericsson
Johansson iRACO) Supp
developinghis on the ne
n internal hom
BNET Sup
BNET Supp
is the Vice Pply. RACO hardware &ext page.
mepage
pply Organiz
ply Organiz
President ofinvolves ra
& software
zation, we w
zation4
f BNET Supadio producfor new rad
will find thi
pply and Lats and that i
dio products
s structure:
ars Ottoson is what PIMs. More deta
is Head of RM RBS Kistaailed inform
4
Radio & a is
mation

Deeper part of R
Fig 1.4
Henrik FBelow hreport b(PLCM
Es
Ic
El
O
5 Ericsson6 Operatio
down in theRACO, with
– PIM RBS
Forsberg is him, we canbelongs to. P) for Radio
Executing tsolutions fo
Industrializcustomers’
Ensure that lead time to
Offer short
n internal homonal descriptio
e BNET Suh this organ
S Kista Orga
Head of PIn find the InPIM RBS KFilters, whi
timely, cost or filter to fa
zation of newexpectation
the entire so rapidly res
delivery tim
mepage on Industrial E
upply Organnizational st
anization5
IM RBS Kisndustrial EnKista is acco
ich for e.g.
efficient anacilitate sup
w products ns
supply chainspond to ma
mes and del
Engineering F
nization, we tructure:
sta and Jonagineering F
ountable for includes6:
nd high quaperior supply
that ensure
n has the rigarket deman
liver accord
FA
will finally
as Odin is thFA departme
the full Pro
lity global py chains
quality and
ght capabilinds
ding to custo
y find PIM R
he Engineerent in whichoduct Life C
product intr
d functionali
ty regarding
omers reque
RBS Kista,
ring Managh the authorCycle Mana
roductions a
ity to meet
g cost, qual
est
5
as a
ger. r to this gement
and test
ity and

BR
In additprototypregions7
Fig 1.5
Respons
Cp
C
G
Pi
7 Operatio8 Ericsson9 Technicequipmen
Be supplierRBS Kumla
tion to this, pe abilities 7. Henrik W
– PIM RBS
sibilities an
Continues dprocesses
Conduct pro
Global Tech
Specify and
Product proimproveme
onal Descriptin internal homcal Dimensionnt, fixtures, pr
r for test hara responsibi
PIM RBS Ksuch as des
Wilstam (Fig
S Kista’s En
nd support fo
developmen
oduction pr
hnical Dime
d implement
oducibility ants
ion PIM RBS
mepage ning is a resporoduction tool
rdware & fiility
Kista also oign and sup 1.5) is Man
ngineering O
or this depa
nt, improvem
reparation a
ensioning9
t production
analysis (e.g
Kista
onsibility area s etc. are thing
xture design
ffers non prpply capabilnager for th
Organizatio
artment inclu
ment and su
ctivities
n layouts
g. DFA). Su
that is neededgs that have to
n to radio p
roduct uniqulities to intehe Industrial
n8
udes:
upport of ex
uggest and f
d to secure gloo be considere
roducts that
ue predevelrnal Ericssol Engineerin
xisting/new
follow up de
obal productioed
t are under
lopment andon units andng FA.
FA product
esign
on capacity. Te
6
the PIM
d d
tion
est

7
Production technology support to operations in terms of FA process ways of working (WoW), method & tools for hardware and software (HW/SW) and investment preparation
Review and suggest packaging requirements for inbound/outbound materials and verify that the packaging works in the supply process globally
Support and educate operators internal and globally by close involvement in new products and processes to be able to transfer knowledge to other sites worldwide
The author to this report is responsible for Global Technical Dimensioning in his daily work at Ericsson, which means securing production capacity at Ericsson’s radio filter production sites worldwide.
1.1.2Productdescription
Mechanical Radio Frequency (RF) filters are used in radio receivers, where high levels of performance are needed. The RF filters can provide an ideal option where specific performance parameters are needed for RF filter applications for various radio communications applications, such as Ericsson’s radio base stations (RBS). Mechanical filters have been used for many years and offer low levels of intermodulation (IM) distortion, a factor that is often overlooked in many radio receiver designs.
The various functions are performed by individual components within the RF filter. At either end of the RF filter assembly, there are transducers which convert the signals from their electrical form to mechanical vibrations and back again at the other end. These vibrations are applied to a series of mechanical resonators which are mechanically resonant at the required frequency. The resonators are mechanically coupled, typically with coupling wires to transfer the vibrations from one section to the next. By altering the amount of coupling between the sections and the natural frequency of each resonator, the response of the overall unit can be tailored to meet the exact requirements10.
1.1.3VisualCommunication
The basis for all Visual Communication is that someone has something to say. A sender, be it an individual, a newspaper, a TV-Chanel, a company or an organization has to carefully formulate and shape a message which is conveyed to a receiver. The aim of the sender is to exert influence by moving, motivating or informing. The message is tailored to its purpose and in order for the sender to reach its receiver; a channel must be set up between them – a medium. The sender expects the message to generate awareness, as well as interest and credibility – and finally to achieve its intended effect, which often is a reaction. The type of message, what the sender knows about the receiver and what the receiver knows about the sender all play significant roles in this process, as do the context of the message and financial resources available [Bergström, Bo (2008)].
10 www.radio-electronics.com
8
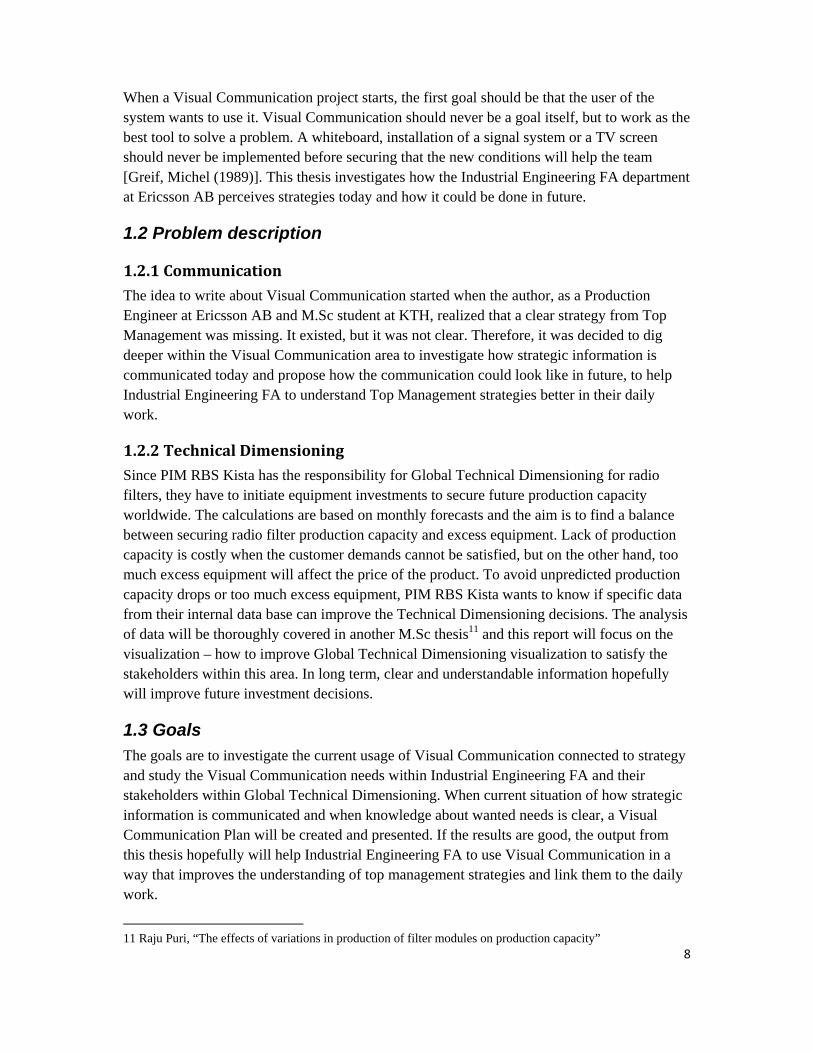
When a Visual Communication project starts, the first goal should be that the user of the system wants to use it. Visual Communication should never be a goal itself, but to work as the best tool to solve a problem. A whiteboard, installation of a signal system or a TV screen should never be implemented before securing that the new conditions will help the team [Greif, Michel (1989)]. This thesis investigates how the Industrial Engineering FA department at Ericsson AB perceives strategies today and how it could be done in future.
1.2 Problem description
1.2.1Communication
The idea to write about Visual Communication started when the author, as a Production Engineer at Ericsson AB and M.Sc student at KTH, realized that a clear strategy from Top Management was missing. It existed, but it was not clear. Therefore, it was decided to dig deeper within the Visual Communication area to investigate how strategic information is communicated today and propose how the communication could look like in future, to help Industrial Engineering FA to understand Top Management strategies better in their daily work.
1.2.2TechnicalDimensioning
Since PIM RBS Kista has the responsibility for Global Technical Dimensioning for radio filters, they have to initiate equipment investments to secure future production capacity worldwide. The calculations are based on monthly forecasts and the aim is to find a balance between securing radio filter production capacity and excess equipment. Lack of production capacity is costly when the customer demands cannot be satisfied, but on the other hand, too much excess equipment will affect the price of the product. To avoid unpredicted production capacity drops or too much excess equipment, PIM RBS Kista wants to know if specific data from their internal data base can improve the Technical Dimensioning decisions. The analysis of data will be thoroughly covered in another M.Sc thesis11 and this report will focus on the visualization – how to improve Global Technical Dimensioning visualization to satisfy the stakeholders within this area. In long term, clear and understandable information hopefully will improve future investment decisions.
1.3 Goals
The goals are to investigate the current usage of Visual Communication connected to strategy and study the Visual Communication needs within Industrial Engineering FA and their stakeholders within Global Technical Dimensioning. When current situation of how strategic information is communicated and when knowledge about wanted needs is clear, a Visual Communication Plan will be created and presented. If the results are good, the output from this thesis hopefully will help Industrial Engineering FA to use Visual Communication in a way that improves the understanding of top management strategies and link them to the daily work.
11 Raju Puri, “The effects of variations in production of filter modules on production capacity”
9
The ultimate goals for this thesis are:
Study how strategies from Top Management are communicated today and investigate how they could be communicated in future
Examine how Top Management strategies are received by Industrial Engineering FA compared to other departments
Create a Visual Communication Plan for Industrial Engineering FA and Global Technical Dimensioning to fulfill strategic objectives and satisfy their stakeholders
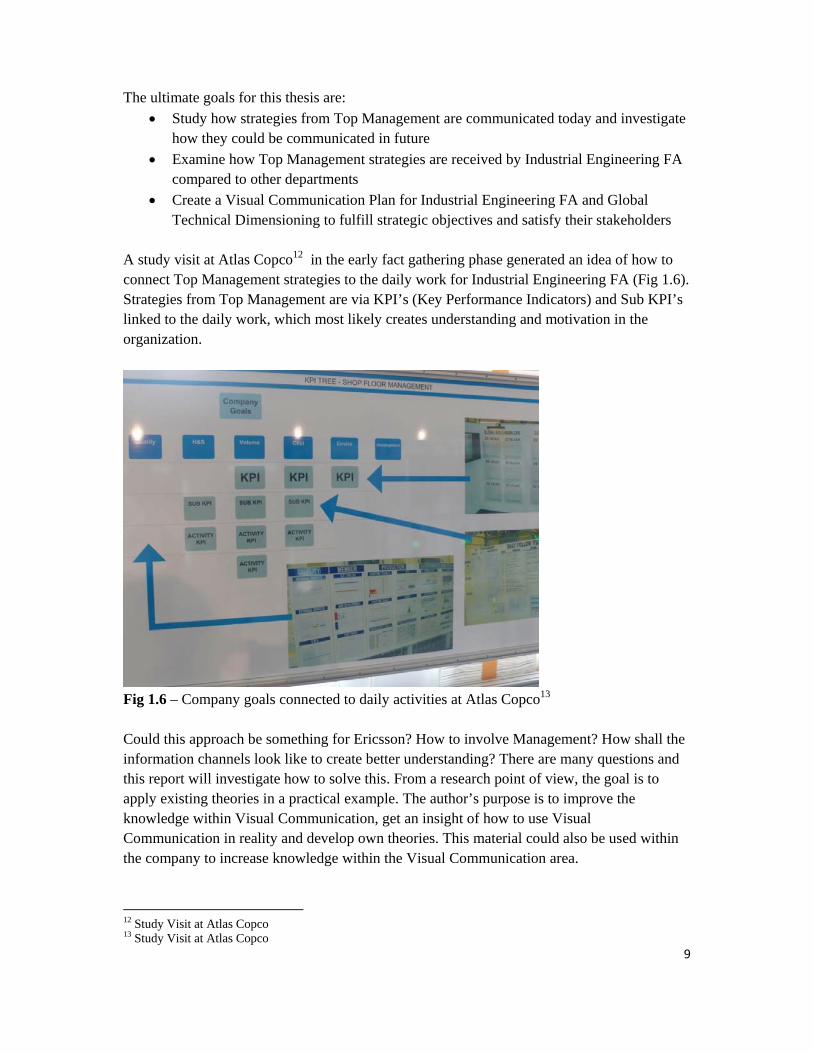
A study visit at Atlas Copco12 in the early fact gathering phase generated an idea of how to connect Top Management strategies to the daily work for Industrial Engineering FA (Fig 1.6). Strategies from Top Management are via KPI’s (Key Performance Indicators) and Sub KPI’s linked to the daily work, which most likely creates understanding and motivation in the organization.
Fig 1.6 – Company goals connected to daily activities at Atlas Copco13 Could this approach be something for Ericsson? How to involve Management? How shall the information channels look like to create better understanding? There are many questions and this report will investigate how to solve this. From a research point of view, the goal is to apply existing theories in a practical example. The author’s purpose is to improve the knowledge within Visual Communication, get an insight of how to use Visual Communication in reality and develop own theories. This material could also be used within the company to increase knowledge within the Visual Communication area.
12 Study Visit at Atlas Copco 13 Study Visit at Atlas Copco

10
1.4 Limitations
This thesis is limited to two steps; problem description and to come up with a proposal that solves the problem. The report will be available for further work within Ericsson, such as development of the Visual Communication Plan and implementation.
Since this thesis is limited to 400 hours, the results of the Visual Communication Plan won’t be able to measure
A Visual Communication Plan will be created, but not implemented
Confidential parts might appear and detailed information, that could damage the company, will not be highlighted. However, to be able to grade the report and understand the reasoning, other numbers will be used as input if needed
The Visual Communication Plan will be limited to the area of Industrial Engineering FA at PIM RBS Kista and their stakeholders connected to Global Technical Dimensioning

11
2MethodologyThis chapter describes the methods that have been used. First of all theories and approaches are depicted. Secondly, a description of how the research methods and empiric observations should be used - and how they have been used – is clarified. Finally, principals and interpretive field studies are described - how they have affected this report.
2.1 Knowledge sight
Two of the most central schools of thoughts today are: the positivism and the hermeneutics. The positivism advocates a picture of the world, a “real reality” and the view that the relation between the researcher and its subject should be maintained objective. The positivism advocates that the whole shall be divided into parts and that the parts shall be studied separately and that the result shall give an explanation. Hermeneutics, on the other hand, advocates an interpretation of the reality, which means that no “real reality” exists. The relation between the researcher and its subject is characterized by the researcher’s values. The hermeneutics advocates that the parts that really exists have to be understood in its context and that the result shall provide understanding [Nylinder, Jenny (2008)].
The reason to the hermeneutics approach is that the author believes that the reality is affected by the viewer’s eyes. Viewers see and describe reality based on own views, experiences and personal opinions. This means that the author have to be awake on his own interpretation and be careful when using references to the material in the report [Nylinder, Jenny (2008)]. The approach in this thesis will be a mix of induction and deduction, an interaction between empiric and theory, compared to unmitigated induction where the research goes from empiric to theory – or vice versa if using the deduction method [Nylinder, Jenny (2008)].
2.2 Research methods
The empiric observations have been performed with Johansson Lindfors theories - tips and advises to provide a reality description. The approach it is not just to choose data collection methods, but also to get access to information units and empiric observations. Standardized-, discovery- and problem solving methods are all linked together with imaging-, theory generating and action oriented approach [Nylinder, Jenny (2008)].
In the theory-generating research approach, performed with research methods, some kind of theory detection is the goal. Whether the discovery of the theory relates meaning, structure actions, events or anything else, the observations must be as natural as possible. There are many methods for data collection in the qualitative area. Three of the most common methods are open interviews, participating observations and document analysis. To be able to investigate Industrial Engineering FA & Global Technical Dimensioning stakeholder needs about strategy – and to be able to create a Visual Communication Plan - an inductive and deductive method will be used.

12
The tools listed in the matrix below will be used:
Method Description Expected Output Comments
Literature Collect relevant information, read & study
Increase the knowledge within Visual Communication
Internet, books, reports etc.
Stakeholder interviews & surveys
Prepare questions and perform surveys & interviews
Understand needs, objectives and long term target
Internal at Ericsson
Study visits Interviews with other companies and/or departments
Come up with new ideas that might be of use when creating the Visual Communication Plan
External & Internal
Data analysis Cooperate with another M.Sc student from Linköping
Theoretical data that will be input to this thesis
The M.Sc thesis from Linköping is not the same as this one
SWOT Strengths Weaknesses Opportunities Threats
Clear picture over current situation
External & Internal
Fig 2.1 – Methodology matrix
2.2.1Literaturestudies
To increase the insight within Visual Communication, which is important to be able to find answers to the goals, a literature study will be performed. Data is gathered from different sources and media, to improve the understanding within the area. Hopefully this will help the reader with limited knowledge in this subject to get a better overview during his/her reading.
A review of the literature is an essential part of the academic research project. The review is a careful examination of a body of literature pointing toward the answer to the research question. Literature studies typically include scholarly journals, scholarly books, authoritative databases and primary sources. Sometimes it includes newspapers, magazines, films and other secondary sources. All good research and writing is guided by a review of the relevant literature. The literature review will be the mechanism by which the research is viewed as a cumulative process. That makes it an integral component of the scientific process.
13
The purpose of the literature review remains the same regardless of the research method - it tests the research question against what already is known about the subject. Through the literature review, it is possible to discover whether the research question already has been answered by someone else. If it has, it is needed to change or modify the question. If the research question has not been answered satisfactorily by someone else, then it is time to search for these answers:
What is known about my subject?
What is the chronology of the development of knowledge about my subject?
Are there any gaps in knowledge of my subject? Which openings for research have been identified by other researchers? How do I intend to bridge the gaps?
Is there a consensus on relevant issues? Or is there significant debate on issues? What are the various positions?
What is the most fruitful direction I can see for my research as a result of my literature review? What directions are indicated by the work of other researchers?
Nothing is completely black or white. Only the researcher can determine what is satisfactory, relevant, significant or important in the context of his/her own research. Eventually, a broad picture of the literature in the subject area will begin to emerge and it is time to review the notes and begin to draft the literature review14.
2.2.2Openinterviews
Open interviews are of economic- and time reasons the most common discovery method. Since the language in these cases seems to be the most important source of information, the data collection should be performed in a way that the informants can express themselves freely. By not controlling the interview with prepared questions, the researcher instead can perform a conversation with the informant. The advantage is that the researcher can be very responsive and formulate appropriate questions over time [Nylinder, Jenny (2008)].
Internal and external interviews will be the main type in this thesis. The reason is to collect needs and thoughts that will be input to the Visual Communication Plan. Personal interviews are the best, considering that the relation often is strengthening between departments such as Industrial Engineering FA and Management. It is possible to ask open questions and show with an example or by body language if they don’t understand. This is difficult by using phone or e-mail and therefore the answers will be of worse quality. The drawback is the time, traveling and money that might be required when using live meetings.
14 www.uncp.edu

14
2.2.3Surveys
Structured questions with bonded responses, for e.g. surveys, should be used when issues about facts and/or attitude are reality. Focus for the fact questions is often on habits and relationship meanwhile attitude questions focus on positive or negative opinions about different phenomena [Nylinder, Jenny (2008)].
2.2.4Documentanalysis
Document analysis as a research method is often about analyzing written documents that have been produced for other reasons than research. It could be CEO reports, goals and documents/protocols that have been produced for the specific research problem [Nylinder, Jenny (2008)].
2.2.5Transitionbetweentheoryandempirical
The critical imaging phase, performed by standardized methods, is when to solve problems that appears in the transition from theory- to empiric level [Nylinder, Jenny (2008)].
2.2.6Reliabilityandvalidation
To be able to handle the reliability- and validation problems that are linked with the transition between theory and empiric, data collection methods such as surveys, structured interviews and different kind of data collections should be used. The goal is to be able to determine how the theoretical model gives a good description of the empiric reality. To get data of high validation, concept validity and reliability have to be reached. Concept validity is dependent on how what is measured really is what should be measured and how relevant this is in relation to the actual problem and/or the actual theoretical model. The reliability is determined by how the measurements are performed. Continuous measurements, for example, shall give the same result to give high reliability to the study. It is often up to the researcher to judge whether it is reliable or not [Nylinder, Jenny (2008)].
2.2.7Actionresearch,problemsolvingandtheorygeneration
Action research, that is performed by problem solving methods, is about to come up with ideas that give actions that lead to problem solving and contributes to theory development. Within action research, the data collection has to be performed in a way that not only researchers but also research objects can learn, change theory and practices. Action research is a joint of descriptive and action oriented data collection methods that operate in an interaction [Nylinder, Jenny (2008)]. Action research has not been a central method in this report, but served as a base for the problem solving and theory development.
The processes within action research often considerate a five step cycle: problem description, problem solving, implementation, evaluation and modification of the problem solving [Nylinder, Jenny (2008)]. In this report, the first two steps will be considered. The remaining three steps will most likely be performed in the daily work after this study has been finished.

15
3TheoreticalbackgroundIn this chapter, existing theories regarding Visual Communication, including related parts, will be highlighted. Specific parts from this chapter will serve as a base for analysis and conclusions in this report.
3.1 Visual Communication
Have we succeeded with the industrialization? Will we be able to transfer the products to volume site in time? Any IM yield improvements planned? Are our activities connected to the strategy? To get answers on these kinds of questions, you often have to enter the office and ask. Go into another world, into the land of abstractions that seems to be the only thing that can give a purpose to the physical production. Michel Greif wrote these words 24 years ago [Greif, Michel (1989)], but we still face this kind of problem – the visualization is not good enough and you often have to enter different parts of the office to get strategic plans, goals and other kind of information.
The realities in production are invisible and the factories are without soul, Greif continues. He realized that there was a link between the feeling of being in an inhabited factory and the visual environment. But also Visual Communication can end up as a total failure. Old posters, dusty whiteboards, old diagrams on the wall, clocks not working etc. are just a few examples. Greif’s impression was, back in 1989, that Visual Communication is divided from other kind of communication. In every company, it is relative easy to install fiber for telecommunication, implement screens for internal messages or to start up an internal magazine. But if a company try to implement a Visual Communication system in an organization that not adapt certain principals, the result most likely will be of poor quality.
The subject change direction. What from the beginning was about technical aspects – how to make a visual whiteboard, what data to show, what diagrams to use, where to place them etc. – more and more switch over to things like “why is some organizations better suitable for Visual Communication?”, “what is required to get the personnel care about the whiteboards?”, “what problems to expect?”,” how will the hierarchy react?” and “who should participate when creating the visual environment?”.
In the same way as Greif did, the author to this report have decided to investigate how Visual Communication can help the factory to lead, understand and communicate strategy rather than implement Visual Communication in the production line. It is not about implement a Visual Communication system, it is about create a visual organization and it starts with this report.
Many factories need to improve within the area of communication. Personal messages, reports, phone calls etc. is no longer enough. It is hard to improve production flows, delivery precision, new product introductions, technical dimension etc. if the employees cannot cooperate and understand each other. The solution is not only technology. Even though you can use Skype with your colleagues in China, it won’t help if the mechanical workshop doesn’t know what is happening in the production line. Even though you can use your

16
advanced computer and print multiple diagrams, it won’t help if no one reads it. According to Greif, the problem is not to communicate a lot between different departments far away from each other, but to communicate in the right way in the right area. A close, ordinary communication is what is needed [Greif, Michel (1989)].
3.1.1Climatechangecomparison
When the author to this report searched for literature within the Visual Communication area, “Visualizing Climate Change” appeared in the search results. An idea appeared immediately, that the connection between invisible strategies and today’s environmental problems are similar. Strategies that are not visualized well enough are difficult to understand and this is frustrating for many managers and employees. At the same time, the invisible carbon dioxide appears to contribute with same type of issues for the environmental scientists – no one can see it and it’s difficult to connect the important information to individual levels. This quote explains the invisible climate change issues:
“It’s of course hard to picture climate change, because carbon dioxide is invisible – if it were brown, we would have stopped producing it long ago” [McKibben, Bill (2012)]
“Nothing I can do about it”: Some people feel overwhelmed and powerless to act, or that their individual efforts will make no difference. This state of mind is what academics call “lack of agency”. Feeling that our actions are insignificant means we are much less likely to engage in pro-environmental behavior. “It’s somebody else’s responsibility”: We often fail to accept personal responsibility on environmental issues and parallels can be made to the strategic discussions here as well. People don’t understand the strategy and without understanding it is harder for the employees to realize “what’s in it for me”? In order to reframe perceptions and stimulate more action on climate change, a new lens for clearer vision and foresight is needed, according to Sheppard [Sheppard, Stephen (2012)].
Three core principles that advance this goal, fleshing out the recommendations from the social scientists while making them simple to apply in practice when engaging the public are:
1. Make it local
2. Make it visual
3. Make it connected

17
Making it local means more than just providing conventional climate change information at the local level - it may also mean opening people’s eyes to climate change all around them. Perhaps the most important rationale for the community perspective is to provide a third way for people to learn about climate change.
Audience
Fig 3.1 – Key ways in which climate change information reaches us, including potentially from our local environment (the third way) [Sheppard, Stephen (2012)]
Clearly, people act when the local climate change evidence is dramatic, as with Hurricane Katrina. At the ASLA (American Society of Landscape Architect’s) conference in San Francisco 2007, Al Gore beamed in by live satellite hook-up to give the keynote address: his main point on the subject of climate change to the designers and environmental communicators was: “Find a way to make it visible” [Sheppard, Stephen (2012)].
Communities need better Visual Communication - systematically applied - to make sense of current conditions around them, to engage their interest and enthusiasm and to guide behavior, Sheppard says [Sheppard, Stephen (2012)]. Moreover, social marketers for e.g., recommend using “prompts” such as labels or signs in the home to remind people to turn off lights to save energy. In Germany and UK the use of smart meters – installed in highly visibly spot in the home to show real-time electricity usage – has significantly reduced consumption simply by making visible the consequences of actions which previously went unquestioned. As with video-games, instant visual feedback becomes a key source of motivation and gratification.
How can this be relevant to PIM RBS Kista you may think? Well, the strategy is the key messages that state the direction we should take. If the employees never see any labels or signs – how should they find the right way? The question is how to make the signs. What do the employees want to see? The key message for climate change is to “think globally, see locally, act locally.” and this should be the same for Ericsson AB. Seeing may be the critical missing link connecting thinking and acting on issues, reinforced by what we hear [Sheppard, Stephen (2012)].
Local environment – the ”third way”
Deniers Science

18
Each individual may have to confront several perceptual barriers in order to move through the progression represented in the flow diagram. It may take only one barrier of sufficient strength anywhere in the sequence to prevent progress. The end result is the same: no action. Some barriers are internal to the person, others arise from external factors. Each barrier may thus require a different solution.
As shown in Fig 3.2, the progression is not strictly linear: both knowing and seeing must come together for recognition to happen. This is where mentally things click and insight happens. Barriers to either seeing or knowing will prevent recognition of how for e.g. climate change affects the community. Recognition is central to enhanced perceptions, but other stages are needed to achieve it. Seeing is a crucial pre-condition, as is requiring some prior knowledge. By itself though, seeing is not enough without also recognizing what we are seeing [Sheppard, Stephen (2012)]. The arrows are the key influences:
Fig 3.2 – The community awareness to action framework [Sheppard, Stephen (2012)]
Recog-nizing
Caring
Know-ing
Seeing
Action
Hear
-ingInformation
Local landscape
Outcomes
External influences (on individuals)
Awareness

19
It is not enough just to see something, we also have to know the relevant facts to be able to confirm or refute is apparent meaning. Therefore a systematic approach is needed, to recognize signs either as direct evidence or as a type of condition that is consistent with climate change trends [Sheppard, Stephen (2012)].
3.1.2Strategybeforepictures
Beating the emptiness takes strategic thinking, creating a pattern of discussions and actions in the present to guarantee success in future. Those who are responsible for a business have to work their way through an overall communications strategy before they can get to the point of grouping together their arguments and starting to think about the text and pictures that will then form their message. This overall strategy includes a mission statement, a marketing plan, the branding, communication criteria and a communication plan [Bergström, Bo (2008)].
Talking about messages, the more mass media shout, the more clutter will be generated until it eventually become too much. The receivers begin to listen without hearing, to watch without seeing and are influenced without feeling. At this point, stronger vocal cords no longer provide any help. What is needed is a message that is strong enough to cut through all this clutter, even with the merest whisper. Formulating and designing the message is therefore crucial. All the strategic work will go down the drain if the message is unable to get through. When the goal, the target group and the medium have all been sorted out - it is time for the message [Bergström, Bo (2008)].
The receiver is said to be convinced by rational arguments, but logic is no more important in decision-making than emotion and (attempted) objective arguments are no more relevant than subjective ones. The optimum message is based on one main argument. But if there are more, i.e. several supporting arguments; what order of presentation will achieve the best impact? The rule of thumb is to start with the strongest and keep the second strongest until last, with the weakest arguments in between. It is also common to sum up or repeat the strong main argument at the end, for example in the last paragraph of the text or in a pay-off or a tag line by the logo. It has to be clear who should draw the conclusion: the sender or the receiver. The rule of thumb here is to let the receiver draw their own conclusions. It is important to make the receiver feel involved and proactive, leading them to work out the message for themselves [Bergström, Bo (2008)].
The key is to clearly highlight the problem or need - or allow for a wish to be fulfilled. The sender has to create as much drama as possible using negative motifs in text and picture, so that the receiver identifies with the message and recalls a frightening experience or worrying personal shortcoming. The greater the problem is, the greater the desire for relief and solutions [Bergström, Bo (2008)].
All communication takes place on the receiver’s terms, in theory, so the sender should consider the receiver carefully, so that the message can get through. However, surveys often give a highly generalized view and when the sender adapts and makes assumptions accordingly, it often rings false. The receiver isn’t influenced in any way. So what is the

20
solution? Maybe the focus on the receiver is far too intense? Clearly, senders should not try to think entirely from other people’s point of view, but use their own brains. This is aligned with the motivation theory, shown in the interview chapter (Jonas Odin). Senders can be so exclusively focused on what they think the receiver wants to hear that they end up censoring themselves. No wonder the messages become monotonous when the key to any successful story has been lost: the desire to tell it. The sender has constantly been chanting the mantra: “Who is the receiver? Put the receiver at the centre!” The mantra should really be: “Who are we? What do we want to say? How do we want to say it?” [Bergström, Bo (2008)].
This information is exactly aligned with what Julia Mastelle explained during the internal communications interview (chapter 4.4.1), that the higher management on BNET Supply level sometimes asks what we think regarding strategy objectives. Maybe they forget to ask themselves: “Who are we? What do we want to say? How do we want to say it?”
The answer is to resist the “tyranny of the receiver”: to let the insight and love of storytelling shine though. A good story, as personal and exciting as a great play, film or novel always comes across. The latter sticks out its neck and asks the sender to break the tyranny of the receiver, i.e. not to tailor the message to the receiver but to base it around the sender. The message comprises two elements, the basic message and the incisive message. The basic message has to be based on the receiver, while the incisive message comes from the sender and should be bursting with a desire to tell a story, urgency, shrewdness, self-awareness, distance, drama, emotion and surprises.
The sender should tell the story she or he wants to tell and do so in the way it feels most suitable. The receiver will soon be singing from the same hymn sheet [Bergström, Bo (2008)].
The basic message focuses on the receiver, but the incisive message must be packed with the sender’s own desire to tell a story, making the receiver part of an enthusiastic audience. However, the receiver is also very demanding and without some point, most things will be incomprehensible and without insight. Without surprise there is no curiosity and without personality, no interest. Telling receivers what they already know is a waste of resources. There are different grades of the message: static and dynamic. The static message gives the audience what they expect, while the dynamic one offer the unexpected [Bergström, Bo (2008)].
The conflict and the present captivate the receiver, but that is not enough, so AIDA comes to the rescue. AIDA stands for [Bergström, Bo (2008)]:
Attention
Interest
Desire
Action

21
3.1.3RelevanceinVisualCommunication
Relevance in Visual Communication can be illustrated by the following formula:
A strong image that creates attention but lacks relevance in results in the message having little effect: 1 x 0 = 0.
A weak image, which is still valid in its context, does not influence the viewer to any great extent either: 0 x 1 = 0.
However, if the image is strong and the viewer also feels that is has been placed in a relevant context, they will be captured by the message: 1 x 1 = 1. [Bergström, Bo (2008)]
3.1.4LinearCommunicationModel
The sender – the newspaper, company or agency – conveys a message to several receivers, who may be a large group of readers, a society of potters or the majority of a population. The message only goes in one direction and the sender therefore has no idea whether the message has reached the receiver, whether it has been understood or how the receiver has reacted. This mass communication is never more than information (monologue) or one-way communication. The opposite, two-way communication, is something completely different and according to the theories, it only occurs in conversations between a few people. However, in mass communication the editor, the marketing manager or the information officer is able to create something similar to two-way communication. To do this, the message has to be designed so that the sender can discover whether the receiver has actually received it. This form of response is called feedback or dialogue and it involves getting the receiver to react [Bergström, Bo (2008)].
The entire communication process is described in a simplified communication model below. The model shows that the message often does not reach the entire target group. It is only part of the target group, the receivers, who are reached.
Fig 3.3 – The linear communication model [Bergström, Bo (2008)]
Sender Receiver
Target group
Message
Feedback
Channel
Channel
Channel

22
The receiver has an idea about something. An action is the aim. Attention, relevance, feeling and thought have influenced the receiver to change from passivity to activity. The receiver does something, but did that happen? Maybe there has been a brief conflict between the left and right sides of the brain. The right side of the brain is a hedonist, an emotional yes-man eager to accept inviting messages. The left side of the brain is logical and rational and quickly sees the advantages but also the disadvantages [Bergström, Bo (2008)].
Visual Communication demands a very special form of creativity known as framework creativity. It is still needed to come up with masses of ideas on the right subject, but you have to do it within the parameters of a particular framework. You can’t give your imagination free rein and soar off into flights of fancy all of your own, as that will only confuse the receivers. The big challenge is to push the boundaries, not to exceed them. It is always a good idea to look up and seek inspiration from new contexts. If the company or its messengers derive their inspiration and references from nothing but their habitual and secure surrounding’s, there is a risk of inbreeding. This can be termed groupthink, where everybody thinks the same way and brings with it a lack of self-criticism, resulting in everyone overestimating their own abilities. Many people say that as simple a thing as taking a different route to work can help facilitate new ideas. It can give you the opportunity to forge an acquaintance with a lot of new things and to see everyday things in a different light [Bergström, Bo (2008)]. This confirms that the study visits that are planned definitely should be performed.
The term “form” relates to how the visible shapes or configurations have been created and to how various the different parts have been arranged. The term “content” covers what these different elements are filled with and also what thoughts and types of information are being conveyed. Form and content are considered to be mutually interdependent. The form cannot exist until it has some content to present and the content does not truly exist until it has taken shape in the design process. At the same time, it is important to remember that the content should lead the form and not vice versa. The interplay between the design and the content is what creates that important first impression, paving the way for the message. Design + Content = Message [Bergström, Bo (2008)].
3.2 Motivation and goals
From the Visual Communication chapter, the report now continues with theories regarding how important goal setting and understanding of strategies is to achieve motivation in an organization.
3.2.1Maslow’shierarchyofneeds
One way to get employees (followers) to engage in and persist with the behaviors needed to accomplish group goals is to appeal to their needs. Needs refer to internal states of tension or arousal, or uncomfortable states of deficiency people are motivated to change. This is also aligned with Jonas Odin’s figure in chapter 4.3.4. Hunger would be a good example of a need: people are motivated to eat when they get hungry. Other needs might include the need to live in a safe and secure place, to belong to a group with common interests or social ties, or to do
23
interesting and challenging work. If these needs were not being met, people would choose to engage in and persist with certain behaviors until they were satisfied. According to this motivational approach, leadership practitioners can get followers to engage in and persist with certain behaviors by correctly identifying and appeasing their needs. According to Maslow, people are motivated by five basic types of needs. These include the need to survive physiologically, the need for security, the need for affiliation with other people (belongingness), the need for self-esteem, and the need for self-actualization15. Any person’s behavior can be understood primarily as the effort directed to satisfy a particular level of need in the hierarchy. Which level happens to be motivating a person’s behavior at any time depends on whether lower needs in the hierarchy have been satisfied or not. According to Maslow, lower-level needs must be satisfied before the next higher level becomes salient in motivating behavior16.
3.2.2Goalsetting
One of the most familiar and easiest formal systems of motivation to use with employees, or followers, is goal setting. From the leader’s perspective, this involves setting clear performance targets and then helping followers create systematic plans to achieve them. According to Locke and Latham, goals are the most powerful determinants of task behaviors17. Goals direct attention, mobilize effort, help people develop strategies for achievement and help people continue exerting effort until the goals are reached. This leads, in turn, to even higher goals. Locke and Latham reported that nearly 400 studies involving hundreds of tasks across 40’000 individuals, groups and organizations in eight different countries have provided consistent support for several aspects of goal setting. The research showed that goals that were both specific and difficult resulted in consistently higher effort and performance when contrasted to “do your best” goals. Moreover goal commitment is critical, merely having goals is not enough. Although follower participation in setting goals is one way to increase commitment, goals set either by leaders unilaterally or through participation with followers, can lead to necessary levels of commitment. Commitment to assigned goals was often as high as commitment to goals followers helped to set, provided the leader was perceived to have legitimate authority, expressed confidence in followers and provided clear standards for performance. Followers exerted the greatest effort when goals were accompanied by feedback; followers getting goals or feedback alone generally exerted less effort. Goals can be set for any aspect of performance, be it reducing costs, improving the quality of services and products, increasing voter registration or winning a league championship. Nevertheless, leaders need to ensure that they do not set conflicting goals because followers can exert only so much effort over a given time. Successfully completed goals give followers a sense of job satisfaction and easy goals are more likely to be completed than difficult goals. However, easily attainable goals result in lower levels of effort and performance than do more difficult goals18.
15 answers.mheducation.com 16 answers.mheducation.com 17 answers.mheducation.com 18 answers.mheducation.com
24
Research suggests that leaders might motivate followers most effectively by setting moderately difficult goals, recognizing partial goal accomplishment and making use of a continuous improvement philosophy by making goals incrementally more difficult. These results indicate that leaders wanting to improve individual or team performance should set high but achievable goals and express confidence and support that the followers can get the job done. So, how could leadership practitioners apply goal setting to increase PIM RBS Kista’s motivation levels? Given the research findings the managers should work with followers to set specific and moderately difficult goals, express confidence that they can achieve their goals and provide regular feedback on goal progress. It should be specific and measurable goals. Managers need to ensure that individual goals do not conflict with team or organizational ones and should also take care to set measurable goals; that way they could give the feedback they need to stay on track19. A practical method for implementing goal setting in organizations involves the creation of balanced scorecards. Kaplan and Norton argue that most of the measures typically used to assess organizational performance are too limited in scope. For example, many organizations set goals and periodically review their financial performance, but these indicators suffer from time lags. It may take a month or longer before the financial results of specific organizational activities are available and they say little about other key organizational performance indicators. To get around these problems, Kaplan and Norton advocate creating a set of goals and metrics for e.g. employees where goals and metrics make up leading indicators that are root cause to other problems. Curphy20 has developed balanced scorecards for rural Minnesota hospitals and school districts. For example, hospitals begin this process with a comprehensive review of their market demographics, customer trends, financial performance, internal operations and staffing and facility data. Key community and health care leaders then create a new five-year vision for the hospital and set strategic priorities in the customer, financial, internal operations, and workforce and facilities categories. These priorities are refined further to create clear, measurable goals with readily available metrics to track monthly progress. These balanced scorecard goals are used to drive specific department goals and track hospital performance and have been very effective in helping all hospital employees understand how their efforts contribute to the hospital’s overall performance. In several cases hospital performance has dramatically improved as a result of these balanced scorecard efforts. A monthly balanced scorecard report is included in all employee pay statements and is a key topic of discussion in hospital and department staff meetings. Staff members review goal progress and regularly devise strategies for achieving department and hospital goals. A nice thing about the balanced scorecard is that it helps employees be proactive and gives them permission to win. In too many organizations employees work hard but never see how their results contribute to team or organizational performance. Adopting balanced scorecards is a way to get around these problems.
19 answers.mheducation.com 20 answers.mheducation.com

25
3.2.3Empowerment
Empowerment is the final approach to motivation that will be discussed in this chapter, since this most likely will be an important factor to be able to implement a successful Visual Communication Plan. In general, people seem to fall into one of two camps with respect to empowerment. Some people believe empowerment is about delegation and accountability; it is a top-down process in which senior leaders articulate a vision and specific goals and hold followers responsible for achieving them. Others believe empowerment is more of a bottom-up approach that focuses on intelligent risk taking, growth, change, trust, and ownership; followers act as entrepreneurs and owners who question rules and make intelligent decisions. Leaders tolerate mistakes and encourage cooperative behavior in this approach to empowerment21. We define empowerment as having two key components. For leaders to truly empower employees, they must delegate leadership and decision making down to the lowest level possible. Employees are often the closest to the problem with most information and as such, they can often make the best decisions. Leaders wishing to empower followers must determine what followers are capable of doing, enhance and broaden these capabilities and give followers commensurate increases in authority and accountability22. The psychological components of empowerment can be examined at both macro and micro levels. Three macro psychological components underlie empowerment: motivation, learning, and stress. As a concept, empowerment has been around since at least the 1920s and the vast majority of companies that have implemented empowerment programs have done so to increase employee motivation and productivity. Many empowerment programs are poorly implemented - the program is announced with great fanfare, but little real guidance, training, or support is provided and managers are quick to pull the plug on the program as soon as followers start making poor decisions23. This is important to remember when creating the Visual Communication Plan. Although the motivational benefits of empowerment are sometimes not realized, the learning and stress reduction benefits of empowerment are more clear-cut. Given that properly designed and implemented empowerment programs include a strong developmental component, a key benefit to these programs is that they help employees learn more about their jobs, company, and industry. These knowledge and skill gains increase the intellectual capital of the company and can be a competitive advantage in moving ahead. In addition to the learning benefits, well-designed empowerment programs can help reduce burnout. People can tolerate high levels of stress when they have a high level of control.
21 answers.mheducation.com 22 answers.mheducation.com 23 answers.mheducation.com

26
Given that many employees are putting in longer hours than ever before and work demands are at an all-time high, empowerment can help followers gain some control over their lives and better cope with stress. Although an empowered worker may have the same high work demands as an worker that is not empowered, the empowered worker will have more choices in how and when to accomplish these demands and as such will suffer from less stress. And because stress is a key component of dysfunctional turnover, giving workers more control over their work demands can reduce turnover and in turn improve the company’s bottom line. There are four micro components of empowerment.
These components can be used to determine whether employees are empowered or not and include self-determination, meaning, competence and influence. Empowered employees have a sense of self-determination; they can make choices about what they do, how they do it and when they need to get it done. Empowered employees also have a strong sense of meaning; they believe what they do is important to them and to the company’s success. Empowered employees have a high level of competence: they know what they are doing and are confident they can get the job done. Finally, empowered employees have an impact on others and believe that they can influence their teams or work units and that co-workers and leaders will listen to their ideas. In summary, empowered employees have latitude to make decisions, are comfortable making these decisions, believe what they do is important and are seen as influential members of their team24.
3.3 Organizational culture
Organizational culture is the personality of the organization. It is the combination of qualities that gives the organization its distinctive character and makes it interesting. Organization culture includes habitual patterns or behavior, thought and emotions. It also includes the assumptions, values, and tangible symbols (artifacts) that an organization’s members share amongst themselves and that they pass on to new members. The concept of organization culture became popular in the 1980’s, when Japan’s economy was soaring – and American executives worried the prevailing quantitative research was not explaining why American business were falling behind. As a result, emphasis shifted from the functional and technical aspects of management to the interpersonal and symbolic aspects of management [Kenney, Keith (2009)].
If we look at something and then close our eyes and try to create the image we’ve just seen in our minds, scientists have discovered that we use the same nerve cells for both processes. The neurons that become activated when we see an object or attempt to recall it are in the medial temporal lobe of the brain, which is the area involved in memory. So our ability to recall images suggests that our attention to images is much more tied to our interests and our memory than we believed to be the case before this research was done [Berger, Arthur (2008)]. The very structure of the eye has an effect on the way we design and use space. In Western countries, we tend to focus our attention on objects and not on the spaces that
24 answers.mheducation.com

27
separate them. By contrast, in Japan, spaces are perceived, named and revered as the prime interval. We all have the same eyes, but what we see – or perhaps what we focus our attention on – differs from culture to culture [Berger, Arthur (2008)].
What makes Visual Communication stand out in the factory is not to provide information with help of pictures and photographs, but to make the information available. Visual Communication is communication of the visual and gives a group of persons a more correct picture of the reality. Visual Communication is always meant for a group and not an individual. A visual message is for everybody in the organization – for everyone that can see the information. It is not enough to see the information, you have to understand it. However – and this is one of the fundamental changes from conventional communication – the understanding is not created because you are a specialist but because you are part of a visual culture. It is easy to see the advantages – everyone can reflect on the production plans or the strategy to help colleagues to do the right thing every day [Greif, Michel (1989)].
To try to implement Visual Communication system in an organization with fixed hierarchy, where the top manager know things others don’t, is very risky. Visual Communication is about company culture where the most important is participation. Successful companies within Visual Communication prioritize participation and share responsibilities, work tasks, improvements and values (company goals and cultural identity). Most likely no one has succeeded with the strategy by forcing someone to be interested in whiteboards showing results. The fundamental thought is to, in a systematical way, broad the number of receivers. Since the information is not provided to a specific group or person, it is all about to get as many as possible to care about the information and understand it. This is difficult. If the message is not to me, why should I care about it? Everyone needs to feel: “That is our information”. To get this feeling, it is vital to get the personnel involved and take part in the strategy work. As long as decisions are not decided together – it is not possible to implement Visual Communication. In fact, it is not Visual Communication at all - it is just ordinary conventional communication where the “more important people” tell others what to do. When using conventional information, you are sending information. When using Visual Communication, you are not sending anything – you are building a field of information to get the personnel have access to that field. With other words, while the conventional factory - with its electronic board - is satisfied after presenting some random messages to their employees, the Visual factory put effort to let the personnel see [Greif, Michel (1989)]. The messages are not spinning around; they are part of a vision field. Information circuits disappear and get replaced by a field with information. At the same moment as the field of information with neutral messages appears, the Visual Communication landscape will show the reality. There are two consequences if a company decides to reach a Visual Communication organization:
1) If the reason to Visual Communication is that operators in the production lines shall understand everything that is important for the organization, it could be an explanation why many factories are overloaded with information.

28
Does the group have a productivity goal? If yes, it should be visible.
Are the operators responsible for the quality from the production lines? If yes, it should be visible.
Do we have accurate process instruction that has to be followed? If yes, it should be visible.
Have a specific team reached success? Make it visible.
Everything connected to goals and KPI’s shall be visible.
2) The second consequence is related to the opposite theory; if everything in the vision field without doubts provides an exactly meaning for the recipients, it will be difficult for them to deny the truth by abstract counterarguments. In a Visual Organization, the dust on the shelves is an equal important sign as the inventory turnover number. Visible continuous machine faults in the mechanical workshop are just as important as the number you can read on the last “frozen capital row” in the balance sheet. The defect units in the corner, that no one seems to care about, risk to work as a quiet but convincing denial speech about outstanding quality from the excited Management team. It is important to highlight following: If an organization decides to implement a Visual Communication Plan, the Management team – traditionally working with abstractions – first must go back to reality [Greif, Michel (1989)].
In the traditional communication methods, the foreman or unit leader had a centralized role over the communication. In an organization that wants to use Visual Communication, these tasks will instead be to build up a communication environment and make it living [Greif, Michel (1989)].
A vital question for the principles within Visual Communication is: why should for e.g. the Industrial Engineers agree on showing bad results? Why should they agree on turning their faces to higher Management teams just to “lose their faces” (fail) seconds after? There is only one answer to that question - same answer as from all other companies that have succeeded with their Visual Communication implementation plan - to post the results in an area where they fulfill a specific function. They are expressing facts, so never to come up with corrections. The neutrality is the strength within Visual Communication.
The connections between environment planning and Visual Communication can be summarized like this [Greif, Michel (1989)]:
1. The prerequisite to develop a Visual Communication is to have an own territory. An own territory is not something someone owns, since it is connected to a public area. It is a question about aligned control regarding tools and environment.
2. Visual Communication is developed to reach 100% increased information exchange intensity. Firstly within a small group (for e.g. Industrial Engineering FA), secondly

29
between the small group and the rest of the organization. The visual organization is at the same time improving the team building cooperation.
3. Where to place the information carriers (for e.g. whiteboards) provides a double message:
‐ That everybody can see a message in the area that the work is performed also means a shared responsibility to all involved parties.
‐ Posts on a territory assume that involved parties have a distance to them. Both active and passive parties must be able to meet as one team and face objective realities without blaming others or feeling guilty.
3.3.1Theterritory
When a company starts a project with Visual Communication, the first concrete activity is to decide the territory. By giving this territory a name, by giving characters suitable for the group, conditions for future communication carriers are created. The esthetical forming is not necessary to create art, but to make it feel like home. The group members should therefore chose the design of the territory with support from an expert or similar to coordinate the whole picture [Greif, Michel (1989)].
When documentation is visualized, the hierarchy conflict is immediately radically changed. As soon as documents and instructions getting visualized in areas where the work are being performed, questions about whom owns the knowledge rights will be different. The transformation is radical and strongly reminds of a revolution. In a visual organization, knowledge belongs to persons that belong to the territory of knowledge – not to someone [Greif, Michel (1989)]. Again, since the author to this report do not really know the strategies, it should be possible to connect Greif’s methods to improve strategy understanding.
Four fundamental rules to keep in mind before posting something visual in the factory:
1. The method shall exist
2. It shall be visible to everyone
3. It shall be accepted by the users
4. It shall be possible for the users to question it
Visual documentation means the methods new ways of expression. By changing direction of the perspective – from a formulization of coercion to a formulization of participation – the old concept nor method has revived [Greif, Michel (1989)].
3.3.2Westvs.East
Katsuyoshi Ishihara, one of Japans most known quality specialists said: Good products can only be manufactured if the operators follow the job norms carefully. The job norms are

30
included in a document that shows how to reach quality. You cannot produce good products if you don’t follow the norm, but let everybody work after they own ideas. Within the Industrial Engineering FA department, this is a well-known problem. Work instructions are performed in Kista, where new radio filters are developed. When the Project Office gets the mission to transfer a new radio filter product to a volume production site in EU or Asia, the work instructions also are transferred. However, these production sites develop their own production work instructions, make improvements, change process flows etc. So, when a quality problem appears, it is difficult to find the root cause of that problem. Same production processes worldwide is therefore something that is highlighted within Ericsson now.
Aren’t detailed instructions the opposite of a modern, independent culture you may ask? This is a fundamental misunderstanding, since the formalized methods is received as an obstacle against independency [Greif, Michel (1989)]. Are clear instructions and strict rules really something that affects independency? Greif faced these questions for many years ago and he thought that the industry continuously was paying for the sins of the Taylorism. The Japanese, on the other hand, seemed to disregard from this since they – in their collective culture – could appreciate the formalization of the methods, for its advantages within communication and improvements rather than coercion [Greif, Michel (1989)]. The point is, when this discussion appeared for Greif, no one thought that the work instructions could have been performed by the users (operators) in cooperation with the technical departments. The reason to this, according to Greif, is that the industrial culture we live in still is affected by a number of preconceptions. Many companies won’t accept the fact that operators are involved within this area. To formulate a rule, to explain a method, to formalize detailed instructions – that is a privilege only for those outside the production floor. Only they got the right to print the laws [Greif, Michel (1989)].
When Greif visited Nummi’s factory in Fremont, California he was overwhelmed by the amounts of varying and accurate work instructions and methods. The most fascinating was that the time studies were performed by the operators. An operator performed the analysis and videos were used to help the group understand how the most efficient of them worked. Each time an improvement was performed, the instructions were updated. The number of updates is the best measurement method to see how fertile in ideas the operators are, the Production Manager William K. Borton explained [Greif, Michel (1989)].
At Ericsson, the process evaluation and measurements are performed by engineers and office personnel. Moreover, the strategy is communicated from Management level and very seldom linked to the daily work. Is it any difference really, when comparing initiatives in the production line and initiatives regarding strategy? Could participating engineers from Industrial Engineering FA improve the strategy understanding? How should the Visual Communication Plan look like, to improve understanding and participation?
Frederick W. Taylor documented schedules, work instructions, machine manuals etc. in a way that was suitable for personal knowledge, where someone with centralized knowledge kept control over the situation. This method will fail as soon as the control is limited to Managers

31
and other functions outside the production line, according to Greif. A question all companies continuously should ask them self - until they have succeeded with a practical answer – is: why does the knowledge still has to be limited to a certain amount of Managers within the same organization? The only realistic goal should be to let everyone be involved to accomplish synergy effects and enable business growth. One of the strongest characteristic for a Visual Organization is that it gives an answer to that question.
According to Greif, lack of good communication is not necessary equal to decreased quality or efficiency. That is the main problem, since everything works out fine in years – until one day when the company face big customer needs that put requirements on stock levels and operation times. It is by then the non-existing system with direct information is vulnerable. Even though the operator - that continuously repeats her/his tasks without instructions - can manage the work, others must be able to get support from directives that cannot be misunderstood. Otherwise the quality of the work will suffer. This is the reason why companies that are striving for being flexible and productive (for e.g. Ericsson) also must strive to provide knowledge immediately. If so, team leaders can focus on leadership, organization and forecasts instead of solving problems [Greif, Michel (1989)].
3.3.3Flexibility
Flexibility is one of the four main focus areas for BNET Supply.
Flexibility has, according to Greif, three different components. De two first – the ones most people first think of - are dependent on either material resources (flexible machines) or personnel policy (flexible times). The third component often has a tendency to be neglected. It is an interface between the human and the human’s resources. The purpose is to increase the human’s ability to movement when using the material tools. A prerequisite for this kind of movement is better communication with the environment: machines, storage devices, material handling systems, tools, data systems and administrative tools [Greif, Michel (1989)]. The idea can be summarized with:
FLEXIBLE TECHNOLOGY VISUAL DOCUMENTATION VARIABLE MANPOWER
The prejudices are still valid and two of them have ruled the factories for a long time.
1) Norm documents are only for the offices. The basic principles within visual documentation are the opposite: everyone should have access to it and primarily production staff.
2) A norm is made to consist, which means, because a specialized department has put effort to develop it. Therefore, it is common that durability is a sign of quality.
A Visual Organization believes that a good norm is a norm that continuously develops. It is not necessary a method, but a way to invigorate improvements. Visibility is important for the questioning of the norms, which generates improvements. When everybody has access to the

32
norm document – or the strategy – it is open for critique and suggestions to improvements. A company that focuses on making for e.g. the strategies more visible has to pass certain phases and follow some rules. The practical aspect of the development of a Visual Organization can be divided into four groups [Greif, Michel (1989), Page 80]:
1) Decide the area that the documentation shall cover
‐ A document shall instruct, so the documentation – or visualization – has two purposes: transfer knowledge or give instructions
‐ Which sectors in the factory shall be considered and what shall be visualized
2) Formulate information carriers
‐ If the visual documentation becomes a technology, it is an information carrier
3) Implement a system that can be updated fast
‐ As soon as a company realizes that the goal of visual communication is not to force some one, but to implement participation, the perspective will be different.
‐ The traditional way was (and still is) to focus on what people did not know. Now focus should be on what everyone knows – make it visual and share the information so that others can use it
‐ When a group wants to use resources in a collective way, information must be visible
4) Let the personnel participate
‐ If the group decides to join, the strategies will be more living since the information, connected to strategy, will be handled by the whole organization
‐ By broaden the field of visual communication, the company will create a more unified organization that everyone is involved in
While Visual Communication is implemented, the personnel more and more will use the information that is written. They trust on the information which is good, but the disadvantage with that trust is that even small ambiguities can lead to wrong maneuvers. The visual documents have to be detailed enough, not only regarding what will be done, but also additional information if something risks being misunderstood [Greif, Michel (1989), Page 85].
One of the prerequisites to make Visual Communication successful is fast updates. Old information will affect the personnel’s’ trust of the system. The update method must be developed very carefully, since changes most likely will appear often. It is not enough to say “hurry up”, but to build a complete system that guaranties fast updates no matters the circumstances [Greif, Michel (1989), Page 93].

33
It is important to determine every moment in detail. Who is responsible, according to which method and within which time? Besides the psychological aspect, there are two other benefits when the personnel are participating in the Visual Communication project.
1) Visual Communication works as all other product and in this case, the employees at PIM RBS Kista are the customers. They have to understand the strategy, so why not let them join when creating the strategy, to achieve better quality? Create a project group consisting of representatives from different areas and collect data from personnel meetings and surveys. Some companies have realized that this mass communication technique is related to commercial, so they let someone from the marketing participating as well. It is a perfect opportunity to create cooperation between departments and develop visual tools.
2) Specialist departments will be offloaded if everyone knows what to focus on and delegated task can be visual [Greif, Michel (1989)].
When creating the visual communication tools one idea could be to, in advance, decide that some areas shall be empty for additional personnel information.
3.3.4WhatisVisualCommunication?
The Kanban method is for many known as a typical example of Visual Communication because visual cards are placed at a board. Let’s say that the board is replaced by a computer screen, still with exactly the same information, the only difference is that the computer is handling the cards. Is it still Visual Communication? Let’s say that the computer now also receives sales forecasts from the marketing department that can be used for prioritizations in the production line. Is that Visual Communication? The problems with determine accurate boarders for Visual Communication are significant and they indicate that thoughts are on wrong track. It is easy to try to find a definition based on the tools rather than a definition based on the relationship between the human and the system [Greif, Michel (1989), Page 102].
Three rules for Visual Communication [Greif, Michel (1989), Page 107]
1) At any time, anyone can have access to visual information at for e.g. a whiteboard
2) The steering rules are visible
3) Employees that belong to the specific department are involved in the logic steering. Firstly in the daily work, secondly in the general planning of the system’s efficiency. The rules are not imperative orders from management, but results from the cooperation.
It is difficult to give a comprehensive definition of Visual Communication, since the number of situations often makes it too complex. There is both a variable and a constant involved:

34
The variable is that level where the visual technology is used during the decision making. When you manage the material stock with Kanban, it is visual communication. When you post a production plan, created by a computer, on the whiteboard it is also visual communication.
The constant has to do with the relation between the humans and the logical system. A relation that is summarized in the three fundamental rules within Visual Communication:
Fig X.X – The visual steering
Fig 3.4 – Three fundamental rules within Visual Communication [Greif, Michel (1989), Page 108]
It turns out Visual Communication is not an algorithm but communication. A production plan in the office is not visual steering. According to Greif, many production facilities made a big mistake when they introduced computers in the production and removed the visual posters. A plan is a tool for decision making, Greif said, but it seems we have forgotten that it is also a tool for communication and a symbol. In many companies most people care about the technical aspects of logistic problems, the dimension of communication has been forgotten. The computer is a good tool for individual communication, but not for group communication. What’s missing is a common interface. That day when the computers can provide a broader visibility (messages on a sign, visual presentation of stock levels, flow diagram etc.) it will be an important in the visual steering of the factories [Greif, Michel (1989), Page 109].
One of the original characteristics within Visual Communication is to provide communication between the human and the logistic system – to give it a certain place in the industrial planning.
SEE TOGETHER
Ahead or behind schedule
Stock levels
Available machines
ACT TOGETHER
Aligned goals and rules
Participation in improvements
KNOW TOGETHER
Delivery commitments
Goals and plans
Steering rules

35
Follow three golden rules [Greif, Michel (1989), Page 112]
1) The targets shall be realistic and possible to achieve regarding available resources and organizational rules
2) The targets shall be exactly defined, with an accuracy that has been agreed on earlier. Do not try to exceed it, just because to impress, since it will cause confusion for the team. Everything shall be aligned and if someone believes that it is possible to for e.g. produce more, it shall be aligned with the team. According to the Japanese production specialists, it is needed to anchor the logistic system around realistic targets before developing a more advanced system. Before moving the board with goals far away, you have to learn to hit bull’s eye first.
3) Finally the visual targets shall be linked to the most important targets that the entire organization strives for. Implied factors such as economical information that only managers know about, material savings, personnel utilization etc. cannot affect the plan. Visual Communication and free insight. If visual information shall be effective, it must also include the problematic aspects. With other words, what is visual always need to be prioritized over what is not visual.
Greif highlights an example from Japan, which shows that the way you interpret an occurrence - and also the way you react on an occurrence – is a question about construing. To see ills, Shiego Shingo says, is the most difficult.
During his visit in Japan for many years ago, he saw a slogan on all walls: “Eliminate defects and waste”. He turned to the guiding director to ask: “Director X, do your personnel consist of idiots?” The surprised director explained and assured that his personnel were very competent people.
Shiego Shingo continued: “when people see defects, they put effort to eliminate them, but the difficult part is to see them. What you should write is not “eliminate defects and waste”, but “try to find defects and waste””. When people not care about what they see, when most of the ills are perceived as “normal”, then the company has big problems Greif says [Greif, Michel (1989), Page 128].
Production is experimental science
The view that operators, that are performing the tasks at the first level in the organization, are the improvement people is a contrary to quite many preconceptions. When Greif wrote his book back in 1989 it was (and still is) common that directors, on the question what industrial improvements they planned to do, they often answered: automatic machines, increased production capacity, high stock capacity remote controlled trucks etc. To make improvements was to invest. To invest was to by equipment, spend money to invent new technology or buy a new machine. It was difficult to picture an improvement without a big check and several months of work for the technological departments. Reduce defects, waste of materials or re-work was officially not included in the improvement plans. It seems like production has
36
become theoretical science, but science is largely based on observations. Observe, notice details, register incidents, find root causes and come up with continuous improvement proposals to improve the organization [Greif, Michel (1989), Page 132].
3.3.5Createareactionsystem
1) The information shall be fast
2) Put the information where it belongs
3) Let the entire group be involved
There are two advantages by letting the entire group be involved. First of all it improve the ability to act, anyone can help. Secondly everyone can observe what is happening in the group, it is not just information. In a more efficient way, compared to an eloquent director, the organization’s value system is now going to be built up [Greif, Michel (1989), Page 137].
In the Kaizen book from Masaaki Imai, it is highlighted that Western companies always have prioritized results before processes and that the differences are based on a correlation between two management styles. In West, focus is on short-term profits and not so much how the profits are reached. In Japan on the other hand, they believe that the most important is to determine good processes and to follow them. It seems like the Western people focus on the golden eggs, while the Japanese care about the health of the hen [Greif, Michel (1989), Page 167].
3.3.6Howtocreatetheplan
Aligned ideas regarding for e.g. the organizations operational businesses and goals have to be anchored, so the planning phase when creating the plan can take several months [Greif, Michel (1989), Page 186]. Personnel have to be educated, so that everyone is at the same level when the project starts. It should preferable be done in two phases:
1) Basic education regarding economical terms, so that everyone understands which roads to choose to make the company heading forward: sales strategy, quality, logistics, measurement of costs, utilization of human- and material resources etc. This could be needed to understand the manager’s different KPI’s. The education is a perfect opportunity to state that it is not a question about controlling the employees, but to provide them with new tools for communication and planning. A tool that enable the employees to be accurate. It is no longer acceptable to say “they are always late”. You measure time.
2) Clarify terms that could be difficult to understand. What is Visual Communication? What are improvement goals? What is a norm? Elementary measurement methods, selection of relevant parameters and graphic shapes – all concepts have to be known before the first boards (or similar) are put on the wall.

37
When it is time to start, it should preferable be done in small scale. In general, the method to be used is decided with the pilot department and that has some benefits:
The Visual Communication project group has not thought of everything and some changes are always needed
Since the first pilot is kind of a test, it is always easier to get the personnel involved
Within a short time of period, visible results are available, which is easy to share with the rest of the organization. People speak about it, look, comment, think etc. Curiosity makes the rest. One member from the Visual Communication project group can then help other departments to follow their example
According to Mr. Hue, acting manager for the assembly department in Renault’s factory in Sandouville, it is needed to wait for the right opportunity before starting a Visual Communication project. Even though a new board can be interesting in the beginning, it is not a sustainable attraction. It is only attractive if it answers precise questions that the team members wonder about. Therefore, the preparation phase should focus on the questions and not the answers. When the personnel start to ask questions, it’s time to start the project [Greif, Michel (1989), Page 187].
This report was as a matter of fact started when my colleagues wondered about the strategy at PIM RBS Kista. Their questions led to own questions and after a number of conversations with my manager, it was decided to dig deeper in the Visual Communication area.
3.3.7VisualCommunicationimplementation
The common goal is more general than the project. It states the principles the company choose to manage the development. It helps to strengthen unity. There are many different ways to visualize this kind of messages, but it is always a phase where you have to prepare. First of all something has to be mentioned at a personal meeting, or in connection with education. It is important to explain, since it needs time to mature and lead to unity. As a matter of fact, a formulized and general target is useless if the employee disagree. Before Renault’s assembly department’s general targets were presented officially, a team circulated in the production, to explain what was motivating these general targets and what the printed messages meant. A good solution to get acceptance is to visualize at two levels. Firstly with help of public document, that is presented by the Top Management and discussed within the entire company. Secondly, discussions on production floor- or team level. The presentation of the general targets for the company is by this way communicated in a more personal way [Greif, Michel (1989), Page 229].
Mr. Deschamps, workshop Manager at Renault, implemented Visual Communication in a way that involved all his employees. A workgroup decided what should be measured and how it should be presented, but that was not enough. He invited 2 students, probably within marketing, to create something special that could be used during the launch of the new system. They did small books and posters of the same type as for commercials. He also
38
mentioned that flags could be used and when people come and ask what it is, he hands out small books with information about the system. Original ideas are necessary to get people’s attention according to Deschamps [Greif, Michel (1989), Page 188].
Visual Communication cannot grow without some kind of culture. On the other hand, Visual Communication contributes to culture growth. These kinds of projects are strengthening during the implementation and the most important is to believe in it and get started [Greif, Michel (1989), Page 237].
During many years, production was similar to weight lifting. Everybody was standing alone to lift their weights. Today it is more like football or ice-hockey, since the production has become a team sport. Everybody participates in a competition where it is needed to stay at world class level and not be moved to division 2. The competition is very hard and it is easy to realize that a successful company not is one where the CEO and a couple from higher management are the only ones that have a clear picture over the game. Therefore, it is now time to put lights on the stadium [Greif, Michel (1989), Page 242].
It is pointless to try to get the personnel involved and interested of organizational Visual Communication if not the local department communication routines has been implemented before. This is because the personnel have accepted and understand the measurements. It is vital to go from the individual to the public and not vice versa. To create good cooperation between the team’s goals and the company’s goals is not easy. All opportunities should be considered to strengthen the feeling of unity. Top Management should consist of a department that keeps control over the factories results. The coordination can be easier if the way of measuring is aligned for the local teams through the whole factory.
What is remarkable for Visual Communication is that it gives a meaning of what you see. Its main efficiency is created by that the company have one single picture over the reality. If what is visualized not is aligned with reality, the Visual Communication system will lose big parts of the efficiency – the boards appear in a physical way, but not psychological.
Before general goals are visualized, the detailed goals should be decided and visualized. Before visualizing the organization’s project that involves everyone, you should place the maintenance plan next to the machine – and follow it. Before stating that the whole factory have high moral, you should clean the floor in the workshop. The Visual Communication is a new language that requires effort to be able to understand, learn and implement. It’s not easy to express yourself in a new language without first learning the grammar [Greif, Michel (1989), Page 227].
Renault uses cards to communicate their strategy. On the first side, the companies general policies is stated, the second one is filled by the factory manager (goals and objectives), the third one is filled by the production manager (own policies linked to previous pages), the fourth one is for each individual to fill in (feel a connection to the strategic objectives). Company’s policies go from abstraction to reality for everyone [Greif, Michel (1989), Page 230]. Factories that have succeeded with Visual Communication have not focused on a

39
universal concept, but rather many different solutions. This is, according to Greif, not surprising since the correlation between Visual Organization and company culture.
As for humans, all factories do not have the same face. Greif gives five recommendations [Greif, Michel (1989), Page 234]:
1) Precise project goals
2) Estimate how big the cultural changes will be
3) Determine a general plan
4) Create a need
5) Implement the project
Since PIM RBS Kista today already uses Visual Communication, the cultural differences won’t be very big. The tricky thing is to implement strategic information in the visual landscape, to strengthen the connection between for e.g. engineers and Top Management. It is important that the purpose of Visual Communication is crystal clear and that everybody from the beginning knows what the organization wants to achieve. When the targets are set, directors should be participating. Firstly to sort out what they want to achieve with Visual Communication and how this can contribute to that the industrial policies are implemented successfully. This should be done before starting with changing activities. Secondly to decide if the culture is mature enough to manage the tasks within a Visual Organization and clarify what might be needed to solve in term of for e.g. education or support [Greif, Michel (1989), Page 235].
According to Greif, these are the most important factors when it comes to company culture [Greif, Michel (1989), Page 236]:
Knowledge and information should be public
The employees should be comfortable in their environment (territory)
Work in small groups shall be prioritized
Informal contact between different levels in the hierarchy should be intensified
Implement a system with overlapping responsibility areas
Control functions should be concentrated on observations, facts and problem solving rather than searching after someone to blame
Production staff should be involved in the workshop improvements
Go back to the “floor” after years of centralized company managing
Go back to the reality after years of abstract company managing

40
3.4 Communicate strategies
When the organizational culture is on track, it is times to start communicating strategies and according to Hirsch, it is needed to understand three principles which are the essence of communication to become an effective communicator [Hirsch, Herbert (2003)]:
Connection
Flow
Reinforcement
Connection means connecting what we have to what some reader, audience or listener needs or wants. We have a point to make or an idea to convey, but that point or idea may not be something the recipients of our communication will immediately grasp as being relevant or interesting. Hence, it is up to the communicators to make the connection and not leave it to the recipients to sort out [Hirsch, Herbert (2003), Page 6]. Flow means taking the recipients of our communication smoothly and effortlessly from what they need or want to what we have and not vice versa. It is the mechanism of the connection that provides a degree of comfort within the communication flow. Reinforcement means providing support for the elements within the flow. Reinforcement is the substance – the collective, supporting details that are the foundation for the connection – and it must convince the recipients that the flow will work. It is up to the communicators to demonstrate this support.
These three principles are the constant force behind all communication. Once mastered, they become a useful road map by which communication can be navigated regardless of type or technical particulars [Hirsch, Herbert (2003), Page 7]. When making the connection, it is not preferable to start with the subject and then decide how to connect it to our readers. Rather, the reader’s needs or desires should be in focus to decide how to connect the subject to them. This requires additional effort, because it is necessary to understand the reader’s needs to decide how the subject may be properly connected. One important thing to remember is that communicators often need to provide an understanding to audiences that have different ways of thinking, acting and understanding than those they normally communicate with [Hirsch, Herbert (2003), Page 122]. The role of the communicator is not to train the user to understand the technology, but to bridge the culture gap and set the technology in the user’s comfortable and familiar context. Politicians seek attention by organizing press conferences and by offering good photo opportunities for news cameras, but their ability to control the publicity still depends on how the media and the audience respond to their performance [Hirsch, Herbert (2003), Page 92]. This can be connected to how Ericsson continuously arranges All Employee Meetings (AEM’s), with the risk that no one gets the message from Management. What is the strategy and what’s in it for me as a Production Engineer?

41
3.5 SWOT
SWOT Analysis is a useful technique for understanding Strengths, Weaknesses, Opportunities and Threats. For example, by considering the weaknesses within Visual Communication, it’s easier to manage and eliminate threats25. I remember from my B.Sc. studies that the SWOT model often is used within marketing/sales and the examples below are also from that area. However, it could be useful in this case as well, since I want to know more about the current situation within PIM RBS Kista. Threats These are external factors such as obstacles in the marketplace, cash flow issues, new trends or competitors’ focus. For this section also include any pertinent information from your personal life that harms your business. Anything internal or external that could damage the Visual Communication Plan? When going through the analysis, it’s good to be as specific and rigorous as possible. The more fine-tuned and accurate the data is, the more likely you can simply add the information to your living business plan and make any necessary modifications. Opportunities These are external factors that present ways to grow, new trends to capture or events. Include any pertinent information from your personal life that supports your business. This thesis could be an opportunity to improve Visual Communication, but maybe something else outside the factory can help? Weaknesses Another internal set of qualities that contributes to lost sales, skill gaps, slows- or stops growth. In what way shall we not develop the communication plan? Strengths This is an internal set of qualities that makes your small business unique, strong and shows your unique selling proposition. This can also be used for Visual Communication. What are the strengths within PIM RBS Kista that can be useful when creating the communication plan?
Fig 3.5 – SWOT Model26
25 www.mindtools.com 26 www.abilitysuccessgrowth.com

42
4Empiricaldatacollectionandanalysis This chapter treats the empiric findings from observations, interviews, surveys, chats, document analyses etc. Firstly some of the ways of working, including problematic, that have been discovered will be described. Secondly Ericsson’s strategies, how they are perceived and communicated by managers and their employees, are treated.
Approximately a dozen interviews have been performed, both internal and external (study visits), where the main subject has been Visual Communication from a strategic perspective. During the conversations, new approaches of how to implement a Visual Communication Plan from a strategic perspective have been developed – both for the informant and the author to this report.
4.1 External study visits
4.1.1AlfaLaval
CEO Lars Renström communicates the ”5 in 5 vision”, which stands for 5 BEUR in 5 years (turnover).
He also wants the revenue to be 15%, so it is all connected to money. From this level, strategies for Alfa Laval are developed and right now they look like this:
‐ Product Competitiveness
‐ Prime Performance
‐ Structural Growth
This is the Top Strategy for Alfa Laval and this has to be divided into more concrete goals. If we look into a specific unit within Alfa Laval - a department called “Business Center High Speed Separators” – we will see that the goals still are on high level:
‐ Biggest
‐ Profitability
‐ Best Value
These goals could for e.g. be connected to: orders and before-tax profits, R&D, elimination of faults, introduction of new products etc.

43
The strategies are the same as on top level. If we hold on to the unit “Business Center High Speed Separators” and dig into the R&D department, we will get closer to concrete goals:
Fig 4.1 – Organization at Alfa Laval27
Goals for R&D:
‐ R&D Costs
‐ Eliminate faults on the top 30 products
‐ Secure X and Y Projects
‐ Knowledge based product development
‐ Environmental goals (1% fuel saving with Project X and 90% less mud with Project Y)
Still, these are fuzzy goals hard to measure. We have to dig one step deeper in the organization to find more concrete goals:
Fig 4.2 – Organizational structure at Alfa Laval28 27 Study visit at Alfa Laval
CEO (Lars)
R&D X Y
Separator
CEO (Lars)
R&D
Project Office
X Y
Separator

44
In the Project Office, the goals look like this:
‐ Reduce cost for Product “PXA” and “PXB”
‐ Put “Product Q” on the market
‐ Take TG4 (Toll Gate 4) for “Project Z”
‐ Secure delivery of “Machine XZ” etc.
Different Project Managers will be responsible for the different goals and it’s up them to decide detailed numbers. How much shall we reduce the costs for Product “PXA” and “PXB”? When exactly should “Product Q” be on the market? This detailed information is moved to a white board where status is communicated to Managers every morning. It is located in the middle of the office, so everyone can see it. At the bottom of the white board, you can find KPI’s which is connected to the strategies. The visual system obviously exists, but compared to Scania they are still a bit behind.
4.1.2AtlasCopco
As mentioned in the problem description, a study visit at Atlas Copco in the early fact gathering phase generated an idea of how to connect Top Management strategies to the daily work at Industrial Engineering FA (Fig 4.3). Company goals and strategies from Top Management are – via KPI’s (Key Performance Indicators) and Sub KPI’s – linked to activities and the daily work, which most likely creates understanding and motivation in the organization. It is easy and logic to connect daily activities to the general company goals, which is the purpose to this thesis.
Fig 4.3 – Company goals at Atlas Copco29
28 Study visit at Alfa Laval 29 Tobias Bergendahl, Atlas Copco

45
4.1.3Scania
Scania has a clear strategy from “P&L” level, which is the Top Management level for Production & Logistics. They create a strategy plan which for example includes a vision and goals. The goals could be 0 accidents, 0 faults, numbers of trucks per employee and year etc.
From the P&L level, the strategy is communicated down to the next level in the hierarchy. A strategic plan for DT (Driveline/Transmission) is developed and also this plan is communicated down to the next level in the hierarchy – to the DTA (Driveline/Transmission/Axis) department, that one Peter is the Manager for. Both the Manager Peter and his Production Engineering colleague Magnus state that the plan is easy to understand. The strategic goals are not only soft visions, but rather goals that you can measure. This is an advantage when it comes to activities on individual level, since you know exactly what the organization wants you to achieve. Magnus, which is on the level below Peter, creates his own plan together with his colleagues for their department and from that level, it is visualized how all initiatives are connected the Top Management Strategy. It is only on the last level – the production floor – that you can’t see the strategies on whiteboards. Floor staffs are included in the yearly review of the strategy, but all whiteboards in the production are connected to daily activities rather than long term strategy. Logic, but to create even more involvement at all levels, maybe it would be good to include more strategy on the bottom floor as well?
To create a strategy is one thing. The difficult part is to make it living – to build an organization in which feedback continuously run between departments and hierarchy levels. Scania is successful here. If we start from the production line level, Scania has developed a process called Real Time Management (RTM). RTM consists of a Supervisor for the specific production process step (in this case rear transmission drive lines) and a Team Leader for each part of the production process. In the production line, where the study visit was executed, the process is divided into two parts and therefore they have two Team Leaders, which are responsible for the staff in the production line. They report key numbers four times per day and the level above report this information further up in the organization one time per day. Every department all the way up to DT level receives information from the production floor every day. Every month, trends are reported to the P&L level that is responsible to update strategies and connect to the board of Scania. In this way, information and feedback passes through the whole organization.
The top strategy on Peter’s level is communicated every year; the key numbers every month and production floor status every day. In Magnus case, strategy for his tasks is developed once a year and this is based on the strategy from P&L. When Magnus strategy is set, it has to be approved by P&L. When the strategies are approved at all levels it is time to start working with them and this is done by following method:

46
Fig 4.4 – Scania strategy method
Peter tells that Scania has been very good in the Principals- and Methods parts, but much worse when it comes to the results. Results is about to execute the strategies that have been set within the organization. “We have developed the leadership part very much the last two years and everything is about leadership”, Peter tells. “However”, he continues, “there must be a balance between methods and results”. He means that too much effort on the result part might decrease the quality when it comes to methods and strategy.
Magnus has a similar role as the author to this report and I will know summarize his work regarding strategy here:
‐ P&L creates a scenario from s high level, which is connected to their strategy. It involves volume predictions, marketing information and so on.
‐ Magnus group use this information to calculate capacity scenarios and investment proposals.
‐ These scenarios are then sent to P&L for approval. If the proposals are approved, they can store the documents as their strategy direction and wait until next year’s strategy cycle.
‐ If the volumes increase as predicted, Magnus group can just open up the approved documents, choose the best case for the current situation and start working with the investments.
‐ The investments are transferred to an internal plan for the Industrial Engineering department and they can follow every step on a white board until the implementations are done.
Principals
Connected to Scania Production
System (SPS)
Methods
Management & Structure –
focus on understanding
Results
Get the employees involved to perform the
methods

47
‐ Status is reported every morning and if any problems – their Manager will ask for support higher up in the organization on the daily pulse meetings.
The strategies are clear and measurable, they are visual everywhere in the organization except in the production line and the reporting is done by daily basis at all levels. Even though floor staffs can’t see the actual strategy on their white boards, input from the daily meetings at this level are brought up to top management every day, via Engineers and their visual whiteboards. The Industrial Engineers activities are connected to the production lines, so they will automatically provide with strategic information from the floor. Last but not least, in the Management Office, the first thing you see is a monitor that visualizes cycle time, deviations and accumulated trucks per day. The impression is that a big eye is looking at the production from all levels within the organization.
Fig 4.5 – Scania’s PEIP Model30
30 Magnus Appelgren, Scania

48
4.1.4Volvo
The “study visit” at Volvo was not performed in a physical way, but information was gathered by e-mail conversations.
Fig 4.6 – Volvo’s team board31
Also at Volvo Cars, it is possible to follow the strategic goals and daily tasks at the same whiteboards.
Fig 4.7 – Volvo goals32
31 Fredrik Algurén, Maintenance Engineer 32 Fredrik Algurén, Maintenance Engineer

49
As the Fig 4.7 is illustrating, Volvo has a clear strategy of how to connect general goals from Volvo Cars Cooperation (VCC) all the way down to the team members in each department (Team). We can also see that crosshatched lines are included, which is the feedback loop.
Fig 4.8 – Goals clearly communicated model33
The strategies are divided into sub groups such as quality, economy, delivery etc.
Fig 4.9 – Team boards for overall objectives34 33 Fredrik Algurén, Maintenance Engineer
50
Team boards are then the results of the strategy break down that has been done for each department. Again, keep it locally.
4.2 Ericsson units within BNET Supply
In order to compare Industrial Engineering FA and PIM RBS Kista with other Ericsson factories, information has been gathered from Sweden’s remaining four Ericsson BNET Supply sites: Borås, Katrineholm, Kumla and Linköping. This information will be used in the survey chapter as well, when the author compares internal results from PIM RBS Kista with these sites.
4.2.1Borås
The Borås factory has a Balanced Scorecard (BSC), which they follow up and act on. Moreover, they also have something called Strategic Fitness Process (SFP) which works like this:
1. Management create a preliminary statement of direction based on long term objectives from their own factory, but also from BNET Supply
2. 100 anonymous persons within their organization, from different functions, read the SFP and comment on it
3. These 100 people are then interviewed by a task force group, consisting of 10 people
4. The task force group communicates the gathered strategy thoughts, known as the fish bowl, to the Management Team. The Management Team cannot do anything with the fish bowl, but just listen to the task force group
5. From the fish bowl and the task force group, the Statement of Direction (SOD) is updated
6. The SOD is divided into smaller parts that is suitable for each department
Magnus Dahlström, LEAN Manufacturing Engineer from Borås, mention that the visibility between the SOD and breakdown of activities for his department can be clearer, but highlights that their Visual Management System (VSM) whiteboards help a lot. A good example of how Visual Communication methods actually can support strategies.
34 Fredrik Algurén, Maintenance Engineer

51
Fig 4.10 – Program Plan for Borås 201335
As we can see in the figure above, SOD’s, Long Term Objectives and strategic activities are linked to strategy-information and workshops (WS). This is a good start to set personal goals that are linked to the overall strategy. Moreover, Fig 4.11 illustrates how Borås link their microwave strategies to daily activities:
Fig 4.11 – Whiteboard for Production Line Microwave in Borås36
35 Magnus Dahlström, LEAN Manufacturing Engineer

52
4.2.2Katrineholm
Katrineholm has KPI’s that are linked to their strategies. They have KPI’s that are followed up both on monthly and weekly basis and this is connected to the strategies from BNET Supply. Marcus Bohman, Supply Chain Leader at Katrineholm’s factory, reports “Delivery Precision First Confirmed” and “Confirmed vs. Requested Lead Time”:
Fig 4.12 – Katrineholm’s scorecard 201337
The figure on the next page shows a breakdown structure of Marcus department in Katrineholm. They have a similar process for the entire factory and all of goals are linked to the BNET Supply strategies and visualized to each individual. It is up to the department to create the link.
36 Magnus Dahlström, LEAN Manufacturing Engineer 37 Marcus Bohman, Supply Chain Leader

53
Fig 4.13 – Business Plan for Katrineholm 201338
Current status regarding strengths and weaknesses are developing the way to pole position for Katrineholm, as visualized in the figure above. They include both principles and values from BNET Supply level.
4.2.3Kumla
In the yearly Operational Development work, KPI’s are broken down into sub goals and actions, as well as building up the measurements. This is followed up by monthly basis and the KPI results are presented on a huge whiteboard that is placed between the reception and production.
38 Marcus Bohman, Supply Chain Leader

54
Fig 4.14 – Big whiteboard in Kumla, showing target tracking close to the reception39
Worth mention is that Patricia Kovatcheva, Producibility Engineer in Kumla, very seldom see someone in front of that board. It is big, the information is available, everyone passes it – but still few people notice it. Patricia is no longer involved in the strategic work, since she changed position. After that, she has not heard anything about KPI’s or how the link from her daily work shall be connected to them. Moreover, she tells that a big excel sheet that is created to measure the KPI’s are available, but since all Ericsson sites are involved it is time consuming. This confirms that you should start locally and get it work before you aim for the whole company.
In the same way as the author to this report feels like, Patricia is missing the link between BNET Supply strategies and the local strategies (KPI’s). She had a position as “KPI Driver” before and her department should generate data to the measurements. However, every month it was needed for her to chase updates. No one understood the meaning of it, even though she had training with them – including involvement and improvement tools for her measurements. It was perceived as “non-valuable tasks” that took valuable time from her colleagues “real tasks”. Patricia believes that the KPI’s are too abstract and too many.
39 Patricia Kovatcheva, Producibility Engineer

55
Fig 4.15 – Scorecard for Kumla’s line view40
Fig 4.15 shows that KPI’s exists, but what is missing is the strategy break down into individual tasks.
Fig 4.16 – Scorecard for Kumla’s Supply Product Management (SPM) view 201341 40 Patricia Kovatcheva, Producibility Engineer

56
4.2.4Linköping
Johan Ersson, Process Architect in Linköping, states that they work quite hard to achieve their KPI’s. Every year, SW Supply decides which strategy they should have based on the BNET Supply strategy. At least it should be like that, but today it seems like the SW Supply strategy is done slightly before the BNET Supply is set, which Johan – as well as the author to this report – believe is quite interesting.
However, based on the SW Supply strategy, KPI’s are developed in the beginning of the year, which are linked to the local and BNET Supply strategies. “Enable SW Sales” is one of the KPI’s and one relevant KPI for Johan, connected to ”Enable SW Sales”, could be to follow the number of Account Managers and Sales persons that are using Feature Store. With other words, he is using information from the license register to enable more SW sales.
At some places in Linköping, KPI’s are posted on whiteboards, but the normal way is to find the information in Eridoc, which is a database where different kind of information is gathered. “KPI mingle” was an activity where everybody that were KPI drivers could show their KPI’s and people could come and ask questions about them. According to Johan, this was appreciated within the organization.
Fig 4.17 – KPI for Usage of Feature Store42
41 Patricia Kovatcheva, Producibility Engineer 42 Johan Ersson, Process Architect
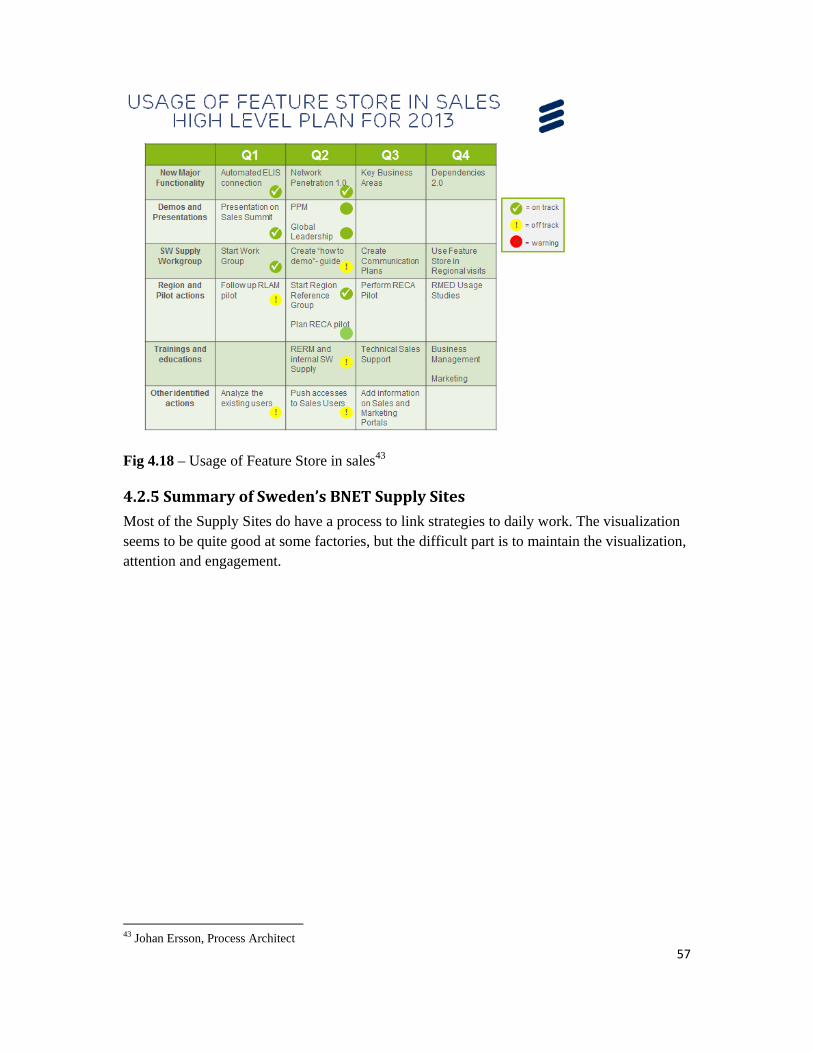
57
Fig 4.18 – Usage of Feature Store in sales43
4.2.5SummaryofSweden’sBNETSupplySites
Most of the Supply Sites do have a process to link strategies to daily work. The visualization seems to be quite good at some factories, but the difficult part is to maintain the visualization, attention and engagement.
43 Johan Ersson, Process Architect

58
4.3 Survey results
To increase the concept validity and reliability, four surveys were performed at PIM RBS Kista. One for the Industrial Engineering FA department, one for Global Technical Dimensioning stakeholder’s, one for random employees at PIM RBS Kista and finally one for the Managers. The questions were formulized in a way that could give the author answers about the strategy awareness situation at the Industrial Engineering FA department, compared to other employees outside the department and also the manager’s point of views. 7 out of 7 from the Industrial Engineering FA department answered the survey, 9 out of 9 from the Global Technical Dimensioning stakeholder’s, 39 answers were collected from the random employees and 0 out of 4 from the Management group. The number of questions varied from 14 to 38 questions, depending on which group it was. More questions were added into the stakeholder survey since that one also gave input to the Visual Communication Plan the author planned to do. The type of questions was mostly about perception of strategy and how the strategy was communicated and/or received. The reader can find the complete surveys as attachments in the appendix part of this report.
4.3.1IndustrialEngineeringFA
The author to this report does not see the link between strategies and the daily work. A survey for his department, Industrial Engineering FA, was performed to see if his colleagues had same thought regarding this. 7 out of 7 from the Industrial Engineering FA department answered the survey and here are some of the results:
71 % of the Industrial Engineering FA employees think that the goals and KPI’s connected to the BNET Supply strategies either are “not very clear” or “very unclear” (Fig 4.19).
Fig 4.19 – Goals and KPI’s connected to the BNET Supply strategies
Regarding the RACO goals, those who should be closer to the Industrial Engineering FA organization compared to the BNET Supply strategies, 85% of the employees think that the strategies are “not very clear” or “very unclear” (Fig 4.20).
Fig 4.20 – Goals and KPI’s connected to RACO strategies

59
The statistics shows better results for PIM RBS Kista’s strategies, but still 57% think that the goals and KPI’s are “not very clear” or “very unclear” (Fig 4.21).
Fig 4.21 – Goals and KPI’s connected to PIM RBS Kista’s strategies
43% feels the same for Engineering’s goals and KPI’s which are their own (Fig 4.22).
Fig 4.22 – Goals and KPI’s connected to Engineering’s strategies
29% receive strategic information more frequently than monthly basis and 71% more seldom than once per month (Fig 4.23).
Fig 4.23 – Frequency of strategic information
Interesting is that 57% of the Industrial Engineering department want to receive strategic information by monthly basis and 43% would like to receive updates on daily- or weekly basis (Fig 4.24).
Fig 4.24 – Need of strategic information
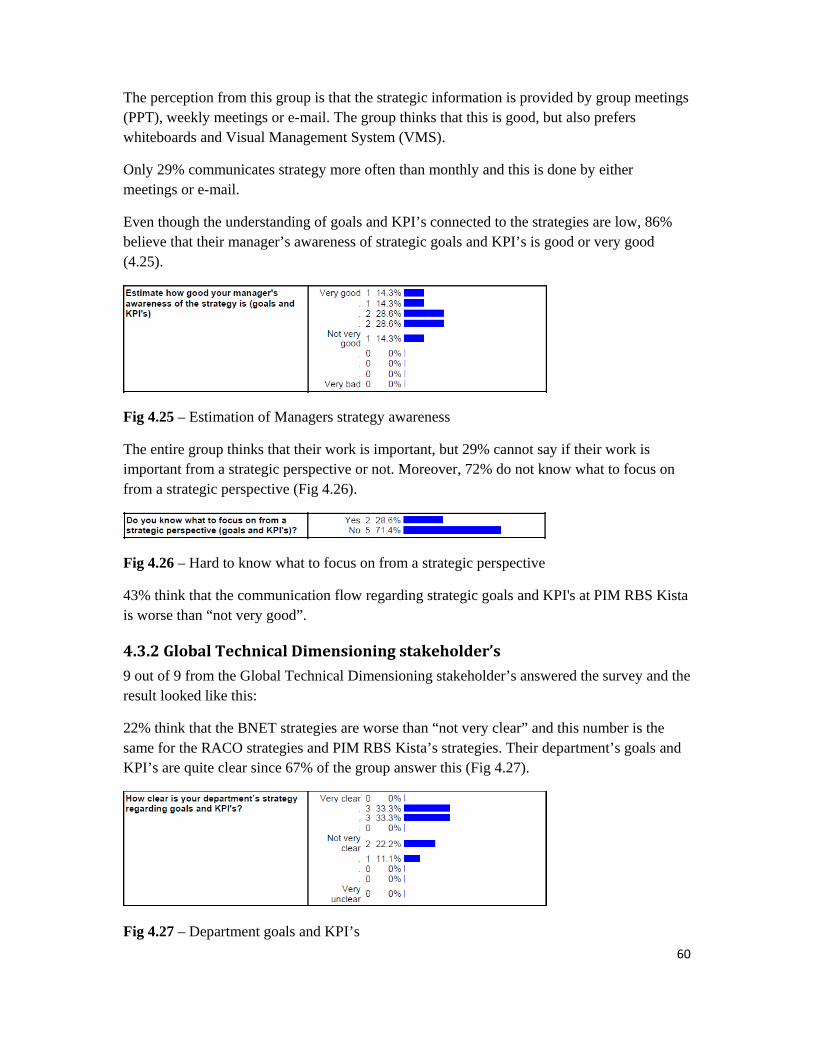
60
The perception from this group is that the strategic information is provided by group meetings (PPT), weekly meetings or e-mail. The group thinks that this is good, but also prefers whiteboards and Visual Management System (VMS).
Only 29% communicates strategy more often than monthly and this is done by either meetings or e-mail.
Even though the understanding of goals and KPI’s connected to the strategies are low, 86% believe that their manager’s awareness of strategic goals and KPI’s is good or very good (4.25).
Fig 4.25 – Estimation of Managers strategy awareness
The entire group thinks that their work is important, but 29% cannot say if their work is important from a strategic perspective or not. Moreover, 72% do not know what to focus on from a strategic perspective (Fig 4.26).
Fig 4.26 – Hard to know what to focus on from a strategic perspective
43% think that the communication flow regarding strategic goals and KPI's at PIM RBS Kista is worse than “not very good”.
4.3.2GlobalTechnicalDimensioningstakeholder’s
9 out of 9 from the Global Technical Dimensioning stakeholder’s answered the survey and the result looked like this:
22% think that the BNET strategies are worse than “not very clear” and this number is the same for the RACO strategies and PIM RBS Kista’s strategies. Their department’s goals and KPI’s are quite clear since 67% of the group answer this (Fig 4.27).
Fig 4.27 – Department goals and KPI’s
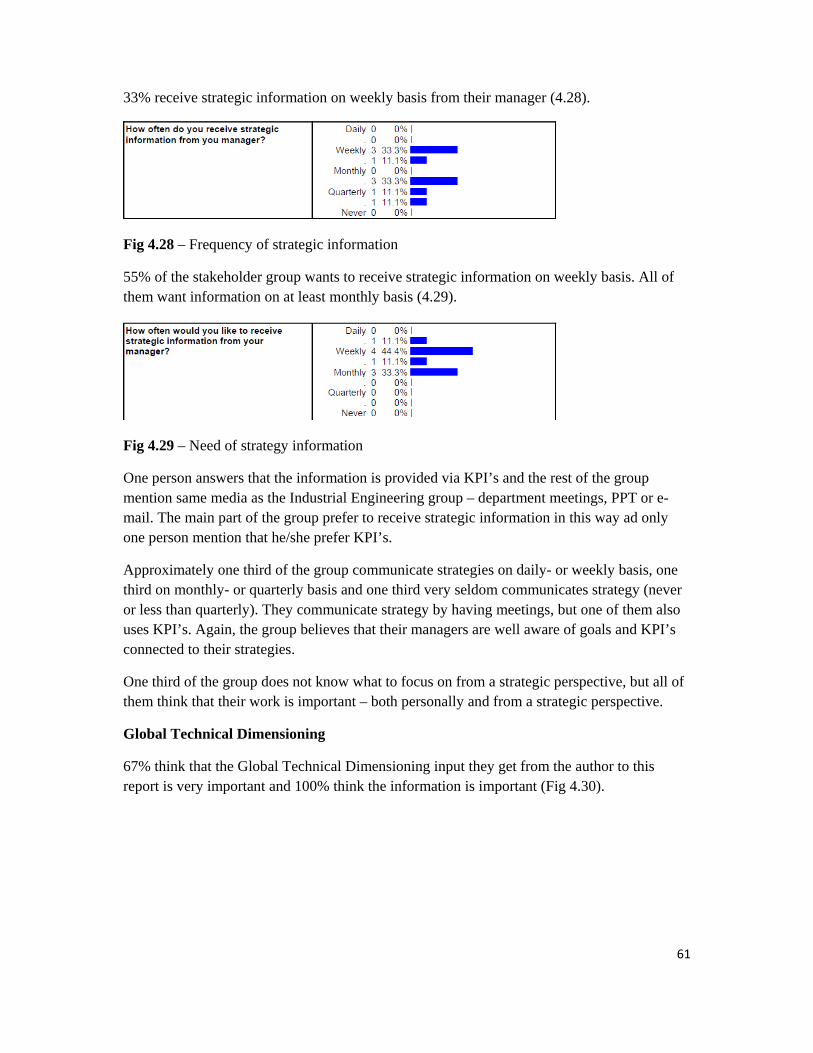
61
33% receive strategic information on weekly basis from their manager (4.28).
Fig 4.28 – Frequency of strategic information
55% of the stakeholder group wants to receive strategic information on weekly basis. All of them want information on at least monthly basis (4.29).
Fig 4.29 – Need of strategy information
One person answers that the information is provided via KPI’s and the rest of the group mention same media as the Industrial Engineering group – department meetings, PPT or e-mail. The main part of the group prefer to receive strategic information in this way ad only one person mention that he/she prefer KPI’s.
Approximately one third of the group communicate strategies on daily- or weekly basis, one third on monthly- or quarterly basis and one third very seldom communicates strategy (never or less than quarterly). They communicate strategy by having meetings, but one of them also uses KPI’s. Again, the group believes that their managers are well aware of goals and KPI’s connected to their strategies.
One third of the group does not know what to focus on from a strategic perspective, but all of them think that their work is important – both personally and from a strategic perspective.
Global Technical Dimensioning
67% think that the Global Technical Dimensioning input they get from the author to this report is very important and 100% think the information is important (Fig 4.30).

62
Fig 4.30 – Global Technical Dimensioning information
They receive information on weekly- or monthly basis which is aligned with their needs. How the information is presented varies from e-mail to presentations or stored data files on the intranet. Some of the stakeholders prefer to use e-mail and discuss the data on lie meetings, while others mention Ericoll (internal system at Ericsson where data files can be stored).
89% think that the information is easy to understand and reliable. The most important information is:
Needed investments
Global needs
How many filter units that could be produced per site and month
Availability of technical capacity globally and per volume production site
Enough equipment and relevant OP times
Real/true capacity figures based on near time information and how this will affect the Demand Forecast (DF)
Capacity per product group (PL4, PL5 RUS and PL5 RRUS)
Capacity ramp up plan
Predictions and ideas what is needed in future and possible consolidations – alternative solutions like hiring equipment
11% miss some information and this is connected to the near time perspective – how the figures affect DF. 11% of the stakeholders believe that there is too much information and this is mainly connected to the disability to choose a specific product and/or site to see technical capacity for those. It should be easier to highlight technical capacity for a specific product.
89% of the stakeholders share the information they get to other parties, mainly by forward the information, weekly presentations, monthly department meetings, project meetings, steering committees and other forum.

63
78% get feedback on the information they share on weekly- o monthly basis (Fig 4.31).
Fig 4.31 – Feedback on capacity information
In general the Technical Dimensioning stakeholders believe that the communication flow regarding strategic goals and KPI's at PIM RBS Kista is relatively good – only 22% say that the communication is “not very good” or worse.
4.3.3PIMRBSKista
39 answers from the random employees were collected to see how they perceive goals and KPI’s regarding strategies at PIM RBS Kista. Here is the result:
26% think that the strategies are “very unclear”, when it comes to goals and KPI’s. 69% think that the strategies are “not very clear” or worse (Fig 4.32).
Fig 4.32 – Goals and KPI’s connected to the BNET Supply strategies
The spread is almost the same for RACO’s strategies and also for PIM RBS Kista.
Strategy perception for each employee’s department is a slightly better, but still 65% think that the strategies are “not very clear” or worse (Fig 4.33).
Fig 4.33 – Goals and KPI’s connected to the employee’s department

64
The trend continuous – it is lack of strategy understanding at PIM RBS Kista. 13% receive strategic information more frequently than monthly basis and 64% state that they receive strategic information less than monthly (Fig 4.34).
Fig 4.34 – Frequency of strategic information
At the same time, as much as 80% wish to receive information somewhere between weekly- and monthly basis (Fig 4.35).
Fig 4.35 – Need of strategic information
The majority receives strategic information at meetings and no one mention any visual tools except PPT. When analyzing the results from the question regarding how they would like to receive strategic information, it is clear that most of the people prefer meetings and e-mails just like it is today.
31% never communicates strategy and the people who do – it is mainly on monthly or quarterly basis. It is often done by presentations or report form. 31% also believe that their manager’s awareness of strategy and linked goals and KPI’s is “not very god” or worse.
56% do not know what to focus on from a strategic perspective, 18% do not know if their work are important from a strategic perspective but over 90% think that their work is important. 20% say that the communication flow regarding strategic goals and KPI's at PIM RBS Kista is very bad. 64% think it is “not very good” or worse.
Again, the surveys are attached in the end of this report, if the reader wants to get more detailed information.
4.3.4TopManagement’sPerspective
None of the Manager’s answered the survey, but all of them answered on the relevant questions in some way – either on e-mail or participated in personal meetings. In this chapter we will see how all managers from Martin Johansson to the author’s manager within Industrial Engineering FA, Henrik Wilstam, perceive that the strategic communication works.
65
Martin Johansson (Vice President Supply)
The strategies are still under preparation and will be finished right before summer. On BNET level, the strategies will be presented on the Leadership Summit. The updated Supply Strategy arrives a little bit later in June and will be presented on the BNET Supply Top 120 meeting. The distribution will be done in many different ways as usual. There will be articles on the web. Video clips and other material will be spread through different employee meetings etc. So, we do not only rely on manager communication even though that is important. It is there you can have a dialogue. Martin tells that he doesn’t have time to spread strategy; instead the focus is on new strategies (generally speaking). The strategy plan is valid for 3-5 years.
Lars Ottoson (Head of RACO)
Fortunately, Lars is a nice person which took his time for me as a student, even though he doesn’t got plenty of excess time. He accepted the meeting invitation because on one main reason – he hasn’t heard much about Visual Communication with a strategic focus before, so he was really interested.
In Lars opinion, goals and KPI’s works out well - they are clear and logic, easy to measure and the reporting from lower levels in the hierarchy is good. The reporting is performed every month, at all levels from my level up to Ericsson’s CEO Hans Vestberg.
However, it’s more difficult when it comes to strategies. Lars finds it hard to break down strategies into different levels and it’s sometimes unclear if it is a business strategy or operations strategy they are working with. This is important to know, to be able to send messages down in the hierarchy to create daily activities of it.
When I ask him how he would like to have it, regarding communicating strategies, he answers: “I want that the person working with stones shall see how valuable he is for the St Petersburg Church”. That is a good metaphor and this is what I’m searching for. I want to know what my daily activities means for Ericsson in a larger perspective. He finishes the interview by saying “I prefer metaphors and pictures rather than just text”. He believes that the visualization of strategy not should be from the very top level all the way down to the floor, but from a certain level above the floor (for e.g. PIM RBS Kista level). Focus on visual strategy communication from that level will most likely be more successful.
Henrik Forsberg (Head of PIM RBS Kista)
I didn’t meet Henrik, but he answered on my questions by e-mail. On the questions if the idea is that strategies from Martin Johansson’s level shall be distributed down in the organization via him, or if they shall be communicated in another way now when ”transparency” is prioritized from BNET Supply level, he answers:
‐ The idea is that BNET strategies and the progress shall be communicated as a cascade through the whole organization via managers, connected to PIM RBS Kista’s strategy that supports the BNET strategy. However, this has been very unsuccessful the latest

66
nine months due to the layoffs, but we now have full focus to set the new strategies and communicate these. One other important communication channel for BNET Supply strategies is the home page, where updates continuously are uploaded.
Next question was if he could feel that the strategies from BNET Supply Top Management (Martin J & Lars O) are clear enough, so that he know what for e.g. the Engineering department shall focus on. The answer was this:
‐ The strategies are quite clear but we have a challenge to, in an easy way, connect the “hamburger” (the BNET Supply strategy concept from Martin Johansson) to the cross functional work within RBS Lean Program and it is important that we sort out how our Master Plan is connected to other strategy initiatives within BNET Supply, the RBS LEAN Program and Hardware make.
The last question was if he has a strategy when it comes to Visual Communication within the organization:
‐ We have included this in the coming strategy work, how to create a good communication regarding strategies. I see this as two parts, where the first important one is to create involvement in the current strategy work to spread information, but most important, to involve and create engagement in the coming strategy deployment. The other part is about setting up a good and continuous communication regarding the strategy implementation progress and here I see different useful tools such as weekly/monthly letters, whiteboards, AEM etc.
It is also worth to mention that the invitations to PIM RBS Kista’s All Employee Meetings (AEM) do not have any content at all, just information about where the meeting is and which time. Why not take the opportunity to write a short agenda, what the focus will be on from now, or just to say “welcome” when the e-mail reaches the entire organization? Especially after the layoffs in Q1-Q2 2013, when Ericsson reduced the personnel with ~40%, it is probably more important with information - to increase motivation and engagement. In fact, also during the layoffs, when many people were worried, it was very small amounts of information within PIM RBS Kista. This is in some way understandable, since the union did not provide much information, but some kind of visualization about the progress and way forward could have been good.
Jonas Odin (Engineering Manager) and Henrik Wilstam (Industrial Engineering Manager)
The first question to Henrik and Jonas was to see if the strategy from Head of PIM RBS Kista is clear enough, to be able to set their own targets. The answer on that one was “yes”. However, strategies from highest levels within Supply can confuse sometimes. Head of the factory and his also his Manager communicates fairly clear strategies, goals and KPI’s, but from even higher management it seems to more unclear. Jonas tells that he worked with strategic focus areas (SFA’s), which are connected to the Top Management strategies. At least

67
before, they could go through all the SFA’s and reflect on whether the focus areas were connected to the strategy or not. Sometimes they could delete one if it was selected as “not relevant”. However, this way of working is not always running and new strategies are coming so it’s put on hold.
Another method they use is the “3-3-6” one:
Activity 3 Weeks 3 Months 6 Months
Industrial Engineering
Improve fixtures Reduce cycle times Shorten TTM
Quality Improve yields Analyze ceramics Visit suppliers
Fig 4.36 – 3-3-6 Method
From the strategy, activities are decided for near time (this month), quarterly (3 months) and with a 6 month perspective. This is something that really visualizes the strategy into daily activities, but I have never seen it.
One big issue for the moment, Jonas tells, is that different departments within the organization have their own escalations and prioritizations. Project groups, Operations, Task force groups etc. Everyone wants to use the resources to solve their specific problems. We are back at the main questions again. When this situation appears, what should I focus on from a strategic perspective? Is it possible to visualize the strategy to make this decision?
There is no strategy to communicate in a visual way, but they try to highlight focus areas, such as “World Class Filters” and “Secure Leadership”. Initiatives start from lower- and higher levels at the same time, so strategies are already ongoing when Top Management presents their way forward. A question, according to Jonas, could be: does the strategy means that we can or that we shall secure man hours?

68
Fig 4.37 – The pleasure arousal matrix44
Figure 4.37 explains how human beings feel and how the chemistry in our bodies changes. The Y axis shows the level of satisfaction and the X axis shows the level of excitement or stress. The blue line, which is called the “serious line”, use to have two characteristics: To the left, we are calm and relaxed and to the right we are worried and anxious. The orange line is called “playful”, that one who gives energy. To the left, we are bored and to the right we are excited. In the green area at the top, we have a zone where you perform well. Stress appears when people are worried and excited which can lead to stress related diseases. The parking place is a place where nothing much happens, but if people get stuck in the depression phase, it could take long time to leave the zone.
What does PIM RBS Kista do to make their employees get in the green zone? Where does PIM RBS Kista allow their employees to be? You can’t just work with KPI’s; there must be room for new ideas. Google let their employees be innovative 20% of their time at work for example, Jonas says.
4.4 Communication strategy
4.4.1PIMRBSKista
Julia45 tells that new strategies at all levels soon are going to be set. Local Leadership Conference is a typical way of distributing information about strategies once a year. At that meeting they choose the way forward, from Top Management down to the Engineering Manager at PIM RBS Kista. Other traditional ways of sharing strategies are All Employee Meetings (AEM), group meetings and information on data screens in for e.g. the canteen. The yearly cycle is provided with information from SWOT analyses and other tools to be updated
44 From the meeting with Jonas Odin 2013-05-21, a matrix from the American Psychologist M. J. Apter 45 Julia Mastelle (Internal Communications PIM RBS Kista)

69
regarding strategy direction. If no big changes, Top Management can focus more on the communication. If Management spends lot of time on setting new strategies, less time will be available for distributing it.
Julia tried to use A4’s and A3’s to share strategies, but she noticed that the interest for these lasted for a very short time. Her proposal, when talking about using papers, is to change continuously. For example, if you have three important strategies do not show all of them all the time, but switch side and focus on maybe one strategy per week instead. She believes that the Managers should give feedback on strategies almost every day, which is the case at for e.g. Scania. Today, this is not the case at PIM RBS Kista.
She ends the meeting with a quote she believes come from Scania: “The best way to communicate is to put posters in the toilet”. True or false, I don’t know.
Next meeting with Julia was performed together with Jan Kihl from Operational Development: According to Jan, there are differences between strategies and strategic focus areas and he perceive it as these two bumps into each other now and then. Jan thinks it is important to make concrete actions of the activities.
During the conversation with Jan and Julia, it appears that PIM RBS Kista’s strategic plan will be finished before the general BNET strategic plan. Based on personal opinion during my observations during the meeting, this is not an ideal way of working and the risk is that the strategy at PIM RBS Kista not will be completely aligned with the BNET strategy. Moreover, Julia mentioned that the RACO strategy absorbs needs from PIM RBS Kista and adjust their strategies based on that information. Sometimes RACO present too much strategic information on high level that could be on PIM RBS Kista level instead. “How do you think? How do you think?” rather than “here is our strategy”. More focus on how to keep together this flow is wanted from both Julia and Jan.
Jan wants that SPM (Supply Product Manager) filter supports the LTO’s (Long Term Objectives) by connecting the strategy tree, via KPI’s and sub KPI’s, to individuals within for e.g. Industrial Engineering FA. Last but not least, Julia confirms that PIM RBA Kista don’t have their own Communication Plan, but follows the same plan as BNET Supply is using. Maybe this affects how the strategy is received by the employees at PIM RBS Kista?
Just before midsummer, two weeks before the presentation of this thesis, PIM RBS Kista had an All Employee Meeting (AEM) to communicate the way forward for the factory – even though the strategy from higher level was not communicated yet. However, Henrik Forsberg (Head of PIM RBS Kista) went through the presentation (53 pages) and clarified that the strategies could be changed after summer, when all strategies from Top Management are set. These were the highlighted insights form PIM RBS Kista at the AEM:

70
Fig 4.38 – PIM RBS Kista Insights - Conclusions46
At the top, we find “Flow, transparency and continuous learning” and “Our culture, values and targets”. Moreover, the wanted position for PIM RBS Kista includes:
Fig 4.39 – Wanted Position at PIM RBS Kista47
46 PIM RBS Kista All Employee Meeting 2013-06-18 47 PIM RBS Kista All Employee Meeting 2013-06-18
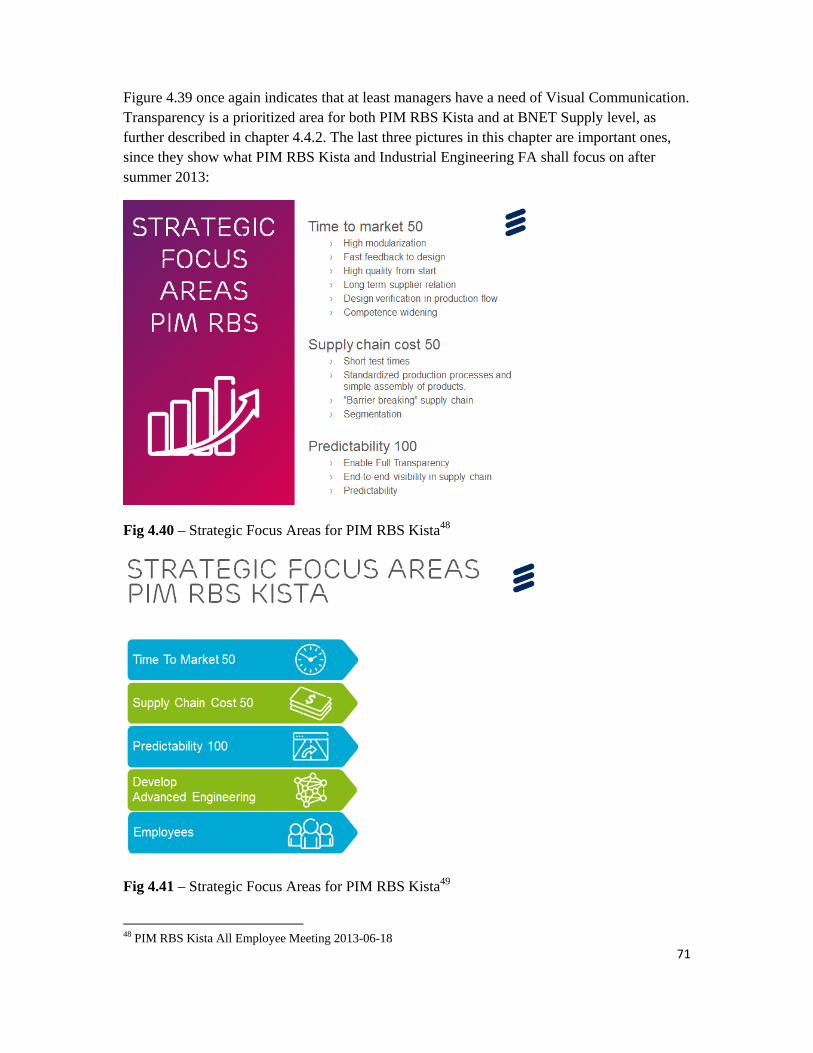
71
Figure 4.39 once again indicates that at least managers have a need of Visual Communication. Transparency is a prioritized area for both PIM RBS Kista and at BNET Supply level, as further described in chapter 4.4.2. The last three pictures in this chapter are important ones, since they show what PIM RBS Kista and Industrial Engineering FA shall focus on after summer 2013:
Fig 4.40 – Strategic Focus Areas for PIM RBS Kista48
Fig 4.41 – Strategic Focus Areas for PIM RBS Kista49
48 PIM RBS Kista All Employee Meeting 2013-06-18

72
Fig 4.42 – Strategy to Action for PIM RBS Kista50
In Fig 4.42 we can see that BNET Supply strategies and the belonging processes should support and contribute to reach targets and follow the roadmap that are set. How this shall be linked to the daily work at Industrial Engineering FA will be described in chapter 6.
4.4.2BNETSupply
The main strategy communication channel is the Managers, Monika and Ulrika says51. The purpose of their BNET Strategy Communication Plan is to define common objectives and a common platform for strategy communications within BNET, to make the future direction of BNET “stick”.
– Create stronger impact via a common framework to scale communications
– Leverage on the whole BNET Internal Communications network
– Focus on the right things that make a difference
The key stakeholders and target audience when it comes to the BNET strategy are:
Key stakeholder BNET strategy communication:
– BNET MT (Management Teams) – as owners of strategy
– BNET IC (Internal Communications) Team and Network – as drivers of strategy communication
49 PIM RBS Kista All Employee Meeting 2013-06-18 50 PIM RBS Kista All Employee Meeting 2013-06-18 51 Monika Lindgren (Manager Internal Communications) and Ulrika Wikner (Global Supply Chain Strategy)

73
Primary Target audience BNET messages:
– BNET Top 200 meeting and future leaders/talents
– BNET all managers
– All employees
Target audience units - making the link to BNET in unit communication:
– Unit Top mangers
– Unit All managers
– Unit All employees
“Critical to success” is about BNET LT (Leadership Team) buy-in and intriguing the Strategy Communication Plan, to secure that for e.g. Supply is fully aligned on few key messages. They are mentioning story telling as one strategy to visualize in an appealing way – to get feelings and clear link to products. Moreover, visualize employees and their strategy connection, imagery material: on live interactive maps with highlighted icons to provoke questions, involve leaders early via communicative leadership training etc. To sum up this, the communication objectives are:
Know:
– Top 200/all managers/future leaders: Grasp our way forward and how we shall get there (the BNET strategy 3-5 key messages), where to find support material
– All employees: Our way forward and how we should get there
Feel:
– Top 200/all Managers/future leaders: Proud of what we've accomplished and who we are, and confidence for the future. Engagement and support for the future direction.
– All employees: Proud of what we've accomplished and who we are, and confidence for the future. Engagement and support for the future direction.
Do:
– Top 200/all managers/future leaders: Create and communicate the link to their own unit and the individual (use support material)
– All employees: Curious on how I can deliver on the strategy and share with others what I do

74
Phase 1 for the strategy key messages are about to tell a story of where we were, where we are and where we are heading. A story of what our business strategies shall deliver to get us there. An activation phase – let’s make it happen. Lastly, it’s about to connect everything to the operations strategy, which are: transparency, continuous learning and flow efficiency.
Phase 2 is a story of how my unit work with doing the right things and doing things right to get focused growth and efficient ways of working. It is a story of how the leadership and talent are needed to fulfill the operations strategy. It is a story on how I can link strategy to my IPM talk - how we deliver.
Examples of how to communicate are:
– Few messages (3-5) even for BNET LT
– Easy to GRASP, target messages
– Explain what took us here
– Work deeper in “making the link”. What’s in it for me?
– Package a workshop and how to facilitate the work to link
– Enlighten strategy work that’s carried out
– Focus on achievements
– Connect to operational strategy (the 3 new areas: transparency, continuous learning, flow efficiency)
Fig 4.43 – BNET Operations Strategy52
52 PIM RBS Kista All Employee Meeting 2013-06-18

75
Enable full transparency from higher management level is a perfect initiative to get more attention in the local Visual Communication Implementation.
The activity plan also includes things like: business strategy manager’s chats, webinars for employees, strategy day (2 or 3 time/year), “creative and crazy” set up with speaker corners, easy communication packages for managers, user guide to managers how to use strategy communication material, support managers to make it easier for them to connect to in daily work etc. What we can see here, is that a plan from highest BNET Supply level is set – they are aware of the importance to connect strategies to the daily work at all levels within the organization. The question is how this shall be done. Henrik Forsberg, Julia Mastelle, Jonas Odin and Henrik Wilstam – with other words all Managers responsible for communicating the strategy in the hierarchy above the author to this report – do not have this “How Plan”. All of them are also aware of the problem to connect strategies to daily work, but there is still no plan for it. The strategy managers from BNET Supply level have decided to measure strategy understanding like this:
– Web poll on regular basis to adjust what we do in communication
– Focus Groups, PA/PDU/BNET/Future leaders/talents cross representatives
Fig 4.44 – Strategy Communication Activities53
Figure 4.44 summarizes what we have just said and next steps for Ericsson BNET now are:
› Order animated film and voice over film, rollups and posters
› Input from Internal Communications team, Supply film clips and/or still photos 53 PIM RBS Kista All Employee Meeting 2013-06-18
Strategy communication Activities
Q4 Q1
Q3 Q2
Jan
Feb
Mar
Apr
May
JunJul
Aug
Sep
Oct
Nov
Dec
Strategy execution year before:
- Top 200 managers
- BNET AEM
- Focused projects articles & films
Strategy 2013 Phase 1a - overall:
- Top 200 managers,
- Leadership summit
- BNET AEM
- Managers Kit
- Advisory board
Strategy 2013Phase 1b, overall:
- Recap overall
- Business strategies chat + films + proof point SNP – the link
- Communicative leadership training
Strategy 2013Phase 2, execution:
- Link to individual
- Experience sharing
- Strategy day-s
- AEM & Top 200
- Outside in BNET Strategy

76
› Before summer - draft plan for phase 1b and phase 2
– Book persons (top management) for filming
– Internal Communications to coordinate planning for Business Strategy Management chats in September
– Book time in August for Internal Communications to go through Management chat tool
– Coordinate Business Strategy messages with external strategic communications
– Plan draft for how to execute on communicative leadership training
Again, this is still on a high level far away from the daily work for Industrial Engineering FA. The question remains, how to connect top management strategies to the daily work for Industrial Engineering FA?
As we can see in Fig 4.45 below, the communicated strategies from PIM RBS Kista was performed earlier than the approved business plans & functional strategies from BNET Supply level, which are planned in late June (Leadership summit).
Fig 4.45 – Ericsson Strategy Wheel54
54 PIM RBS Kista All Employee Meeting 2013-06-18

77
4.5 SWOT
To develop as good Visual Communication Plan as possible and to sum up today’s situation, a SWOT analysis is performed. Threats and opportunities are put first, since the problem area needs to be analyzed first. Then, appropriate actions will be chosen to try to solve the problem regarding Visual Communication within Industrial Engineering FA. Threats:
1. Lack of strategy understanding at PIM RBS Kista. What are the consequences if Top Management strategies are not communicated in the right way?
2. Focus on wrong tasks. What are the current risks/obstacles Industrial Engineering FA is facing today, when not understanding the strategy?
3. Which factors, when implementing Visual Communication, could present obstacles?
Opportunities:
4. Appreciated and easy understanding information according to the stakeholders within Global Technical Dimensioning – good base for improving even more
5. More detailed technical capacity information could be presented in future, that also includes near time planning (first 12 weeks) – opportunity to strengthen information
6. Instant updates and possibility to see capacity for specific products and sites – new software technologies?
7. More information, more detailed information and even better visibility is a summary of how to make the Industrial Engineering FA department to grow
Below, strengths and weaknesses are matched against the threats and opportunities: Strengths:
1. The managers are aware of the importance to make the employees understand strategies and this is a political advantage which will make it easier to get support during the Visual Communication implementation
2. Visual Communication knowledge within the department and a couple of potential drivers that could implement a better visualization
3. Already aware of the problem that obstacles can appear this new way of working, so preventive actions will be considered when creating the Visual Communication Plan
Weaknesses:
4. Important to listen to the stakeholders within Global Technical Dimensioning and not be too confident regarding the distributed information – better every day is the aim
5. Near time planning is difficult to keep control of today, but since the information is needed from the stakeholders, this should be included in the visualization

78
6. Conventional excel sheets could work to cover the needs, but in long term, after the local visualization has been successfully implemented, a more modern system might be considered to be able to distribute information to external stakeholders as well as local
7. A risk is if accountable persons do not listen to their stakeholders everyday
4.5.1SummarySWOT
Nothing impossible appeared during the surveys and interviews, so the way forward for Industrial Engineering FA, including Global Technical Dimensioning, is to keep listen to the stakeholders and work hard to implement a more visual organization – that hopefully will strengthen the understanding of strategies in long term. The lack of understanding today is, according to the author to this report, an advantage when implementing Visual Communication. More attention, better understanding of the problem and hopefully increased motivation within the department.
4.6 Summary of communication strategy
Even though the setup is not completely standardized, PIM RBS Kista and other Ericsson Supply sites do have KPI’s to connect strategies to the daily work. According to the comparison with Alfa Laval, Atlas Copco and Scania, KPI’s are appropriate to use, to connect strategies to daily work, so that is not the problem. The problem is how the strategies are communicated. The alert reader might notice that PIM RBS Kista presented 53 pages at their previous AEM. The aim from BNET Supply level is “Few messages (3-5)”, so it’s a big gap. As we can see in Fig 4.46, insights, wanted positions, focus areas, strategies to action, BNET operations strategies etc. were presented at the same time. In addition to this, more slides from different departments were presented with their own insights and focus areas. Even though the author to this report is into the strategy subject due to this report, it was difficult to understand and see the link between insights, wanted positions, different focus areas, actions, strategy wheels etc. What is really the strategy and what should we focus on? How can I create KPI’s and individual goals for employees within Industrial Engineering FA?

79
Fig 4.46 – Slides from AEM55
55 PIM RBS Kista All Employee Meeting 2013-06-18

80
Fig 4.47 – PIM RBS Kista homepage56
When entering PIM RBS Kista’s homepage (Fig 4.47), “Supply Strategy” appears. When clicking on this link, to see what strategies we are striving for, following appears:
Fig 4.48 – PIM RBS Kista homepage57 56 Internal homepage, Ericsson

Latest uenter Raintentio
Fig 4.49
The Supstrategy
Fig 4.50
57 Interna58 Interna
update is froadio & Coren was to hig
9 – Supply s
pply strategy slides.
0 – Producti
al homepage, Eal homepage, E
om 14th of Oe Supply’s hghlight 3-5
strategy pre
y presentati
ion key take
Ericsson Ericsson
October 201homepage. Key Messa
esentation58
ion (Fig 4.4
e-away from
1. To be abFrom there
ages from R
49) does not
m the strateg
ble to see anit is possib
RACO level,
t highlight 3
gies59
ny strategiesle to choose, but this is
3-5 key mes
s it is necesse “Strategienot easy:
ssages, but 1
81
sary to es”. My
101

Some ki4.50 seeexamplefor the r
Fig 4.51
The conmany mdown thnumber importa
59 Interna
BNETSuppl
RACO
PIMRBS K
IndustrEng. F
ind of sortinems to be ree in chapterreader, follo
1 – Strategy
nclusion fromessages. Thhese into gor of focus arant and then
al homepage, E
T ly
• Strate• 3-5 K
O
• 101 s• Diffic
M KI
• 53 sli• Insig
opera
rial FA
• BNE• PIM
strate• It is a
ng is definitelevant for Ir 6, where thowing figure
y communic
m this chaphe aim is to
oals and KPIreas and putn it suddenly
Ericsson
egy commuKey message
slide presencult to unde
ide presentahts, wantedations strate
T Supply stRBS Kista
egies to actia mix of eve
tely neededIndustrial Enhe conclusioe try to sum
cation flow
pter is that thcommunic
I’s, but this t effort on thy becomes t
unication maes is the goa
ntationerstand
ation at the pd positions, fegies etc. we
trategies andstrategies, ion, operatioerything wh
d and after a ngineering on and way
m up how th
today
he strategy ate strategieis not the re
he most impoo abstract.
ainly via maal from this
previous AEfocus areas,ere included
dinsights, waons strategiehich is confu
while the fFA. This co forward is e strategy c
communicaes with 3-5 eality todayportant one,.
anagerss level
EM, strategies td
anted positioes etc.using for the
findings higould be somdescribed. T
communicat
ation is too key messag
y. Instead of, everything
to action, B
ons, focus a
e employee
ghlighted in mething to u
To make it tion flow is
wide with tges and thenf choosing ag is consider
BNET
areas,
es
82
Fig use as an
clear today:
too n break a red

83
4.6.1Definitions
Many different words have been used for more or less same things in the chapter and it could be easy to mix them up. Here is a short summary:
Insights (gathered information regarding what we have to do and what to focus on)
KPI’s (Key Performance Indicators – to follow up and measure)
Sub KPI’s (KPI’s on individual level –set up own goals to strive for and measure)
Long term objectives (what to focus on in long term)
Operational strategy (strategies from high level – how they want us to operate)
Strategic focus areas (the most important to focus on)
Strategies (what to focus on – the way forward)
From now on the word “strategies” will be used instead of “insights”, “long term objectives”, “operational strategy” and “strategic focus areas” to make it more clearly for the reader. However, words used in graphs and figures will not be changed.

5ResIn this c
Fig 5.1
Based oEnginee
Fig 5.2
By lookfrom a dcompanEspeciaThe straThis is aorganiza
ultschapter, the
– Report su
on the externering FA de
– Study vis
king at otherdifferent annies actuallyally Scania sategic goalsan advantagation wants
Intro
In
most impor
ummary
nal study viepartment ca
sit summary
r companiesgle. The mo
y use Visualseems to hav for them ar
ge when it cs you to ach
1.
oduction
2.
Metho
ndustrial En
Sc
Atlas Copco
rtant finding
isits and obsan improve
y
s, as illustraost importanl Communicve a solid pre not only
comes to actieve.
ods
3.
Theories
ngineering F
cania
Alfa Laval
gs from the
servations, Pwithin the V
ated in Fig 5nt findings fcation to co
process whesoft visionstivities on in
4.
Empiric findings
FA
surveys an
PIMS RBS Visual Com
5.2, it is posfrom the stu
onnect straten it comes t
s, but rather ndividual le
5.
Results
Conc
nd observatio
Kista and tmmunication
ssible to refludy visits wegies to theito break dowgoals that y
evel, since i
6.
clusions
ons is prese
the Industrian area.
flect at a prowere that all ir daily workwns of stratyou can met is clear wh
84
ented.
al
oblem other k. tegies. asure. hat the
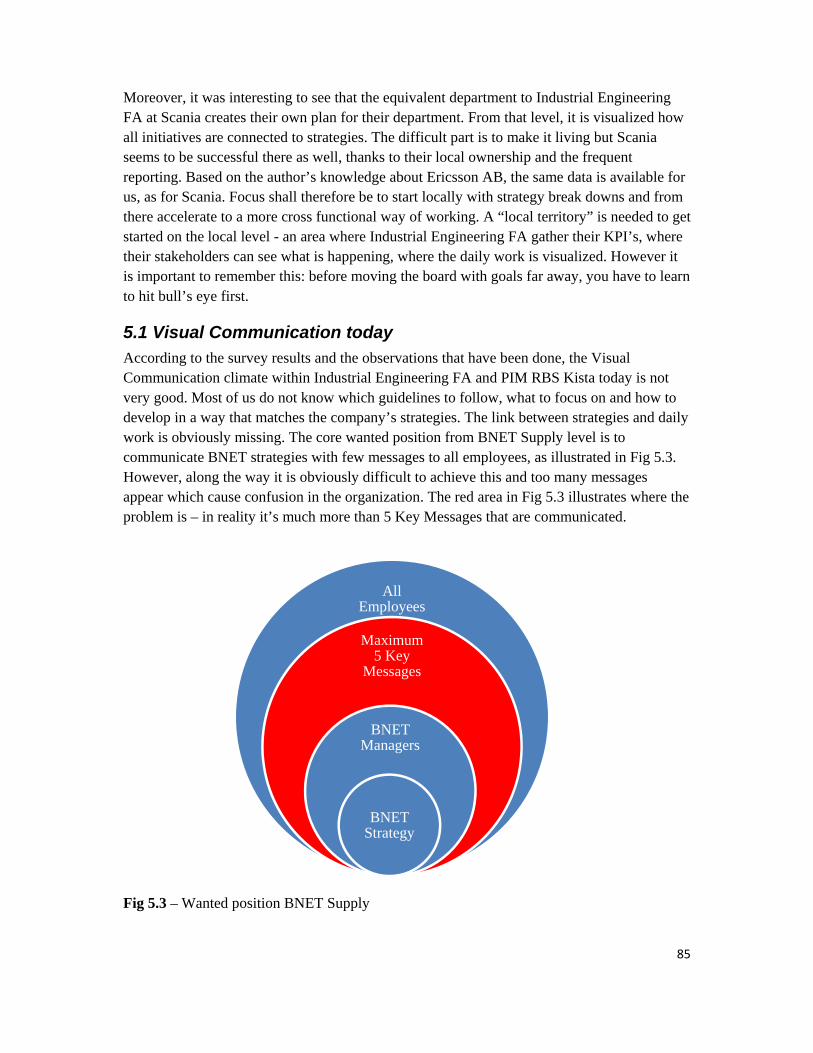
85
Moreover, it was interesting to see that the equivalent department to Industrial Engineering FA at Scania creates their own plan for their department. From that level, it is visualized how all initiatives are connected to strategies. The difficult part is to make it living but Scania seems to be successful there as well, thanks to their local ownership and the frequent reporting. Based on the author’s knowledge about Ericsson AB, the same data is available for us, as for Scania. Focus shall therefore be to start locally with strategy break downs and from there accelerate to a more cross functional way of working. A “local territory” is needed to get started on the local level - an area where Industrial Engineering FA gather their KPI’s, where their stakeholders can see what is happening, where the daily work is visualized. However it is important to remember this: before moving the board with goals far away, you have to learn to hit bull’s eye first.
5.1 Visual Communication today
According to the survey results and the observations that have been done, the Visual Communication climate within Industrial Engineering FA and PIM RBS Kista today is not very good. Most of us do not know which guidelines to follow, what to focus on and how to develop in a way that matches the company’s strategies. The link between strategies and daily work is obviously missing. The core wanted position from BNET Supply level is to communicate BNET strategies with few messages to all employees, as illustrated in Fig 5.3. However, along the way it is obviously difficult to achieve this and too many messages appear which cause confusion in the organization. The red area in Fig 5.3 illustrates where the problem is – in reality it’s much more than 5 Key Messages that are communicated.
Fig 5.3 – Wanted position BNET Supply
All Employees
Maximum 5 Key
Messages
BNET Managers
BNET Strategy

The real
Fig 5.4
Too mufocus onEnginee
5.1.1T
The man(HenrikunderstaRBS Ki
Fig 5.5
BNETSuppl
RACO
PIMRBS K
IndustrEng. F
lity is rather
– Strategy c
uch informatn. This is prering FA do
TopMana
nagement tek), see Fig 5andable. In ista organiza
– BNET Su
T ly
• Strate• 3-5 K
O
• 101 s• Diffic
M KI
• 53 sli• Insig
opera
rial FA
• BNE• PIM
strate• It is a
HeFor
Jona
r like this:
communica
tion is provrobably the on’t understa
agementC
eam from h.5, are morethe next chation have c
upply Organ
egy commuKey message
slide presencult to unde
ide presentahts, wantedations strate
T Supply stRBS Kista
egies to actia mix of eve
J
enrik rsberg
as Odin
Henrik Wilstam
Lars Ottoso
ation flow to
vided which reason whyand the stra
Communic
high BNET e or less agrapter it’s clcompletely
nization – fr
unication maes is the goa
ntationerstand
ation at the pd positions, fegies etc. we
trategies andstrategies, ion, operatioerything wh
Martin Johansson
X
on
oday
makes it diy most of thategy.
cation
Supply (Mareed on thatear that the different op
rom the Vic
ainly via maal from this
previous AEfocus areas,ere included
dinsights, waons strategiehich is confu
Y
ifficult to unhe employee
artin) to Indt the strategemployees
pinions.
ce President
anagerss level
EM, strategies td
anted positioes etc.using for the
nderstand anes within Ind
dustrial Engiies are clear at a lower
t to Industri
to action, B
ons, focus a
e employee
nd now whadustrial
ineering FAr and level in the
ial Engineer
BNET
areas,
es
86
at to
A
PIM
ring FA

87
According to Top Management interviews and e-mail correspondence, the updated Supply Strategy is planned to be distributed by conventional methods such as articles on the web, video clips and employee meetings. The RACO Top Management think that the KPI’s works out well, that they are clear, logic and easy to measure. They think that the monthly reporting from lower levels in the hierarchy is good, so this process should probably not be changed when setting up activities - the Visual Communication Plan should be adopted for it.
Lars Ottoson’s quote: “I want that the person working with stones shall see how valuable he/she is for the St Petersburg Church” indicates that daily work definitely shall be linked to strategies to create better understanding. However, it’s not necessary needed to visualize from the very top level all the way down to the floor, but from a certain level above the floor (for e.g. PIM RBS Kista level). Based on this, the Visual Communication Plan will focus on PIM RBS Kista’s strategies. The managers are agreed on that the strategies are quite clear and they are also aware of the importance to align all cross functional strategies.
5.1.2StrategyperceptionatIndustrialEngineeringFA
Even though a majority of the managers believe that the strategies are quite clear, this is not the reality on a lower level in the organization. Except from the Global Technical Dimensioning stakeholders, mostly managing people that are involved in the strategy work, the survey results for Industrial Engineering FA were similar to the rest of PIM RBS Kista. Fig 5.6 shows the percentage within Industrial Engineering FA, Global Technical Dimensioning stakeholders and random employees at PIM RBS Kista that think goals and KPI’s connected to strategies at different organization levels are “not very clear or very unclear”:
Fig 5.6 – Bars showing the percentage of people that think goals and KPI’s connected to strategies are “not very clear” or “very unclear”
The entire group thinks that their work is important, but 29% cannot say if their work is important from a strategic perspective or not. Moreover, 72% do not know what to focus on from a strategic perspective.
0
20
40
60
80
100
Ind. Eng FA
Tech. Dim.Stakeholders
PIM RBS Kista
BNET Supply RACO PIM RBS KI Department
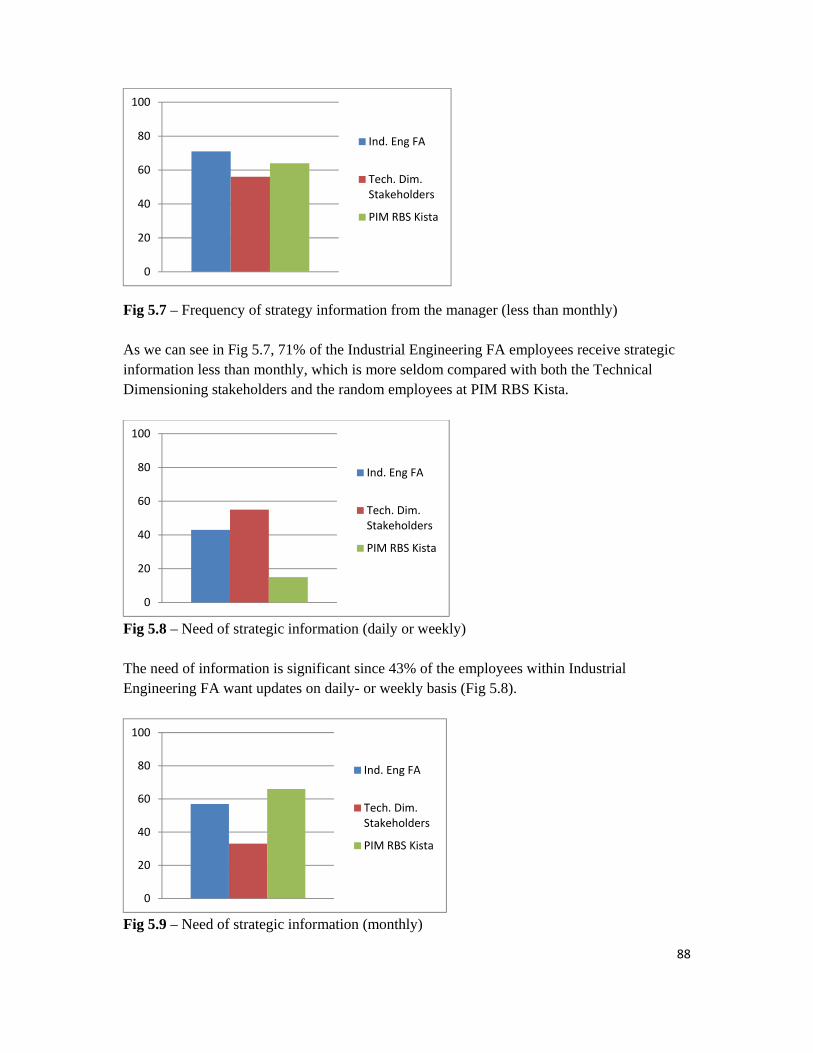
88
Fig 5.7 – Frequency of strategy information from the manager (less than monthly) As we can see in Fig 5.7, 71% of the Industrial Engineering FA employees receive strategic information less than monthly, which is more seldom compared with both the Technical Dimensioning stakeholders and the random employees at PIM RBS Kista.
Fig 5.8 – Need of strategic information (daily or weekly) The need of information is significant since 43% of the employees within Industrial Engineering FA want updates on daily- or weekly basis (Fig 5.8).
Fig 5.9 – Need of strategic information (monthly)
0
20
40
60
80
100
Ind. Eng FA
Tech. Dim.Stakeholders
PIM RBS Kista
0
20
40
60
80
100
Ind. Eng FA
Tech. Dim.Stakeholders
PIM RBS Kista
0
20
40
60
80
100
Ind. Eng FA
Tech. Dim.Stakeholders
PIM RBS Kista

89
In Fig 5.9 we can see that 57% want information on monthly basis, so all employees at the Industrial Engineering FA department wish to receive strategic information on daily-, weekly or monthly basis. Since 71% state that they receive information more seldom than monthly, it is a big gap that must be considered in the Visual Communication Plan.
Fig 5.10 – Do not know what to focus on from a strategic perspective (goals and KPI’s)
Based on the previous graphs, it is logic that 72% of the Industrial Engineering FA employees do not see the link between their daily work and the strategies. This must also be considered in the Visual Communication Plan. Fig 1.6 in the beginning of this report show how Atlas Copco try to link daily work with strategies and it now seems like this could work for Industrial Engineering FA and PIM RBS Kista as well. This is what the Visual Communication Plan should focus on and how the link shall look like will be described in chapter 6.
5.2 Visual Communication problems today
The main problems today are:
BNET Supply recommends to use 3-5 Key Messages when communicating strategies but on RACO and PIM RBS Kista level much more information is presented (101 and 53 slides)
Industrial Engineering FA receives too much information, from different levels in the organization, which makes it hard to understand and focus on strategies in the daily work
Surveys shows that the strategy understanding is bad for Industrial Engineering FA and other parts of PIM RBS Kista
Industrial Engineering FA employees need strategic information/feedback on daily- or weekly basis but mostly receives strategic information on monthly basis
There is no feedback loop between managers and employees regarding strategies
0
20
40
60
80
100
Ind. Eng FA
Tech. Dim.Stakeholders
PIM RBS Kista

90
Industrial Engineering FA employees do not have KPI’s based on strategies and can therefore not be measured from a strategic perspective
Fig 5.11 shows how strategies are communicated today and how the feedback loop works. Top-down arrows illustrates the communication flow, while bottom-up arrows illustrates the feedback loops.
AEM Group Meetings
Homepage Other (Whiteboards)
BNET Supply
RACO
PIM RBS Kista
Engineering
Industrial Engineering FA
Individual level
Fig 5.11 – Communication flow today
All employee meetings from BNET Supply are available for everyone that is interested, even though the number of seats is limited. It is also possible to join online meetings. The material is often available at the homepage after the meeting, but you have to search to find it. Moreover, if you enter PIM RBS Kista’s homepage today it is not possible to find any updated strategies. The strategy feedback is therefore not possible either. If you enter the RACO homepage, it’s possible to find strategy information, but not to give feedback in an easy way. The feedback loop is, for the individual, often limited to PIM RBS Kista but the managers at PIM RBS Kista give feedback up in the organization.
When it comes to group meetings, strategies are communicated via managers through the organization. As a Production Engineer in a lower level in the organization, it is clear that feedback on strategies seldom reach higher levels than its own department and even if it does, the feedback from management level back to the individual is missing.

91
Other ways of communicating strategies could for e.g. be whiteboards or similar, but this is not the fact for PIM RBS Kista. Whiteboards are used but not to communicate strategies.The strategy communication is limited to managers and homepages and this is not ideal for the feedback loops. All signs so far indicate that the employees within Industrial Engineering FA and PIM RBS Kista have a hard time to connect strategies to their daily work. Next chapter describes the wanted position.

92
6ConclusionsThe results from the findings have been covered and it is now time to present the proposed way forward for PIM RBS Kista and Industrial Engineering FA.
Fig 6.1 – The way forward
6.1 Visual Communication in future
To increase strategy understanding it is important to involve management since they are working with strategy development. A two-way communication link between the employees and the managers must therefore be set up. As mentioned earlier, two-way communication only occurs in conversations between few people, but it is possible to create something similar by designing the message so that the sender can discover whether the receiver has actually received it or not [Bergström, Bo (2008)].
Fig 6.2 – The linear communication model [Bergström, Bo (2008)]
1.
Introduction
2.
Methods
3.
Theories
4.
Empiric findings
5.
Results
6.
Conclusions
Mgmt Individual
Ind. Eng. FA
Strategies
Screen
Screen
Whiteboard
Meetings

93
To improve the strategy understanding and create the missing link to the daily work, the everyday things must be seen in a different light. Top Management is in general quite busy at PIM RBS Kista, so they probably don’t have time to see all the local territories where the breakdown of strategies will be visualized. Therefore, one long term idea could be to connect the local territories to for e.g. a data screen, to be able to send instant updates to the management’s local territory. By doing this, the important feedback loop is set up. Management can follow the KPI’s from the local territories and it’s possible for them to give feedback.
According to Sheppard [Sheppard, Stephen (2012)], the three core principles when engaging the public are:
1. Make it local
2. Make it visual
3. Make it connected
This is aligned with the linear strategy model and the local territory philosophy that Greif recommends. The “third way” for Industrial Engineering FA could be to set up the local territory. When strategis from BNET Supply and PIM RBS Kista is presented, it’s a risk that the local feeling s missing. By having the local territory – the third way – the local feeling might appear which will improve the attention and strategy understanding (Fig 6.3). The denying aspect is considered on individuals level since they are are acting in this way when they don’t understand strategies.
Employees at PIM RBS Kista
Fig 6.3 – Key ways in which strategy information could reach us, including the local environment (the third way) that will be built up within Industrial Engineering FA
Local territory - the ”third way”
BNET Supply Strategies
PIM RBS Kista strategies

94
When it comes to climate change, people act when the local climate change evidence is dramatic, as with Hurricane Katrina [Sheppard, Stephen (2012)]. This is what the author to this report want PIM RBS Kista to achieve as well – a sense of urgency. First of all by a clear strategy, followed by KPI’s, sub KPI’s and finally daily tasks that every individual can be connected to everyday. Again, the KPI’s should be aligned between the manager and the individual. Each individual may have to confront several perceptual barriers in order to move through the progression represented in Fig 6.4. As we know, it may take only one barrier of sufficient strength anywhere in the sequence to prevent progress. The end result is the same: no action. Barriers to either seeing or knowing will prevent recognition of how strategies affect Industrial Engineering FA. Recognition is central to enhanced strategy perceptions, but other stages are needed to achieve it. Seeing is a crucial pre-condition, as is requiring some prior knowledge about strategies. By itself though, seeing is not enough without also recognizing what we are seeing [Sheppard, Stephen (2012)]. The arrows are the key influences:
Fig 6.4 – The community awareness to action framework [Sheppard, Stephen (2012)]
Recog-nizing
Caring
Know-ing
Seeing
Action
Hear
-ingInformation
Local landscape
Outcomes
External influences (on individuals)
Awareness
95
Strategy information is often provided via meetings where we hear and see. However, it is often too much information which makes it hard to understand and remember. Obviously the local landscape is missing today, since Industrial Engineering FA not yet has this local territory where individual- and external influences can be seen. This is a prerequisite to create recognizing and actions, as we can see in Fig 6.4. After summer 2013, when the strategies will be bombard the organization, it would be good if Industrial Engineering FA could start preparing the local territory, where the strategy break downs can be visualized.
According to the author, more or less all theories are aligned. It is about create involvement, create strategy break downs together with the managers, make the local environment work before heading for the entire organization and visualize in a way that creates interest – a living organization where employees share knowledge and give feedback to develop each other.
6.2 Visual Communication Plan
This chapter describes how the Visual Communication Plan for Industrial Engineering FA and Technical Dimensioning stakeholders could look like. During the report we have seen that successful organizations within the Visual Communication area prioritize participation and share responsibilities, work tasks, improvements and values. Everyone needs to feel: “That is our information”. To get this feeling, it is vital to get the personnel involved and take part in the strategy work. As long as decisions are not decided together – it is not possible to implement Visual Communication.
6.2.1IndustrialEngineeringFA
As mentioned in the beginning of this report, the first goal before starting up a Visual Communication project should be to make sure that the user of the system really wants to use it [Greif, Michel (1989)]. Since 72% of the employees cannot see the link between their daily work and the strategies – and the fact that they want strategic information on daily-, weekly or at least monthly basis – we can assume that they are interested in a system that could contribute to a more visual organization. Industrial Engineering FA is not necessary supposed to send anything – they should build a field of information that other coworkers have access to. Again, it is not about implement a Visual Communication system, it is about create a visual organization. Since goals are the most powerful determinants of task behaviors60 it is crucial to break down strategies to daily work tasks that can be measured. However, easily attainable goals result in lower levels of effort and performance than do more difficult goals61, which should be considered when doing the strategy break down. Again, the managers need to ensure that individual goals do not conflict with team- or organizational ones and should also take care to set measurable goals; that way they could give the feedback they need to stay on track62. The solution is not only technology. As Greif expressed it, the problem is not to
60 answers.mheducation.com 61 answers.mheducation.com 62 answers.mheducation.com
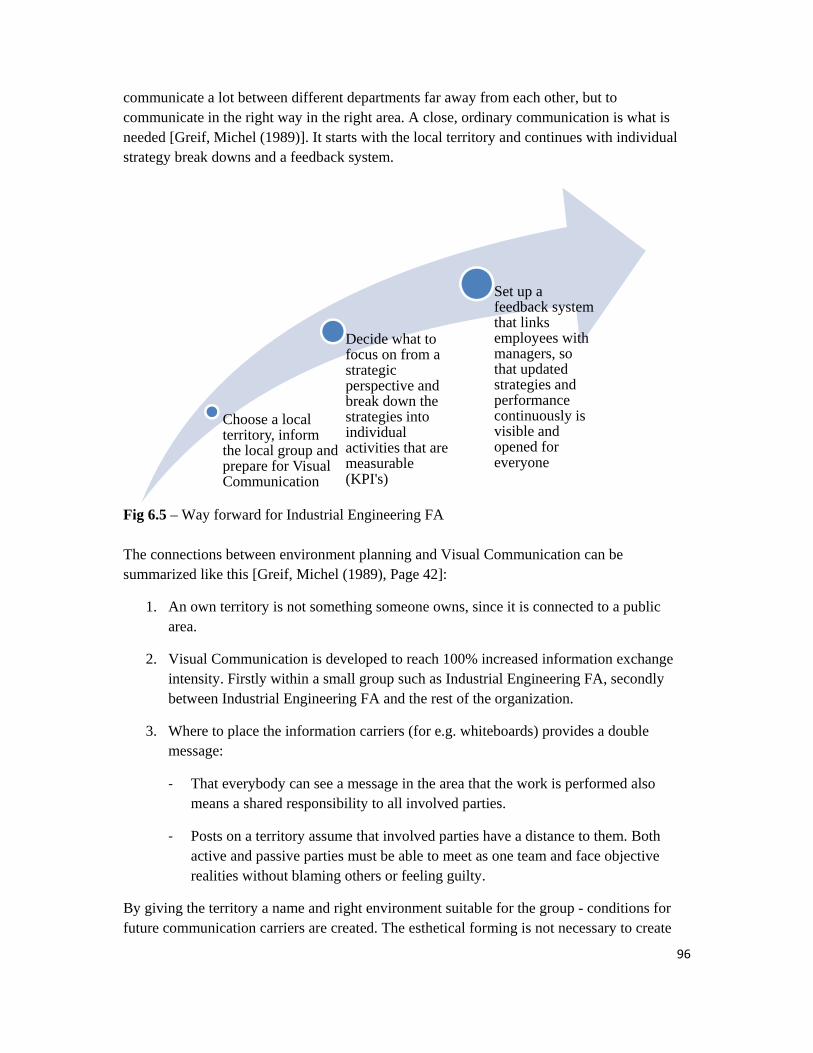
96
communicate a lot between different departments far away from each other, but to communicate in the right way in the right area. A close, ordinary communication is what is needed [Greif, Michel (1989)]. It starts with the local territory and continues with individual strategy break downs and a feedback system.
Fig 6.5 – Way forward for Industrial Engineering FA The connections between environment planning and Visual Communication can be summarized like this [Greif, Michel (1989), Page 42]:
1. An own territory is not something someone owns, since it is connected to a public area.
2. Visual Communication is developed to reach 100% increased information exchange intensity. Firstly within a small group such as Industrial Engineering FA, secondly between Industrial Engineering FA and the rest of the organization.
3. Where to place the information carriers (for e.g. whiteboards) provides a double message:
‐ That everybody can see a message in the area that the work is performed also means a shared responsibility to all involved parties.
‐ Posts on a territory assume that involved parties have a distance to them. Both active and passive parties must be able to meet as one team and face objective realities without blaming others or feeling guilty.
By giving the territory a name and right environment suitable for the group - conditions for future communication carriers are created. The esthetical forming is not necessary to create
Choose a local territory, inform the local group and prepare for Visual Communication
Decide what to focus on from a strategic perspective and break down the strategies into individual activities that are measurable (KPI's)
Set up a feedback system that links employees with managers, so that updated strategies and performance continuously is visible and opened for everyone

97
art, but to make it feel like home. The group members should therefore chose the design of the territory with support from an expert or similar to coordinate the whole picture [Greif, Michel (1989), Page 43]. Four fundamental rules to keep in mind before posting something visual in the factory:
1. The method shall exist – must be developed together with the Industrial Engineering colleagues
2. It shall be visible to everyone – choose a local territory in an open landscape
3. It shall be accepted by the users – aligned with the colleagues
4. It shall be possible for the users to question it – visible information in the open landscape
It is known that the interplay between the design and the content is what creates the important first impression, paving the way for the message: Design + Content = Message [Bergström, Bo (2008)]. This detailed work will be executed in the line organization work when implementing the Visual Communication system and not here when designing the Visual Communication Plan.

Fig 6.6
BNET S
RACO
PIM RB
Enginee
Industri
Individu
Fig 6.6
The AEprocess manage
When itstrategieinformaKPI’s foIndustrifor mordepartmeveryon
To createlse than6.5 and RACO clear str
illustrates th
Supply
BS Kista
ering
ial Engineer
ual level
– Proposed
EM communis appropri
ers at PIM R
t comes to ges as is todaation shouldor the indivial Engineere communic
ments withinne with the p
te better unn just meeticontinues ware maybe nrategies from
he Visual C
ring FA
d Visual Com
nication couate. The str
RBS Kista, w
group meetiay, but withd be commuiduals shouring FA in tcation with
n PIM RBS possibility t
derstandingings and howith the plannot the mosm PIM RBS
Communicat
AEM
mmunicatio
uld be betterrategy reachwhich forwa
ings and simh more speciunicated fromuld be decidetheir local teengineeringKista. The
to give feed
g and more mmepages is nned proces
st important S Kista leve
tion Plan fo
Group Meetings
on Plan for I
r regarding hes the indivard the info
milar local aific informam engineeried. The feederritory. Whg, stakeholdhomepage s
dback.
motivation needed. Th
ss in Fig 6.6for the indi
el should be
or Industrial
Homepag
Industrial E
the contentviduals and ormation upw
activities, thation – not 5ing level andback loop hen the procders and – inshould of co
and attentiohe Visual Co6. Strategiesividuals at I realistic. N
l Enineering
ge Ot(White
Engineering
(too many feedback iswards in the
he proposal 50 or 100 slnd from ther
shall initialcess is set itn long termourse be ava
on on strategommunicatis from BNEIndustrial E
Not too much
g FA.
ther eboards)
FA
slides), but s collected be organizati
is to commulides. The dere – KPI’s ally only cont’s time to o
m – also withailable for
gies, somethion starts w
ET Supply aEngineering
h informati
98
the by ion.
unicate etailed
and sub nsider open up h other
hing with Fig and FA, but on, just
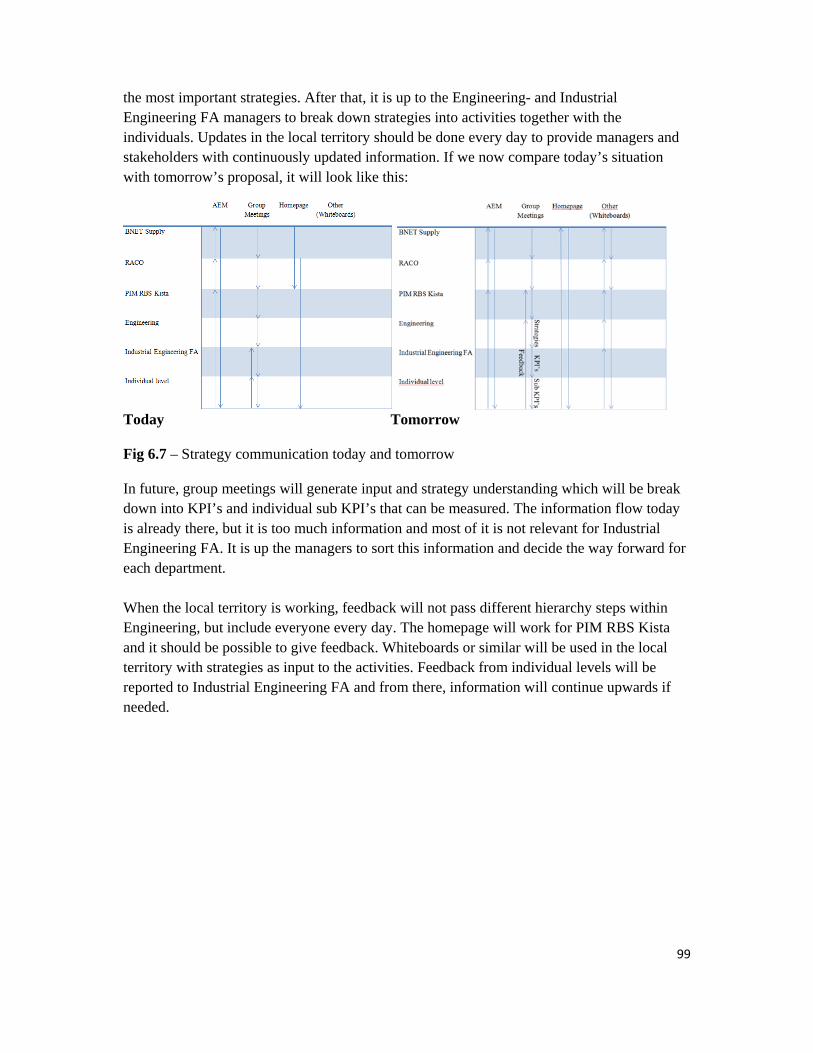
99
the most important strategies. After that, it is up to the Engineering- and Industrial Engineering FA managers to break down strategies into activities together with the individuals. Updates in the local territory should be done every day to provide managers and stakeholders with continuously updated information. If we now compare today’s situation with tomorrow’s proposal, it will look like this:
Today Tomorrow Fig 6.7 – Strategy communication today and tomorrow In future, group meetings will generate input and strategy understanding which will be break down into KPI’s and individual sub KPI’s that can be measured. The information flow today is already there, but it is too much information and most of it is not relevant for Industrial Engineering FA. It is up the managers to sort this information and decide the way forward for each department. When the local territory is working, feedback will not pass different hierarchy steps within Engineering, but include everyone every day. The homepage will work for PIM RBS Kista and it should be possible to give feedback. Whiteboards or similar will be used in the local territory with strategies as input to the activities. Feedback from individual levels will be reported to Industrial Engineering FA and from there, information will continue upwards if needed.

100
A realistic time plan for setting up the local terroitory and prepare the physical things, to be able to use Visual Communication, is estimated to 5 months. Choosing a local territory can be done in August and since the updated strategies will arrive in August, the strategy break down could start in September. From Q4, the local territory should be able to be up and running with individual goals and KPI’s that are linked to the updated strategy.
Fig 6.8 – Rough time plan for Industrial Engineering FA
After the local terroitory is finished and all KPI’s are aligned between the individual and the manager, it’s time to have a kick off. An appropriate time for this is probably Q1 2014, approximately 6 months after the strategies has been communicated. Again, Visual Communication is about culture and culture takes time to change. It will most likely take years before everything is running smoth.
Aug‐Sep Oct‐Nov Dec
Q4
Wait for the updated strategies
Perform the steps in Fig 6.5 together with the colleagues
Start up the local territory and adjust details over time, until the process in Fig 6.6 is working

101
6.2.2GlobalTechnicalDimensioningstakeholders
To improve the Global Technical Dimensioning visualization and satisfy the stakeholders, the key to success is to fulfill their needs regarding what kind of information they want:
Needed investments
Global needs
How many filter units that could be produced per site and month
Availability of technical capacity globally and per volume production site
Enough equipment and relevant OP times
Real/true capacity figures based on near time information and how this will affect the Demand Forecast (DF)
Capacity per product group (PL4, PL5 RUS and PL5 RRUS)
Capacity ramp up plan
Predictions and ideas what is needed in future and possible consolidations – alternative solutions like hiring equipment
This will be considered when developing the individual sub KPI’s together with the manager. Since 89% of the stakeholders share information to other employees - and since 78% of them get feedback on the information - it would be good to be more active in this loop. Today, no information from stakeholder’s interested parties comes back to the Industrial Engineering FA department. If the information is available and opened for feedback in the local territory, the involvement most likely will be improved. Something to remember when presenting many different graphs or similar in the local territory, is the rule of thumb to start with the strongest message and keep the second strongest until last, with the weakest arguments in between. Let the receiver draw their own conclusions. It is important to make the receiver feel involved and proactive, leading them to work out the message for themselves [Bergström, Bo (2008)].
The author to this report will perform own strategy break downs together with the manager from September and the territory will be shared with the Industrial Engineering FA colleagues. When the local processes are working well, next step will be to open up the territory for stakeholders such as near time planning, demand planning, project office etc. With other words, the Visual Communication Plan for Technical Dimensioning stakeholders will not be a specific one with its own territory, but included in the scope for Industrial Engineering FA. The hope is that people interested in Technical Dimensioning also will find other important things in the local territory.
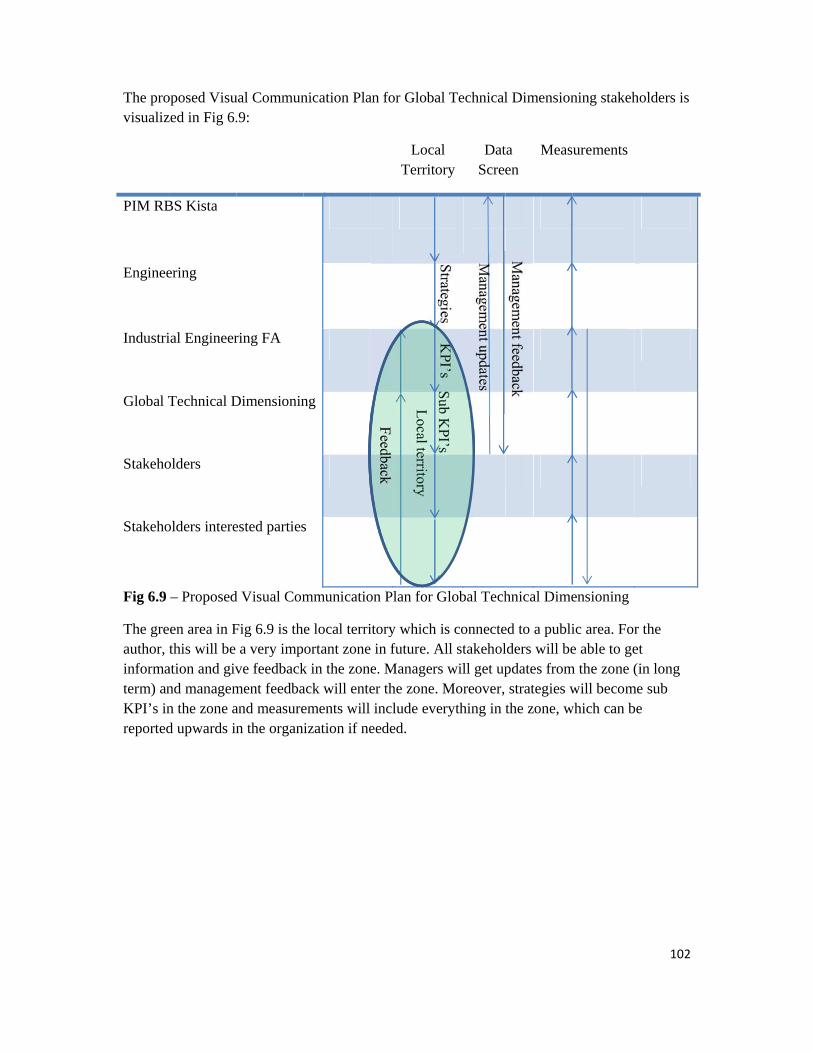
The provisualiz
PIM RB
Enginee
Industri
Global T
Stakeho
Stakeho
Fig 6.9
The greauthor, informaterm) anKPI’s inreported
oposed Visuzed in Fig 6.
BS Kista
ering
ial Engineer
Technical D
olders
olders intere
– Proposed
een area in Fthis will be
ation and givnd managemn the zone ad upwards in
ual Commun.9:
ring FA
Dimensionin
ested parties
d Visual Com
Fig 6.9 is tha very imp
ve feedbackment feedbaand measuren the organ
nication Pla
ng
s
mmunicatio
e local terriortant zone
k in the zoneack will enteements will ization if ne
an for Globa
LocaTerrito
on Plan for G
itory which in future. Ae. Managerer the zone.include eve
eeded.
al Technical
al ory
DatScree
Global Tech
is connecteAll stakehols will get up Moreover,erything in t
l Dimension
ta en
Meas
hnical Dime
ed to a publilders will bepdates fromstrategies wthe zone, w
ning stakeho
urements
ensioning
ic area. For e able to get
m the zone (iwill become
which can be
102
olders is
the t in long e sub e

103
Following focus areas from RACO level are used to illustrate the way forward with real examples:
Fig 6.10 – Production key take-away from the strategies63
As an example, the first bullet point in chapter 6.2.2: “Needed investments”, could be part of the strategy from PIM RBS Kista level, to be able to fulfill the BU (Business Unit) Regional Buffers in Fig 6.10. Head of PIM RBS Kista Henrik Forsberg communicates this to the Engineering manager Jonas Odin, which forward the message to Industrial Engineering FA. At that level “Needed investments” could be a break down to a KPI for my department and a sub KPI for me as an individual. Appropriate indicators could be “estimated output vs. actual output”, “number of scrapped equipment”, “number of excess equipment” etc. Let’s say that the Industrial Engineering FA manager choose “BU Regional Buffers” and “Yield – Work tighter with R&D” as the two most important strategies for us, then it could look like this in one of the local territory areas:
Fig 6.11 – Local territory example
63 Internal homepage, Ericsson
Global Technical Dimensioning (BU Regional Buffers)
Ind. Eng FA
(Yield - Work tighter with R&D)
Estimated output vs. actual output
Number of scrapped equipment
Number of excess equipment
95% yield
0% fault in the work instructions
Number of improvements
Local Territory

104
The recommendation is to put the territory where the star is in Fig 6.12, since that is an open area close to Industrial Engineering FA and their stakeholders within Global Technical Dimensioning.
Fig 6.12 – Proposed area for the local territory
6.3 Validation and reliability
According to the author, data of high validation and reliability have been reached and used in this report, but there is always a risk that personal experience and thoughts have affected the reliability. Nothing is indeed completely black or white. Again, only the researcher can determine what is satisfactory, relevant, significant or important in the context of his/her own research64. Measurements from the surveys indicate that the result is reliable – there is lack of strategy understanding at the Industrial Engineering FA department and PIM RBS Kista. The link between strategies and the daily work is missing.
6.4 Proposal for further investigations
It is now clear what has to be done within the Industrial Engineering FA department. To be able to understand and link strategies to the daily work, which will work as guidelines to follow, a more living communication area called local territory must be set up. The Visual Communication Plan will hopefully be useful for both the Industrial Engineering FA department and the stakeholders within Global Technical Dimensioning. As mentioned in the beginning, clear strategy information is most likely useful for others than the Industrial Engineering FA department, so further investigations could be to spread the Visual Communication concept to other departments through the company. Again, this should not be done without making sure that the user of the system really wants to use it.
64 www.uncp.edu

Fig 6.13
Hopefulcould beproblemillustratbecomeget everin Augu
65 Interna
3 – Supply s
lly the readee useful wh
ms with comted in Fig 6.e better todaryone involvust and hope
al homepage, E
strategy pre
er has gainehen communmmunicating.13. It is notay than we wved. Industrefully this w
Ericsson
esentation65
ed some knonicating strag strategy but about blamwere yesterdrial Engineewill be the fi
owledge wiategies in fuut still the in
me anyone, bday. Ericssoering FA wifirst step to a
ithin the Visuture. Top Mnformation but rather toon is a big cill have a Va sustainabl
sual CommuManagemen
flow is too o help Ericscompany an
Visual Commle and visua
unication arnt is aware o
much, as sson and my
nd it is difficmunication kal organizati
105
rea that of the
yself to cult to kick off ion.

A
Appendices
A - Time schedule

B
B - Surveys

C
References
Literature
Essentials of Visual Communication (Bo Bergström, ISBN 13: 978-1-85669-577-0, 2008)
The visual company (Michel Greif 1989, translated to Swedish by Barbro Eriksson 1992, ISBN 91-88408-01-9)
Bill McKibben, Visualizing Climate Change (Stephen R.J Sheppard, ISBN 978-1-84407-820-2 (hbk), 2012)
Visualizing Climate Change (Stephen R.J Sheppard, ISBN 978-1-84407-820-2 (hbk), 2012)
The Essentials of Visual Communication (Bo Bergström, ISBN 13: 978-1-85669-577-0, 2008)
Visual communication research designs (Keith Kenney, ISBN 978-0-415-98870-4, 2009)
Seeing is believing – An introduction to Visual Communication 3rd Edition (Arthur Asa Berger, ISBN 978-0-07-353425-1, 2008)
Essential Communication Strategies 2nd Edition (Herbert L. Hirsch, ISBN 0-471-27317-1, 2003)
Images in use (Matteo Stocchetti and Karin Kukkonen, ISBN 978-90-272-0635, 2011)
Electronic sources
Operational Description PIM RBS Kista, EAB-12:054740 Uen, 2012-12-05 Rev A
Jenny Nylinder (Examensarbete INDEK 2008:106, KTH Industriell teknik och management
PIM RBS Kista All Employee Meeting 2013-06-18
http://internal.ericsson.com/page/hub_net/unit/unit_04/org/u_10/org/su_10/index.jsp?unit=BNET
http://internal.ericsson.com/page/hub_net/unit/unit_04/org/u_10/org/su_10/index.jsp?unit=BNE
http://internal.ericsson.com/page/hub_net/unit/unit_04/org/u_10/strategies.jsp?unit=BNET
http://internal.ericsson.com/page/hub_net/unit/unit_04/org/u_10/strategies.jsp?unit=BNET
http://internal.ericsson.com/page/hub_net/unit/unit_04/org/u_10/strategies.jsp?unit=BNET
http://internal.ericsson.com/page/hub_net/unit/unit_04/org/u_10/strategies.jsp?unit=BNET

D
Internet sources
http://www.ericsson.com/se/thecompany/company_facts 2013-03-19
Ericsson internal homepage 2013-05-14
Operational description Industrial Engineering FA, PIM RBS Kista, EAB-12:053877 Uen, 2013-05-14
Operational Description PIM RBS Kista, EAB-12:054740 Uen, 2012-12-05 Rev A
Ericsson internal homepage 2013-05-14
http://www.radio-electronics.com/info/rf-technology-design/receiver-selectivity/mechanical-filters.php 2013-05-13
http://www.uncp.edu/home/acurtis/Courses/ResourcesForCourses/LitReview.html 2013-06-13
http://answers.mheducation.com/management/leadership/motivation-satisfaction-and-performance#motivation-summary 2013-06-16
http://www.mindtools.com/pages/article/newTMC_05.htm 2013-05-13
http://www.abilitysuccessgrowth.com/2013/01/just-what-is-a-swot-analysis-anyway/ 2013-05-13
http://www.computerworld.com/s/article/9229373/Time_off_to_innovate_Good_idea_or_a_waste_of_tech_talent_ 2013-05-23
http://answers.mheducation.com/management/leadership/motivation-satisfaction-and-performance#motivation-summary 2013-06-16
http://answers.mheducation.com/management/leadership/motivation-satisfaction-and-performance#motivation-summary 2013-06-16
http://answers.mheducation.com/management/leadership/motivation-satisfaction-and-performance#motivation-summary 2013-06-16
http://www.uncp.edu/home/acurtis/Courses/ResourcesForCourses/LitReview.html 2013-06-13

E
Persons
The Study Visit at Atlas Copco (Nacka, Sweden) was performed 2013-05-07. The contact persons were Tobias Bergendahl and Stefan Calner.
Raju Puri, “The effects of variations in production of filter modules on production capacity” Tobias Bergendahl, Atlas Copco 2013-05-07 Study visit at Alfa Laval in Tumba, Per Tapani
Fredrik Algurén, Maintenance Engineer VCC Graduate 2013-05-21
Magnus Dahlström, LEAN Manufacturing Engineer, 2013-05-24
Marcus Bohman, Supply Chain Leader, 2013-05-23
Patricia Kovatcheva, Producibility Engineer, 2013-05-24
Johan Ersson, Process Architect, 2013-05-21
Martin Johansson (Vice President Supply) 2013-05-23
Lars Ottoson (Head of RACO) 2013-05-23
Henrik Forsberg (Head of PIM RBS Kista) 2013-05-19
Jonas Odin (Engineering Manager) and Henrik Wilstam (Industrial Engineering Manager) 2013-05-21
From the meeting with Jonas Odin 2013-05-21, a matrix from the American Psychologist M. J. Apter
Julia Mastelle (Internal Communications) 2013-05-20
Monika Lindgren (Manager Internal Communications) and Ulrika Wikner (Global Supply Chain Strategy) 2013-06-03