Embed Size (px)
Citation preview
HAL Id: hal-01344597https://hal.archives-ouvertes.fr/hal-01344597
Submitted on 12 Jul 2016
HAL is a multi-disciplinary open accessarchive for the deposit and dissemination of sci-entific research documents, whether they are pub-lished or not. The documents may come fromteaching and research institutions in France orabroad, or from public or private research centers.
L’archive ouverte pluridisciplinaire HAL, estdestinée au dépôt et à la diffusion de documentsscientifiques de niveau recherche, publiés ou non,émanant des établissements d’enseignement et derecherche français ou étrangers, des laboratoirespublics ou privés.
Visible and Ultraviolet Spectroscopy of Gas PhaseRhodamine 575 Cations
Steven Daly, Alexander Kulesza, Geoffrey Knight, Luke Macaleese, RodolpheAntoine, Philippe Dugourd
To cite this version:Steven Daly, Alexander Kulesza, Geoffrey Knight, Luke Macaleese, Rodolphe Antoine, et al.. Visibleand Ultraviolet Spectroscopy of Gas Phase Rhodamine 575 Cations. Journal of Physical ChemistryA, American Chemical Society, 2015, �10.1021/acs.jpca.5b03187�. �hal-01344597�

Visible and Ultraviolet Spectroscopy of Gas Phase Rhodamine 575 Cations. S. Daly, A. Kulesza, G. Knight, L. MacAleese, R. Antoine and P. Dugourd. J. Phys. Chem. A 119, 5634–5641 (2015). http://dx.doi.org/10.1021/acs.jpca.5b03187
Visible and Ultraviolet Spectroscopy of Gas Phase Rhodamine
575 Cations.
Steven Dalya,b
, Alexander Kuleszaa,b
, Geoffrey Knighta,b
, Luke MacAleesea,b
, Rodolphe
Antoinea,b
, Philippe Dugourda,b
*.
a Université de Lyon, F-69622, Lyon, France.
b CNRS et Université Lyon 1, UMR5306, Institut Lumière Matière.
KEYWORDS Rhodamine, gas phase, UV-visible action spectroscopy, TDDFT.
ABSTRACT: The visible and ultraviolet spectroscopy of gas phase rhodamine 575 cations
has been studied experimentally by action-spectroscopy in a modified linear ion trap between
220 and 590 nm and by time-dependent density functional theory (TDDFT) calculations.
Three bands are observed that can be assigned to the electronic transitions S0S1, S0S3 and
S0(S8,S9) according to the theoretical prediction. Whilst the agreement between theory and
experiment is excellent for the S3 and S8/S9 transitions, a large shift in the value of the
calculated S1 transition energy is observed. A theoretical analysis of thermochromism,
potential vibronic effects and – qualitatively – electron correlation revealed it is mainly the
latter that is responsible for the failure of TDDFT to accurately reproduce the S1 transition
energy, and that a significant thermochromic shift is also present. Finally, we investigated the
nature of the excited states by analyzing the excitations and discussed their different
fragmentation behavior. We hypothesize that different contributions of local versus charge
transfer excitations are responsible for 1-photon versus 2-photon fragmentation observed
experimentally.
Introduction.
The photo-physics of organic chromophores such as the rhodamine family of dyes is of
importance to a broad range of subject areas ranging from the behavior of dye lasers to the
labelling of biomolecules for structural assignment, and as such there have been a great many
studies of their solution phase properties.1-11
There has also been considerable effort in recent
years devoted to the study of the properties of such chromophores in the solvent-free
environment of the gas phase.12-18
The recent transposition of Förster Resonance Energy
Transfer (FRET) to the gas phase has only increased interest in the gas phase properties of
these dyes, as they have been used as both donor and acceptor chromophores in many of the
systems studied thus far.19-24
In particular, the use of rhodamine 575 (R575) as the donor
chromophore in several of these studies has made an understanding of its gas phase photo-
physical properties of high interest. Additionally, the study of the gas phase photo-physical
properties of rhodamine dyes provides a benchmark for electronic structure calculations,
which remain a challenging prospect.
R575 has been subject to several previous gas phase studies. Sassin et al. studied the
dependence of the photo-fragmentation and fluorescence of R575 cations on the laser power
and buffer gas pressure using a continuous Ar ion laser at 515 and 488 nm.25,26
They observed
that the photo-fragmentation and fluorescence were dependent on both the laser fluence and
gas pressure, which was interpreted as absorption of multiple photons following many
collisional deactivation cycles. Forbes et al. measured the fluorescence excitation and
emission of R575 cations, giving maximum values of 495 nm and 506 nm respectively.27
They also measured a quadratic dependence of the photo-fragmentation yield as a function of
the laser power, and invoked a two photon mechanism for fragmentation following either
internal conversion or intersystem crossing to explain this observation. Chingin et al. looked
at the influence of the position of the carboxyl moiety of the carboxyphenyl group of R575 in
solution and the gas phase, the influence of metal cation adducts on the position of the photo-
fragmentation maximum, and the influence of the charge state.28, 29
They showed that both the
R575 cation and anion absorb at 488 nm, but that the neutral form is optically dark, and that
there is a significant blue-shift of the absorption maximum as the size of the metal adduct is
increased. Greisch et al. found the dispersed fluorescence maximum of 497 nm following
excitation at 458 nm and measured a triplet state lifetime of 3250 ms for R575 cations.30
Finally, Nagy et al. determined the fluorescence lifetime of R575 cations to be 5.65 ns
following absorption of 477 nm photons.31
There are two common themes in each of these studies. Firstly, the absorption, emission and
fragmentation properties have only been studied in the visible portion of the spectrum. Given
that multi-photon processes are invoked in explaining the photo-fragmentation of R575,
examination of the photo-physical properties of the higher lying singlet states is of interest.
Secondly, each of the studies mentioned above have used either continuous or else high
repetition rate lasers, and as such have studied the photo-physical behavior over irradiation
times of the order of milliseconds to seconds. The use of low repetition rate lasers allows the
photo-physical properties to be studied over a much shorter time period; in this case that of a
single laser pulse of the order of a few nanoseconds. This would in effect eliminate the
influence of the gas pressure on the excited state dynamics since the time scale for gas
collisions would be much longer than the time scale for any photo-physical process to occur.
In this paper, the photo-physical properties of R575 cations when irradiated with a single
nanosecond laser pulse are examined via action-spectroscopy in both visible and ultra-violet.
The results are compared to the calculated transition energies from TDDFT and the nature of
the transitions are discussed. These results may help to clarify the large errors that are often
found in the calculation of the S0S1 transition energy of rhodamine dyes. The origin of the
two photon dependence of the S1 state and the failure of action spectroscopy to recover an
accurate value for the absorption maximum are explained in terms of a 1+1 photo-
fragmentation scheme where the second photon is absorbed from the S1 to a higher lying
singlet state from which fragmentation can occur. A 1+1’ photo-fragmentation scheme is also
presented in which the total energy of the two photons are maintained whilst the individual
photon energies are varied allowing a reproduction of the S1 absorption maximum via action
spectroscopy.
2 Method.
2.1 Experimental.
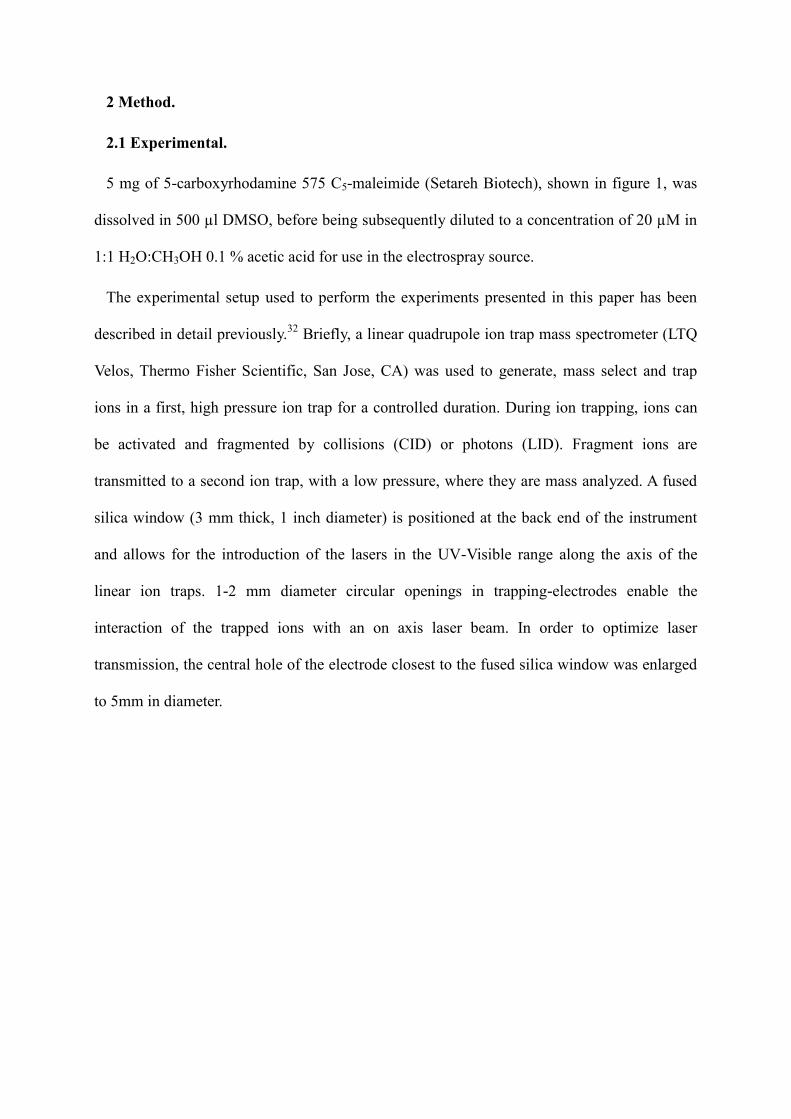
5 mg of 5-carboxyrhodamine 575 C5-maleimide (Setareh Biotech), shown in figure 1, was
dissolved in 500 µl DMSO, before being subsequently diluted to a concentration of 20 µM in
1:1 H2O:CH3OH 0.1 % acetic acid for use in the electrospray source.
The experimental setup used to perform the experiments presented in this paper has been
described in detail previously.32
Briefly, a linear quadrupole ion trap mass spectrometer (LTQ
Velos, Thermo Fisher Scientific, San Jose, CA) was used to generate, mass select and trap
ions in a first, high pressure ion trap for a controlled duration. During ion trapping, ions can
be activated and fragmented by collisions (CID) or photons (LID). Fragment ions are
transmitted to a second ion trap, with a low pressure, where they are mass analyzed. A fused
silica window (3 mm thick, 1 inch diameter) is positioned at the back end of the instrument
and allows for the introduction of the lasers in the UV-Visible range along the axis of the
linear ion traps. 1-2 mm diameter circular openings in trapping-electrodes enable the
interaction of the trapped ions with an on axis laser beam. In order to optimize laser
transmission, the central hole of the electrode closest to the fused silica window was enlarged
to 5mm in diameter.
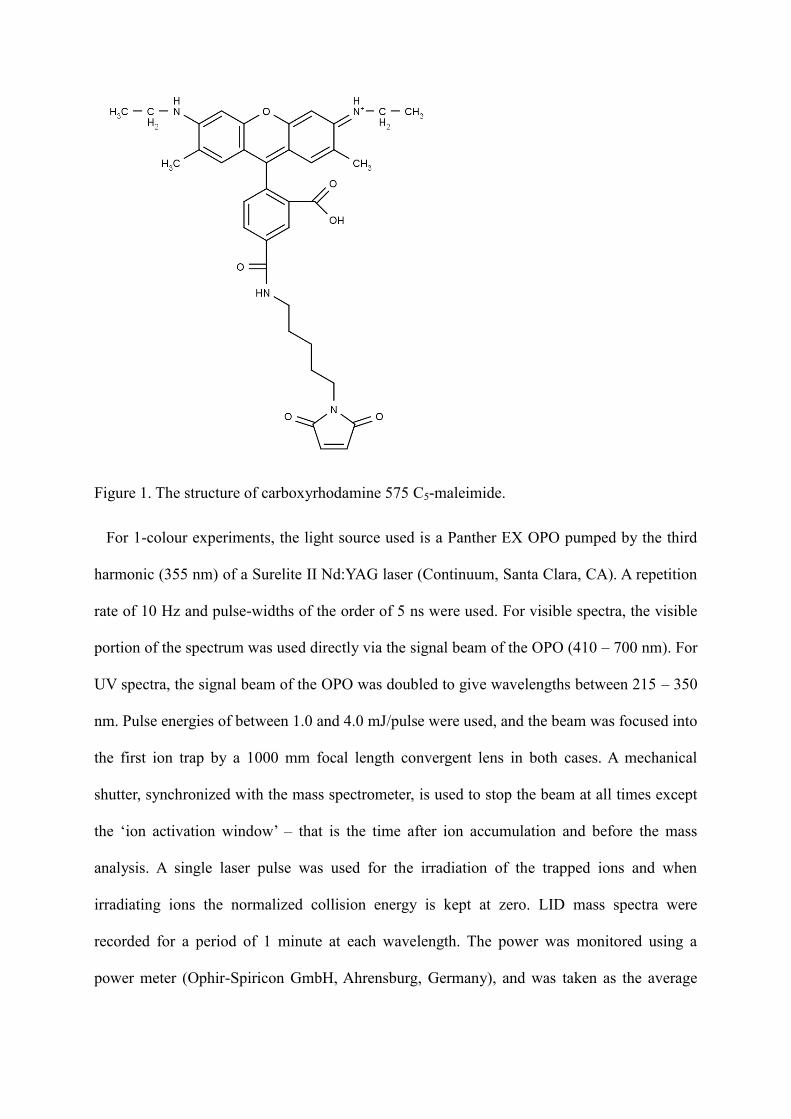
Figure 1. The structure of carboxyrhodamine 575 C5-maleimide.
For 1-colour experiments, the light source used is a Panther EX OPO pumped by the third
harmonic (355 nm) of a Surelite II Nd:YAG laser (Continuum, Santa Clara, CA). A repetition
rate of 10 Hz and pulse-widths of the order of 5 ns were used. For visible spectra, the visible
portion of the spectrum was used directly via the signal beam of the OPO (410 – 700 nm). For
UV spectra, the signal beam of the OPO was doubled to give wavelengths between 215 – 350
nm. Pulse energies of between 1.0 and 4.0 mJ/pulse were used, and the beam was focused into
the first ion trap by a 1000 mm focal length convergent lens in both cases. A mechanical
shutter, synchronized with the mass spectrometer, is used to stop the beam at all times except
the ‘ion activation window’ – that is the time after ion accumulation and before the mass
analysis. A single laser pulse was used for the irradiation of the trapped ions and when
irradiating ions the normalized collision energy is kept at zero. LID mass spectra were
recorded for a period of 1 minute at each wavelength. The power was monitored using a
power meter (Ophir-Spiricon GmbH, Ahrensburg, Germany), and was taken as the average
value measured for a duration of one minute directly after the mass spectrum accumulation
had taken place.
For two colour experiments, the pump laser was the Panther EX OPO as described above.
The probe laser was a Horizon OPO pumped by the third harmonic of a second Surelite I
Nd:YAG laser. The probe laser was triggered by the pump laser to ensure synchronous arrival
of the two laser pulses into the first ion trap. A mechanical shutter was placed in each beam,
and both were synchronized with the mass spectrometer so as to only allow light to pass into
the ion trap during the ion activation window as described above. The pump and probe beams
were combined using a 505 nm long pass dichroic mirror, and subsequently passed through a
1000 mm focal length lens into the ion trap. Wavelengths of between 460 – 505 nm for the
pump and 535 – 597 nm for the probe were used. The power of each laser was measured
individually using the power meter immediately after the dichroic mirror. At each pump and
probe wavelength, three mass spectra were recorded; pump only, probe only and pump +
probe. The former two were subtracted from the latter to give the fragmentation efficiency
due to the pump + probe only.
2.2 Computational
Geometry optimizations and the calculation of ground and excited state properties were
performed in the frame of density functional theory (DFT). The global hybrid functional
B3LYP with a 6-31+G** basis set was used, and Grimme's D3 dispersion correction with
Becke-Johnson damping was included for the optimization of structures.33-36
For the time-
dependent DFT (TDDFT) calculation of excited states, the ωB97X functional was used, as it
has been benchmarked to be accurate for a broad range of organic molecules.37-39
Here, a
bigger basis set (6-311++G**) was also used. All calculations employed the Gaussian09
Revision D.01 suite of programs.40
Semi-empirical PM7 calculations were conducted using
the MOPAC2012 code.41,42
Molecular Dynamics employed the Velocity-Verlet algorithm of a
local code with 1 fs time-step totalling to 1•105 steps. Thermalization was achieved by
coupling to a heat-bath with the Berendsen scheme (200 steps lag time).
The thermal broadening is based on a canonical ensemble of structures which were obtained
using constant-temperature molecular dynamics with the semi-empirical PM7 Hamiltonian.
From the 100 ps trajectory, 99 structures (every 1000th
step) were extracted and their vertical
absorption spectrum computed at the ωB97XD/6-31+G** level of theory. The resulting
simulated spectra for each structure were combined to obtain the final 300K absorption
spectrum.
3 Results and discussion
The gas phase absorption spectrum of R575 has been measured in the visible region
previously by both action spectroscopy and laser induced fluorescence. To the best of the
authors knowledge there have been no UV spectrum reported for any rhodamine dye in the
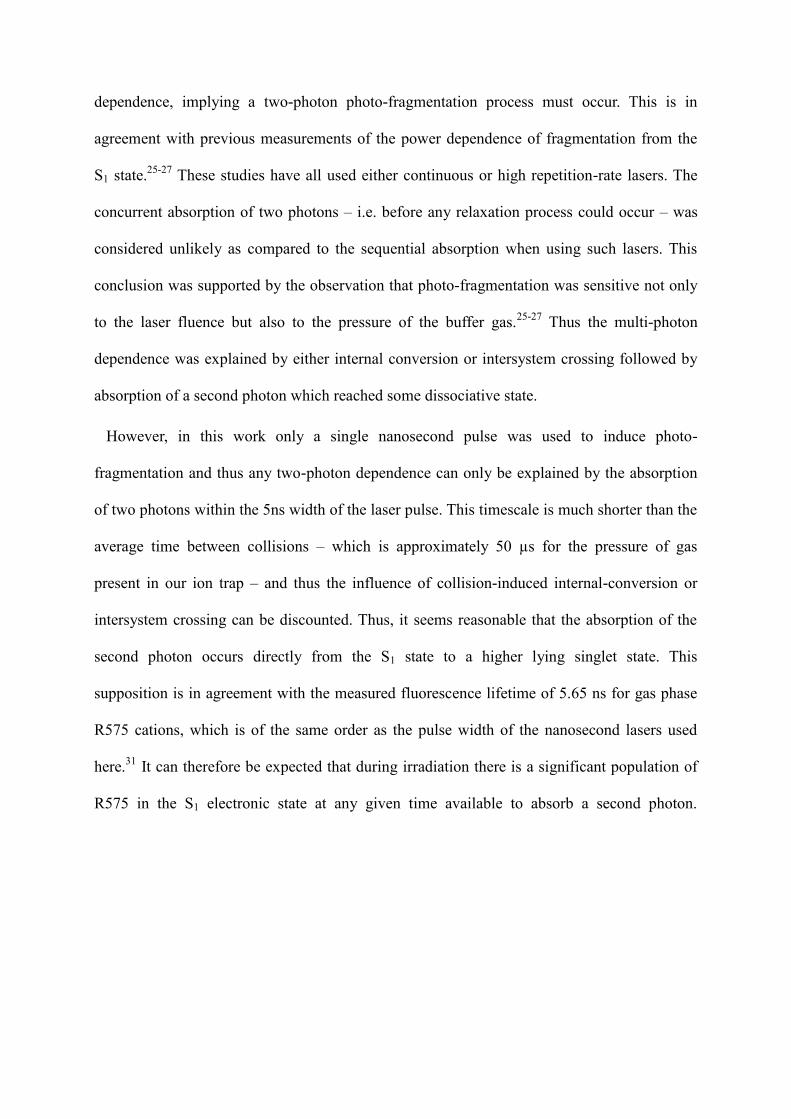
gas phase. The action-spectrum of R575 is shown in the top panel of figure 2 between 220 nm
and 590 nm, with 3 bands observed. The bottom panel of figure 2 contains the simulated
absorption spectrum obtained with TDDFT. There is an excellent agreement between
experimental and calculated spectra observed in the UV region of the spectrum (bands B and
C), but the agreement is noticeably worse in the visible region (band A).
It has been previously noted that the S1 transition of R575 is not well recovered by action
spectroscopy, a fact that was attributed to the high fluorescence quantum yield of this
molecule – and hence a low quantum yield for non-radiative relaxation and hence
fragmentation following internal conversion.22
Previous studies of R575 using laser induced
fluorescence placed the absorption maximum at 495 nm, whilst a study of R575 doubly
grafted onto a small tripeptide to quench fluorescence by forced proximity of the dyes shows
a maximum at 505 nm.23,28
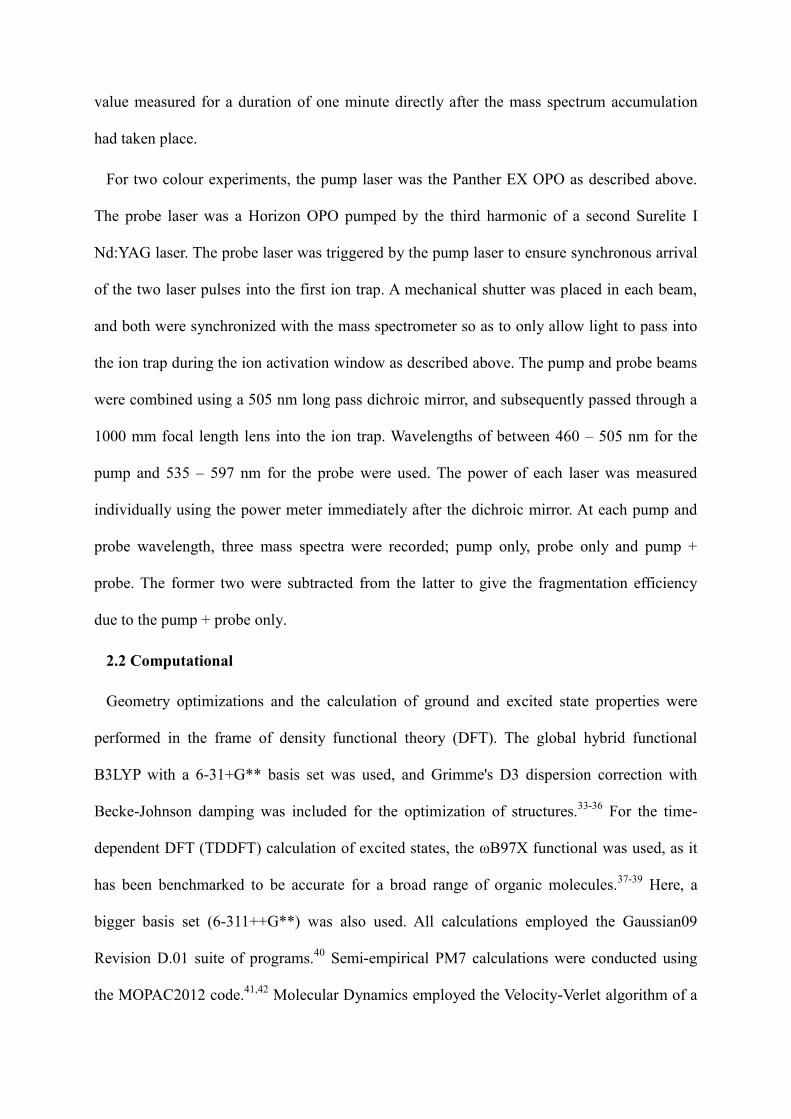
Figure 3(a), which gives the dependence of the fragmentation
yield as a function of laser power for the S1 transition, shows there is a clear quadratic
dependence, implying a two-photon photo-fragmentation process must occur. This is in
agreement with previous measurements of the power dependence of fragmentation from the
S1 state.25-27
These studies have all used either continuous or high repetition-rate lasers. The
concurrent absorption of two photons – i.e. before any relaxation process could occur – was
considered unlikely as compared to the sequential absorption when using such lasers. This
conclusion was supported by the observation that photo-fragmentation was sensitive not only
to the laser fluence but also to the pressure of the buffer gas.25-27
Thus the multi-photon
dependence was explained by either internal conversion or intersystem crossing followed by
absorption of a second photon which reached some dissociative state.
However, in this work only a single nanosecond pulse was used to induce photo-
fragmentation and thus any two-photon dependence can only be explained by the absorption
of two photons within the 5ns width of the laser pulse. This timescale is much shorter than the
average time between collisions – which is approximately 50 µs for the pressure of gas
present in our ion trap – and thus the influence of collision-induced internal-conversion or
intersystem crossing can be discounted. Thus, it seems reasonable that the absorption of the
second photon occurs directly from the S1 state to a higher lying singlet state. This
supposition is in agreement with the measured fluorescence lifetime of 5.65 ns for gas phase
R575 cations, which is of the same order as the pulse width of the nanosecond lasers used
here.31
It can therefore be expected that during irradiation there is a significant population of
R575 in the S1 electronic state at any given time available to absorb a second photon.
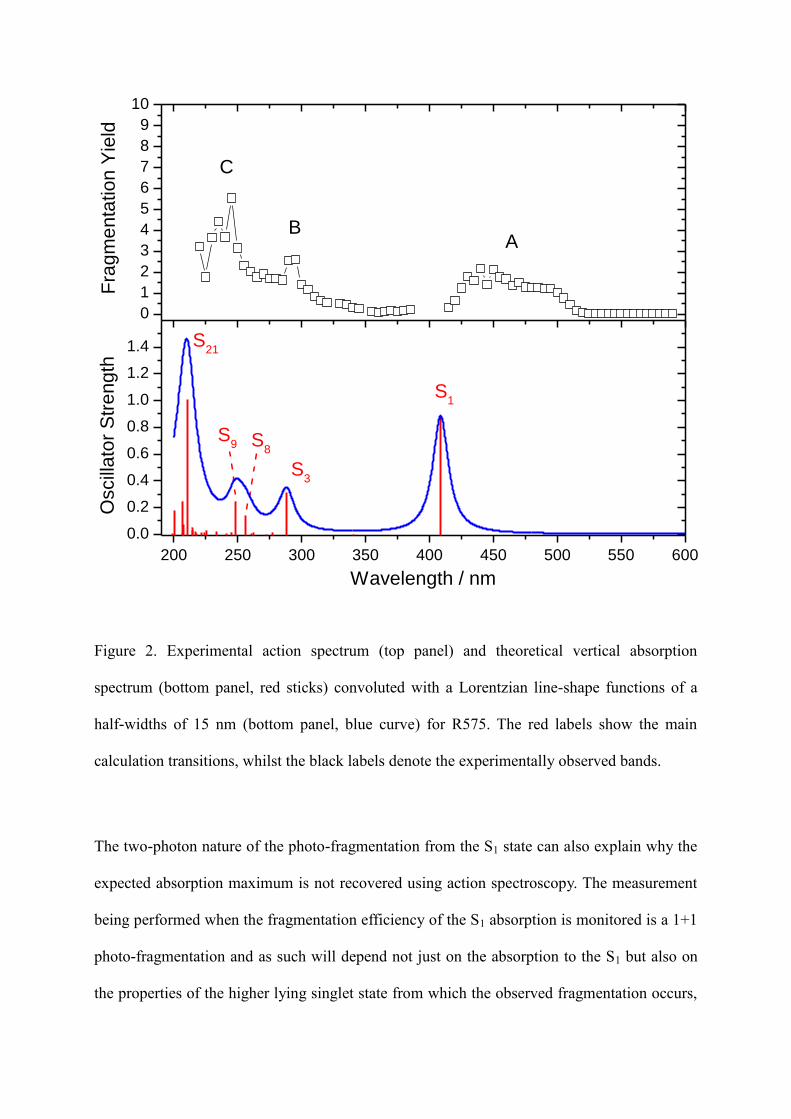
Figure 2. Experimental action spectrum (top panel) and theoretical vertical absorption
spectrum (bottom panel, red sticks) convoluted with a Lorentzian line-shape functions of a
half-widths of 15 nm (bottom panel, blue curve) for R575. The red labels show the main
calculation transitions, whilst the black labels denote the experimentally observed bands.
The two-photon nature of the photo-fragmentation from the S1 state can also explain why the
expected absorption maximum is not recovered using action spectroscopy. The measurement
being performed when the fragmentation efficiency of the S1 absorption is monitored is a 1+1
photo-fragmentation and as such will depend not just on the absorption to the S1 but also on
the properties of the higher lying singlet state from which the observed fragmentation occurs,
0
1
2
3
4
5
6
7
8
9
10
200 250 300 350 400 450 500 550 600
0.0
0.2
0.4
0.6
0.8
1.0
1.2
1.4
Fra
gm
en
tatio
n Y
ield
C
BA
O
scill
ato
r S
tre
ng
th
Wavelength / nm
S21
S9 S
8
S3
S1
see the left hand side of figure 4. R575 is found to absorb between 520 and 415 nm, and thus
due to the 1+1 photo-fragmentation scheme in these experiments this is equivalent –
energetically – to absorption of a single photon between 260 and 207.5 nm respectively.
Comparison with the UV spectrum in figure 2 for this wavelength range shows that this in in
the region of the C band, found at ~240 nm. Thus, the increase in fragmentation efficiency
and observed maximum of 460 nm for the S1 absorption can be explained, at least partially, by
there being the most efficient 1+1 absorption leading to photo-fragmentation between S1 and
the higher lying singlet state rather than being the maximum of absorption in the S1.
Figure 3. Dependence of the fragmentation yield as a function of power at (a) 495 nm, (b) 295
nm and (c) 240 nm. The red curve represents a fit to a second order polynomial for panels (a)
and (b), and a straight line for panel (c), with the associated R² value indicated. The errors in a
single measurement of the fragmentation yield, as calculated by Poisson statistics, is smaller
than the size of the data point and are thus omitted.
0.000 0.002 0.004 0.0060.0
0.1
0.2
0.3
0.4
0.5
0.6
0.000 0.001 0.002 0.0030.00
0.05
0.10
0.15
0.20
0.25
0.000 0.002 0.0040.00
0.01
0.02
0.03
0.04
0.05
0.06
0.07
0.08
(c) 250 nm
R² = 0.982R² = 0.993
(b) 295 nm
Laser power / W
R² = 0.990
(a) 495 nm
Fra
gm
en
tatio
n Y
ield
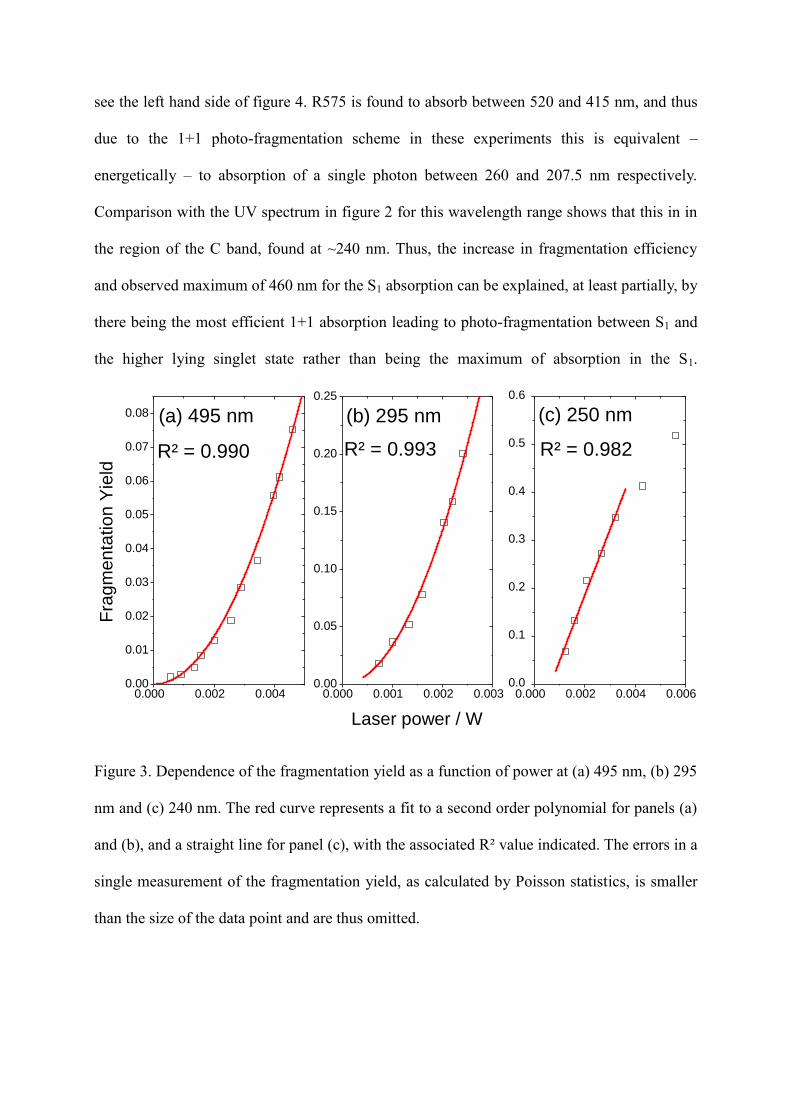
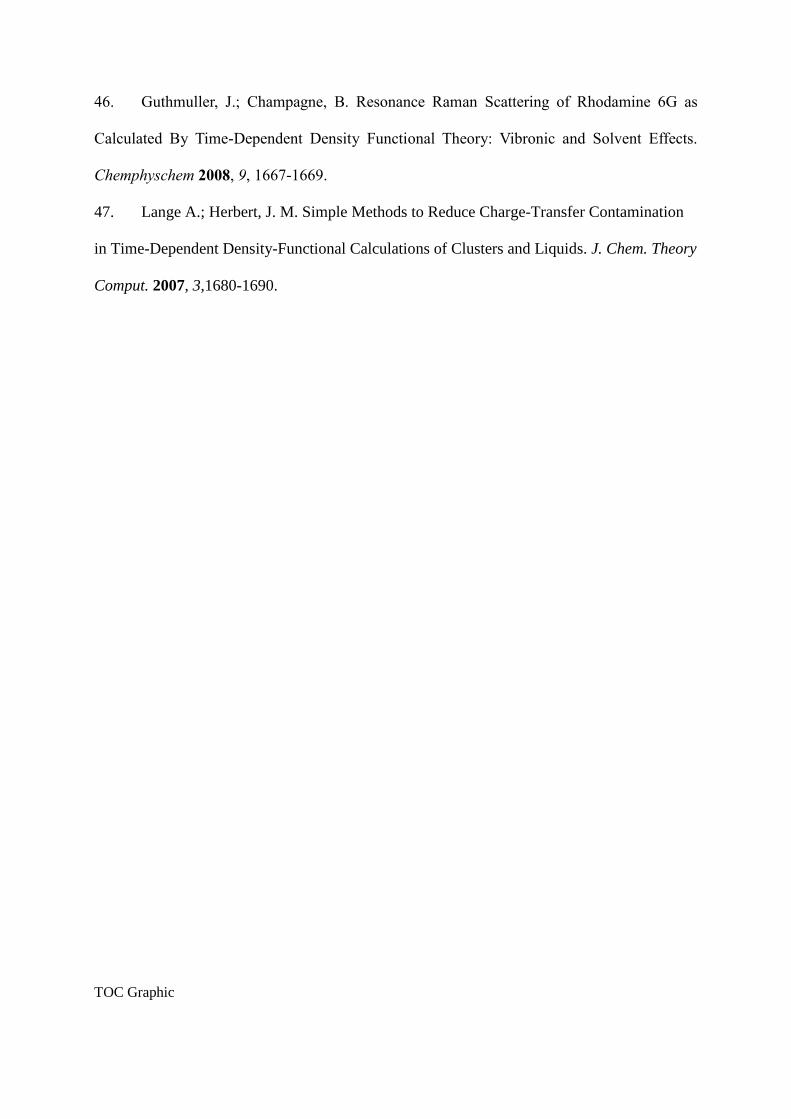
Figure 4. Schematic representation of one-colour (left) and two-colour (right) schemes
employed in this work to study the fragmentation after absorption of a photon by the S1 state
of R575 cations.
The nature of the photo-fragmentation suggests an alternative method for probing the
properties of the S1 directly, using a 1+1’ absorption scheme. In such an experiment, two
photons of different wavelengths are used – the first to pump R575 to the S1 state and the
second to excite to the higher lying singlet state that leads to dissociation, see the right hand
side of figure 4. The total energy of the two photons – and thus the total energy added to the
system – is kept constant when the wavelengths of the pump and probe photon are changed
such that fragmentation happens after absorption to the same higher-lying singlet state. The
probe laser wavelengths were chosen such that the photon energy was smaller than the S1
transition energy, and thus absorption of a probe photon by ground state R575 was not
possible. In this scheme, the amount of two colour photo-fragmentation observed will depend
only on the population of R575 in the S1 state since the probe photon has an energy below
that of the S1 transition energy. Such a measurement can be obtained by measurement of the
fragmentation yield with both pump and probe laser, and subtracting the value of the
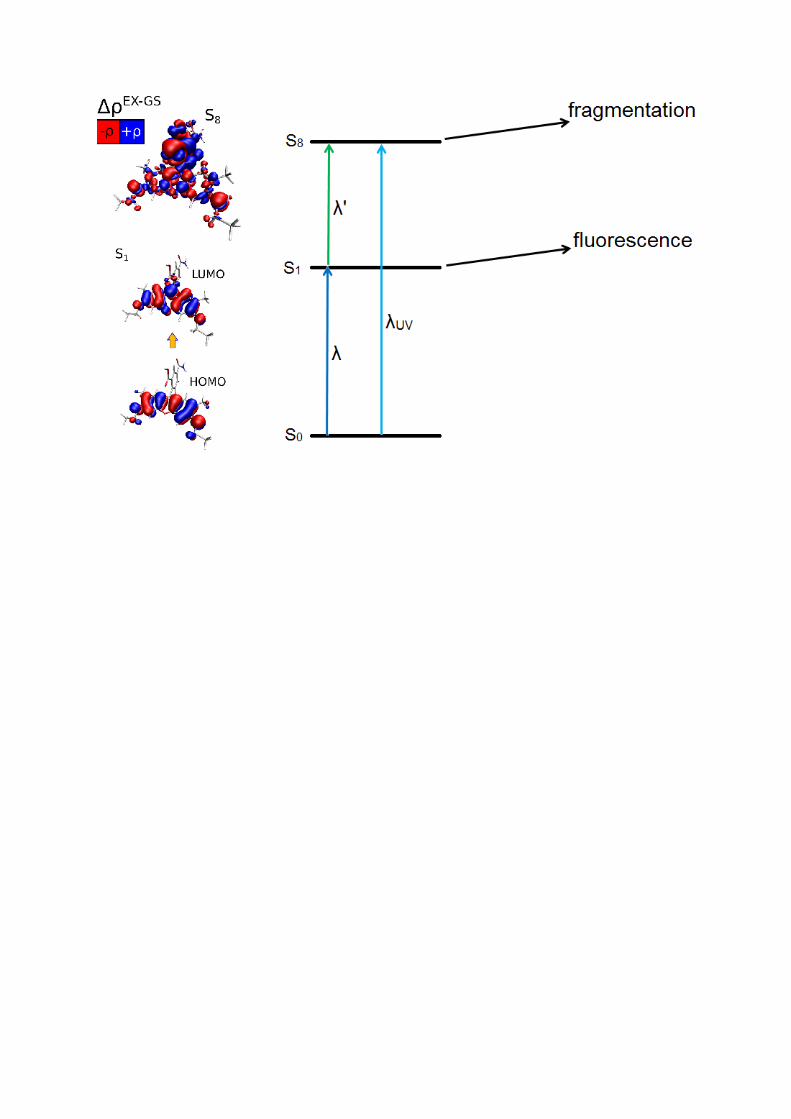
fragmentation yield of pump and probe lasers alone (see figure S1 in the supporting
information).
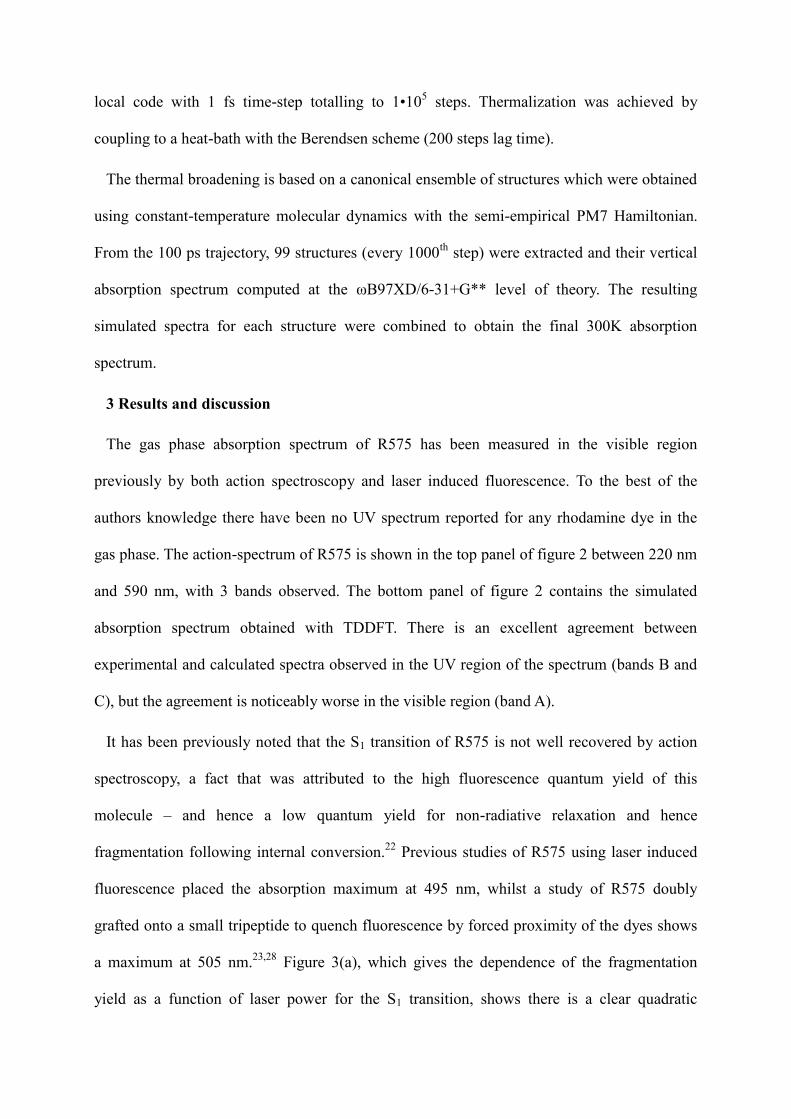
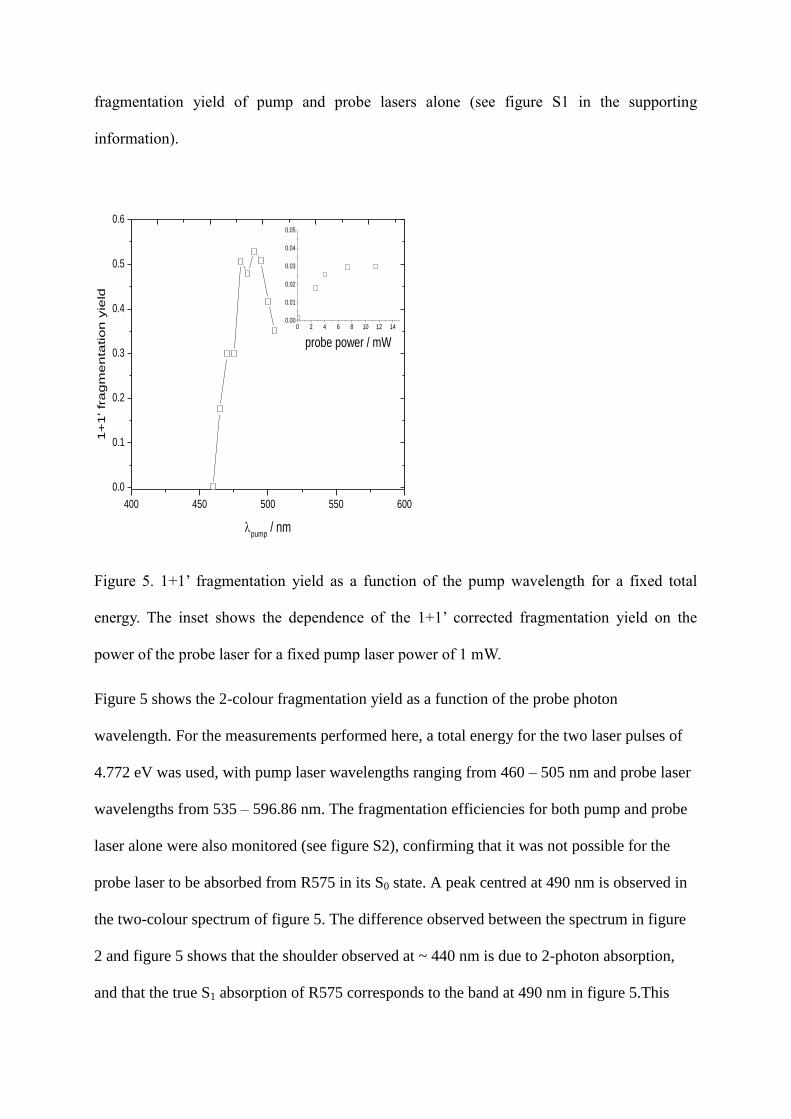
Figure 5. 1+1’ fragmentation yield as a function of the pump wavelength for a fixed total
energy. The inset shows the dependence of the 1+1’ corrected fragmentation yield on the
power of the probe laser for a fixed pump laser power of 1 mW.
Figure 5 shows the 2-colour fragmentation yield as a function of the probe photon
wavelength. For the measurements performed here, a total energy for the two laser pulses of
4.772 eV was used, with pump laser wavelengths ranging from 460 – 505 nm and probe laser
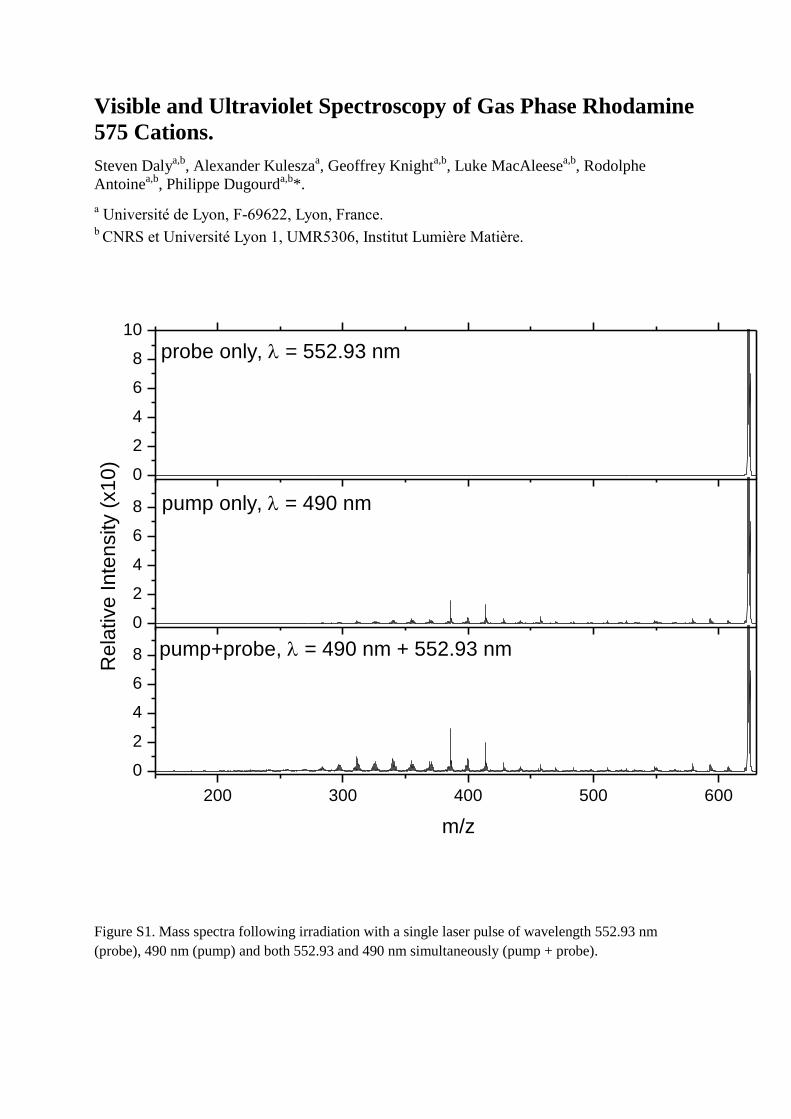
wavelengths from 535 – 596.86 nm. The fragmentation efficiencies for both pump and probe
laser alone were also monitored (see figure S2), confirming that it was not possible for the
probe laser to be absorbed from R575 in its S0 state. A peak centred at 490 nm is observed in
the two-colour spectrum of figure 5. The difference observed between the spectrum in figure
2 and figure 5 shows that the shoulder observed at ~ 440 nm is due to 2-photon absorption,
and that the true S1 absorption of R575 corresponds to the band at 490 nm in figure 5.This
400 450 500 550 600
0.0
0.1
0.2
0.3
0.4
0.5
0.6
1+
1' fr
ag
me
nta
tio
n y
ield
pump
/ nm
0 2 4 6 8 10 12 140.00
0.01
0.02
0.03
0.04
0.05
probe power / mW

value is slightly lower than the 505 nm observed by action-spectroscopy of pseudo-dimers of
R575 and 495 nm measured by laser induced fluorescence (LIF).22, 27
Such small differences
are expected when comparing LIF and action-spectroscopic methods for determining the real
maximum of absorption, and shifts in the transition energy are expected in dimeric systems.
The inset of figure 5 shows the 2-colour fragmentation as a function of the probe laser power,
which shows an initial linear increase (R2 = 0.997) followed by a plateau corresponding to
saturation of the irradiated ions. This confirms that it is absorption of a single photon from
R575 cations electronically excited into the S1 state that is causing the increased 2-colour
fragmentation yield. Since it is expected that such a 2-photon photo-fragmentation scheme
will be observed in other fluorescent rhodamine derivatives, this method provides a universal
way to accurately probe the S1 state via photo-fragmentation spectroscopy.
The value of 490 nm for the S1 transition of R575 is significantly different to the value of 409
nm predicted by TDDFT. This is a well-known problem for such xanthene based dyes, with
calculations of S1 transition energies of various rhodamine derivatives showing a systematic
over-estimation of the transition energy by as much as 0.6 eV.43
Although the use of a global
hybrid density functional with exact Hartree-Fock exchange and a long-range correction is
expected to alleviate poor charge-transfer descriptions in many molecules, the S1 state seems
still to suffer from a strong (blue) shift as compared to experiment. Previously reported
calculations employing a variety of density functionals overestimate the rhodamine absorption
band peak of about 0.4 eV as a general trend to the TDDFT method for this type of dyes.43-46
The possible origins of the deviation between TDDFT and experiment may lie in negligence
of electron correlation or non-verticality of the absorption (due to strong vibronic coupling).39
Additionally, thermal effects may influence the position of the absorption maxima as
compared to the often used 0K approximation when TDDFT spectra are considered. In the
following, these three factors are disentangled by separately considering explicit thermal
broadening of the absorption spectrum, potential impact of vibronic coupling within the
TDDFT approach and – qualitatively – the impact of electron correlation using semi-
empirical multi-electron configurational calculations.
From the 0 K and 300 K spectrum, shown in figure S3, a shift of -0.1 eV in the 300K
spectrum with respect to 0 K is evident. Based on this analysis we propose a thermochromic
redshift for the S1 of about 25 nm with regards to the 0 K prediction.
The calculation of excited state relaxation gave access to an estimate of the maximal possible
redshift of the transition due to non-verticality of the absorption. The adiabatic 0-0 transition
is calculated to occur at a wavelength of 411 nm. In accordance to the known small Stokes
shift of R575 in the gas-phase (11 nm as measured by Talbot et al.), this contribution is
considered to be less than 0.05 eV (about 10 nm in the region between 400 and 500 nm).19
Finally, in order to obtain a rough estimate of the importance of electron correlation, We
employ a systematic semi-empirical multi-electron configuration interaction calculation using
the PM7 Hamiltonian. The S1 excitation energies using active spaces of 2 to 8 electrons in 2
to 9 levels (denoted as 2,2 to 8,9) are given in table S1 and figure S4 in the supporting
information. According to these calculations, the effect of correlating up to about 15,000
configurations can be as much as 0.8 eV within this model. Hence, it can be concluded that
electron correlation may be the most important influential factor for the observed deviation
between TDDFT and experiment. While we can quantify a thermochromic shift of about 25
nm to be present apart from the deficient electron correlation description, only a small
vibronic shift is held responsible for the deviation between TDDFT and experimental S1
absorption energies of R575 as reported in figure 2, and potentially in xanthene-based dyes in
general.
Considering now bands B and C, comparison to the simulated spectrum indicates that these
to be the S3 and a combination of the S8 and S9 transitions respectively (see figure 2). In fact,
the agreement of the TDDFT and experimental spectra is much better than for the S1 state and
motivates an attempt assign the nature of the excited states according to the analysis of the
excitations. It should also be noted that in the experimental spectrum, a shoulder is observed
at 330 nm. Indeed the TDDFT calculation predicts the S2 state to lie at an energy of 3.68 eV
(337 nm) and to be optically dark (oscillator strength fe = 0.001).
The evolution of fragmentation yield as a function of laser power for band B and band C are
shown in figure 3 (b) and (c) respectively. Band C has an initially linear relationship, which
indicates fragmentation is via absorption of a single photon. Above 3 mW, a deviation from
this linear relationship is observed which indicates the onset of saturation. For band B, a
quadratic relationship is observed, which is indicative of a 2-photon absorption process
similar to that observed for the S1 transition. To understand the physical reason behind the
fragmentation behaviour, it is instructive to consider the nature of the transitions found by
TDDFT. This analysis is detailed in figure 6 by visualizing the leading Kohn-Sham orbital
excitations for S1 and S3 as well as excited-ground state electron density difference plots for
S8, S9 and S21 (see also supplementary material table S2 and Figure S5). The S1 state is mainly
composed of the HOMO-LUMO excitation, while S3 mainly consists of two excitations with
π-π* character (occupied orbitals being the HOMO-1 and HOMO-2) and a (minor) charge
transfer type of excitation from the carboxyphenyl moiety to the xanthene π system. This
renders the S1 and S3 transitions “local” in character.
The higher-energy transitions are comprised of a more complicated character with a
significant number of one-electron excitations contributing. For this reason we depict the
overall electron charge redistribution upon the optical transition from the difference between
relaxed excited state density and ground state electronic density. S8 and S9 are very similar
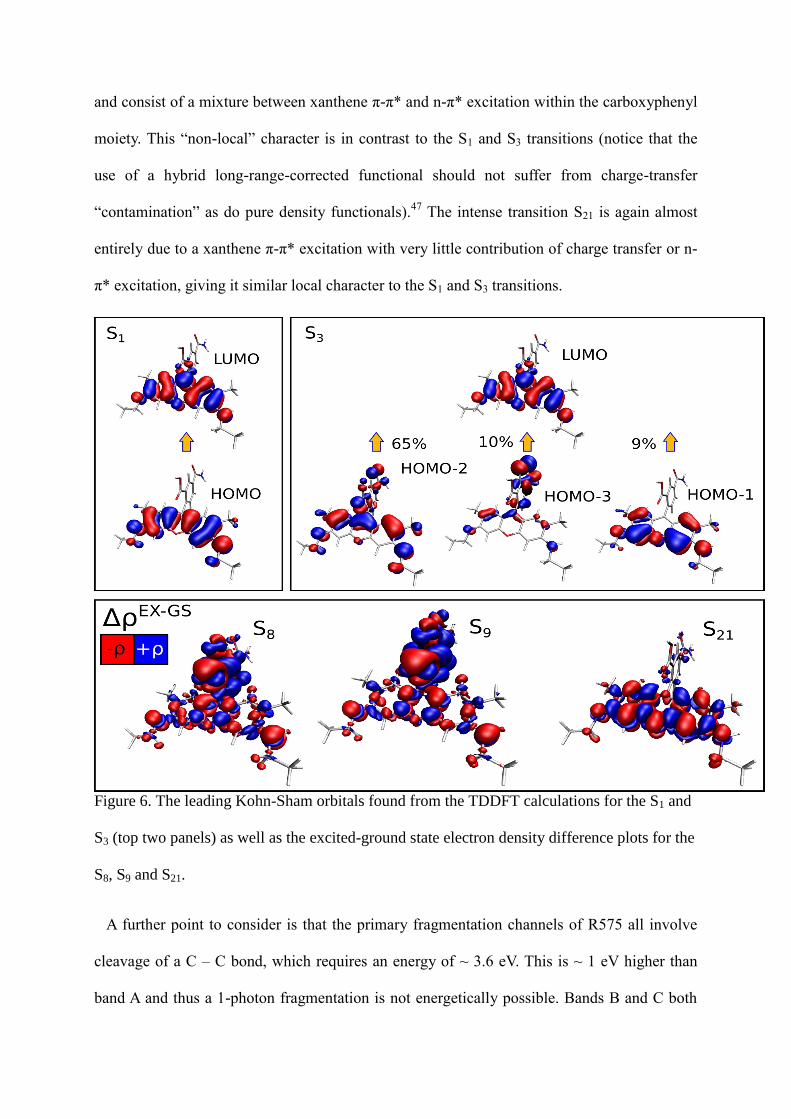
and consist of a mixture between xanthene π-π* and n-π* excitation within the carboxyphenyl
moiety. This “non-local” character is in contrast to the S1 and S3 transitions (notice that the
use of a hybrid long-range-corrected functional should not suffer from charge-transfer
“contamination” as do pure density functionals).47
The intense transition S21 is again almost
entirely due to a xanthene π-π* excitation with very little contribution of charge transfer or n-
π* excitation, giving it similar local character to the S1 and S3 transitions.
Figure 6. The leading Kohn-Sham orbitals found from the TDDFT calculations for the S1 and
S3 (top two panels) as well as the excited-ground state electron density difference plots for the
S8, S9 and S21.
A further point to consider is that the primary fragmentation channels of R575 all involve
cleavage of a C – C bond, which requires an energy of ~ 3.6 eV. This is ~ 1 eV higher than
band A and thus a 1-photon fragmentation is not energetically possible. Bands B and C both
lie above this energy, and thus their different photo-fragmentation behaviour may lie within
the different nature of the transitions involved.
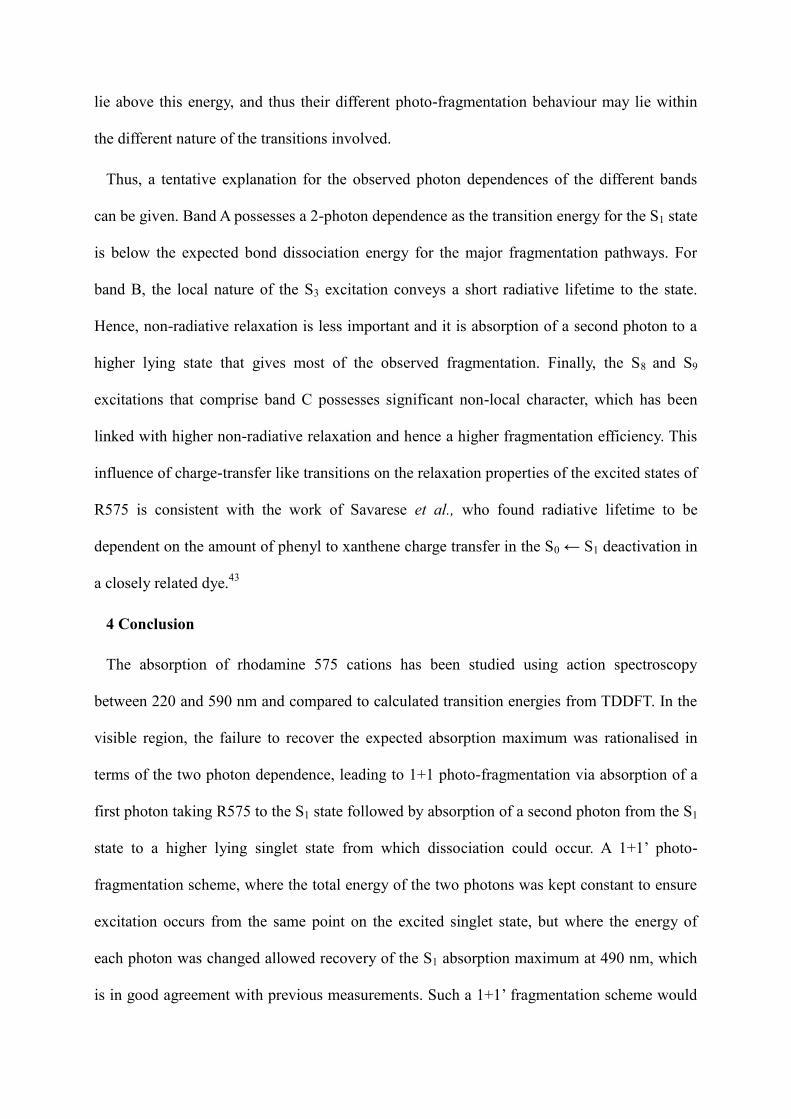
Thus, a tentative explanation for the observed photon dependences of the different bands
can be given. Band A possesses a 2-photon dependence as the transition energy for the S1 state
is below the expected bond dissociation energy for the major fragmentation pathways. For
band B, the local nature of the S3 excitation conveys a short radiative lifetime to the state.
Hence, non-radiative relaxation is less important and it is absorption of a second photon to a
higher lying state that gives most of the observed fragmentation. Finally, the S8 and S9
excitations that comprise band C possesses significant non-local character, which has been
linked with higher non-radiative relaxation and hence a higher fragmentation efficiency. This
influence of charge-transfer like transitions on the relaxation properties of the excited states of
R575 is consistent with the work of Savarese et al., who found radiative lifetime to be
dependent on the amount of phenyl to xanthene charge transfer in the S0 ← S1 deactivation in
a closely related dye.43
4 Conclusion
The absorption of rhodamine 575 cations has been studied using action spectroscopy
between 220 and 590 nm and compared to calculated transition energies from TDDFT. In the
visible region, the failure to recover the expected absorption maximum was rationalised in
terms of the two photon dependence, leading to 1+1 photo-fragmentation via absorption of a
first photon taking R575 to the S1 state followed by absorption of a second photon from the S1
state to a higher lying singlet state from which dissociation could occur. A 1+1’ photo-
fragmentation scheme, where the total energy of the two photons was kept constant to ensure
excitation occurs from the same point on the excited singlet state, but where the energy of
each photon was changed allowed recovery of the S1 absorption maximum at 490 nm, which
is in good agreement with previous measurements. Such a 1+1’ fragmentation scheme would
be applicable to any highly fluorescent rhodamine derivative, which have similar properties to
R575 in the gas phase.
The difference in observed power dependence for the different bands observed
experimentally was tentatively explained in terms of the nature of the excitations that
contribute to them. The local nature of the S1 and S3 states leads to a short radiative lifetime
and thus absorption of a second-photon to a higher lying state was required to measure any
photo-fragmentation, resulting in a quadratic dependence of photo-fragmentation yield on
laser power. Additionally, the S1 state has a transition energy below that of the expected bond
dissociation energy for the major fragmentation pathways. In contrast, the non-local nature of
the S8 and S9 transitions allows access to a more diverse range of deactivation pathways,
including direct photo-fragmentation. This competition between local and non-local character
of excitations is as theorized by Savarese et al.43
From our theoretical work complementing the 0 K vertical TDDFT absorption spectrum, we
have gained insight into the factors that lead to the significant overestimation of the S1
transition energy R575. We considered thermochromic and possible vibronic shifts and –
qualitatively - electron correlation effects. It was found that the main contribution to this
failure is due to the latter but a most probably smaller, but significant effect of as much as 25
nm arises from thermochromism at 300K. Vibronic effects were found to play only a minor
role. We would like to emphasize that in view of our focus on the UV part of the spectrum we
suggest that performing higher-level ab-initio calculations on the S1 state in order to better
quantify electron correlation versus thermochromic and vibronic shifts.
ASSOCIATED CONTENT
Mass spectra for pump only, probe and pump+probe LID experiments, 1 color action spectra
for pump and probe wavelengths only, and further details of the thermochromism and
electronic configurations can be found in the supplementary information. This material is
available free of charge via the Internet at http://pubs.acs.org.
AUTHOR INFORMATION
Corresponding Author
* To whom correspondence should be addressed. Email: [email protected]
Author Contributions
All authors have given approval to the final version of the manuscript.
Funding Sources
The research leading to these results has received funding from the European Research
Council under the European Union's Seventh Framework Programme (FP7/2007-2013 Grant
agreement N°320659). A.K. acknowledges funding from the Deutsche
Forschungsgemeinschaft DFG (Research Fellowship Ku 3251/1-1)
ACKNOWLEDGMENT
We gratefully acknowledge computer time granted by the PSMN (Ple Scientifique de
Modélisation Numérique) computing center of ENS de Lyon.
REFERENCES
1. Arbeloa, F. L.; Arbeloa, T. L.: Estevez, M. J. T.; Arbeloa, I. L. Photophysics of
Rhodamines - Molecular-Structure and Solvent Effects. J. Phys. Chem.1991, 95, 2203-2208.
2. Arbeloa, T. L.; Arbeloa, F. L.; Bartolome, P. H.; Arbeloa, I. L. On the Mechanism of
Radiationless Seactivation of Rhodamines. Chem. Phys.1992, 160, 123-130.
3. Arbeloa, F. L. ; Arbeloa, T. L.; Lage, E. G.; Arbeloa, I. L.; Deschryver, F. C.
Photophysical Properties of Rhodamines with Monoethylamino Group-r19 and Group-r6g in
Water Ethanol Mixtures. J. Photoch. Photobio. A 1991, 56, 313-32.
4. Arbeloa, T. L.; Estevez, M. J. T.; Arbeloa, F. L.; Aguirresacona, I. U.; Arbeloa, I. L.;
Luminescence Properties of Rhodamines in Water-Ethanol Mixtures. J. Lumin. 1991, 48-49,
400-404.
5. Arden, J.; Deltau, G.; Huth, V.; Kringel, U.; Peros D.; Drexhage, K. H.; Fluorescence
and Lasing Properties of Rhodamine Dyes. J. Lumin. 1991, 48-49, 352-358.
6. Barigelletti, F.; Effect of Temperature on the Photophysics of Rhodamine-101 in a
Polar-Solvent. Chem. Phys. Lett. 1987, 140, 603-606.
7. Beaumont, P. C.; Johnson D. G.; Parsons, B. J. Photophysical Properties of Laser-Dyes
- Picosecond Laser Flash-Photolysis Studies of Rhodamine-6G, Rhodamine-B and
Rhodamine-101. J. Chem. Soc. Faraday T. 1993, 89, 4185-4191.
8. Ferguson, M. W.; Beaumont, P. C.; Jones, S. E.; Navaratnam S.; and Parsons, B. J.
Excited State and Free Radical Properties of Rhodamine 123: a Laser Flash Photolysis and
Radiolysis Study. Phys. Chem. Chem. Phys. 1999, 1, 261-268.
9. Karstens T.; Kobs, K. Rhodamine-B and Rhodamine-101 as Reference Substances for
Fluorescence Quantum Yield Measurements. J. Phys. Chem. 1980, 84, 1871-1872.
10. Magde, D.; Rojas, G. E.; Seybold, P. G. Solvent Dependence of the Fluorescence
Lifetimes of Xanthene Dyes. Photochem. Photobiol. 1999, 70, 737-744.
11. Snare, M. J.; Treloar, F. E.; Ghiggino, K. P.; Thistlethwaite, P. J. The Photophysics of
Rhodamine-B. J. Photochem. 1982, 18, 335-346.
12. Chingin, K.; Chen, H. W.; Gamez, G.; Zenobi, R. Exploring Fluorescence and
Fragmentation of Ions Produced by Electrospray Ionization in Ultrahigh Vacuum. J. Am. Soc.
Mass Spectr. 2009, 20, 1731-1738.
13. Clemen, M.; Gernert, C.; Peters J.; Grotemeyer, J. Fragmentation Reactions of Labeled
and Unlabeled Rhodamine B in a High-Resolution Fourier Transform Ion Cyclotron
Resonance Mass Spectrometer. Eur. J. Mass Spetrom.2013, 19, 135-139.
14. Peters, J.; Clemen M.; Grotemeyer, J. Fragmentation of Deuterated Rhodamine B
Derivates by Laser and Collisional Activation in an FT-ICR Mass Spectrometer. Anal.
Bioanal. Chem. 2013, 405, 7061-7069.
15. Frankevich, V.; Guan, X. W.; Dashtiev M.; Zenobi, R.; Laser-induced Fluoresence of
Trapped Gas-Phase Molecular Ions Generated by Internal-source Matrix-Assisted Laser
Desorption/Ionization in a Fourier Transform Ion Cyclotron Resonance Mass Spectrometer.
Eur. J. Mass Spectrom. 2005, 11, 475-482.
16. Frankevich, V.; Sinues, P. M. L.; Barylyuk, K.; Zenobi, R.; Ion Mobility Spectrometry
Coupled to Laser-Induced Fluorescence. Anal. Chem. 2013, 85, 39-43.
17. Peters, J.; Grotemeyer, J.; Fragmentation of Xanthene Dyes by Laser Activation and
Collision-Induced Dissociation on a High-resolution Fourier Transform Ion Cyclotron
Resonance Mass Spectrometer. Rapid. Commun. Mass Sp. 2011, 25, 1169-1172.
18. Sagoo, S. K.; Jockusch, R. A.; The Fluorescence Properties of Cationic Rhodamine B
in the Gas Phase. J. Photoch. Photobio. A 2011, 220, 173-178.
19. Talbot, F. O.; Rullo, A.; Yao H.; Jockusch, R. A. Fluorescence Resonance Energy
Transfer in Gaseous, Mass-Selected Polyproline Peptides. J. Am. Chem. Soc. 2010, 132,
16156-16164.
20. Dashtiev, M.; Azov, V.; Frankevich, V.; Scharfenberg L.; Zenobi, R. Clear Evidence of
Fluorescence Resonance Energy Transfer in Gas-Phase Ions J. Am. Soc. Mass Spectr. 2005,
16, 1481-1487.
21. Danell A. S.; Parks, J. H. FRET Measurements of Trapped Oligonucleotide Duplexes
Int. J. Mass Spectrom. 2003, 229, 35-45.
22. Daly, S.; Poussigue, F.; Simon, A-L.; MacAleese, L.; Bertorelle, F.; Chirot, F.;
Antoine, R.; Dugourd, P. Action-FRET: Probing the Molecular Conformation of Mass-
Selected Gas-Phase Peptides with Forster Resonance Energy Transfer Detected by Acceptor-
Specific Fragmentation. Anal. Chem. 2014, 86, 8798-8804.
23. Frankevich, V.; Chagovets, V.; Widjaja, F.; Barylyuk, K.; Yang, Z. Y.; Zenobi, R.
Fluorescence Resonance Energy Transfer of Gas-Phase Ions Under Ultra-High Vacuum and
Ambient Conditions. Phys. Chem. Chem. Phys. 2014, 16, 8911-8920.
24. Hendricks, N. G.; Lareau, N. M.; Stow, J. S. M.; McLean A.; Julian, R. R. Bond-
Specific Dissociation Following Excitation Energy Transfer for Distance Constraint
Determination in the Gas Phase. J. Am. Chem. Soc. 2014, 136, 13363-13370.
25. Sassin, N. A.; Everhart, S. C.; Cline, J. I.; Ervin, K. M. Photodissociation and
Collisional Cooling of Rhodamine 575 Cations in a Quadrupole Ion Trap. J. Chem. Phys.
2008, 128, 234305.
26. Sassin, N. A.; Everhart, S. C.; Dangi, K. B. B.; Ervin, M.; Cline, J. I. Fluorescence and
Photodissociation of Rhodamine 575 Cations in a Quadrupole Ion Trap. J. Am. Soc. Mass
Spectr. 2009, 20, 96-104.
27. Forbes, M. W.; Jockusch, R. A. Gas-Phase Fluorescence Excitation and Emission
Spectroscopy of Three Xanthene Dyes (Rhodamine 575, Rhodamine 590 and Rhodamine 6G)
in a Quadrupole Ion Trap Mass Spectrometer. J. Am. Soc. Mass Spectr. 2011, 22, 93-109.
28. Chingin, K.; Balabin, R. M.;. Frankevich, V; Chen, H. W.; Barylyuk, K.; Nieckarz, R.;
Fedorov A.; Zenobi, R. Optical Properties of Protonated Rhodamine 19 Isomers in Solution
and in the Gas Phase. Phys. Chem. Chem. Phys. 2010, 12, 14121-14127.
29. Chingin, K.; Balabin, R. M.; Barylyuk, K.; Chen, H. W.; Frankevich V.; Zenobi, R.
Rhodamines in the Gas Phase: Cations, Neutrals, Anions, and Adducts with Metal Cations.
Phys. Chem. Chem. Phys. 2010, 12, 11710-11714.
30. Greisch, J. F.; Harding, M. E.; Kordel, M.; Klopper, W.; Kappes, M. M.; Schooss, D.
Intrinsic Fluorescence Properties of Rhodamine Cations in Gas-Phase: Triplet Lifetimes and
Dispersed Fluorescence Spectra. Phys. Chem. Chem. Phys. 2013, 15, 8162-8170.
31. Nagy, A. M.; Talbot, F. O.; Czar, M. F.; Jockusch, R. A.; Fluorescence Lifetimes of
Rhodamine Dyes in Vacuo. J. Photoch. Photobio. A 2012, 244, 47-53.
32. Bellina, B.; Antoine, R.; Broyer, M.; Gell, L.; Sanader, Z.; Mitric, R.; Bonacic-
Koutecky, V.; Dugourd, P. Formation and Characterization of Thioglycolic Acid-Silver
Cluster Complexes. Dalton T. 2013, 42, 8328-8333.
33. Becke, A. D. Density-Functional Thermochemistry .3. The Role of Exact Exchange. J.
Chem. Phys. 1993, 98, 5648-5652.
34. Lee, C. T.; Yang, W. T.; Parr, R. G. Development of the Colle-Salvetti Correlation-
Energy formula into a Functional of the Electron-Density. Phys. Rev. B 1988, 37, 785-789.
35. Stephens, P. J.; Devlin, F. J.; Chabalowski, C. F.; Frisch, M. J. Ab-initio Calculation of
Vibrational Absorption and Circular-Dichroism Spectra Using Density-Functional Force-
Fields. J. Phys. Chem. 1994, 98, 11623-11627.
36. Grimme, S.; Ehrlich, S.; Goerigk, L. Effect of the Damping Function in Dispersion
Corrected Density Functional Theory. J. Comput. Chem. 2011, 32, 1456-1465.
37. Chai, J. D.; Head-Gordon, M. Long-Range Corrected Hybrid Density Functionals
With Damped Atom-Atom Dispersion Corrections. Phys. Chem. Chem. Phys. 2011, 10, 6615-
6620.
38. Jacquemin, D.; Perpete, E. A.; Ciofini, I.; Adamo, C. Assessment of the Omega B97
Family for Excited-State Calculations. Theor. Chem. Acc. 2011, 128, 127-136.
39. Laurent A. D.; Jacquemin, D. TD-DFT Benchmarks: A Review Int. J. Quantum Chem.
2013, 113, 2019-2039.
40. Frisch, M. J.; Trucks, G. W.; Schlegel, H. B.; Scuseria, G. E.; Robb, M. A.;
Cheeseman, J. R.; Scalmani, G.; Barone, V.; Mennucci, B.; Petersson, G. A.; et al.; Gaussian
09, Revision D.01; Gaussian, Inc., Wallingford CT, 2009.
41. MOPAC2012, Stewart, J. J. P., Stewart Computational Chemistry, Colorado Springs,
CO, USA, 2012.
42. Stewart, J. J. P. Ab-initio Calculation of Vibrational Absorption and Circular-
Dichroism Spectra Using Density-Functional Force-Fields. J. Mol. Model. 2013, 19, 1-32.
43. Savarese, M.; Aliberti, A.; De Santo, I.; Battista, E.; Causa, F.; Netti, P. A.; Rega, N.
Fluorescence Lifetimes and Quantum Yields of Rhodamine Derivatives: New Insights from
Theory and Experiment. J. Phys. Chem. A 2012, 116, 7491-7497.
44. Pedone, A.; Bloino, J.; Monti, S.; Prampolini G.; Barone,V. Absorption and Emission
UV-Vis Spectra of the TRITC Fluorophore Molecule in Solution: A Quantum Mechanical
Study. Phys. Chem. Chem. Phys. 2010, 12, 1000-1006.
45. Setiawan, D.; Kazaryan, A.; Martoprawiro, M. A.; Filatov, M. A First Principles Study
of Fluorescence Quenching in Rhodamine B Dimers: How Can Quenching Occur in Dimeric
Species? Phys. Chem. Chem. Phys. 2010, 12, 11238-11244.
46. Guthmuller, J.; Champagne, B. Resonance Raman Scattering of Rhodamine 6G as
Calculated By Time-Dependent Density Functional Theory: Vibronic and Solvent Effects.
Chemphyschem 2008, 9, 1667-1669.
47. Lange A.; Herbert, J. M. Simple Methods to Reduce Charge-Transfer Contamination
in Time-Dependent Density-Functional Calculations of Clusters and Liquids. J. Chem. Theory
Comput. 2007, 3,1680-1690.
TOC Graphic
Visible and Ultraviolet Spectroscopy of Gas Phase Rhodamine
575 Cations.
Steven Dalya,b
, Alexander Kuleszaa, Geoffrey Knight
a,b, Luke MacAleese
a,b, Rodolphe
Antoinea,b
, Philippe Dugourda,b
*.
a Université de Lyon, F-69622, Lyon, France.
b CNRS et Université Lyon 1, UMR5306, Institut Lumière Matière.
Figure S1. Mass spectra following irradiation with a single laser pulse of wavelength 552.93 nm
(probe), 490 nm (pump) and both 552.93 and 490 nm simultaneously (pump + probe).
0
2
4
6
8
10
0
2
4
6
8
200 300 400 500 600
0
2
4
6
8
probe only, = 552.93 nm
pump only, = 490 nm
Re
lative
In
ten
sity (
x1
0)
pump+probe, = 490 nm + 552.93 nm
m/z
Figure S2. Fragmentation yield for pump only (black squares) and probe only (red circles)mass spectra
measured concurrently with the 2-colour experiments. The probe laser wavelengths lie in a range
where ground state R575 does not absorb, as evidenced by the flat profile for the fragmentation.
400 420 440 460 480 500 520 540 560 580 600
0
2
4
6
8
10
12
14
16F
rag
me
nta
tion
yie
ld
Wavelength / nm
pump only
probe only
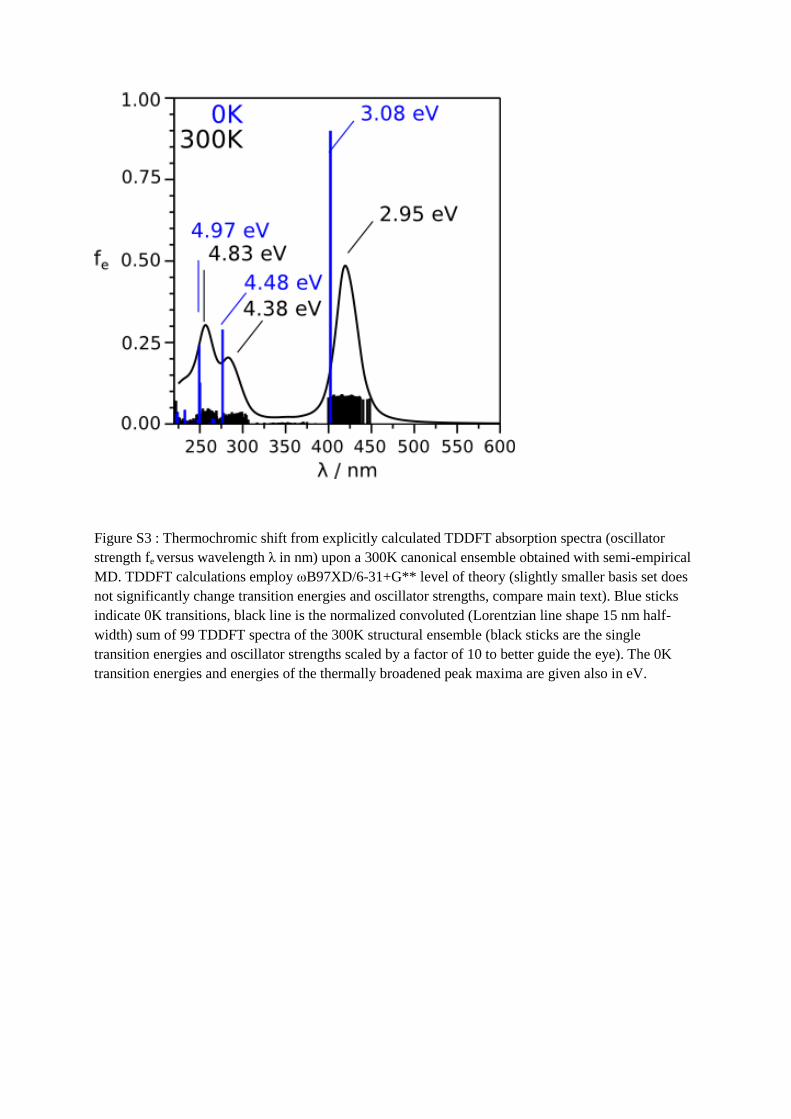
Figure S3 : Thermochromic shift from explicitly calculated TDDFT absorption spectra (oscillator
strength fe versus wavelength λ in nm) upon a 300K canonical ensemble obtained with semi-empirical
MD. TDDFT calculations employ ωB97XD/6-31+G** level of theory (slightly smaller basis set does
not significantly change transition energies and oscillator strengths, compare main text). Blue sticks
indicate 0K transitions, black line is the normalized convoluted (Lorentzian line shape 15 nm half-
width) sum of 99 TDDFT spectra of the 300K structural ensemble (black sticks are the single
transition energies and oscillator strengths scaled by a factor of 10 to better guide the eye). The 0K
transition energies and energies of the thermally broadened peak maxima are given also in eV.
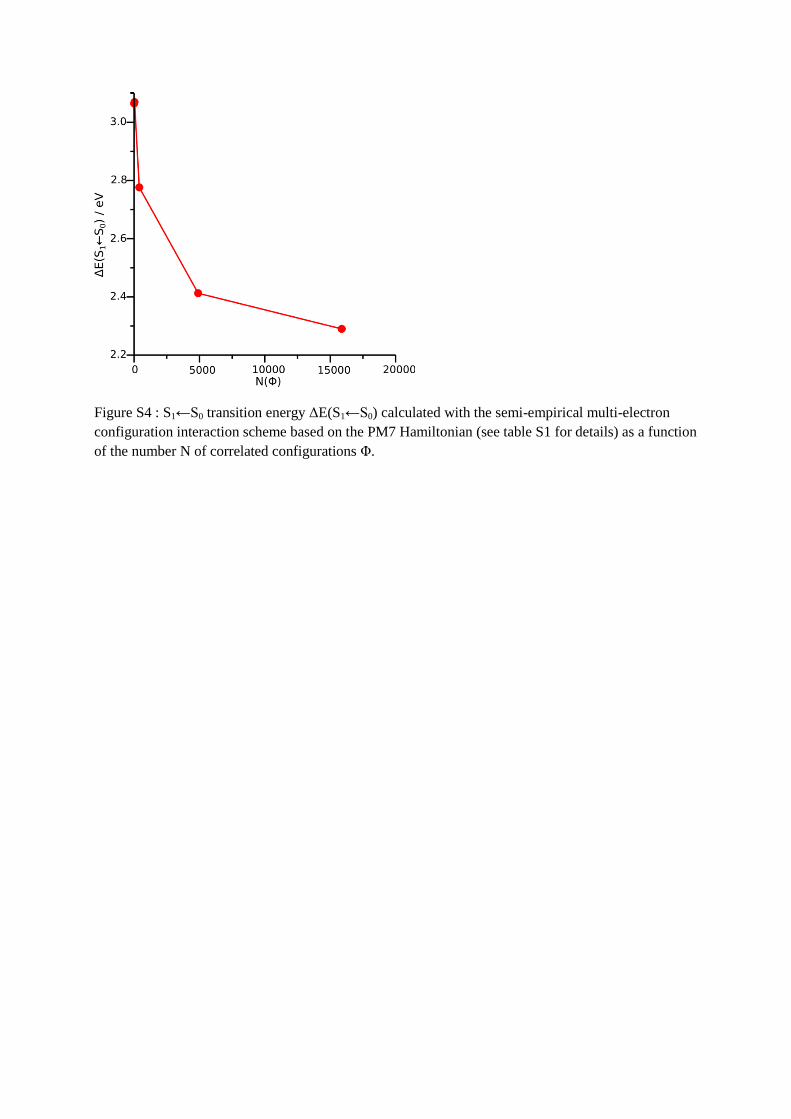
Figure S4 : S1←S0 transition energy ΔE(S1←S0) calculated with the semi-empirical multi-electron
configuration interaction scheme based on the PM7 Hamiltonian (see table S1 for details) as a function
of the number N of correlated configurations Φ.
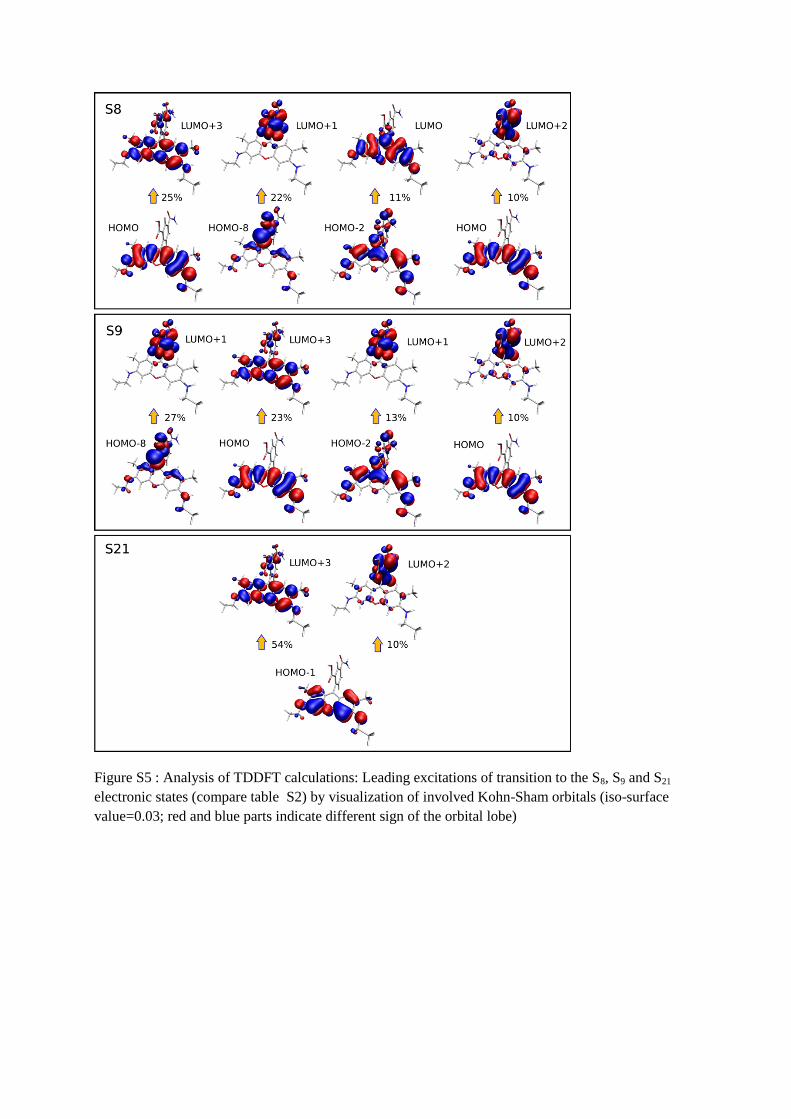
Figure S5 : Analysis of TDDFT calculations: Leading excitations of transition to the S8, S9 and S21
electronic states (compare table S2) by visualization of involved Kohn-Sham orbitals (iso-surface
value=0.03; red and blue parts indicate different sign of the orbital lobe)
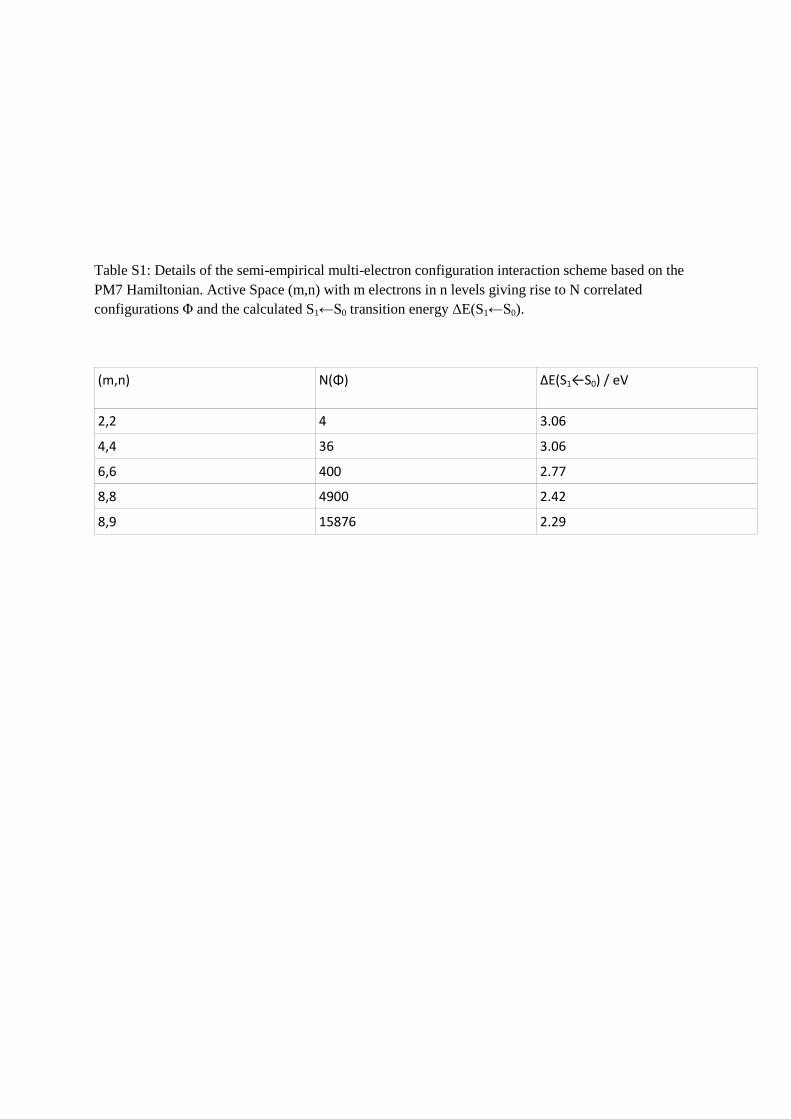
Table S1: Details of the semi-empirical multi-electron configuration interaction scheme based on the
PM7 Hamiltonian. Active Space (m,n) with m electrons in n levels giving rise to N correlated
configurations Φ and the calculated S1←S0 transition energy ΔE(S1←S0).
(m,n) N(Φ) ΔE(S1←S0) / eV
2,2 4 3.06
4,4 36 3.06
6,6 400 2.77
8,8 4900 2.42
8,9 15876 2.29
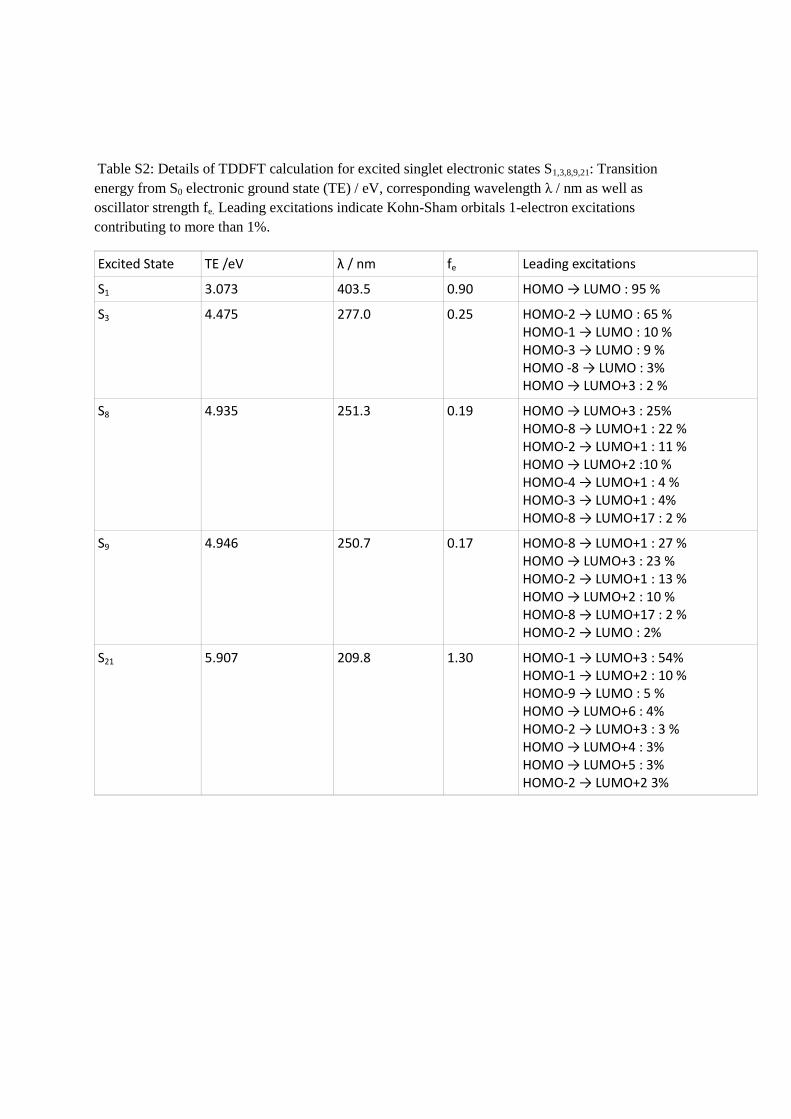
Table S2: Details of TDDFT calculation for excited singlet electronic states S1,3,8,9,21: Transition
energy from S0 electronic ground state (TE) / eV, corresponding wavelength λ / nm as well as
oscillator strength fe. Leading excitations indicate Kohn-Sham orbitals 1-electron excitations
contributing to more than 1%.
Excited State TE /eV λ / nm fe Leading excitations
S1 3.073 403.5 0.90 HOMO → LUMO : 95 %
S3 4.475 277.0 0.25 HOMO-2 → LUMO : 65 % HOMO-1 → LUMO : 10 % HOMO-3 → LUMO : 9 % HOMO -8 → LUMO : 3% HOMO → LUMO+3 : 2 %
S8 4.935 251.3 0.19 HOMO → LUMO+3 : 25% HOMO-8 → LUMO+1 : 22 % HOMO-2 → LUMO+1 : 11 % HOMO → LUMO+2 :10 % HOMO-4 → LUMO+1 : 4 % HOMO-3 → LUMO+1 : 4% HOMO-8 → LUMO+17 : 2 %
S9 4.946 250.7 0.17 HOMO-8 → LUMO+1 : 27 % HOMO → LUMO+3 : 23 % HOMO-2 → LUMO+1 : 13 % HOMO → LUMO+2 : 10 % HOMO-8 → LUMO+17 : 2 % HOMO-2 → LUMO : 2%
S21 5.907 209.8 1.30 HOMO-1 → LUMO+3 : 54% HOMO-1 → LUMO+2 : 10 % HOMO-9 → LUMO : 5 % HOMO → LUMO+6 : 4% HOMO-2 → LUMO+3 : 3 % HOMO → LUMO+4 : 3% HOMO → LUMO+5 : 3% HOMO-2 → LUMO+2 3%