Embed Size (px)
Citation preview
Asa ArjoonU6Chemistry
Presentation on
Visible and Ultraviolet Spectroscopy
Name :Form :
Subject :
What is Spectroscopy?
Spectroscopy is a type of chemical analysis done by shining light on a sample to determine what is inside.
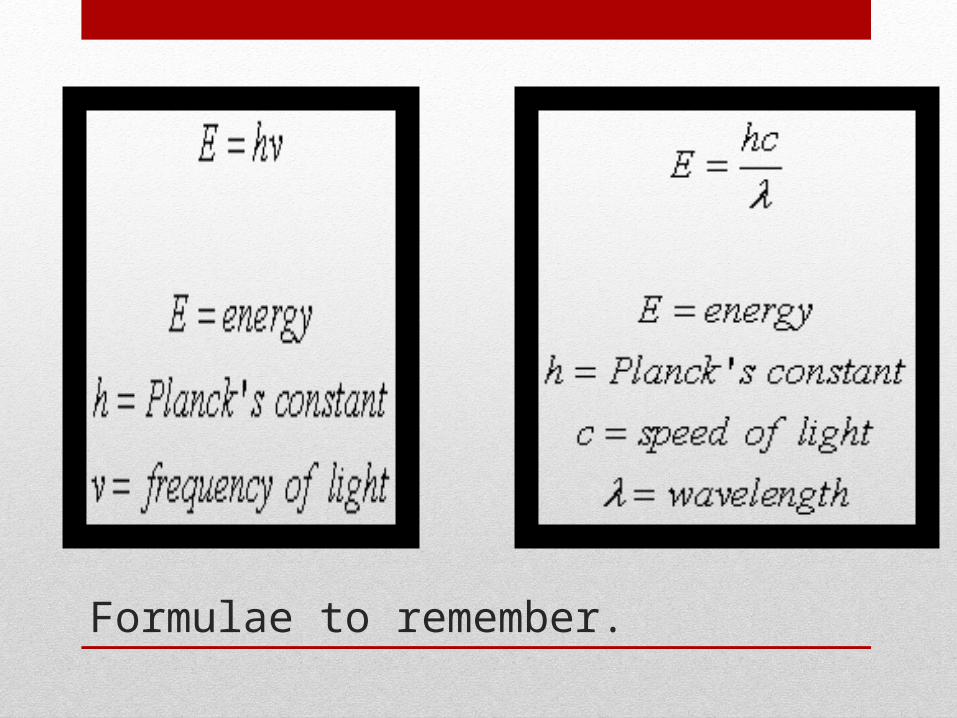
Formulae to remember.
In a chemical analysis, many different kinds (wavelengths or energies) of light (a spectrum) are shone through a sample.
By knowing what wavelengths of light are absorbed by the sample, we know what is inside.
If we are looking for a specific molecule or characteristic and shine the wrong wavelengths of light through a sample, no matter how much light we put through, we will never learn anything about the sample.
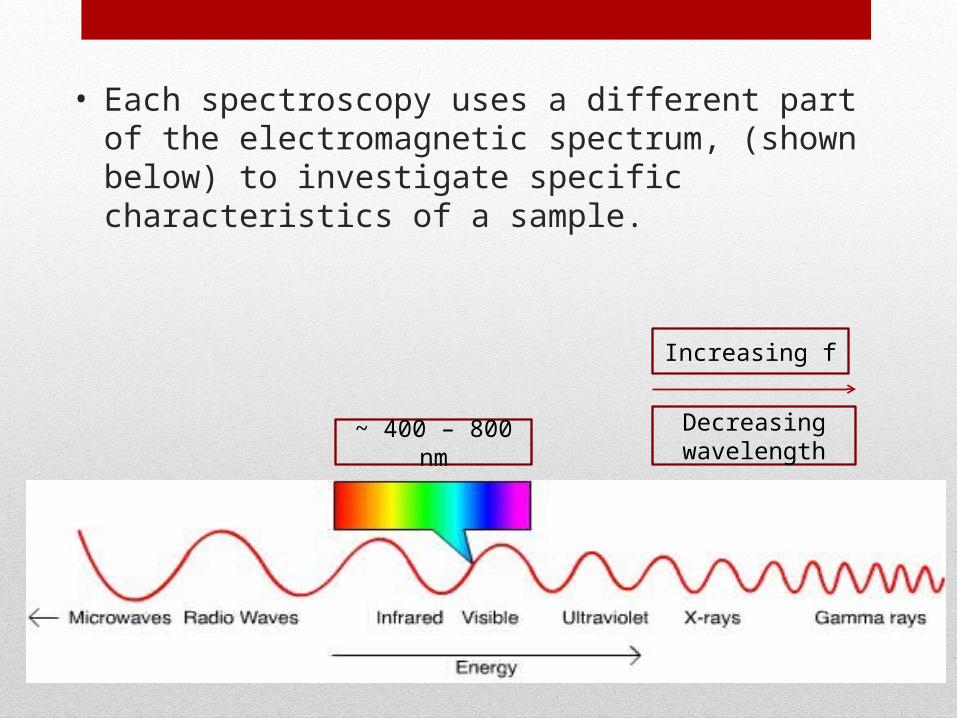
• Each spectroscopy uses a different part of the electromagnetic spectrum, (shown below) to investigate specific characteristics of a sample.
~ 400 – 800 nm
Increasing f
Decreasing wavelength
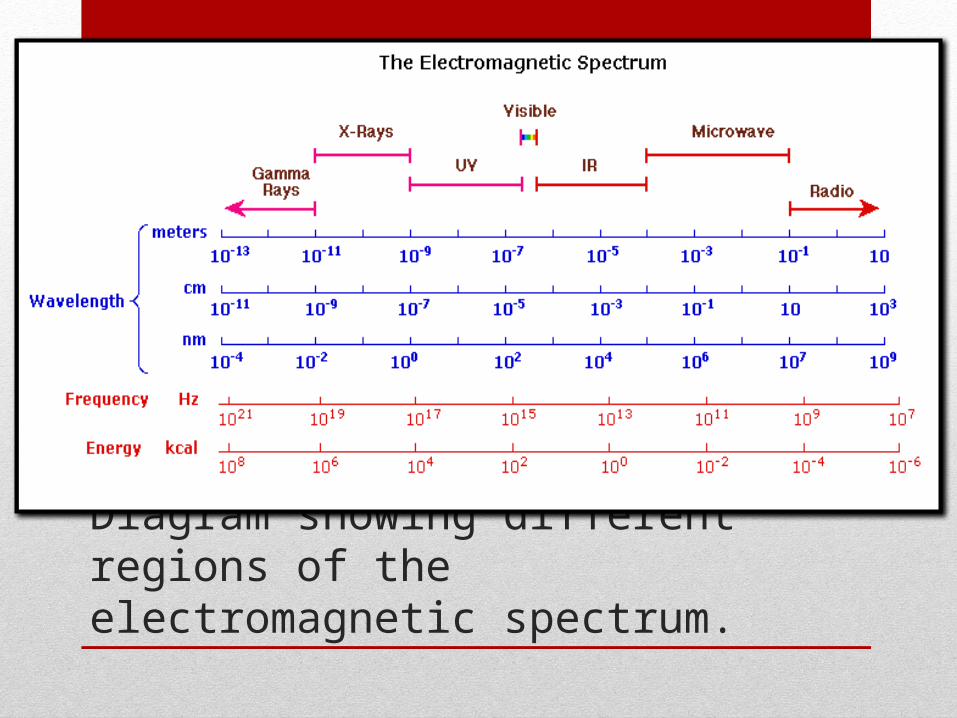
Diagram showing different regions of the electromagnetic spectrum.
Ultraviolet-visible spectroscopy refers to absorption spectroscopy or reflectance spectroscopy in the ultraviolet-visible region. This means it uses light in the visible and adjacent ranges.
An absorption spectrum occurs when light passes through a cold, dilute gas and atoms in the gas absorb at characteristic frequencies; since the re-emitted light is unlikely to be emitted in the same direction as the absorbed photon, this gives rise to dark lines (absence of light) in the spectrum.
The type of spectroscopy investigated in this presentation is
Visible and Ultraviolet Spectroscopy

When atoms combine to form molecules, the electrons in the atomic orbitals form molecular orbitals.
Electron waves can combine constructively (In-phase) or can combine destructively (Out-of-phase).
When they combine In-phase, a bonding orbital is formed.
When they combine Out-of-phase, an anti bonding orbital is formed.
When a sigma or a pi bond is formed, the anti-bonding orbital is formed along with the bonding orbital.
Anti-bonding pairs orbitals are given the symbols σ* and π*.
Atomic orbitals with lone pairs or non-bonding orbital are given the symbol n.
Absorption of energy can promote an electron from one of the filled σ, π or n orbital to an anti-bonding σ* or π* orbital.
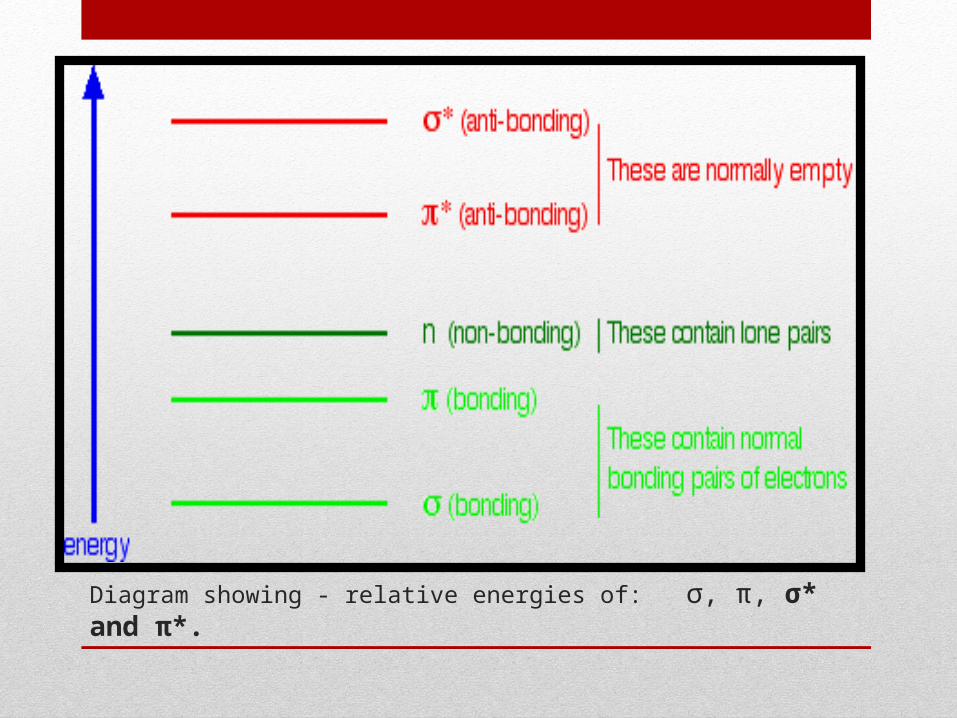
Diagram showing - relative energies of: σ, π, σ* and π*.
Origin of absorption in UV/VIS spectroscopy
Energy is absorbed by electrons.
These energy changes are quantised – only certain transitions can take place.
Absorption in the visible region of the spectrum explains why some compounds are coloured. The coloured range is 400nm to 800nm.
A transition to a higher energy level is accompanied by absorption of energy in the visible region of the spectrum.
Why would some species absorb light in the UV/VIS region
whereas others will not?
There are only some types of organic molecules that absorb in the ultraviolet-visible region of the spectrum.
The wavelengths at which an organic molecule absorbs depend on how tightly its electrons are bonded.
Electrons in unsaturated bonds and non-bonded pairs absorb in the ultraviolet-visible region because they are loosely held and are easily excited at these wavelengths.
Colour In Organic CompoundsIn most organic compounds, bonding and non-bonding orbitals contain electrons and the anti-bonding orbitals are empty.
The electronic transitions between these orbitals cause absorption in the visible region. The colours which are not absorbed reflected and are seen as the object’s colour.
All organic compounds absorb E.M.R and most absorb in the UV region, hence they are colourless.
Chromophore
• This is any functional group that absorbs E.M.R regardless of whether any colour is produced.
• To absorb in the UV/VIS region, the species must contain chromophores.
• Chromophores are usually unsaturated groups of atoms in organic compounds that absorb radiation mainly in the UV/VIS spectrum.

Some common chromophores are:C=CC=OCOOHOH
π π* n π* n σ* ONLY THESE produce absorption in the UV/VIS spectrumOther transitions require much more energy than UV/VIS can supply.
Absorption By Transition Metal Complexes
• Ions and molecules that possess lone pairs of electrons and donate them to transition elements are called ligands.
• Transition elements attract lone pair of electrons and accommodate them in empty 3d, 4s and 4p orbitals
• For isolated transition ions, 5d orbitals are the same energy level.
• When ligands approach the metal ion, they split into two energy levels.
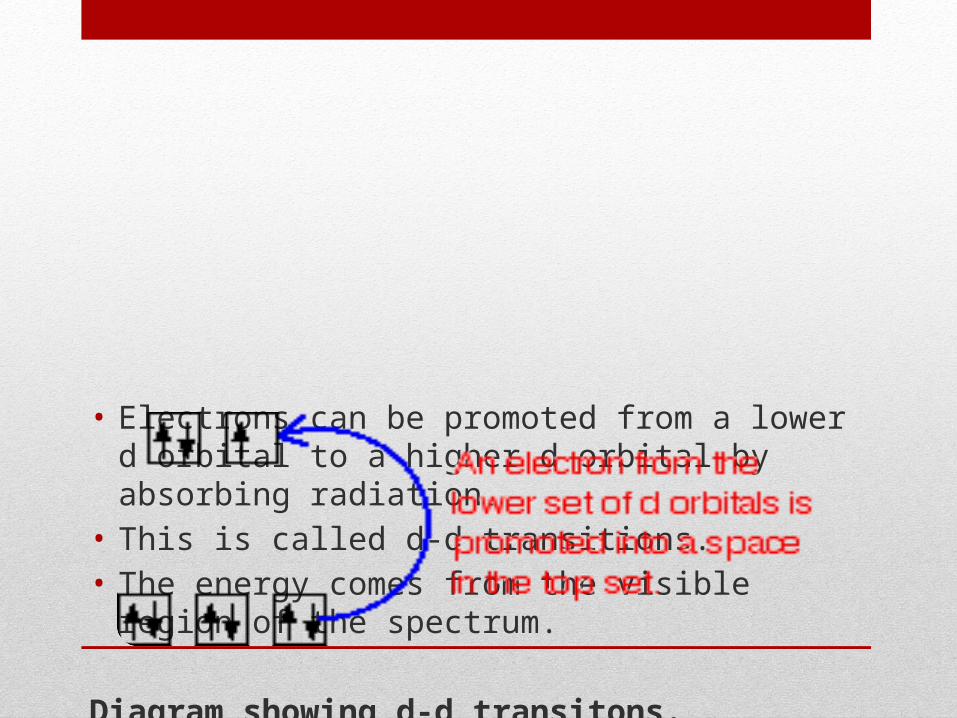
• Electrons can be promoted from a lower d orbital to a higher d orbital by absorbing radiation.
• This is called d-d transitions.• The energy comes from the visible region of the
spectrum.
Diagram showing d-d transitons.
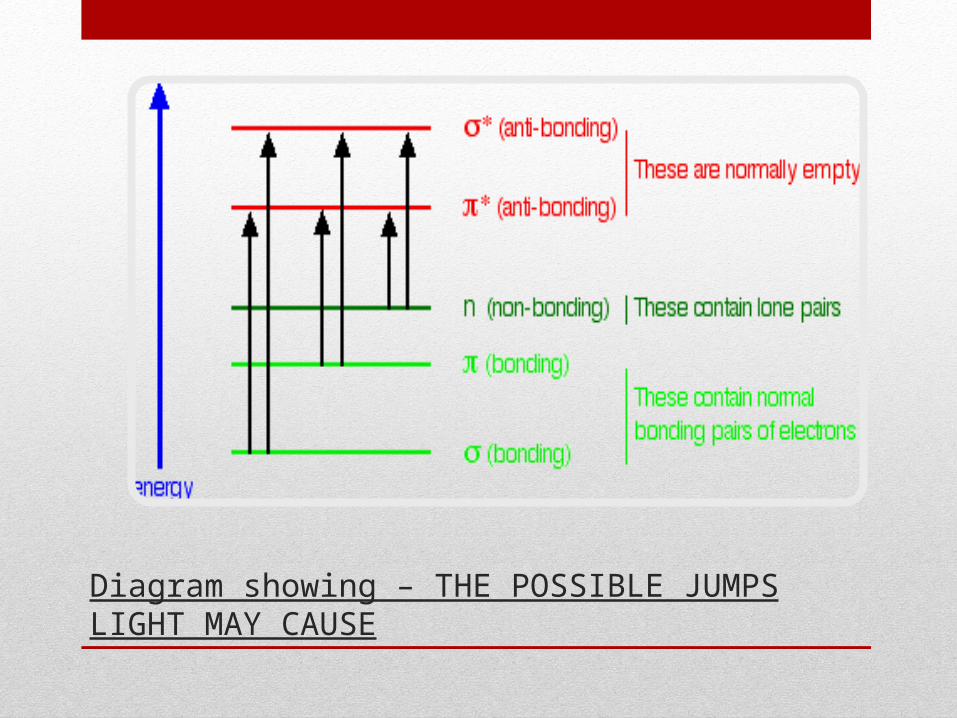
Diagram showing – THE POSSIBLE JUMPS LIGHT MAY CAUSE
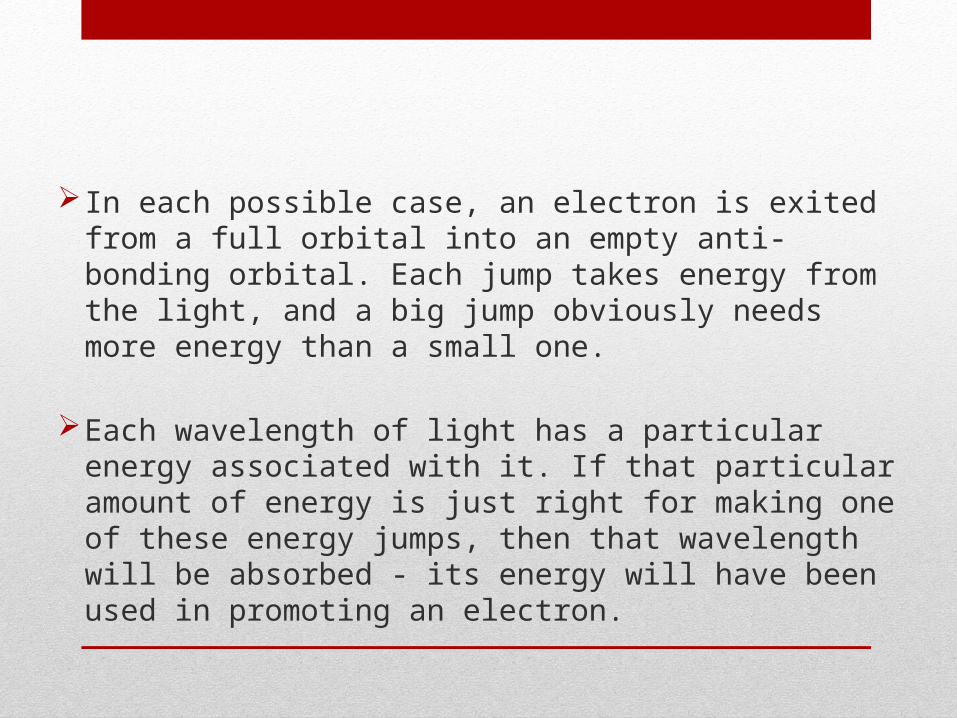
In each possible case, an electron is exited from a full orbital into an empty anti-bonding orbital. Each jump takes energy from the light, and a big jump obviously needs more energy than a small one.
Each wavelength of light has a particular energy associated with it. If that particular amount of energy is just right for making one of these energy jumps, then that wavelength will be absorbed - its energy will have been used in promoting an electron.
Beer’s Law
• The degree of absorption at a given wavelength of an absorbing compound in a non-absorbing solvent depends upon the concentration of the compound and upon the path length of the radiation.
NB: This law works well for relatively dilute solutions.
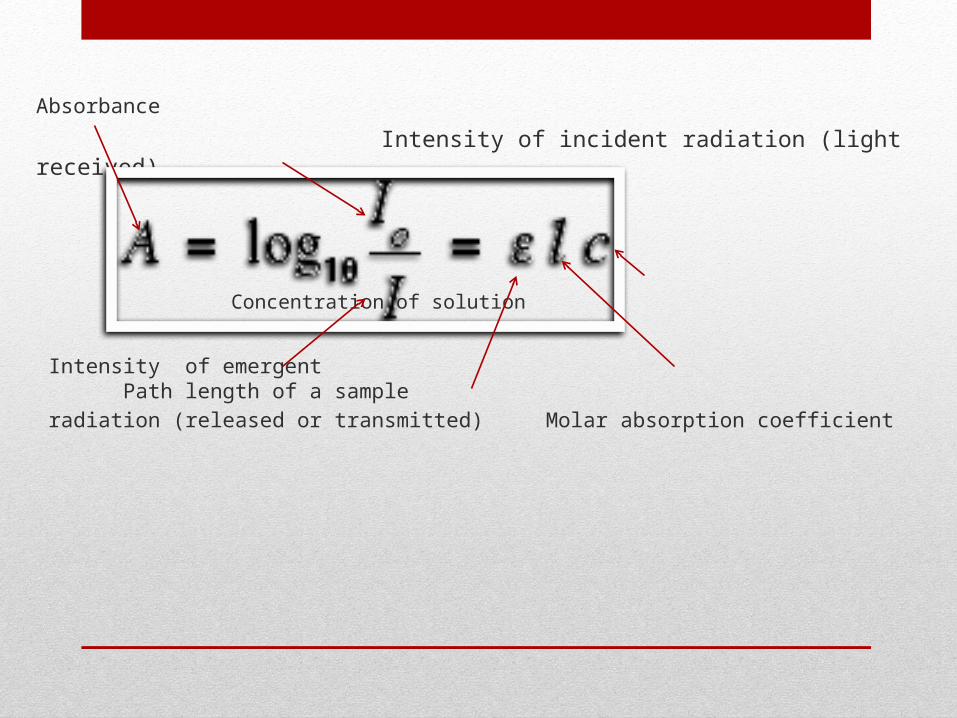
Absorbance
Intensity of incident radiation (light received)
Concentration of solution
Intensity of emergent Path length of a sample
radiation (released or transmitted) Molar absorption coefficient
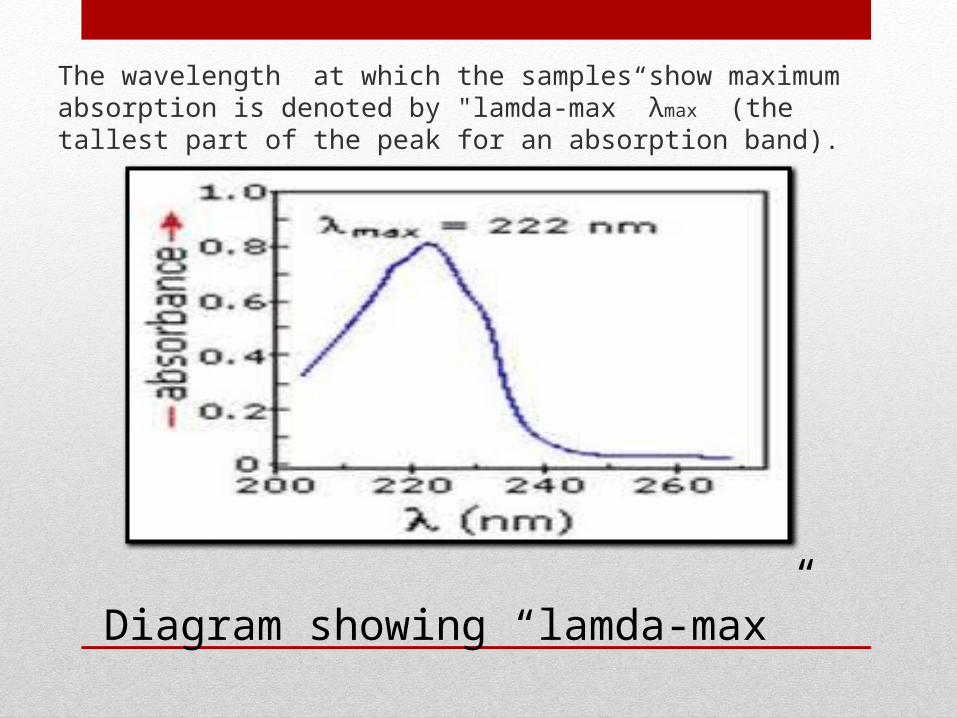
The wavelength at which the samples show maximum absorption is denoted by "lamda-max” λmax (the tallest part of the peak for an absorption band).
Diagram showing “lamda-max”
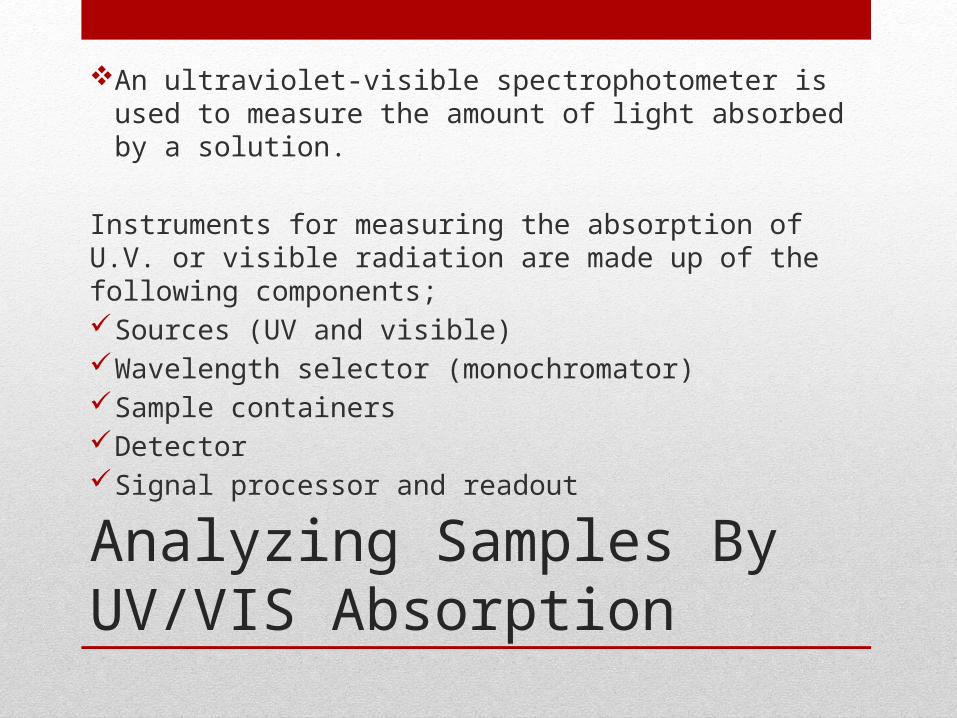
Analyzing Samples By UV/VIS Absorption
An ultraviolet-visible spectrophotometer is used to measure the amount of light absorbed by a solution.
Instruments for measuring the absorption of U.V. or visible radiation are made up of the following components;Sources (UV and visible) Wavelength selector (monochromator) Sample containers Detector Signal processor and readout
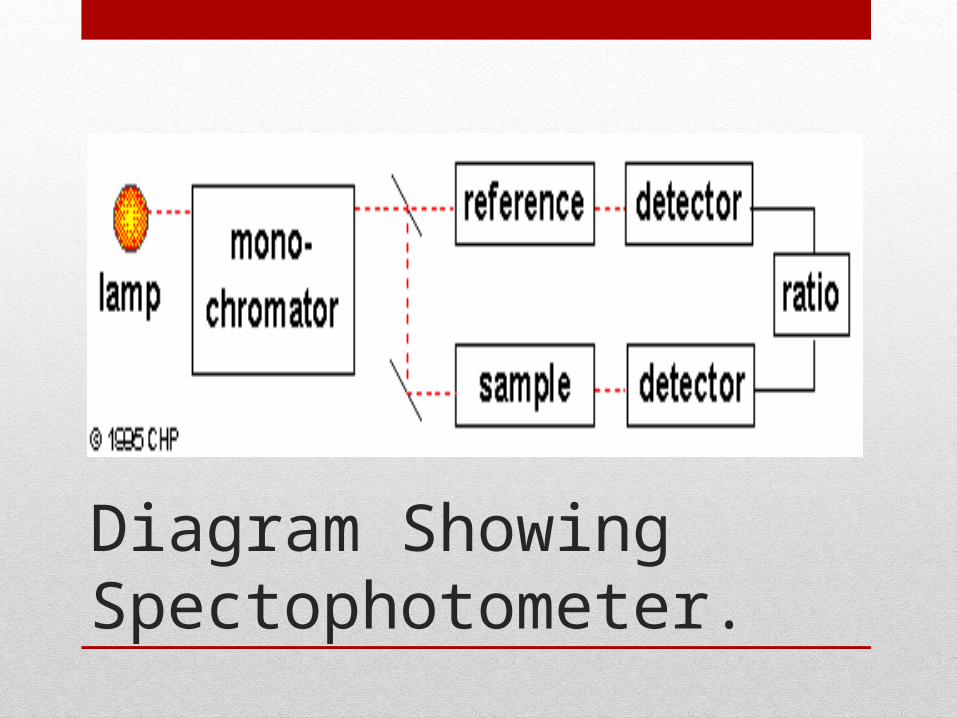
Diagram Showing Spectophotometer.
To find the concentration of an unknown sample, the instrument is first set at zero absorbance using a blank sample.
Then a series of standard solutions of known concentrations are prepared.
The absorbance of each solution and the unknown sample are then measured at a known maximum wavelength.
A graph of absorbance verses the know concentration of the serious of standards is plotted to generate a calibration curve.
The calibration cure is then used to determine the concentration of the unknown sample.