Embed Size (px)
Citation preview
Viscoelastic Properties of (Cellulose Oligo- Oxymethylene Ether) Acylates
TOSHIRO MOROOKA, MISATO NORIMOTO, and TADASHI YAMADA, Wood Research Institute, Kyoto University, Uji, Kyoto 611, Japan, and
NOBUO SHIRAISHI, Faculty of Agriculture, Kyoto University, Sakyo-ku, Kyoto 606, Japan
Synopsis
Four kinds of (cellulose oligo-oxymethylene ether) acylates from the acetate to the valerate were prepared by homogeneous reactions using a DMSO/PF cellulose solvent as the reaction medium. The temperature variations of dynamic modulus, loss modulus, and loss tangent for these polymers were measured. Three typea of relaxation process were observed for all (cellulose oligo-oxymethylene ether) acylates, and an additional relaxation process was d e w for (celldow oligo-oxymethylene ether) butyrate and valerate. These processes were labelled a. 8. y, and 6 in order of decreasing temperature at which they occurred. These a to 6 processes were respectively attributed to: micro-Brownian motion (a), motion of side chains (8). local mode motion involving oxymethylene groups (7). and motion initiated by three or more methylene groups (6).
INTRODUCTION
Johnson et d1 reported that cellulose is soluble in dimethyl sdfoxide (DMSO) in the presence of paraformaldehyde (PF). The mechanism by which cellulose dissolves in the DMSOPF mixture was shown to involve the formation of cel- lulose oligo-oxymethylene The homogeneous chemical modification of cellulose in the DMSOPF medium could open the field to the development of new cellulosic derivatives. For example, the acylation of methylol cellulose results in novel cellulosic polymers (cellulose oligo-oxymethylene ether) acylah. The physical properties of the resulting cellulose derivatives are expected to be quite different from the corresponding traditional cellulose derivatives: In the previous investigations, the thermal softening pkoperties of (cellulose oligo- oxymethylene ether) acetate were found to be conspicuously different from cellulose triacetate; the apparent melting temperature of the former is about 14OOC lower than the published melting point of cellulose a ~ e t a t e . ~ Also, the thermal softe&g of silyl cellulose was found to be considerably reduced by the introduction of oligo-oxymethylene in the side chain^.^
The present paper describes viscoelastic properties of four (cellulose oligo- oxymethylene ether) acylates from the acetate to the valerate. Preparation of the ,acylates using triethylamine (TEA) instead of pyridine resulted in pure and colorless products, which were used for our physical measurements.
Journal of Applied Polymer Science, Vol. 27,4409-4419 (1982) Q 1982 John Wiley & Sons, Inc. CCC OO21-8W5/82/114409- 11$02.10
4410 MOROOKA ET AL.
EXPERIMENTAL.
Materials
The cellulose used was Whatman cellulose powder CF-11. Paraformaldehyde (PF) was that for electron microscopy (98% content) from Nakarai Chemicals (specially prepared reagent, EMS-80). Dimethyl sulfoxide (DMSO) used as solvent, acetic anhydride, propionic anhydride, butyric anhydride, valeric an- hydride, and triethylamine (TEA) used as acylating agents were all guaranteed grade. Deionized water and reagent grade methanol were used as precipi- tants.
Preparation of (Cellulose Oligo-Oxymethylene Ether) Acylates
The method for the preparation of cellulose solution used in this investigation was essentially similar to that reported by Johnson et aL1 Dried cellulose powder (2 g) and paraformaldehyde (4 g) were well dispersed in dimethyl sulfoxide (50 mL) at room temperature. The mixture was then heated with rapid stirring to 12OOC over a period of about 20 min in a 100-mL Erlenmyer flask equipped with a condenser (a ground-glass jointed tube). After being held at this temperature for 3 h, the cellulose solution so obtained was cooled to room temperature. TEA (6 mol/mol glucose unit of cellulose) and one of a series of aliphatic anhydrides from acetic anhydride to valeric anhydride (6 mol/mol glucose) were added dropwise and simultaneously to the cooled cellulose solution with continuous stirring. After the addition, the reaction mixture was allowed to stand at room temperature for 5 h. The reaction mixture was then poured into precipitants. Cold water was used as precipitant for preparations of the acetate and propionate, cold methanol for the butyrate, and both cold methanol and water for the val- erate. The precipitates were filtered, and the crude product was repeatedly purified by the dissolution and precipitation technique. Samples are peracy- lated.
Measurement of Thermal Softening and Melting
A thermo-mechanical analyzer (Shinku Riko Co., Ltd., TM-1500) was used for measurements. A 25-mg powdered aliquot of each (cellulose oligo-oxy- methylene ether) acylate was compressed in a glass capillary by a plunger, 1.4 mm radius, which supported a weighk of 200 g. As the temperature was raised, the sample softened and the plunger moved downward. The deformation of the sample was measured automatically as a function of temperature. The mea- surements were conducted over a temperature range from 2OoC to 15OOC at a programmed heating rate of l"C/min.
Measurement of Dynamic Mechanical Properties
Dynamic mechanical properties for film specimens were measured with a direct reading viscoelastometer (Toyo Baldwin Co., Ltd., Rheovibron DDV-II-C). Complex modulus and loss tangent were measured in the temperature range from -190OC to 13OOC at four constant frequencies of 3.5,11,35, and 110 Hz. The programmed heating rate was l"C/min. The size of specimens was 0.2 11110. thick
(CELLULOSE OLIGO-OXYMETHYLENE ETHER) ACYLATES 4411
X 2 mm wide X 4 cm long for measurements in the temperature range from -190OC to 3OoC and 1 mm thick X 2 mm wide X 2 cm long in the range from 3OoC to 130OC.
Static Tensile Test
Static tensile tests for f h specimens (40 X 2 X 0.2 mm) were carried out in a conditioned room (2OoC, 65% RH) using an instron type testing instrument (Shinkoh Communication Industry Co., TOM-5000X). Elongation was applied to the specimen with a constant speed of 10 mm/min.
RESULTS AND DISCUSSION When the thermoplastic samples were heated under a constant load at a uni-
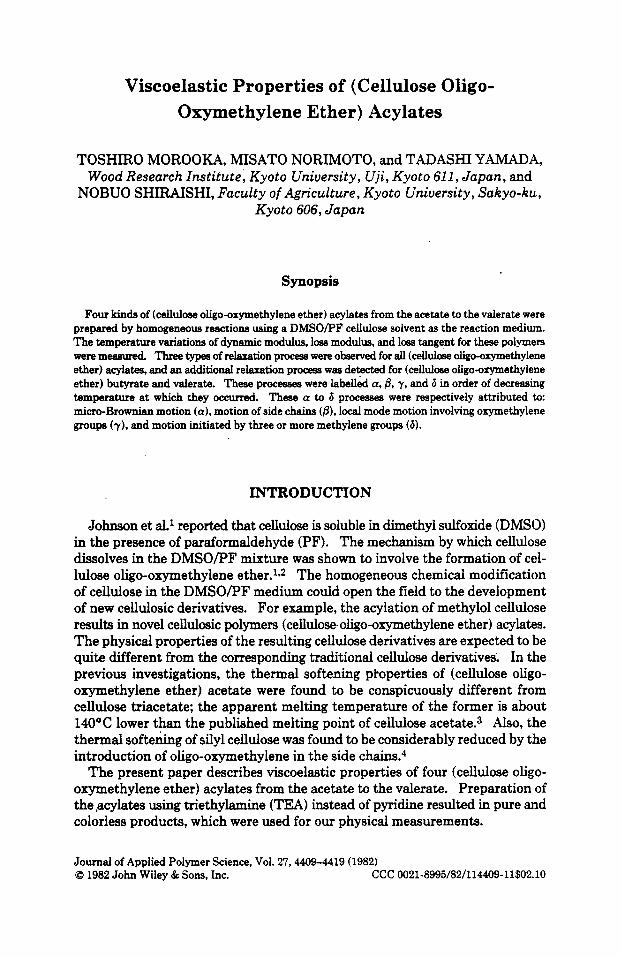
form rate, the deformation of the sample gradually increased. From the resulting thermal deformation diagram, information on physical transitions and melting can be derived. Figure 1 shows diagrams of thermal deformation (A) vs. tem- perature ( T ) for a series of (cellulose oligo-oxymethylene ether) acylates from acetate through valerate. In the diagrams the deformation A is normalized, i.e., A is zero at room temperature and unity at the temperature Tf at which the plunger reached the bottom of the glass capillary, indicating completion of liquid flow of the sample. The thermodiagrams exhibit two well-defined transition regions. The first region is considered to be due to the glass transition and thus the rapidly changing deformation can be ascribed to the short-range difhional motion of the segments along the polymer chain. In this region, the temperature T, is defined as a temperature corresponding to the dA/dT maximum. The temperature T, for the four kinds of (cellulose oligo-oxymethylene ether) acylates
0-
0-
4 0-
1.0
1.0
1.0
:" Fig. 1. Dependence of thermal deformation with temperature.
4412 MOROOKA ET AL.
were 83"C, 69"C, 65"C, and 49°C in order of increasing number of carbons (n) in introduced acyl groups. Apparently T, shifts to a lower temperature as n increases. T, is considered as a rough measure of the glass transition point Tg. On the other hand, the second region indicates an apparent state of liquid flow of the polymer chain. Judging from the X-ray diagrams for (cellulose oligo- oxymethylene ether) acylates, they are completely amorphous. In general, amorphous polymers do not have a well-defined melting point T,,,. Therefore, in this report, instead of T,, the temperature Tf is used as a measure of the melting temperature of samples.
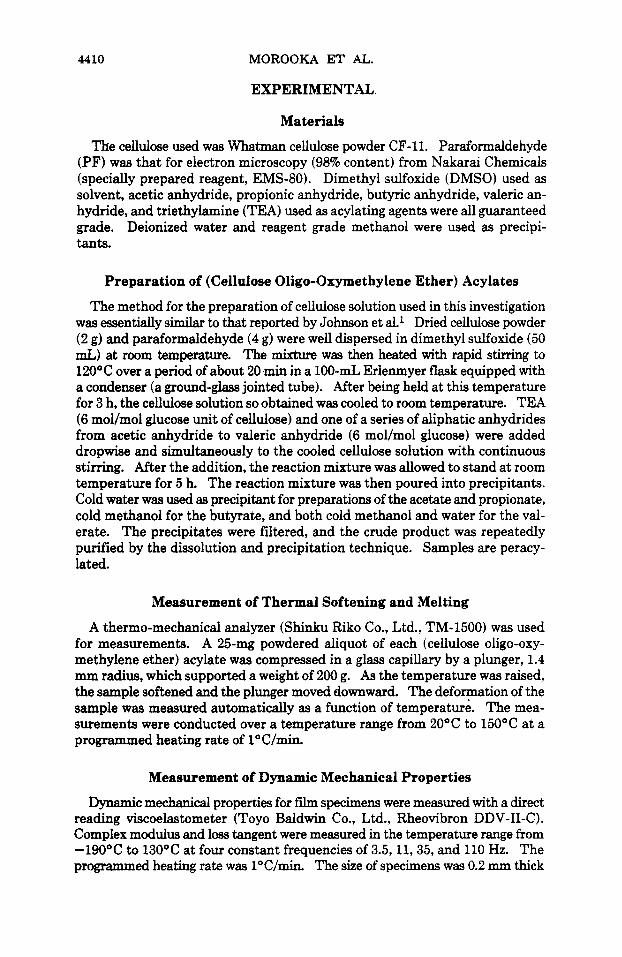
In Figure 2, the vdation of Tf with n for both cellulose acylates5 and (cellulose oligo-oxymethylene ether) acylates is shown. With increasing n up to 5, the value of Tf decreased slightly for (cellulose oligo-oxymethylene ether) acylates, but markedly for cellulose acylates. However, even if additional acyl methylene units were added in the formation of the higher homologs (n = 6 and higher), Tf re- mained fairly constant. It is of interest to note that the value of Tf for (cellulose oligo-oxymethylene ether) acetates (CAcOM), differs substantially from that for cellulose acetates (CAc): ca. 140°C lower for the former than for the latter. The reason for a considerable lowering of Tf for (cellulose oligo-oxymethylene ether) acylates compared to that for cellulose acylates can be ascribed to the introduction of an oligo-oxymethylene group in the side chain, resulting in a weakening of interchain cohesive force. In this connection, it can be noted that the value of Tf for CAcOM is similar to that of cellulose valerate, CVa. This result may be related to the fact that the contour length of the side chain for CAcOM has a magnitude of about 9 A, corresponding to that for CVa.
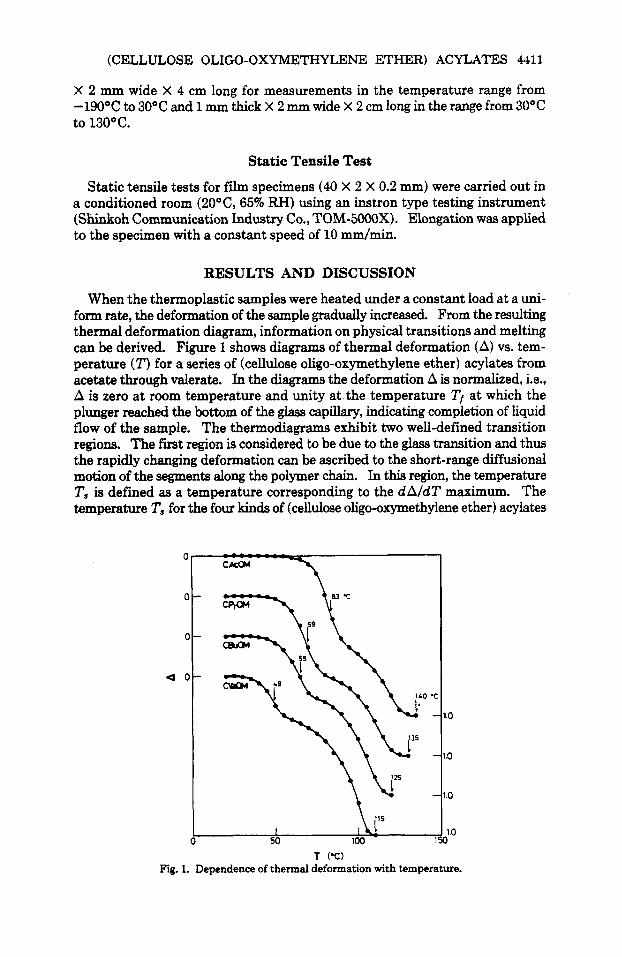
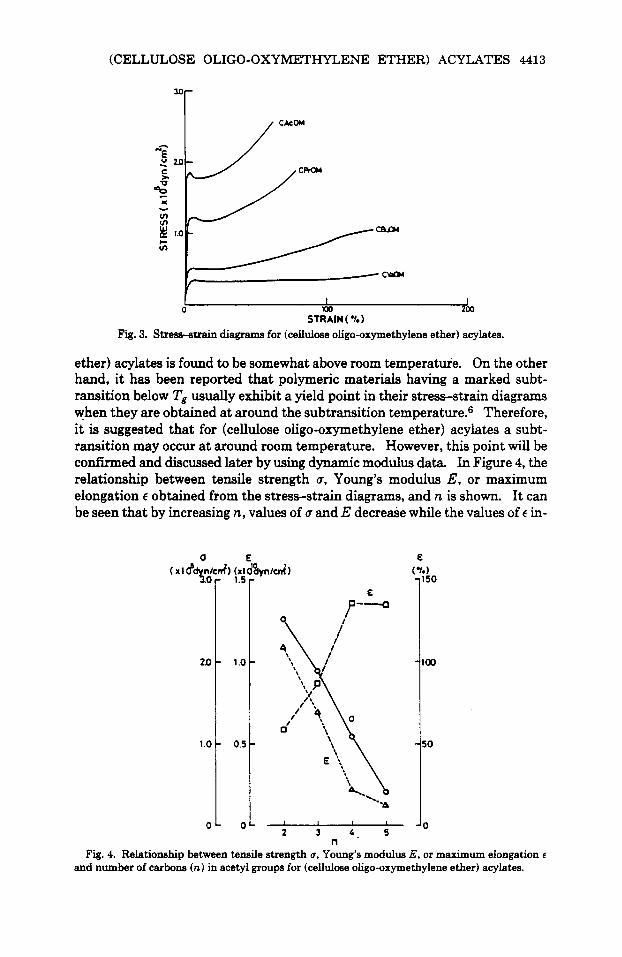
Figure 3 shows the stress-strain diagrams for (cellulose oligo-oxymethylene ether) acylates in tension measured at 2OoC and 65% RH. These diagrams are similar in shape and have a yield point. In general, a yield point is observed in the stress-strain diagrams obtained a t a temperature in the neigborhood of Tg of the sample. However, it is evident that Tg of (cellulose oligo-oxymethylene
0
0
A A 4 0
A O O 0 O O
0 0 0 0
0 1 I I I l I I I I I I t I I L I I l
2 4 6 8 10 12 14 16 18 n
Fig. 2. Dependence of T, with number of carbons (n) in acyl groups for (cellulose oligo-oxy- methylene ether) acylates (A) and cellulose acylates (0).
(CELLULOSE OLIGO-OXYMETHnENE ETHER) ACYLATES 4413
I I 0 100 00
STRAIN ( *L 1 Fig. 3. Stresa-strain diagrams for (cellulose oligo-oxymethylene ether) acylates.
ether) acylates is found to be somewhat above room temperatur'e. On the other hand, it has been reported that polymeric materials having a marked subt- ransition below Tg usually exhibit a yield point in their stress-strain diagrams when they are obtained at around the subtransition temperature.6 Therefore, it is suggested that for (cellulose oligo-oxymethylene ether) acyiates a subt- ransition may occur at around room temperature. However, this point will be confirmed and discussed later by using dynamic modulus data. In Figure 4, the relationship between tensile strength 6, Young's modulus E, or maximum elongation E obtained from the stress-strain diagrams, and n is shown. It can be seen that by increasing n, values of 6 arid E decrease while the values of E in-
20
1 .O
0
1 .a
0.5
a
E
I I I
2 3 4 . 5 n
E
Fig. 4. Relationship between tensile strength u, Young's modulus E, or maximum elongation e and number of carbons (n) in acetyl groups for (cellulose oligo-oxymethylene ether) acylates.
4414 MOROOKA ET AL.
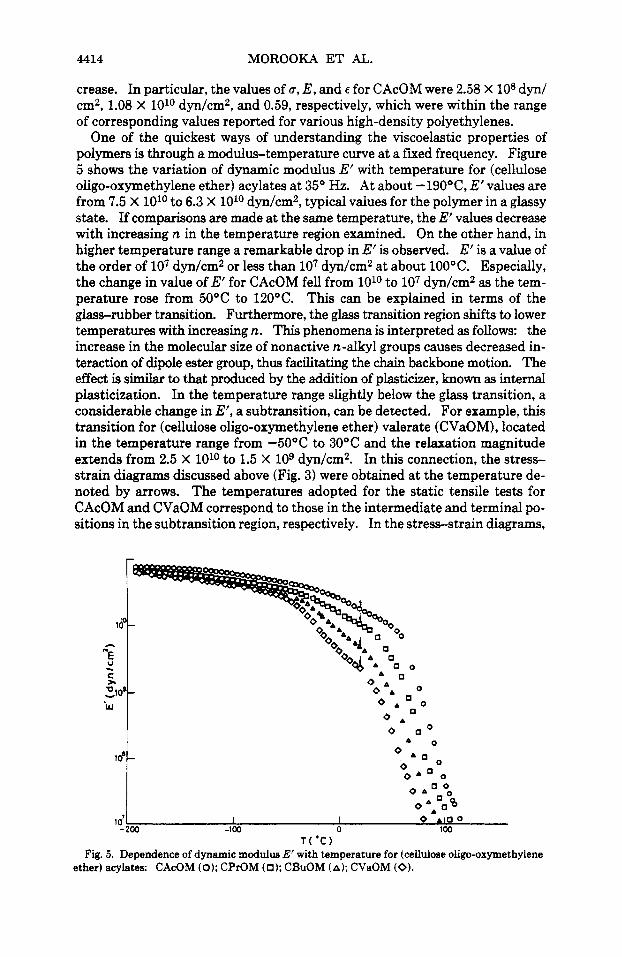
crease. In particular, the values of u, E , and e for CAcOM were 2.58 X lo8 dyn/ cm2, 1.08 X loLo dyn/cm2, and 0.59, respectively, which were within the range of corresponding values reported for various high-density polyethylenes.
One of the quickest ways of understanding the viscoelastic properties of polymers is through a modulus-temperature curve at a fmed frequency. Figure 5 shows the variation of dynamic modulus E' with temperature for (cellulose oligo-oxymethylene ether) acylates at 35" Hz. A t about -19O"C, E' values are from 7.5 X loLo to 6.3 X 1O1O dyn/cm2, typical values for the polymer in a glassy state. If comparisons are made at the same temperature, the E' values decrease with increasing n in the temperature region examined. On the other hand, in higher temperature range a remarkable drop in E' is observed. E' is a value of the order of lo7 dyn/cm2 or less than lo7 dyn/cm2 at about 100°C. Especially, the change in value of E' for CAcOM fell from 1Olo to lo7 dyn/cm2 as the tem- perature rose from 50°C to 120OC. This can be explained in terms of the glass-rubber transition. Furthermore, the glass transition region shifts to lower temperatures with increasing n. This phenomena is interpreted as follows: the increase in the molecular size of nonactive n-alkyl groups causes decreased in- teraction of dipole ester group, thus facilitating the chain backbone motion. The effect is similar to that produced by the addition of plasticizer, known as internal plasticization. In the temperature range slightly below the glass transition, a considerable change in E', a subtransition, can be detected. For example, this transition for (cellulose oligo-oxymethylene ether) valerate (CVaOM), located in the temperature range from -5OOC to 30°C and the relaxation magnitude extends from 2.5 X loLo to 1.5 X lo9 dyn/cm2. In this connection, the stress- strain diagrams discussed above (Fig. 3) were obtained at the temperature de- noted by arrows. The temperatures adopted for the static tensile tests for CAcOM and CVaOM correspond to those in the intermediate and terminal po- sitions in the subtransition region, respectively. In the stress-strain diagrams,
0 o o A .
-200 -100 0 100 f ( ' C )
Fig. 5. Dependence of dynamic modulus E' with temperature for (cellulose oligo-oxymethylene ether) acylates: CAcOM (0); CPrOM (0); CBuOM (A); CVaOM (0).
(CELLULOSE OLIGO-OXYMETHYLENE ETHER) ACYLATES 4415
cg
5 e
the former, CAcOM, gives a stress-strain diagram with a typical feature for hard and tough type of polymers and the latter, CVaOM, a typical feature for elas- tomeric materials.
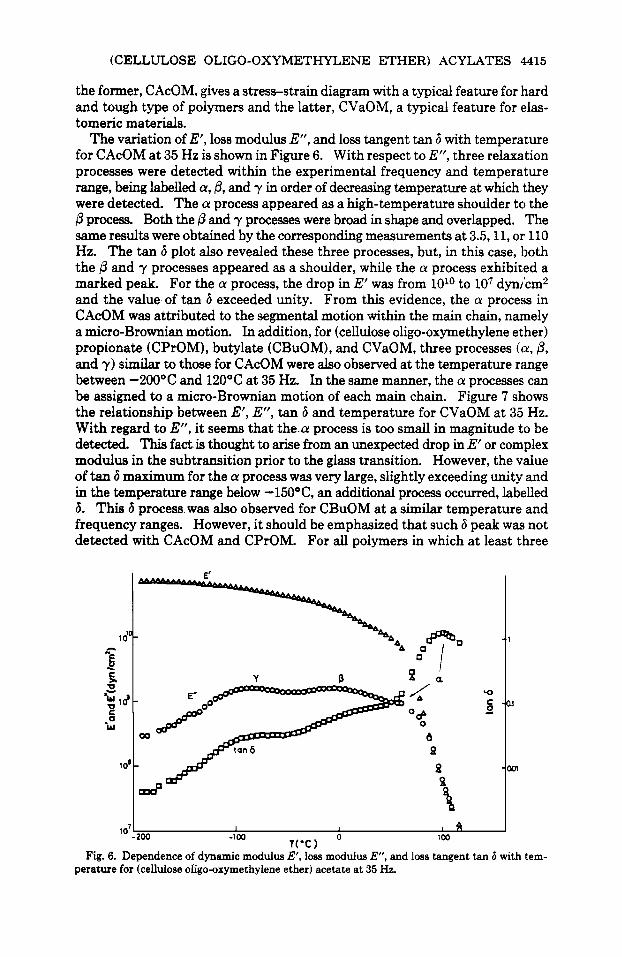
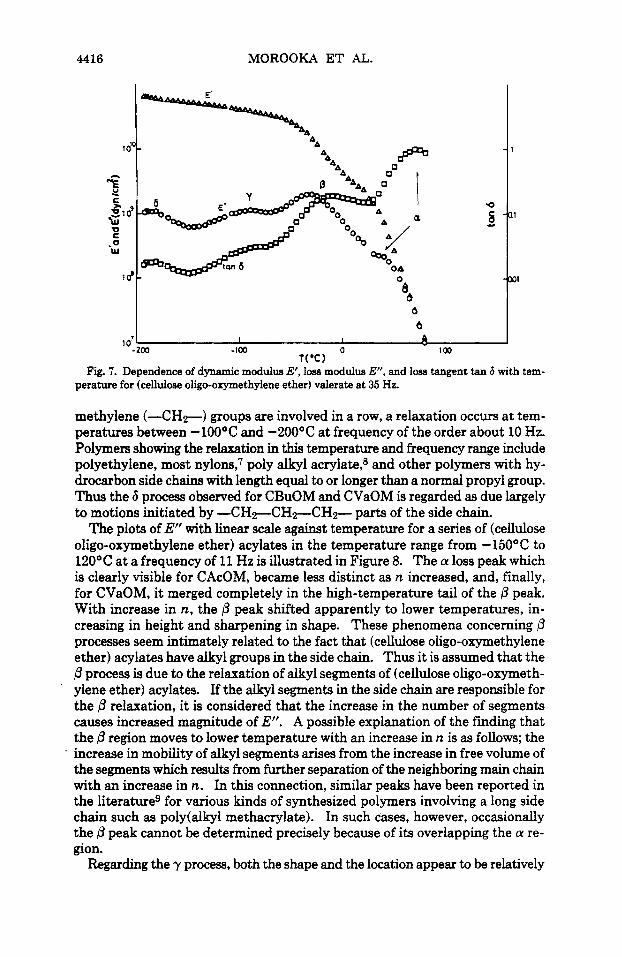
The variation of E', loss modulus E", and loss tangent tan 6 with temperature for CAcOM at 35 Hz is shown in Figure 6. With respect to E", three relaxation processes were detected within the experimental frequency and temperature range, being labelled a, 0, and y in order of decreasing temperature at which they were detected. The a process appeared as a high-temperature shoulder to the P process. Both the p and y processes were broad in shape and overlapped. The same results were obtained by the corresponding measurements at 3.5,11, or 110 Hz. The tan 6 plot also revealed these three processes, but, in this case, both the P and y processes appeared as a shoulder, while the a process exhibited a marked peak. For the a process, the drop in E' was from 1Olo to lo7 dyn/cm2 and the value of tan 6 exceeded unity. From this evidence, the a process in CAcOM was attributed to the segmental motion within the main chain, namely a micro-Brownian motion. In addition, for (cellulose oligo-oxymethylene ether) propionate (CPrOM), butylate (CBuOM), and CVaOM, three processes (a, P , and y) similar to those for CAcOM were also observed at the temperature range between -2OOOC and 120°C at 35 Hz. In the same manner, the a processes can be assigned to a micro-Brownian motion of each main chain. Figure 7 shows the relationship between E', E", tan 6 and temperature for CVaOM at 35 Hz. With regard to E", it seems that the.a process is too small in magnitude to be detected This fact is thought to arise from an unexpected drop in E' or complex modulus in the subtransition prior to the glass transition. However, the value of tan 6 maximum for the a process was very large, slightly exceeding unity and in the temperature range below -15O"C, an additional process occurred, labelled 6. This 6 process was also observed for CBuOM at a similar temperature and frequency ranges. However, it should be emphasized that such 6 peak w a not detected with CAcOM and CPrOM. For all polymers in which at least three
1
-01
-001
-A
107-200 N -1 00 T('C 1 0 100
Fig. 6. Dependence of dynamic modulus E', loss modulus E", and loss tangent tan 6 with tem- perature for (celldose ofigo-oxymethylene ether) acetate at 35 Hz.
4416 MOROOKA ET AL.
I _I
0
6 4 I
Fig. 7. Dependence of dynamic modulus E‘, loss modulus E“, and loss tangent tan 6 with tem- perature for (cellulose oligo-oxymethyiene ether) valerate at 35 Hz.
methylene (-CH?) groups are involved in a row, a relaxation occurs at tem- peratures between -100°C and -200°C at frequency of the order about 10 Hz. Polymers showing the relaxation in this temperature and frequency range include polyethylene, most nylons: poly alkyl acrylate,8 and other polymers with hy- drocarbon side chains with length equal to or longer than a normal propyl group. Thus the 6 process observed for CBuOM and CVaOM is regarded as due largely to motions initiated by - C H ~ C H ~ C H F parts of the side chain.
The plots of E” with linear scale against temperature for a series of (cellulose oligo-oxymethylene ether) acylates in the temperature range from -150°C to 120°C at a frequency of 11 Hz is illustrated in Figure 8. The a loss peak which is clearly visible for CAcOM, became less distinct as n increased, and, finally, for CVaOM, it merged completely in the high-temperature tail of the P peak. With increase in n, the ,i3 peak shifted apparently to lower temperatures, in- creasing in height and sharpening in shape. These phenomena concerning 0 processes seem intimately related to the fact that (cellulose oligo-oxymethylene ether) acylates have alkyl groups in the side chain. Thus it is assumed that the /3 process is due to the relaxation of alkyl segments of (cellulose oligo-oxymeth- ylene ether) acylates. If the alkyl segments in the side chain are responsible for the ,i3 relaxation, it is considered that the increase in the number of segments causes increased magnitude of E”. A possible explanation of the finding that the ,i3 region moves to lower temperature with an increase in n is as follows; the increase in mobility of alkyl segments arises from the increase in free volume of the segments which results from further separation of the neighboring main chain with an increase in n. In this connection, similar peaks have been reported in the literature9 for various kinds of synthesized polymers involving a long side chain such as poly(aky1 methacrylate). In such cases, however, occasionally the /3 peak cannot be determined precisely because of its overlapping the a re- gion.
Regarding the y process, both the shape and the location appear to be relatively
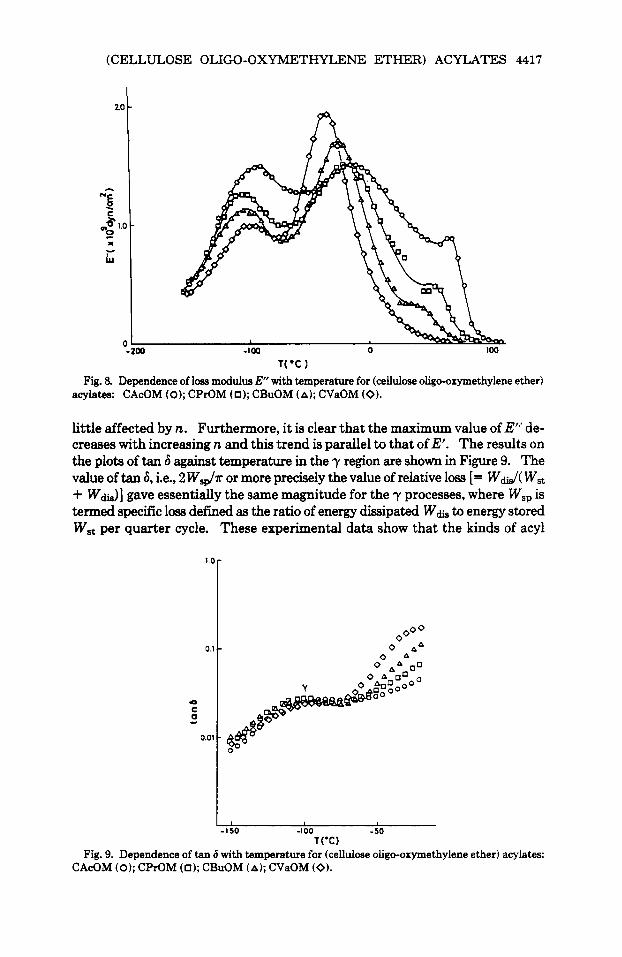
(CELLULOSE OLIGO-OXYMETHYLENE ETHER) ACYLATES 4417
0.1
e C 0 -
0.01
1°C 1 Fig. 8. Dependence of loss modulus E with temperature for (cellulose oligo-oxymethylene ether)
acylates: CAcOM (0); CPrOM (0); CBuOM (A); CVaOM (0).
-
-
little affected by n. Furthermore, it is clear that the maximum value of E’” de- creases with increasing n and this trend is parallel to that of E’. The results on the plots of tan 6 against temperature in the y region are shown in Figure 9. The value of tan 6, i.e., 2 Ws,,/r or more precisely the value of relative loss [= W d ( W,, + Wb)] gave essentially the same magnitude for the y processes, where W,, is termed specific loss defined as the ratio of energy dissipated W& to energy stored Wst per quarter cycle. These experimental data show that the kinds of acyl
0 0O0
0 A A
I [ 1
-150 -I 00 -50 T(’C)
Fig. 9. Dependence of tan 6 with temperature for (cellulose oligo-oxymethylene ether) acylates: CAcOM (0); CPrOM (0); CBuOM (A); CVaOM (0).
4.418 MOROOKA ET AL.
a P 57.L kCOl I mol 28.0 I Y
0 . 7
0
2.0 10 b.0 5.0 6.0 l-‘x lo’( OK-’ )
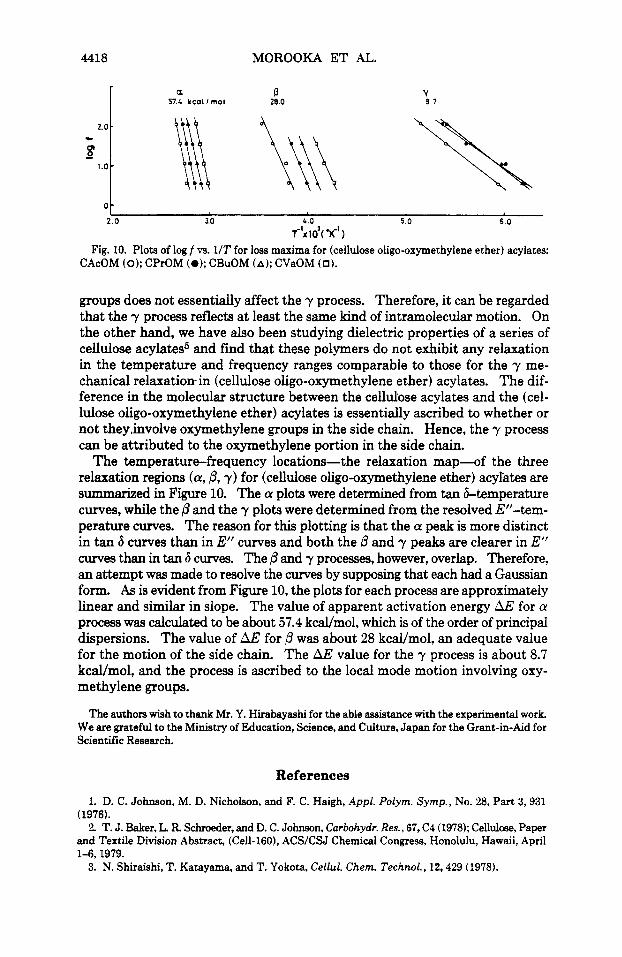
Fig. 10. Plots of log f vs. 1/T for loss maxima for (cellulose oligo-oxymethylene ether) acylates: CAcOM (0); CPrOM (0); CBuOM (A); CVaOM (0).
groups does not essentially affect the y process. Therefore, it can be regarded that the y process reflects at least the same kind of intramolecular motion. On the other hand, we have also been studying dielectric properties of a series of cellulose acylates5 and find that these polymers do not exhibit any relaxation in the temperature and frequency ranges comparable to those for the y me- chanical relaxation-in (cellulose oligo-oxymethylene ether) acylates. The dif- ference in the molecular structure between the cellulose acylates and the (cel- lulose oligo-oxymethylene ether) acylates is essentially ascribed to whether or not they.involve oxymethylene groups in the side chain. Hence, the y process can be attributed to the oxymethylene portion in the side chain.
The temperaturefrequency locations-the relaxation map-of the three relaxation regions (a, p, y) for (cellulose oiigo-oxymethylene ether) acylates are summarized in Figure 10. The a plots were determined from tan &temperature curves, while the /3 and the y plots were determined from the resolved E”-tem- perature curves. The reason for this plotting is that the a peak is more distinct in tan b curves than in E” curves and both the 0 and y peaks are clearer in E” curves than in tan 6 curves. The and y processes, however, overlap. Therefore, an attempt was made to resolve the curves by supposing that each had a Gaussian form. As is evident from Figure 10, the plots for each process are approximately linear and similar in slope. The value of apparent activation energy AE for a process was calculated to be about 57.4 kcal/mol, which is of the order of principal dispersions. The value of AE for 6 was about 28 kcal/mol, an adequate value for the motion of the side chain. The AE value for the y process is about 8.7 kcal/mol, and the process is ascribed to the local mode motion involving oxy- methylene groups.
The authors wish to thank Mr. Y. Hirabayashi for the able assistance with the experimental work. We are grateful to the Ministry of Education, Science, and Culture, Japan for the Grant-in-Aid for Scientific Research.
References
1. D. C. Johnson, M. D. Nicholson, and F. C. Haigh, A p p f . Polyrn. Syrnp., No. 28, Part 3,931 (1976). 2. T. J. Baker, L. R Schroeder, and D. C. Johnson, Carbohydr. Res., 67, C4 (1978); Cellulose, Paper
and Textile Division Abstract, (Cell-160), ACS/CSJ Chemical Congress, Honolulu, Hawaii, April 14,1979.
3. N. Shiraishi, T. Katayama, and T. Yokota, Ceflul. Chern. Technol., 12,429 (1978).
(CELLULOSE OLIGO-OXYMETHYLEIW ETHER) ACYLATES 4419
4. N. Shiraishi, Y. Miyagi, S. Yamashita, T. Yokota, and Y. Hayashi, Semi Gakkaishi, 35, T-466
5. Y. Hirabayashi, M. Norimoto, T. Aoki, T. Yamada, and N. Shiraishi, Abstracts of Papers
6. L. E. Nielsen, Mechanical Properties of Polymers and Composites, Marcel Dekker, New York,
7. A. H. Willbourn, Tram. Faraday Soc., 54,717 (1958). 8. E. A. W. Hoff, D. W. Robinson, and A. H. Willbourn, J. Polyrn. Sci.. 18,161 (1955). 9. J. D. Ferry, W. C. Child, R Zand, D. M. Stem, M. L. Williams, and R. F. Landel, J. Colloid Sci.,
(1979).
Presented a t 29th National Meeting, Japan Wood Research Society, Sapporo, 1979, p. 290.
1974.
12,53 (1957).
Received August 31,1981 Accepted June 8,1982