Embed Size (px)
DESCRIPTION
Home Sales Report July 2013
Citation preview
VIRGINIA Home SAleS RepoRt se
cond
Qu
arte
r
2011
Published by Virginia association of reaLtors®, the advocate for real estate professionals and property owners in Virginia.
VIRGINIA Home SAleS RepoRt se
cond
Qu
arte
r
2011
Published by Virginia association of reaLtors®, the advocate for real estate professionals and property owners in Virginia.
VIRGINIA Home SAleS RepoRt se
cond
Qu
arte
r
2011
Published by Virginia association of reaLtors®, the advocate for real estate professionals and property owners in Virginia.
JU
LY
2013
Analysis by the Virginia Center for Housing Research at Virginia Tech

July 2013Virginia Monthly Home Sales Report
Page 2Published by the Virginia Association of REALTORS®
Analysis by the Virginia Center for Housing Research at Virginia Tech
5,068
9,064
9,740
8,6649,026
7,212 7,258 7,403
6,910
5,5055,896
7,417
5,508
10,38610,664
10,071
0
2,000
4,000
6,000
8,000
10,000
12,000
Apr-12 May-12 Jun-12 Jul-12 Aug-12 Sep-12 Oct-12 Nov-12 Dec-12(p)
Jan-13(p)
Feb-13(p)
Mar-13(p)
Apr-13(p)
May-13(p)
Jun-13(p)
Jul-13(p)
Virginia's Monthly Pace of Residential SalesSingle Family, Townhomes, Condos
The pace of Virginia home sales decreased slightly from June to July, but maintained a strong year-over-year increase of 16.24%. Virginia experienced a more substantial drop in sales in July 2012, but recovered some in August. This year we hope to see sales remain relatively steady as the summer ends and we move into fall.
+16.2%
(p) indicates that this month’s numbers are preliminary. The numbers may change slightly as more data is reported.

July 2013Virginia Monthly Home Sales Report
Page 3Published by the Virginia Association of REALTORS®
Analysis by the Virginia Center for Housing Research at Virginia Tech
$245
,000
$241
,100
$240
,000
$224
,000
$215
,000
$220
,000
$225
,000
$205
,000
$210
,900 $2
25,0
00 $239
,000
$250
,000
$258
,000
$257
,241
$248
,000
$240
,000
$235
,000 $2
48,0
00
$242
,529
$225
,000
$230
,000
$240
,190
$250
,000 $2
67,0
00 $284
,050
$273
,500
$100,000
$150,000
$200,000
$250,000
$300,000
Med
ian
Sale
s Pr
ice
Virginia Median Residential Sales PriceSingle Family Homes, Townhomes, Condos
The median sales price decreased sharply this July compared to July 2011 and July 2012. Nonetheless, July sales prices are significantly higher than they were in 2011 and 2012. The median sales price in July 2013 ($273,500) marks a 6% increase from one year earlier ($257,241) and a 13% increase from two years ago. This overall growth in price trends is further evidence of recovery.
+6%
+13%
(p) indicates that this month’s numbers are preliminary. The numbers may change slightly as more data is reported.
July 2013Virginia Monthly Home Sales Report
Page 4Published by the Virginia Association of REALTORS®
Analysis by the Virginia Center for Housing Research at Virginia Tech
1,317
2,804
3,117
2,7232,802
2,1592,087
2,269
2,087
1,5331,675
2,259
1,531
3,443
3,659
3,349
0
500
1,000
1,500
2,000
2,500
3,000
3,500
4,000
Apr-12 May-12 Jun-12 Jul-12 Aug-12 Sep-12 Oct-12 Nov-12 Dec-12(p)
Jan-13(p)
Feb-13(p)
Mar-13(p)
Apr-13(p)
May-13(p)
Jun-13(p)
Jul-13(p)
Mill
ions
of D
olla
rs o
f Res
iden
tial S
ales
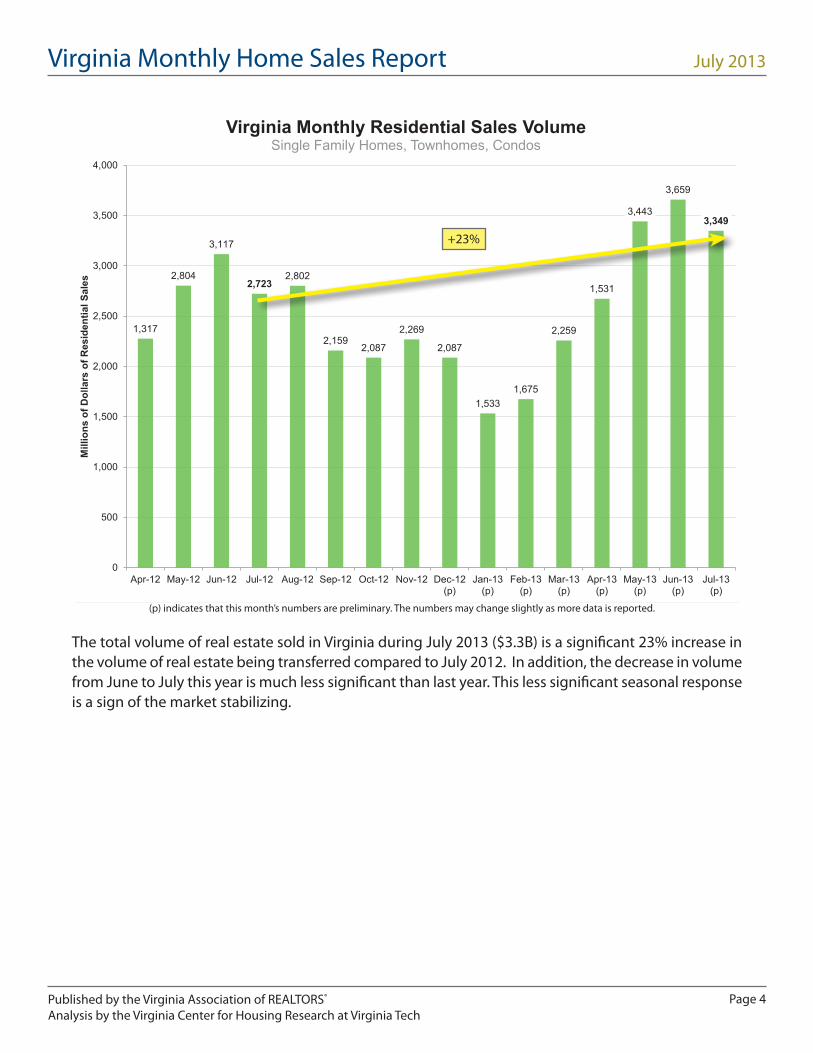
Virginia Monthly Residential Sales VolumeSingle Family Homes, Townhomes, Condos
The total volume of real estate sold in Virginia during July 2013 ($3.3B) is a significant 23% increase in the volume of real estate being transferred compared to July 2012. In addition, the decrease in volume from June to July this year is much less significant than last year. This less significant seasonal response is a sign of the market stabilizing.
+23%
(p) indicates that this month’s numbers are preliminary. The numbers may change slightly as more data is reported.

July 2013Virginia Monthly Home Sales Report
Page 5Published by the Virginia Association of REALTORS®
Analysis by the Virginia Center for Housing Research at Virginia Tech
88 8992
97 99 101 101106
103 102
91
8480 81 83
88 8986
9093 94
85
7772
6467
0
20
40
60
80
100
120
Aver
age
Day
s O
n M
arke
t
Virginia Average Days On MarketSingle Family Homes, Townhomes, Condos
Virginia homes continue to sell faster than they have in 7 years. Virginia experienced a 17% decline in this metric over the past year, even though houses remained on the market an average of three days longer compared to last month. The year-over-year declines shown in the graph are evidence of the strengthening housing market.
-9%
-17%
(p) indicates that this month’s numbers are preliminary. The numbers may change slightly as more data is reported.

July 2013Virginia Monthly Home Sales Report
Page 6Published by the Virginia Association of REALTORS®
Analysis by the Virginia Center for Housing Research at Virginia Tech
6.6%
6.6%
6.6%
6.5%
6.3%
6.2%
6.0%
5.9%
5.9%
5.9%
5.9% 6.0%
6.0%
5.9%
5.9%
5.8%
5.7%
5.6%
5.6%
5.6%
5.3%
5.2% 5.3% 5.5% 5.7%
4%5%5%6%6%7%7%8%8%9%9%
Jul-11 Oct-11 Jan-12 Apr-12 Jul-12 Oct-12 Jan-13 Apr-13 Jul-13 (p)
Virginia Unemployment RateSource: Bureau of Labor & Statistics
Virginia’s unemployment rate has risen steadily through the summer, but does not seem to have had a significant effect on the housing market. If the rate continues to increase into the fall, it will be hard to discern its effect on the market, as it is typical to see the market slow as we approach winter.
3.55% 3.60%3.47%
3.38% 3.35% 3.35% 3.41%3.53% 3.57%
3.45%3.54%
4.07%
4.37%
3.0%
3.2%
3.4%
3.6%
3.8%
4.0%
4.2%
4.4%
4.6%
Jul-12 Aug-12 Sep-12 Oct-12 Nov-12 Dec-12 Jan-13 Feb-13 Mar-13 Apr-13 May-13 Jun-13 Jul-13
Average 30-Year Mortgage Interest RatesSource: FreddieMac
Average 30-year fixed mortgage interest rates rose 0.3 percentage points in July, but this increase did not seem to affect the Virginia housing market as volume remained relatively steady. This increase in interest rate may partially explain the relatively sharp drop in price. Buyers may be looking to make up for the higher interest rate by paying a lower price. In general, interest rates remain historically low.
(p) indicates that this month’s numbers are preliminary. The rate is subject possible change and finalization by the Bureau of Labor Statistics.

July 2013Virginia Monthly Home Sales Report
Page 7Published by the Virginia Association of REALTORS®
Analysis by the Virginia Center for Housing Research at Virginia Tech
The Virginia Association of REALTORS® (VAR) is the business advocate for real estate professionals in Virginia. VAR represents more than 28,000 REALTORS® active in all phases of real estate brokerage, management, development and appraisal. Our mission is to enhance our membership’s ability to achieve business success.
All inquiries regarding this report should be directed to:
Stacey Ricks, Director of Public RelationsVirginia Association of REALTORS®10231 Telegraph Road, Glen Allen, VA 23059(804) 249-5716 [email protected]/HomeSales
Information sourced from multiple listing services across the state with data compiled by RE Stats Inc.All information is deemed reliable but is not guaranteed. Figures might not match those reported elsewhere.