Embed Size (px)
Citation preview


2
03
08
19
30
Overview
Balance Sheet Update
Financial Results
Outlook
Q&A

33
Chief Executive Officer
DAVID DUFFY
Overview

4
Pioneering
Growth
Discipline &
Sustainability
Challenging backdropTo disrupt the status quo
Making you happier about money
Our strategic ambition:
Our Purpose:
Re-prioritising as we adapt to the environment
Delighted
Customers &
Colleagues
Super
Straightforward
Efficiency
• Targeted cost reductions and building a scalable platform
• Underpins future returns and capital generation
• Building digital capability, new features and partnerships
• Launching innovative apps and seamless API architecture
• Delivering our commitments to all of our stakeholders
• Prudent risk appetite
• Optimising our capital base over time
• Delivering a platform for future growth
• Preparing for an improved environment
Priority
COVID-19
Uncertain
macro
Ongoing sector
pressures
Challenging
UK income
environment
Brexit
We are responding to the challenging environment

5
Customers
Supporting our Customers, Colleagues & Communities
Colleagues Communities• c.6k colleagues fully enabled to work
from home until next year
• c.95% of the branch network remained
open
• Enhanced remote working capability
and colleague wellbeing support
• Improved colleague engagement
• c.67k Mortgages payment holidays
• c.58k Personal payment holidays
• c.30k Businesses supported with
lending facilities; c.£1.2bn of
Government-supported lending
• Leading support to overdraft borrowers
• Proactive advice for Businesses
• Virgin Money Virtual Marathon event
• VM Foundation pledged £1.5m to
local charities
• VMG supported c.£100m of donations;
platform fee initially waived
• c.50k customers supported through
Salary Finance partnership

6
Building the platform for the new Virgin Money in 2020
Integrating, transforming and
simplifying our business
✓ Launched Virgin Money & M current accounts
✓ ‘Outstanding’ five star rated current account3
✓ Launched Virgin Home Buying Coach app
✓ VM branded Personal Loans now live
✓ Launched innovative Brighter Money Bundle
✓ Restarted re-branding activity, after COVID-
19 pause; 37 stores already complete2
✓ Introduced “Money on your Mind?” service
✓ VM socially-distanced concert sponsorship,
aligned to our Virgin music heritage
✓ Transforming our channels; increased
digital adoption & sales across all
Personal products
✓ Strengthened digital customer satisfaction
✓ c.60% higher digital chat volumes1
1Compared to October 2019 2 At 13th November 3As rated by Moneyfacts
Continuing to re-brand and
launch Virgin Money
Launching compelling Virgin
branded customer products

7
Financial performance impacted by COVID-19 dynamics
• Business lending +13.6%, Personal lending +3.9%; Mortgages (3.0)%
• Relationship deposits +20.3%
• NIM of 1.56% remained resilient post-base rate cut; within guidance range
• FY costs of £917m including £14m of COVID-19 related costs; down 3%
• Underlying cost:income ratio of 59%
• Asset quality remains resilient with no signs of deterioration yet seen
• FY20 impairment provision charge of £501m; 68bps cost of risk
• Strong coverage across portfolios; on balance sheet provisions of £735m
• Capital remained robust: CET1 ratio +10bps to 13.4%1
• Significant CET1 management buffer of c.£950m above regulatory minimum
• Strong liquidity and funding position maintained
Underlying pre-
provision profit
£625m
Robust CET1
ratio
13.4%
Efficiency
Asset
quality
Balance
sheet
mix
Balance
sheet
strength
Statutory loss
after tax
£(141)m
1 IFRS 9 transitional basis

8
Balance Sheet Update
Interim Chief Financial Officer
ENDA JOHNSON
8

9
Key points
• Defensive lending book remains overweight
secured Mortgages, with strong underwriting
criteria applied to Business & Personal portfolios
• No material deterioration in asset quality to date
across the portfolios with low arrears; benefitting
from Government support and bank forbearance
• Conservative economic scenarios and
weightings with expert judgement credit risk
PMAs applied in assessing ECL provision
• Increased coverage levels across all portfolios to
102bps in total; stable % of stage 3 loans
• Robust 13.4% CET1 ratio1 with c.£950m of
management buffer to MDA
Portfolio asset quality stable benefiting from support measures
Portfolio is defensively positioned with stable asset quality
Mortgages
£58.3bn,
81%
Personal
£5.2bn,
7%
Business
£8.9bn,
12%
• 75% owner-occupied with prudent BTL book
• Average LTV 57%, only 6% is >85% LTV
• Low arrears 0.4% vs industry avg. of 0.8%1
• Majority of book underwritten under MMR rules
• c.0.1% concentration in high LTI & high LTV2
• Prime portfolios, rigorous underwriting standards
• £4.1bn cards; £1.1bn personal loans & overdrafts
• Focused on high-quality, more affluent customers
• Credit card arrears: 0.8% (industry: 1.6%4)
• Personal loans: 0.4% >90 DPD (FY19: 0.6%)
• Prudent risk appetite
• Defensive sector and business size mix
• 67%3 fully or partially collateralised
• Arrears of 0.3% >90 DPD (FY19: 0.5%)
• Modest PD increase to 1.9%3 (FY19: 1.8%)
1 3m+ arrears; Source: UK Finance, 30-Sep2 Owner occupied approvals with LTI >4.5x and >85% LTV3 Excludes Government-scheme loans4 2 cycles past due, Source: Industry comparators sourced from Verisk Financial | Argus. covering c.90-95%
of the UK cards market and verified vs. UK Finance published figures Jan-Sept-20
1 IFRS 9 transitional basis

10
A prime book, originated under the highest standards
• Consistent, post-MMR prudent underwriting; no sub-prime/self-cert
• Arrears lower than industry (0.4% vs 0.81%)
Owner-occupied (75%)
• Average LTV is 58%; only 2% is >90% LTV
• Average LTI c.3.0x; only 6% >4.5x LTI
Buy-to-let (25%)
• Average LTV is 56%; max LTV of 80% for new lending
• Conservative rental and borrower income requirements
OO - C/I, 62%
Ave LTV: 59%
OO - I/O, 13%
Ave LTV: 49%
BTL - I/O, 22%
Ave LTV: 57%
BTL - C/I, 3%
Ave LTV: 47%
Low LTV mortgage book weighted towards owner-occupied Payment holiday customers have largely returned to paying
Mortgages: resilient asset quality to date
37%
46%
17%
<50% LTV
50%-75%
LTV
>75% LTV
57% Average LTV
1 3m+ arrears; Source: UK Finance 30-Sep
Total Book LTVs
Total granted Total active
Payment holidays: c.67k granted to date at 30-Sep
• Average LTV of all payment holiday customers 61% vs 57%
for overall portfolio
• Only 2% of customers maturing from payment holiday are
currently in arrears or require further treatment; average LTV
of 52% for those in arrears/further treatment
• Coverage ratio for those in arrears/further treatment of
c.300bps vs 23bps for overall book
20%% of
portfolio4%
11.9Balances
£bn
2.5
Returned to
payment
98%
Of matured payment holidays
%
Further
treatment/
arrears 2%

11
c.£7.8bn BAU book 78% in least and lower-impacted sectors
Business: key sectors performing in line with expectations
Note: Sector allocations represent management view of categorisation; portfolio view per ONS Standard Industrial Classification (SIC) codes is set out in the Appendix
• Agriculture, Food & Drink: Resilient performance; strong collateral
• Healthcare & social housing: Some operational issues but resilient
revenues and performance to date
• Utilities (incl. renewables): Stable, strong PDs
Key drivers of uncertainty into 2021
Least
exposed
£3.7bn
47%
More
exposed
£1.0bn
13%
Higher
impacted
£0.7bn
9%
Lower-
impacted
£2.4bn
31%
• Business services: Higher levels of Government scheme
lending; good access to borrowing & private equity over H2
• Legacy property (historic CRE): Remain smaller & well-
collateralised; continued low arrears; only 3% of total portfolio
• Brexit: Terms of UK exit remains an important driver for sectors like
agriculture and food & drink
• COVID-19: Operational implications on Healthcare
• Wholesalers, Professional practices: Moved from least
exposed due to higher Government-scheme lending requests
• Specialist hotels: Professional equity backed, prime-location
• Other: Diverse includes cost-flexible manufacturers & Transport
• Hotel sector: Easing of travel restrictions into 2021 remains uncertain
• Wholesale trade in goods & services: Pace of return represents a
key driver
• Pace of recovery: Speed of recovery in business activity is the key
revenue-driver
• Real-estate market: Extent of structural changes impacting market
• Retail: Substantial Government support being provided;
exposed to further lockdowns
• Legacy hospitality & Entertainment: Operationally challenged,
but significant government support at present
• Lockdown exit: sectors remain exposed to speed of recovery in
activity levels and whether any further lockdowns are implemented
Govt.
scheme
lending
£1.2bn
• BBLS: £0.8bn lent; 2/3rds to previously deposit-only customers
• CBILS/CLBILS: £0.4bn c.89% to existing lending customers
• As would expect, sector skew is to more exposed / higher impacted
• Debt management: Uncertain response once payments due: better
placed SMEs may repay in full or begin payments, others may default
• Liabilities impact: c.80% of loans remain on deposit, but may unwind
as businesses potentially begin to use liquidity.
BA
U

12
Strengthened originations; defensive high-quality BT-led book
Credit Cards: asset quality & origination discipline maintained
High quality origination: via prudent underwriting standards
% accounts in higher quality segments (with <2.5% expected unit loss rate) by acquisition year
BTs perform better: balance transfer cards seen lower losses
Source: Industry data Verisk Financial | Argus. Jan-Sep 20
Source: Industry data Verisk Financial | Argus. Jan-Sep 20; Industry comparators covering c.90-95%
of the UK cards market and verified vs. UK Finance published figures
High quality cards book (£4.1bn): well positioned for uncertainty
1 Arrears defined as 2+ cycles past due; Industry data Verisk Financial | Argus. Jan-Sep 20;2 Customers originated through VM brand since 2015; persistent debt reflects VMUK portfolio3 Sources: TUC and Verisk Financial | Argus
Average customer age 42
Average income £41k
% homeowners 70%
% self-employed 9%
% debt to income 22% 31%
% persistent debt 3.5% 5%
Credit cards
customer profile
Industry
average3
VM2
95% 93% 92% 93% 95% 96%92%
79%81% 82% 83%
80%
Pre-2016 2016 2017 2018 2019 2020
IndustryVirgin Money brand
Industry % charge-off rate by credit card type 2007 to 2020
0%
2%
4%
6%
8%
10%
12%
14%
2007 2008 2009 2010 2011 2012 2013 2014 2015 2016 2017 2018 2019 2020
BT-Led
Non-BT-Led
• Arrears declined to 0.8% vs industry1 of 1.6% benefitting from
support measures; BT arrears of 0.7%; non-BT arrears of 1.0%
• Upper-end of mass market customers; no credit impaired or
CCJs; c.80% originated post-2015 with prudent underwriting
• Balance transfers now c.68% of cards portfolio; c.12% maturing
from promo periods in next 6 months
• Low risk appetite reflected through higher customer acquisition
cut-offs; higher indebted/ lower affluence declined, and cut-offs
tightened on self employed
• Affordability tested for stressed income on fully drawn line at
33.9% APR

13
Cards: Early payment holiday experience demonstrates quality Personal: Encouraging early payment holiday exit levels
Personal: resilient quality supported by payment holidays
• Further tightened cut-off criteria, reduced appetite in potentially
lower resilience segments i.e. self-employed, higher indebtedness
• Strong customer profiles (75% homeowners, low self employed,
higher average income levels)
• Portfolio arrears at 0.4% >90 DPD (FY19: 0.6%)
Payment holidays: c.12k granted to date at 30-Sep
• Payment holiday coverage at 19% vs 8.2% overall book2
1 Excluding balances already on arrears
Payment holidays: c.46k granted to date at 30-Sep
• Payment holiday coverage at 20% vs 5.4% overall book
Total granted Total active
5%% of
portfolio1%
219
Balances
£m
31
Returned to
payment
92%
Of matured payment holidays
%
Further
treatment/
arrears1 8% Total granted Total active
11% 3%
103
Balances
£m
26
Returned to
payment
95%
Of matured payment holidays
%
Further
treatment/
arrears 5%
% of
portfolio
• Economic Vulnerability tools have identified customers likely to
have low financial resilience and been provided with proactive
support where needed
• Lower proportion of payment holiday requests from balance
transfer customers relative to the overall book
2 Personal loans & overdrafts

14
60
70
80
90
100
110
Q419 Q420 Q421 Q422 Q423 Q424
2.0%
5.0%
8.0%
11.0%
Q419 Q420 Q421 Q422 Q423 Q424
(17%)(14%)(11%)
(8%)(5%)(2%)
1%4%7%
10%
2019 2020 2021 2022 2023 2024
Increased conservatism in economics and weightings…
Upside (5%)
….drives prudent weighted average economic assumptions
Conservative IFRS 9 economic scenarios & weightings…
GDPAnnual change %
Unemployment% at quarter end
House
price indexIndex at
quarter end
Base (50%)10%
weighted
average
peak
c.22% weighted
average peak to troughSource: Oxford Economics
15% weighted
average trough
Downside (45%)
1. Updated
IFRS9 models
with
conservative
economic
scenarios
2. Probability
weightings
prudently
skewed to
downside
• Updated IFRS9 models with updated
Oxford Economics scenarios
• Used more conservative assumptions:
• Sharper GDP fall, muted recovery;
• Elevated unemployment;
• More severe HPI decline
1. Conservative economic assumptions
2. Downside probabilities
3. Supplemented by expert judgment
Recovery
Q3 Weightings
Pandemic
Shock
Pandemic
Sustained
30%
30%
40%
FY Weightings
Upside
Base
Downside
5%
50%
45%
95% weighted
to materially
weaker
economics
FY Weighted
Q3 Weighted

15
• Tightened originations raising credit cut-offs on
unsecured further from previously conservative levels
• Reduced new-to-bank originations on perceived less
resilient cohorts given evolving environment
• BAU business lending focused on larger cash-
generative businesses
• Continue to position conservatively given outlook and
Brexit outcome impacts
• Operationally prepared for tougher environment
Conservative modelled ECL supplemented by PMAs
…with further prudence applied via post-model adjustments
Risk appetite prudently tightened on new lending
313
54949
186
Sep-19 Sep-20
Modelled and individual ECL Post model adjustments
Post model adjustments are used to incorporate
risks not fully captured in models or inputs:
• Expert credit judgment on specific cohorts
• PMAs assessed for Mortgages £75m and
Personal £111m; No PMAs held for Business
• Payment holiday implications drove a £43m
increase on Mortgages & £23m on Personal
• Difficult-to-model elements like impact of roll-
off of unprecedented Government support
3. Refreshed
post model
adjustments
reflect latest
experience
and credit
risk judgment
735
362
Credit provision balance
£m
1. Conservative economic assumptions
2. Downside probabilities
3. Supplemented by expert judgment

16
PD deterioration,
82%
Watch list & forbearance,
9%
Other, 7%
>30 DPD, 2%
67.9
59.2
4.5
12.8
0.8 0.9
Sep-19 Sep-20
Model & PMA driven increase in stage 2; stable stage 3 Economic-related PD migration drove bulk of stage 2 increase
Economic modelling is main driver of stage 2 increases
• PD deterioration: Primary driver of stage 2 increase given
greater prudence in model outputs and overlays
• Forbearance & watch list balances primarily reflect actions
taken in Business banking
• Arrears & credit performance on stage 2 balances remain
resilient to date with no material change in asset quality
• IFRS9 model updates & PMAs drove £8.3bn of stage 2
increase in FY20:
• Mortgages – Increased £6.4bn or 76% of total
• Business – Increased £1.5bn or 19% of total
• Personal – Increased £0.4bn or 5% of total
• Business now 44% in stage 2 (FY19: 30%); includes the
early-adoption of EBA requirements to retain forborne
loans in stage 2 for a minimum of 2 years.
Gross loans and advances
£bn
Stage 1
81%
Stage 2
18%
Stage 3
1%
Stage 2 loans by
trigger point
%

17
Considerable on-balance sheet provisions; limited write-offs to date
Jun-20
ECL
Jun-20
Coverage
Ratio
Sep-20
Gross
Loans
Sep-20
ECL
Sep-20
Coverage
Ratio
FY20
Cost of
Risk
Mortgages £81m 14bps £58.6bn £131m 23bps 16bps
Personal £249m 490bps £5.6bn £301m 591bps 423bps
o/w cards £208m 509bps £4.5bn £222m 537bps 355bps
o/w loans &
overdrafts£41m 413bps £1.1bn £79m 824bps 721bps
Business £254m 321bps £8.7bn £303m 391bps* 212bps
Total £584m 79bps £72.9bn £735m 102bps 68bps
• Conservative economics and weightings increases
coverage across all portfolios to 102bps in total:
• Mortgages: coverage increased to 23bps
primarily driven by higher stage 2 balances
as a function of conservative economics
• Personal: coverage increased to 591bps
primarily driven by provision overlay
increases in loans and overdrafts
• Business: increased to 391bps driven by
further conservatism in model assumptions
• Cost of risk is expected to remain elevated due to
challenging economic environment but expect FY21
to be lower than FY20 level, subject to no material
further deterioration in the economic outlook
* Business coverage ratio excludes Government-backed lending balances
Increased coverage levels across all portfolios

18
4.5%
2.5%
2.5%
CRD IV minimumCET1 requirement
Sep-20
CET1 managementbuffer
CET1 ratioSep-20
c.£950m1
CCB
c.£0.6bn
Pillar 2A
c.£0.6bn
Pillar 1
c.£1.1bn
Continue to hold a significant CET1 buffer vs reg. requirement
9.5%
Resilient CET1 ratio including transitional relief
• Significant c£950m CET1 management buffer relative to CRDIV
minimum requirement (also MDA)
• Stable transitional CET1 ratio of 13.4%; fully loaded CET1 ratio
declined 70bps to 12.2% reflecting increased impairments
• Limited migration to stage 3 to date; not expected to commence
until Government & other support measures roll off in 2021
• Difference between transitional and fully loaded CET1 ratios is
expected to narrow somewhat in 2021 subject to economic
conditions
13.4%1
Capital levels remain robust –well positioned into 2021
1 IFRS 9 transitional basis

1919
Interim Chief Financial Officer
ENDA JOHNSON
Financial Results

20
£m 30 Sep 2020 30 Sep 2019 FY20 vs. FY19
Net interest income 1,351 1,433 (6)%
Non-interest income 191 206 (7)%
Total operating income 1,542 1,639 (6)%
Total operating and administrative expenses (917) (947) 3%
Operating profit before impairment losses 625 692 (10)%
Impairment losses on credit exposures (501) (153) (227)%
Underlying profit before tax 124 539 (77)%
Net Interest Margin (NIM) 1.56% 1.66% (10)bps
Cost of risk 68bps 21bps 47bps
Underlying cost-to-income ratio 59% 57% (2)%pts
Underlying Return on Tangible Equity (ROTE) 0.6% 10.8% (10.2)%pts
Underlying Earnings Per Share (EPS) 1.4p 28.1p (26.7)p
Underlying P&L (pro forma basis) 12 months to Change
Underlying profit impacted by significant impairment provision
12 months to

21
£m 30 Sep 2020 30 Sep 2019 Comments
Underlying profit before tax 124 539
Exceptional items
- Integration & transformation costs (139) (156) • Delayed H1 restructuring activity restarted in Q4
- Acquisition accounting unwinds (113) (87) • Includes impact of reclassified FV unwind noted at H1
- Legacy conduct costs (26) (433) • 2020 charge reflects non-PPI other conduct matters
- Other items (14) (128) • 2020 charge includes ASI JV and RBS switching costs
Total exceptional items (292) (804)
Statutory loss before tax (168) (265)
Statutory loss after tax (141) (179)
Tangible Net Asset Value (TNAV) per share 244.2p 249.2p
Statutory P&L (pro forma basis) 12 months to
Substantial reduction in exceptional items with no PPI charge
12 months to

22
Strong funding position; COVID-related deposit growth
Growth in relationship deposits, mix well managed Retain funding flexibility and managing wholesale mix
Wholesale funding balances
£bn
9.6 8.8
1.6
7.3
5.4
Sep-19 Sep-20
18.5
14.2
Due to other banksDebt securities TFS/TFSME
Customer deposit balances
£bn
22.2 21.1
20.2 20.7
21.4 25.7
Sep-19 Sep-20
Term deposits Non-linked savings Relationship deposits
Cost (bps) 98 90
LDR 114% 107%
63.867.5
5.8%(23)%
20%
Cost (bps) 148 142
TFS (% of lending) 10% 7%

23
Lending balances reflect COVID-19 impacts
Mortgages £58.3bn
60.1 59.5 58.3
Sep-19 Mar-20 Sep-20
7.9
8.3
7.7
1.2
Sep-19 Mar-20 Sep-20
5.05.3 5.2
Sep-19 Mar-20 Sep-20
(3.0)% +13.6% +3.9%
Continue to be selective in pricing
focusing on margin over volumes
YoY growth solely driven by
Government-guaranteed lending in H2
Resilient balances in high quality
Virgin Money credit card portfolio
Business £8.9bn Personal £5.2bn
BBLS/ CBILS/
CLBILS
8.9

24
Q4 20 margin recovered as expected due to base rate cut deposit repricing; FY21 NIM expected to be broadly stable
FY20 NIM in line with guidance; expect broadly stable in FY21
NIM evolution
(bps)
Broadly stable FY21
NIM vs FY20 level,
based on current
economic outlook
and rate expectations
(12)
(8)
3
1
(6)
1
11
(1)
Q2 20 Lending Liquidity Deposits Wholesale& other
Q3 20 Lending Liquidity Deposits Wholesale& other
Q4 20 FY20 FY21
1.63%
1.56%
1.52%
1.47%

25
…expected to remain subdued in FY21
(3)
9 8
(1)
26
2015
12
2119
15
22
35
22
1
1
16
Subdued H2 non-interest income with lower Personal fees…
Non-interest income
£m
• Lower personal income driven by structural impact of ‘high cost
of credit review’ and lower activity based credit card transaction
fees
• Business fees declined in Q3 owing to lower activity levels,
with Q4 boosted by a one-off £4m gain in relation to a growth
finance business sale participation fee
• Mortgage income declined in H2 as lockdown impacted activity
levels and associated insurance policy income
• H1 Sale of gilts at attractive market levels; proceeds reinvested
into other high-quality liquid assets
• Rebased ASI JV income levels expected to build slowly in time
• Aligned to conservative economic assumptions, currently
expect non-interest income to remain subdued in FY21Q1 20
36
Mortgages
Business
Personal
Investments
Fair Value
Q4 20
Subdued H2 non-interest income reflecting lower activity
Gilt sales
Q3 20
47
Q2 20
40
68

26
£30m of net cost savings delivered despite COVID costs…
998
(51)
947
(44)
14
917
FY18 Net costsavings
FY19 Underlyingnet costsavings
COVID-19costs
FY20 Expectednet costsavings
FY21
Delivered on cost reductions despite transformation pause
• 2020 costs benefitted from previous actions taken on costs
despite delaying delivery of some our planned 2020 cost
initiatives
• Incurred c.£14m of incremental, unplanned COVID-19
costs during 2020 including payment holiday / Government-
backed loan scheme system investments, customer service
resource costs and home office equipment
• Restarted Transformation programme delivery in July with
run-rate savings to support 2021 cost reductions
• Anticipate incurring a further c.£10-15m of ongoing COVID-
19 related costs in 2021
• Expect to spend c.£75m of Integration and Transformation
costs in 2021 to deliver ongoing programmes and complete
re-branding
£m
<875
(3)%
COVID-19
costs
…with good progress on our efficiency initiatives
£(30)m
27
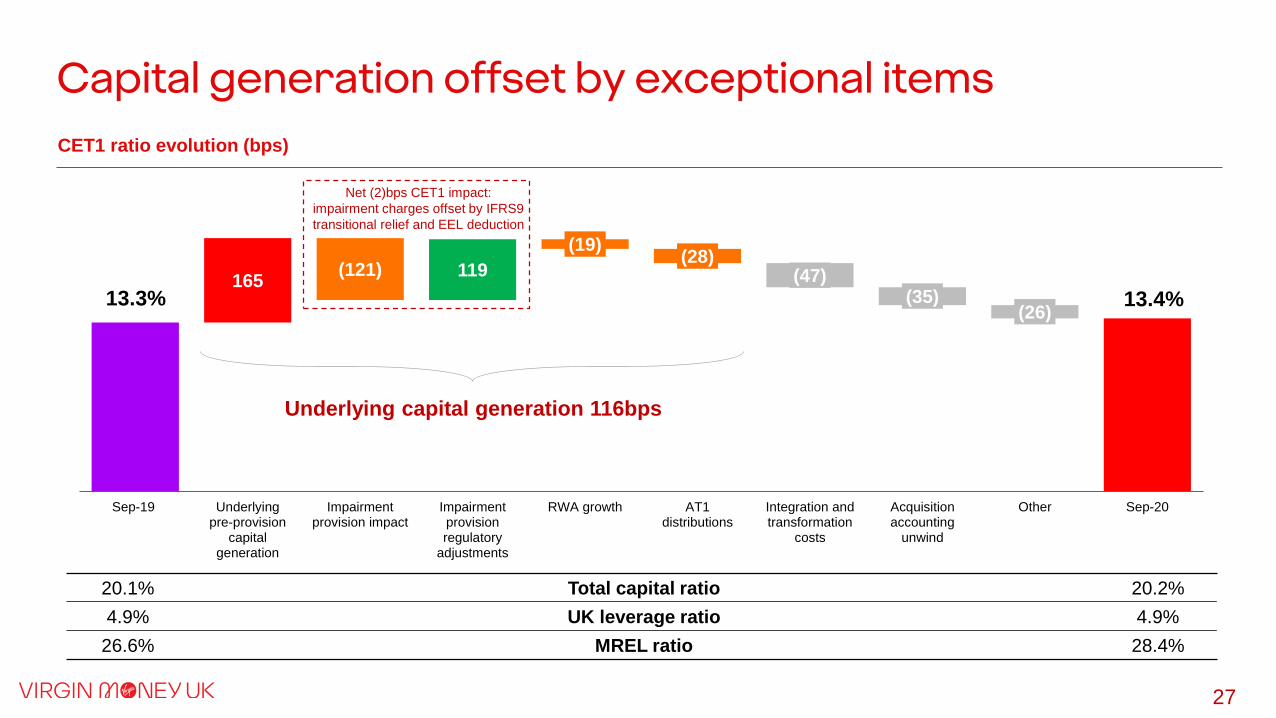
165119 (47)
(35)(26)
(121)
(19)(28)
Sep-19 Underlyingpre-provision
capitalgeneration
Impairmentprovision impact
Impairmentprovisionregulatory
adjustments
RWA growth AT1distributions
Integration andtransformation
costs
Acquisitionaccounting
unwind
Other Sep-20
13.3%
Capital generation offset by exceptional items
CET1 ratio evolution (bps)
Underlying capital generation 116bps
13.4%
Net (2)bps CET1 impact:
impairment charges offset by IFRS9
transitional relief and EEL deduction
20.1% Total capital ratio 20.2%
4.9% UK leverage ratio 4.9%
26.6% MREL ratio 28.4%
28
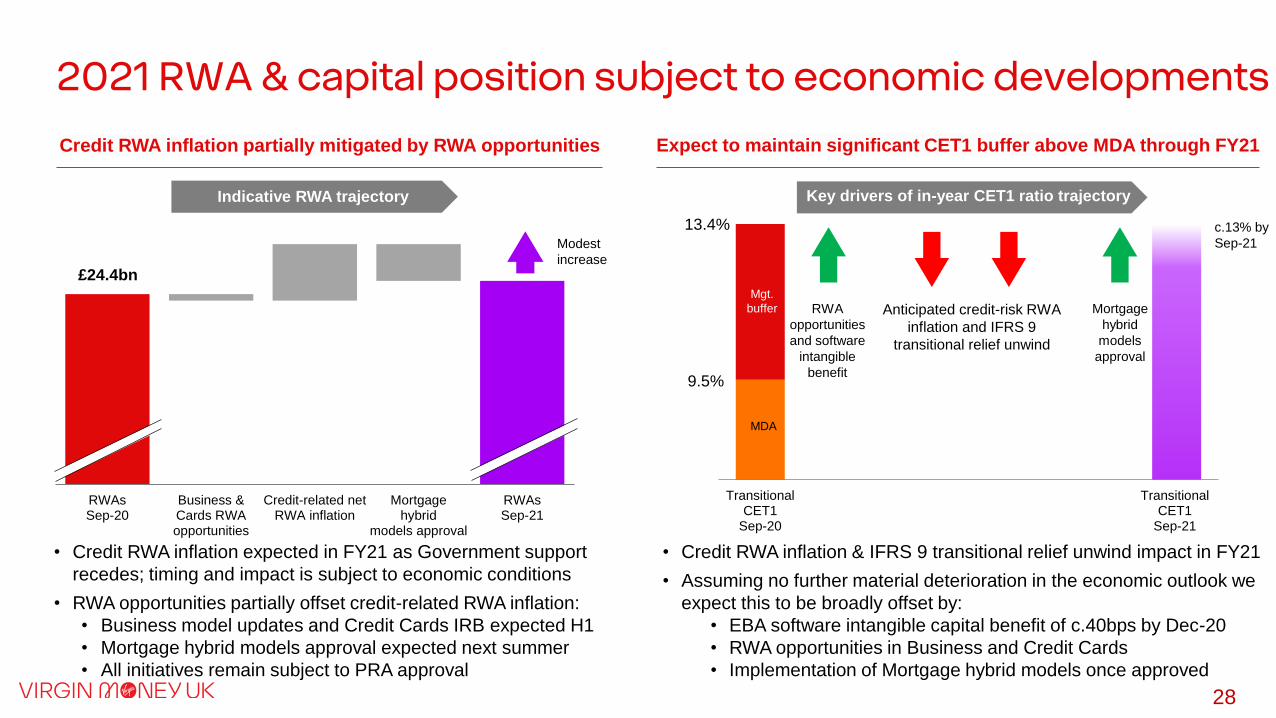
RWAsSep-20
Business &Cards RWAopportunities
Credit-related netRWA inflation
Mortgagehybrid
models approval
RWAsSep-21
£24.4bn
TransitionalCET1
Sep-20
TransitionalCET1
Sep-21
Expect to maintain significant CET1 buffer above MDA through FY21Credit RWA inflation partially mitigated by RWA opportunities
2021 RWA & capital position subject to economic developments
13.4%
• Credit RWA inflation expected in FY21 as Government support
recedes; timing and impact is subject to economic conditions
• RWA opportunities partially offset credit-related RWA inflation:
• Business model updates and Credit Cards IRB expected H1
• Mortgage hybrid models approval expected next summer
• All initiatives remain subject to PRA approval
9.5%
Modest
increase
Key drivers of in-year CET1 ratio trajectory
c.13% by
Sep-21
RWA
opportunities
and software
intangible
benefit
Anticipated credit-risk RWA
inflation and IFRS 9
transitional relief unwind
Mortgage
hybrid
models
approval
Indicative RWA trajectory
• Credit RWA inflation & IFRS 9 transitional relief unwind impact in FY21
• Assuming no further material deterioration in the economic outlook we
expect this to be broadly offset by:
• EBA software intangible capital benefit of c.40bps by Dec-20
• RWA opportunities in Business and Credit Cards
• Implementation of Mortgage hybrid models once approved
Mgt.
buffer
MDA

29
Expect to deliver a double digit statutory RoTE in the medium termFY 2021 guidance
NIM
Costs
Broadly stable vs FY20 level
<£875m inclusive of c.£10-15m of COVID-19 costs
Cost of risk Lower than FY20 level
RisksOpportunities
• Interest rate
outlook
• Macroeconomic
deterioration
• Brexit impacts
• Pace of economic
recovery
• Mortgage spreads
• Deposit repricing
• Improved customer
spending
• Steepening yield curve
Note: assumes no significant further deterioration in expectations for the economic
outlook or change in interest rates
1. Impairment & exceptional cost normalisation: anticipate 2020 to be peak of
impairment charges and exceptional costs to reduce over time
2. Cost reduction: significant opportunity to reduce costs further through
digitisation and leveraging the evolving operating model to become more efficient
3. Capital efficiency: executing on our RWA & capital efficiency opportunities
4. Balance sheet mix: optimise our balance sheet mix over time through a more
margin accretive lending mix and lower cost deposit and funding base
FY20
Statutory ROTE
(6.2)%
Impairment &
exceptionals
normalisation
Cost
reduction
Capital
efficiency
Balance
sheet mix
>10%
Medium-
term
statutory
ROTE
Indicative building blocks
(not to scale)
Guidance and medium term outlook
1
2
3
4

3030
Chief Executive Officer
DAVID DUFFY
Outlook

31
2021 will see a year of exciting launches and rebrandingBalance
transfer
instalment
payment
Integration & re-
brand activity
completeVirgin Money
BCA launch
Improved
mortgage
onboarding
Brighter Money
Bundle launch
Cashback
credit card
launchNew BCA
linked-
saver
All stores re-
branding complete
Exclusive ISA
savings Mortgage
API
Connectivity
enhanced
Buy Now Pay
Later
Instalment
card launch
Home Buying
Coach app -
Phase 2 launch
Working
Capital
Health
Improved
PCA/SME
Onboarding
Launch Club
M account
Sep
2020H1 FY21 H2 FY21
Mar
2021
Sep
2021
Ongoing customer support due to COVID-19

32
£35m BCR Capability & Innovation grant received – Virgin Money to match fund the investment
We intend to disrupt the UK business banking market
Building a digital Fintech
ecosystem to deliver
innovative new services
to support businesses
banking needs
Launching a fully re-branded
Virgin Money for Business
current account with a striking
new Premium Debit Card
Introducing our innovative
‘Working Capital Health’
proposition in 2021
Harnessing the power of
data & customer networks
to improve digitised
onboarding

33
Strengthened our sustainability strategy to be a force for good
To drive positive social and environmental impact through everything we do to disrupt the status quoDisrupt the Status
Quo
Pioneering Growth
Deliver products and services that
help our customers make a
positive impact on society and the
environment
At least 50% reduction in our carbon
emissions across everything we finance
Put our
(carbon)
foot down
Super
Straightforward
Efficiency
Reduce the negative impacts of
our operations, suppliers and
partners on society and the
environment
Net zero operational and supplier carbon
emissions
Discipline and
SustainabilityVariable remuneration linked to ESG
progress
Open
doors
Delighted
Customers and
Colleagues
Work with customers, colleagues
& communities to encourage
sustainable practices & economic
activity that creates shared
prosperityHelp 20k charities to raise £2bn since VMG’s
inception
2030 AspirationsPrinciplesGoals Initiatives
Build a
brighter
future
Straight-up
ESG
Align our strategic goals to ESG
and embed them in all areas of the
business with robust targets,
tracking and disclosures
No VM customers paying a Poverty Premium
Sponsor diverse talent at every level & achieve a
fully diverse top-quartile of the organisation
Making you happier about money
TCFD

34
Delivering our strategy to create value
Delivering our strategy will create shareholder value…
Pioneering
Growth
Discipline &
Sustainability
Delighted
Customers &
Colleagues
Super
Straightforward
Efficiency
Targeting significant cost reductions aligned
to the evolving operating model to support
future returns
Accelerating our digital transformation to
support future customer acquisition and a
more efficient operating platform
Managing our risk profile while delivering an
efficient capital base over time and delivering
returns to investors
Leveraging our digital platform to optimise
our balance sheet mix over the medium term
…delivering improved returns in the medium term
Impairment and
exceptional cost
normalisation
Cost reduction
Capital efficiencyBalance sheet mix
optimisation
Underpinned by ESG – being a force for good
and delivering for all our stakeholders
Expect to deliver double digit statutory
returns on tangible equity, assuming
no significant further deterioration in
expectations for the economic outlook
or change in interest rates
A differentiated
business
model…
…with clear
drivers
of returns
improvement…
…to support
our medium
term ambition

3535
Q&A
Chief Executive Officer
DAVID DUFFY
Interim Chief Financial Officer
ENDA JOHNSON
Chief Risk Officer
MARK THUNDERCLIFFE

Andrew Downey
Head of Investor Relations
t: +44 20 3216 2694
m: +44 7823 443 150
Investor Relations Contacts
36
Richard Smith
Senior Manager, Investor Relations
t: +44 20 3216 2665
m: +44 7483 399 303
Martin Pollard
Investor Relations Manager
t: +44 191 279 5780
m: +44 7894 814 195

Appendix
37
38
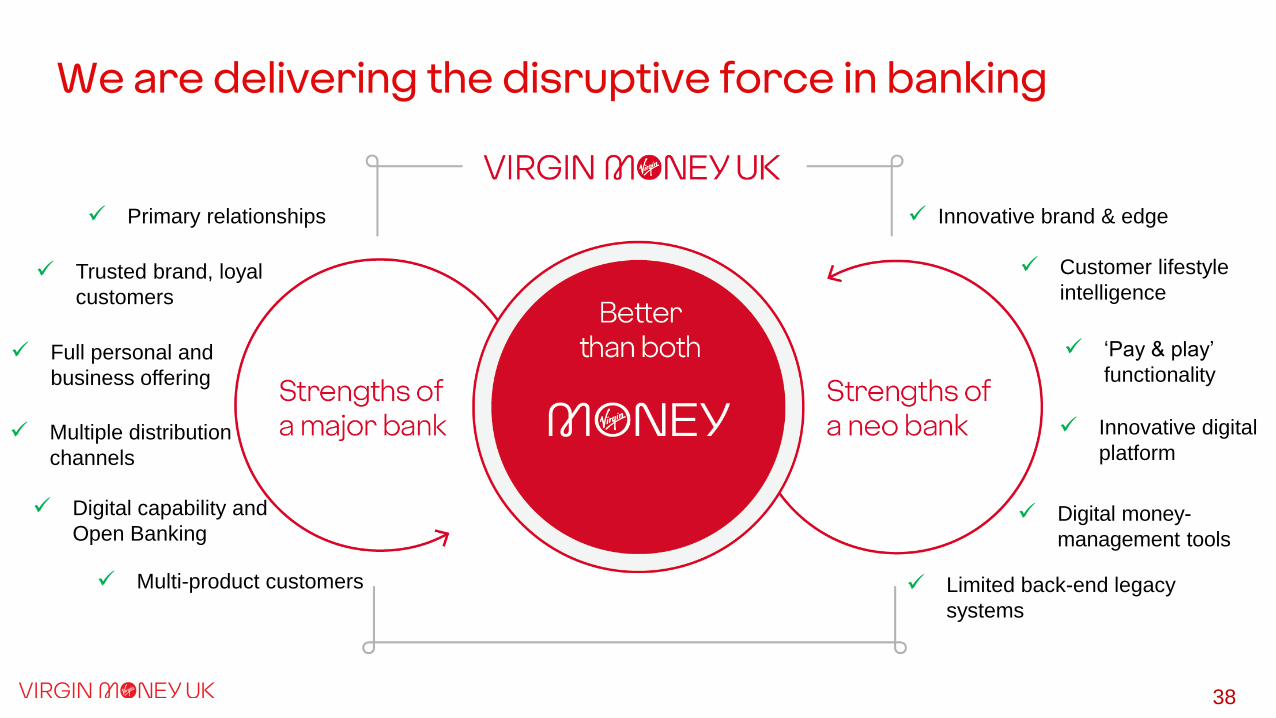
We are delivering the disruptive force in banking
✓ Full personal and
business offering
✓ Multi-product customers
✓ Primary relationships
✓ Digital capability and
Open Banking
✓ Trusted brand, loyal
customers
✓ Multiple distribution
channels
✓ Innovative brand & edge
✓ ‘Pay & play’
functionality
✓ Digital money-
management tools
✓ Customer lifestyle
intelligence
✓ Limited back-end legacy
systems
✓ Innovative digital
platform

39
IFRS 9 multiple economic scenarios
Scenario Economic Measure 2020 2021 2022 2023 2024
Upside (5% weighting)
GDP (yoy %) (10.8%) 10.2% 3.5% 1.9% 1.8%
Unemployment (average) 5.5% 5.1% 3.9% 3.7% 3.6%
House price growth (yoy %) (4.2%) (1.8%) 6.7% 4.0% 3.8%
Base (50% weighting)
GDP (yoy %) (14.0%) 7.9% 4.6% 2.1% 1.8%
Unemployment (average) 6.1% 7.8% 6.3% 6.3% 6.0%
House price growth (yoy %) (7.3%) (8.5%) 1.5% 1.9% 4.1%
Downside (45% weighting)
GDP (yoy %) (16.9%) 5.0% 5.7% 2.0% 1.9%
Unemployment (average) 6.7% 10.0% 7.2% 6.8% 6.5%
House price growth (yoy %) (11.2%) (15.6%) (6.7%) (2.2%) 4.8%
Weighted average
GDP (yoy %) (15.1%) 6.7% 5.1% 2.1% 1.9%
Unemployment (average) 6.3% 8.6% 6.6% 6.4% 6.1%
House price growth (yoy %) (8.9%) (11.4%) (1.9%) 0.2% 4.4%
Source: Oxford Economics

40
at Sep 2020 at Sep 2019
Mortgages 58,290 60,079
Business 8,948 7,876
Personal 5,219 5,024
Total customer loans 72,457 72,979
Liquid assets and other 15,608 16,391
Other assets 2,194 1,629
Total assets 90,259 90,999
Customer deposits 67,511 63,787
Wholesale funding (excl. TFS / TFSME) 8,819 11,164
TFS / TFSME 5,408 7,342
Other liabilities 3,589 3,685
Total liabilities 85,327 85,978
Equity and reserves 4,932 5,021
Liabilities and equity 90,259 90,999
£m
Balance sheet

41
Relationship deposits - 2020
Businesses holding higher BCA balances for liquidity Strong PCA and linked savings balance growth under lockdown
Relationship deposit balances
£bn
Relationship deposit balances
£bn
6.98.9
2.2
2.5
FY19 FY20
8.09.4
4.3
4.9
FY19 FY20
Cost (bps) 31 23
Business Current Accounts BCA Linked Savings Personal Current Accounts PCA Linked Savings
29 28
9.1
11.5 12.3
14.2
+26%+16%
Cost (bps)
Balance outlook will in part
depend on economic recovery
and customer behaviour

42
Mortgage Lending – 2020
Mortgage lending location (1)
Loan-to-value of mortgage lending
Repayment and borrower profile
Gross new mortgage lending volumes
Scotland9%
England North14%
England Midlands
13%Greater London
29%
Rest of South32%
Other3%
OO - C/I69%
OO - I/O10%
BTL - I/O18%
BTL - C/I3%
<50%14%
50-80%55%
80-90%26%
>90%5%
4.8 3.7 3.3 2.6
0.9
0.80.8
0.4
5.7
4.5 4.1
3.0
H1 19 H2 19 H1 20 H2 20
Broker Proprietary Channels
83%
(£bn)
Broker % total new business volume
(1) Excludes loans where data is not currently available due to front book data matching still to be completed and historic data capture requirements. Other
includes Wales, Northern Ireland, Channel Islands and those new accounts where the region might be unknown until collateral matching has occurred.
Stock of mortgage lending Gross new mortgage lending
Gross new
mortgage
lending by LTV
banding
• 57.3% average LTV of stock mortgage portfolio
• 69.9% average LTV of gross new lending82%85% 86%

43
Business Lending – 2020
Business lending portfolio
Business lending portfolio by industry sector1
CRE: 7%
Housing
Associations:
2%
Retail & wholesale trade
11%
Business services
16%
Manufacturing
9%
Hospitality
8%
CRE
9%
Transport & storage
4%
Construction
3%
Other
9%
Entertainment
2%
Agriculture
16%
2Fully
secured48%
Partially secured
19%
Largely/fully unsecured
33%
Gov’t, health & education
13%
1 Sector allocations per ONS Standard Industrial Classification (SIC) codes
2 Other includes Utilities, Post & Telecommunications, Personal Services, Finance and other unassigned businesses
3 Excludes the HM Government backed Portfolio
Top 52% 6-20 largest
5%
Other93%
% of book by
customer exposure% of book by
collateral cover3
1.3 1.8
H1 20 H2 20
(£bn) Business banking drawdowns

44
£m
Risk weighted assets
at Sep 2020 at Sep 2019
Mortgages 9,484 8,846
Business 6,716 7,124
Personal 4,151 4,042
Other 1,137 1,045
Total credit risk 21,488 21,057
Credit valuation adjustment 175 192
Operational risk 2,557 2,606
Counterparty risk 179 191
Total RWAs 24,399 24,046
Total loans 72,457 72,979
Credit RWAs / total loans 30% 29%
Total RWAs / assets 27% 26%

45
ESG: Progress in FY20 and clear focus for FY21
• 1.70 GHG emissions intensity ratio1, from
1.95 in 2019
• Zero waste sent to landfill
• 100% of our electricity generated from
renewable sources (2)
• 7% reduction in scope 1 and 2 emissions
• £150m in renewables lending
• 100 businesses took part in our
Sustainability Benchmarking Tool pilot
• Developed sensitive sector statement
• First bank members of the Future-Fit
Development Council
• 50,000 people able to take control of their
finances with an affordable loan from our
Salary Finance partnership
• 43% women in senior leadership roles
• £104m raised for UK charities through
VMG in FY20
• ESG scorecard included in the Long Term
Incentive Plan (LTIP)
• Leadership Team Accountabilities for
ESG strategy established
• ESG targets included in each functional
and franchise balanced scorecard for FY21
• 5% reduction in operational carbon
emissions by 2021 from 2020 baseline
• >75% of our top 100 suppliers to complete
CDP Supply Survey in 2021
• 5% of business loan book comprised of
sustainable leaders by FY22
• Short to medium term targets for our
mortgage book are under development
• Long-term incentives appropriately aligned
to expanded ESG scorecard by 2022
• Financial risk from climate change
determined and disclosed for physical and
transitional risk sectors by 2022
Worked with Future-Fit to build a benchmarking
tool for businesses to measure their progress
against UN SDGs.
Began work to better understand the carbon
intensity of our mortgage book, sourcing EPC
data and engaging with external forums.
Our starting position is strong with low levels
of lending to carbon-intensive sectors (3) but
there remains work to do.
We have begun engaging with customers,
colleagues and industry forums (including
PCAF) to build our plans.
Partnering with Fair By Design to help
identify customers paying a Poverty Premium
and provide targeted solutions. We will run a
pilot to mitigate energy-related premiums, the
biggest driver of overspend for low income
households.
Over the next year we will be working to
better understand our indirect (scope 3)
emissions and build out a roadmap to reduce
the emissions linked to our suppliers and
partners.
Embedding new ESG operating model and
reporting, so our stakeholders can clearly
understand how ESG informs our decision
making. Working to enhance the way ESG is
reflected in credit risk policies and disclosure
of financial risks from climate change (3).
Launched the Virgin Money M Account, a basic
bank account that’s far from basic.
Held our first financial inclusion event for
colleagues to underline the importance of being
an inclusive bank and help embed our
vulnerable customer strategy.
Made good progress in reducing our carbon
emissions and building our net zero road map.
We have a clear plan for a steady reduction in
operational emissions (scope 1 and scope 2)
over the next five years.
Made good progress in embedding ESG into our
decision making frameworks. Board Risk
Committee oversight of climate change and
wider ESG principles through the principal and
emerging risk framework.
ESG working Group established
FY20
Progress
FY21
Focus
Build a
brighter
future
Open
doors
Straight
-up
ESG
Put our
(carbon) foot
down
(1) Intensity ratio of Greenhouse Gas (GHG) Emissions per average Full Time Equivalent (FTE) for our operational emissions (scope 1 and 2 emissions).
(2) Where the Bank is responsible for the supply. (3) The Group has low levels of lending to carbon related assets at 0.1% (2019: 0.1%) of the Group’s customer lending assets.
TargetsFast facts Select examplesSelect examples
• Customer: Solutions in place to identify and
help at least 50% of Virgin Money customers
facing a Poverty Premium by 2025
• Colleague: 40-60% senior gender diversity
over medium term
• Community: Reach £1 billion in fundraising by
2021 through VMG

Fixed income investor appendix
46

47
Strong capital with significant buffers above regulatory minimums
CET13.9% / c.£950m buffer
Total Capital
Leverage
4.5%
2.5%
2.5%
Sep-20CET1 Ratio
Sep-20Minimum Requirement
8.0%
4.4%
2.5%
Sep-20Total Capital Ratio
Sep-20Minimum Requirement
Sep-20UK Leverage Ratio
Sep-20BoE Minimum Requirement
Pillar 1 Pillar 2A Capital Conservation Buffer
13.4%
9.5%
20.2%
14.9%
4.9%
3.25%
MREL
8.00%
4.40%
8.00%
4.40%2.50%
Sep-20MREL Resources
Expected 1-Jan-22MREL Requirement
28.4% 27.3%
1.65% / c.£1.4bn buffer
5.3% / c.£1.3bn buffer 1.1% / c.£270m buffer£0.5-0.75bn of
MREL senior debt
planned in FY21
(1) IFRS 9 transitional basis
(2) CRD IV Minimum Requirement
(1)
(1)
(1)
(1)
(2)
(2)

48
Aim to manage capital structure in an efficient mannerCapital stack breakdown
Well established capital stack
CET1 13.4%(£3.3bn)
CET1 Minimum
Requirement
9.5%
CET1 Headroom 3.9%
AT1 3.8%(£0.9bn) Optimal AT1 2.3%
AT1 Headroom 1.5%
Tier 2 3.1%(£0.7bn)
Optimal Tier 2 3.1%
Sep-20Total Capital Resources
Sep-20Minimum Requirement
• Excess capital of 5.3% largely due to excess CET1
• No FX exposure in the capital structure, providing stability
during periods of market volatility
• On both AT1 and T2 needs, we look to regulatory optimum
levels as a minimum and then judge a prudent headroom
over and above that takes into account potential RWA
volatility. Over time we look to manage that headroom in
an efficient manner without changing overall loss
absorbing capacity
• VMUK has Available Distributable Items (“ADIs”) of
£789m; representing c.10 times its 2021 AT1 coupon
payments of £79m
Total capital
ratio 20.2%(1)
14.9%
Minimum
Requirement(2)
(1) IFRS 9 transitional basis
(2) CRD IV Total Capital Minimum Requirement

49
FY21 issuance focused on building prudent management buffer MREL in line with expected end-state requirement
Well positioned for end-state MREL requirements
Total Capital
20.20%
HoldCo Senior
8.20%
8.00%
4.40%
8.00%
4.40%
2.50%
Sep-20MREL Resources
Expected 1-Jan-22MREL Requirement
Loss a
bso
rptio
nR
ecap
ita
lisa
tion
• MREL is subject to phased implementation and will be
fully implemented from 1 Jan 2022; BoE expected to
confirm end-state requirement in calendar Q4 2020
• Pillar 2A Total Capital requirement reduced to 4.4% in
2020 and is now set in nominal terms, providing stability
should RWAs increase during periods of stress
• MREL ratio of 28.4% comfortably exceeds interim MREL
requirement and is in line with expected end-state MREL
requirement
• Future MREL issuance is focused on building a prudent
management buffer over the expected end-state MREL
minimum requirement
– Planned issuance of £0.5-0.75bn of MREL-eligible
senior unsecured debt in FY21
28.4%27.3%
Pillar 1 Total Capital Requirement
Pillar 2A Total Capital Requirement
Capital Conservation Buffer
(1) IFRS 9 transitional basis
(1)

50
Significant excess liquidity… …modest 2021 Wholesale Funding requirement
Strong funding & liquidity position
Wholesale Funding(£bn)
• LCR of 140% well above regulatory requirement of 100%,
equivalent to a surplus of c.£3.1bn
• No reliance on short-term Wholesale Funding
• £3.2bn of TFS repaid during 2020, £4.1 billion
outstanding; initial TFSME allowance of £7.2bn, £1.3bn
drawn in H2 2020
• Access to TFSME and deposit inflows leaves modest
2021 funding need
(1) Bonds issued by supra-nationals and AAA-rated covered bonds
18.5
14.2Debt Securities
Due to Other Banks
TFS / TFSME
Liquidity Coverage Ratio
100%
152% 140%
Minimum Requirement
Sep-19 Sep-20
FY21 Issuance Plan
Secured
Responsive to
deposit flows; expect
to be modest
MREL Senior
£0.5-0.75bn
Capital
Broadly limited to
refinancing
9.6 8.8
1.6
7.3
5.4
Sep-19 Sep-20

51(1) Long-term bank deposit rating
Credit & ESG Ratings
Virgin Money
UK PLC
Clydesdale
Bank PLCCommentary
CR
ED
IT
Moody’sLong-term
Baa3 Stable
Baa1(1)
Stable No impact following the UK sovereign downgrade in October 2020, as
the Group’s ratings do not include any government support uplift.Short-term P-3 P-2
Standard & Poor’sLong-term
BBB-Negative
BBB+ Negative
Negative outlooks on most UK banks, citing the potential earnings,
asset quality and capitalisation pressures arising as a result of the
Covid-19 pandemicShort-term A-3 A-2
Fitch Long-term
BBB+ Negative
A-Negative
Negative outlooks on most UK banks, citing the deep near-term damage
to the UK economy and significant weakening in the UK's public
finances caused by the Covid-19 outbreak, in addition to lingering Brexit
uncertainty. Short-term F2 F2
ES
G
Sustainalytics 27.5 Last update: 21 May 2020; 3.3 point improvement versus previous score
MSCI BBB Last update: 27 May 2020; upgraded 1 notch from previous score

52
Structural hedge fully unwound, locking in NII contributions
• Historically, the Group had a Structural Hedge of c.£24bn,
used to minimise volatility and stabilise earnings on
income related to low & non-interest bearing liabilities and
equity
• Structural products were hedged on a 5-year rolling basis,
consistent with investment objectives to optimise and
stabilise earnings as the BoE Base Rate goes up and
down
• Following the reduction in BoE Base Rate, and noting
future market rate expectations, the Group concluded that
its 5-year structural hedge had generated maximum value.
• During Q3 2020 the Group’s Structural Hedge was fully
unwound, locking in expected NII contributions from the
hedges over the next 5 years
• In the future, the Group anticipates a more dynamic
approach to hedging these balances and based on the
current rate outlook, expects no significant adverse impact
on NII in FY21 and beyond compared to the 5-year rolling
approach
…our structural hedge was fully unwoundFollowing the reduction in BoE Base Rate…
-0.20
-0.10
0.00
0.10
0.20
0.30
0.40
0.50
0.60
0.70
0.80
30-Sep-19 31-Dec-19 31-Mar-20 30-Jun-20 30-Sep-20
Pe
rce
nta
ge
(%
)
5y GBP Swap (vs SONIA) BoE Base Rate

53
Disclaimer This document has been prepared by Virgin Money UK PLC (the “Company”) and is the responsibility of the Company. It was prepared for the purpose of, and comprises the written materials used in and/ or discussed at,
the presentation(s) given to stakeholders concerning the full year financial results of the Company and its subsidiaries (which together comprise the “Group”) for the twelve months ending 30 September 2020. This
document is a marketing communication and should not be regarded as a research recommendation.
The information in this document may include forward looking statements, which are based on assumptions, expectations, valuations, targets, estimates, forecasts and projections about future events. These can be
identified by the use of words such as 'expects', 'aims', 'targets', 'seeks', 'anticipates', 'plans', 'intends', 'prospects' 'outlooks', 'projects', ‘forecasts’, 'believes', 'estimates', 'potential', 'possible', and similar words or phrases.
These forward looking statements, as well as those included in any other material discussed at the presentation, are subject to risks, uncertainties and assumptions about the Group and its securities, investments and the
environment in which it operates, including, among other things, the development of its business and strategy, any acquisitions, combinations, disposals or other corporate activity undertaken by the Group (including but
not limited to the integration of the business of Virgin Money Holdings (UK) plc and its subsidiaries into the Group), trends in its operating industry, changes to customer behaviours and covenant, macroeconomic and/or
geopolitical factors, the repercussions of the outbreak of coronaviruses (including but not limited to the COVID-19 outbreak), changes to its board and/ or employee composition, exposures to terrorist activity, IT system
failures, cyber-crime, fraud and pension scheme liabilities, changes to law and/or the policies and practices of the Bank of England, the FCA and/or other regulatory and governmental bodies, inflation, deflation, interest
rates, exchange rates, changes in the liquidity, capital, funding and/ or asset position and/or credit ratings of the Group, future capital expenditures and acquisitions, the repercussions of the UK's referendum vote to leave
the European Union (EU), the UK’s exit from the EU (including any change to the UK’s currency), Eurozone instability, and any referendum on Scottish independence.
In light of these risks, uncertainties and assumptions, the events in the forward looking statements may not occur. Forward looking statements involve inherent risks and uncertainties. Other events not taken into account
may occur and may significantly affect the analysis of the forward looking statements. No member of the Group or their respective directors, officers, employees, agents, advisers or affiliates gives any assurance that any
such projections or estimates will be realised or that actual returns or other results will not be materially lower than those set out in this document and/or discussed at the presentation. All forward looking statements should
be viewed as hypothetical. No representation or warranty is made that any forward looking statement will come to pass. No member of the Group or their respective directors, officers, employees, agents, advisers or
affiliates undertakes any obligation to update or revise any such forward looking statement following the publication of this document nor accepts any responsibility, liability or duty of care whatsoever for (whether in
contract, tort or otherwise) or makes any representation or warranty, express or implied, as to the truth, fullness, fairness, merchantability, accuracy, sufficiency or completeness of, the information in this document or the
materials used in and/ or discussed at, the presentation.
Certain industry, market and competitive position data contained in this presentation comes from official or third party sources. There is no guarantee of the accuracy or completeness of such data. While the Company
reasonably believes that each of these publications, studies and surveys has been prepared by a reputable source, no member of the Group or their respective directors, officers, employees, agents, advisers or affiliates
have independently verified the data. In addition, certain of the industry, market and competitive position data contained in this presentation comes from the Group’s own internal research and estimates based on the
knowledge and experience of the Group’s management in the markets in which the Group operates. While the Company reasonably believes that such research and estimates are reasonable and reliable, they, and their
underlying methodology and assumptions, have not been verified by any independent source for accuracy or completeness, and are subject to change. Accordingly, undue reliance should not be placed on any of the
industry, market or competitive position data contained in this presentation.
The information, statements and opinions contained in this document and the materials used in and/ or discussed at, the presentation, do not constitute or form part of, and should not be construed as, any public offer
under any applicable legislation or an offer to sell or solicitation of any offer to buy any securities or financial instruments or any advice or recommendation with respect to such securities or other financial instruments.
The distribution of this document in certain jurisdictions may be restricted by law. Recipients are required by the Group to inform themselves about and to observe any such restrictions. No liability to any person is
accepted in relation to the distribution or possession of this document in any jurisdiction. The information, statements and opinions contained in this document and the materials used in and/ or discussed at, the
presentation are subject to change.
Certain figures contained in this document, including financial information, may have been subject to rounding adjustments and foreign exchange conversions. Accordingly, in certain instances, the sum or percentage
change of the numbers contained in this document may not conform exactly to the total figure given.

Making you happier about money