Embed Size (px)
Citation preview
Registered No. 06952311
Virgin Money plc
Annual Report and Accounts 2015


Virgin Money plc
Contents
Page
Company information 1 Strategic report 2 Directors’ report 9 Independent auditor’s report 12 Income statement 13 Statement of comprehensive income 14 Balance sheet 15 Statement of changes in equity 16 Cash flow statement 17 Notes to the financial statements 18

(This page has been left blank intentionally)
Virgin Money plc
Company information
1
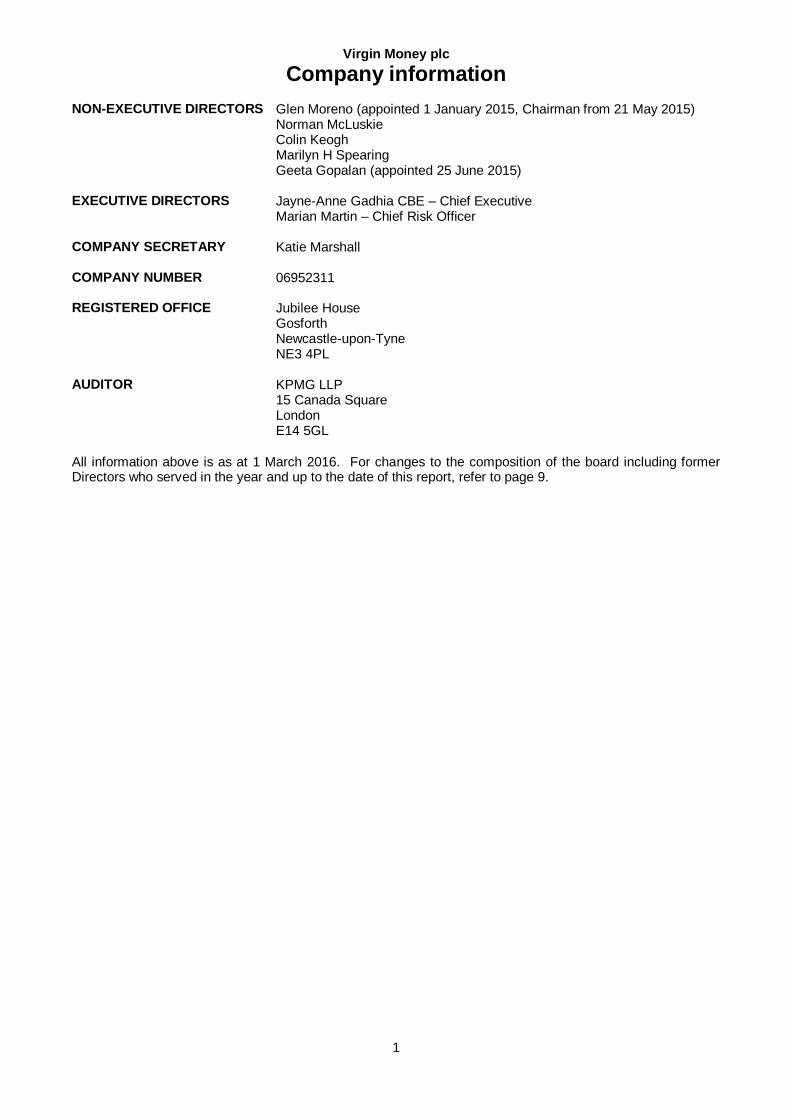
NON-EXECUTIVE DIRECTORS Glen Moreno (appointed 1 January 2015, Chairman from 21 May 2015) Norman McLuskie Colin Keogh Marilyn H Spearing Geeta Gopalan (appointed 25 June 2015)
EXECUTIVE DIRECTORS Jayne-Anne Gadhia CBE – Chief Executive Marian Martin – Chief Risk Officer
COMPANY SECRETARY Katie Marshall
COMPANY NUMBER 06952311
REGISTERED OFFICE Jubilee House Gosforth Newcastle-upon-Tyne NE3 4PL
AUDITOR KPMG LLP 15 Canada Square London E14 5GL
All information above is as at 1 March 2016. For changes to the composition of the board including former Directors who served in the year and up to the date of this report, refer to page 9.
Virgin Money plc
Strategic report
2
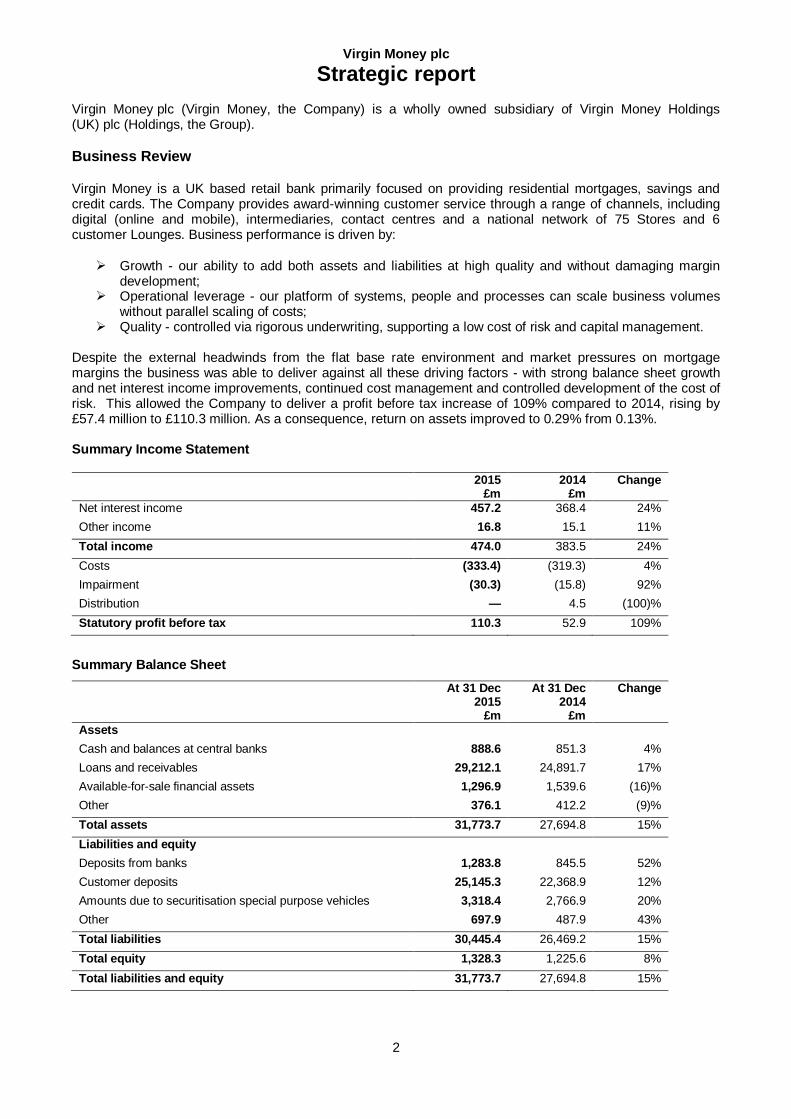
Virgin Money plc (Virgin Money, the Company) is a wholly owned subsidiary of Virgin Money Holdings (UK) plc (Holdings, the Group).
Business Review
Virgin Money is a UK based retail bank primarily focused on providing residential mortgages, savings and credit cards. The Company provides award-winning customer service through a range of channels, including digital (online and mobile), intermediaries, contact centres and a national network of 75 Stores and 6 customer Lounges. Business performance is driven by:
Growth - our ability to add both assets and liabilities at high quality and without damaging margin development;
Operational leverage - our platform of systems, people and processes can scale business volumes without parallel scaling of costs;
Quality - controlled via rigorous underwriting, supporting a low cost of risk and capital management. Despite the external headwinds from the flat base rate environment and market pressures on mortgage margins the business was able to deliver against all these driving factors - with strong balance sheet growth and net interest income improvements, continued cost management and controlled development of the cost of risk. This allowed the Company to deliver a profit before tax increase of 109% compared to 2014, rising by £57.4 million to £110.3 million. As a consequence, return on assets improved to 0.29% from 0.13%. Summary Income Statement 2015
£m 2014
£m Change
Net interest income 457.2 368.4 24%
Other income 16.8 15.1 11%
Total income 474.0 383.5 24%
Costs (333.4) (319.3) 4%
Impairment (30.3) (15.8) 92%
Distribution — 4.5 (100)%
Statutory profit before tax 110.3 52.9 109%
Summary Balance Sheet
At 31 Dec 2015 £m
At 31 Dec 2014
£m
Change
Assets
Cash and balances at central banks 888.6 851.3 4%
Loans and receivables 29,212.1 24,891.7 17%
Available-for-sale financial assets 1,296.9 1,539.6 (16)%
Other 376.1 412.2 (9)%
Total assets 31,773.7 27,694.8 15%
Liabilities and equity
Deposits from banks 1,283.8 845.5 52%
Customer deposits 25,145.3 22,368.9 12%
Amounts due to securitisation special purpose vehicles 3,318.4 2,766.9 20%
Other 697.9 487.9 43%
Total liabilities 30,445.4 26,469.2 15%
Total equity 1,328.3 1,225.6 8%
Total liabilities and equity 31,773.7 27,694.8 15%
Virgin Money plc
Strategic report
3
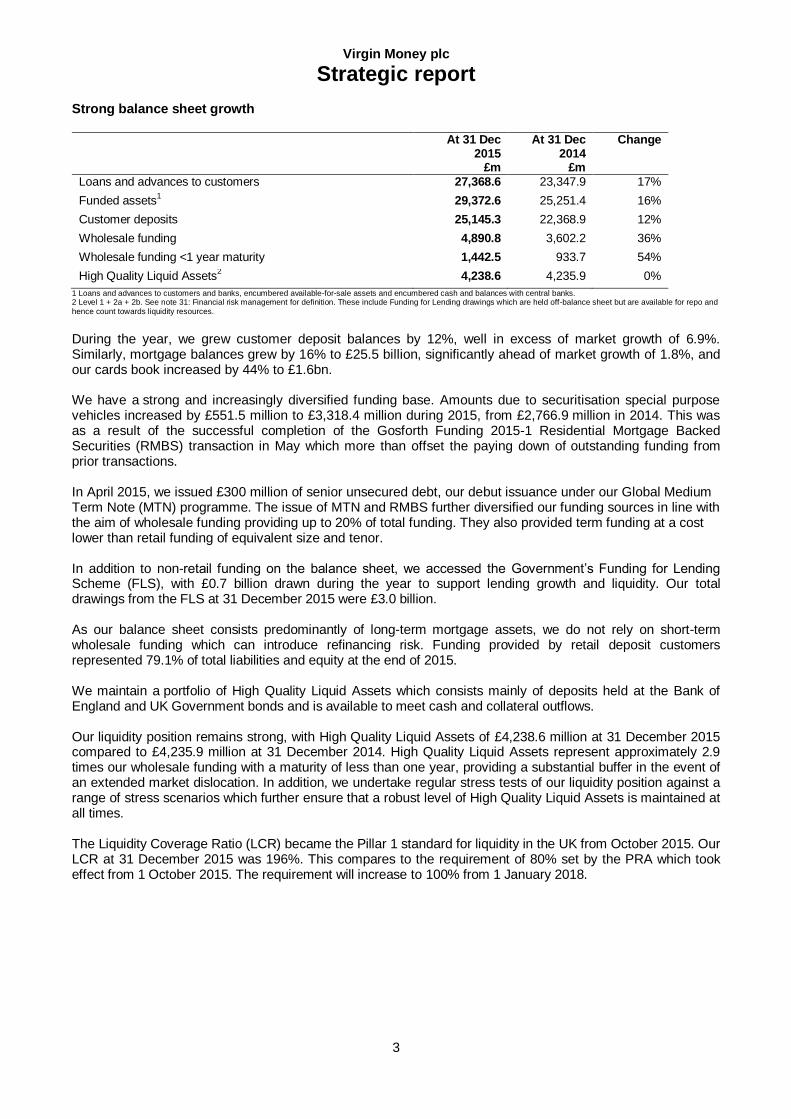
Strong balance sheet growth
At 31 Dec 2015 £m
At 31 Dec 2014
£m
Change
Loans and advances to customers 27,368.6 23,347.9 17%
Funded assets1 29,372.6 25,251.4 16%
Customer deposits 25,145.3 22,368.9 12%
Wholesale funding 4,890.8 3,602.2 36%
Wholesale funding <1 year maturity 1,442.5 933.7 54%
High Quality Liquid Assets2 4,238.6 4,235.9 0%
1 Loans and advances to customers and banks, encumbered available-for-sale assets and encumbered cash and balances with central banks. 2 Level 1 + 2a + 2b. See note 31: Financial risk management for definition. These include Funding for Lending drawings which are held off-balance sheet but are available for repo and hence count towards liquidity resources.
During the year, we grew customer deposit balances by 12%, well in excess of market growth of 6.9%. Similarly, mortgage balances grew by 16% to £25.5 billion, significantly ahead of market growth of 1.8%, and our cards book increased by 44% to £1.6bn. We have a strong and increasingly diversified funding base. Amounts due to securitisation special purpose vehicles increased by £551.5 million to £3,318.4 million during 2015, from £2,766.9 million in 2014. This was as a result of the successful completion of the Gosforth Funding 2015-1 Residential Mortgage Backed Securities (RMBS) transaction in May which more than offset the paying down of outstanding funding from prior transactions. In April 2015, we issued £300 million of senior unsecured debt, our debut issuance under our Global Medium Term Note (MTN) programme. The issue of MTN and RMBS further diversified our funding sources in line with the aim of wholesale funding providing up to 20% of total funding. They also provided term funding at a cost lower than retail funding of equivalent size and tenor. In addition to non-retail funding on the balance sheet, we accessed the Government’s Funding for Lending Scheme (FLS), with £0.7 billion drawn during the year to support lending growth and liquidity. Our total drawings from the FLS at 31 December 2015 were £3.0 billion. As our balance sheet consists predominantly of long-term mortgage assets, we do not rely on short-term wholesale funding which can introduce refinancing risk. Funding provided by retail deposit customers represented 79.1% of total liabilities and equity at the end of 2015. We maintain a portfolio of High Quality Liquid Assets which consists mainly of deposits held at the Bank of England and UK Government bonds and is available to meet cash and collateral outflows. Our liquidity position remains strong, with High Quality Liquid Assets of £4,238.6 million at 31 December 2015 compared to £4,235.9 million at 31 December 2014. High Quality Liquid Assets represent approximately 2.9 times our wholesale funding with a maturity of less than one year, providing a substantial buffer in the event of an extended market dislocation. In addition, we undertake regular stress tests of our liquidity position against a range of stress scenarios which further ensure that a robust level of High Quality Liquid Assets is maintained at all times. The Liquidity Coverage Ratio (LCR) became the Pillar 1 standard for liquidity in the UK from October 2015. Our LCR at 31 December 2015 was 196%. This compares to the requirement of 80% set by the PRA which took effect from 1 October 2015. The requirement will increase to 100% from 1 January 2018.
Virgin Money plc
Strategic report
4
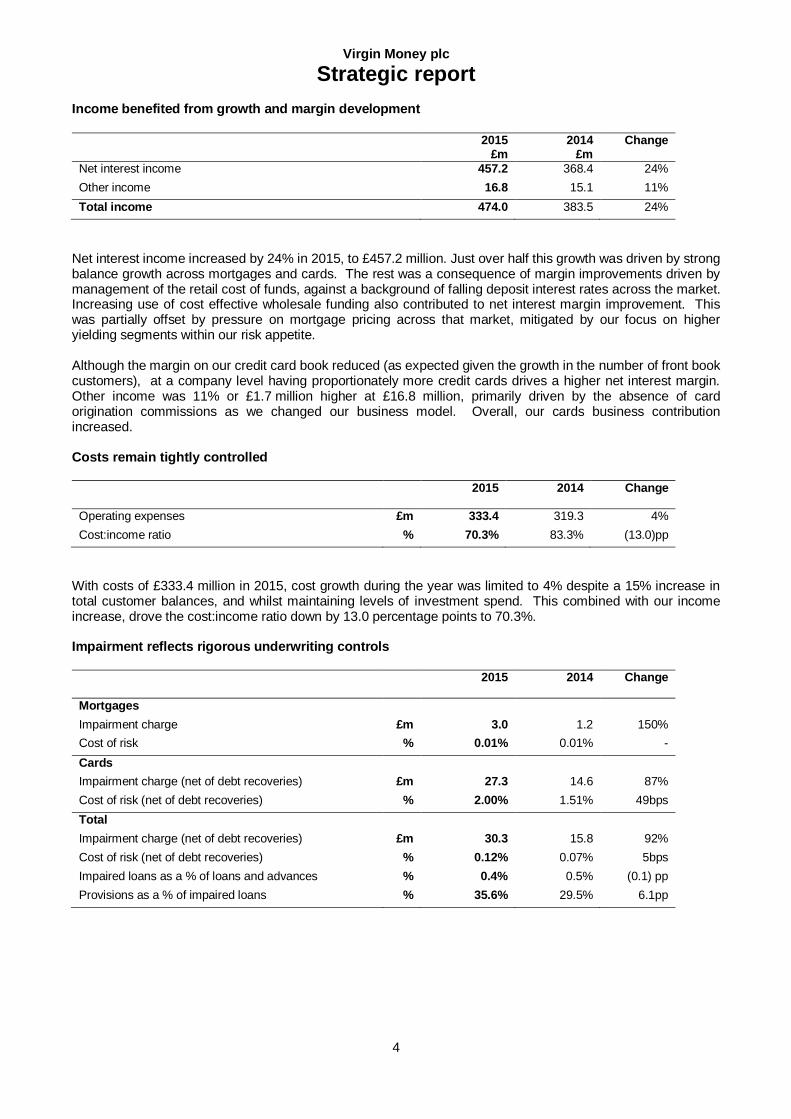
Income benefited from growth and margin development
2015 £m
2014 £m
Change
Net interest income 457.2 368.4 24%
Other income 16.8 15.1 11%
Total income 474.0 383.5 24%
Net interest income increased by 24% in 2015, to £457.2 million. Just over half this growth was driven by strong balance growth across mortgages and cards. The rest was a consequence of margin improvements driven by management of the retail cost of funds, against a background of falling deposit interest rates across the market. Increasing use of cost effective wholesale funding also contributed to net interest margin improvement. This was partially offset by pressure on mortgage pricing across that market, mitigated by our focus on higher yielding segments within our risk appetite. Although the margin on our credit card book reduced (as expected given the growth in the number of front book customers), at a company level having proportionately more credit cards drives a higher net interest margin. Other income was 11% or £1.7 million higher at £16.8 million, primarily driven by the absence of card origination commissions as we changed our business model. Overall, our cards business contribution increased. Costs remain tightly controlled
2015
2014
Change
Operating expenses £m 333.4 319.3 4%
Cost:income ratio % 70.3% 83.3% (13.0)pp
With costs of £333.4 million in 2015, cost growth during the year was limited to 4% despite a 15% increase in total customer balances, and whilst maintaining levels of investment spend. This combined with our income increase, drove the cost:income ratio down by 13.0 percentage points to 70.3%. Impairment reflects rigorous underwriting controls
2015
2014
Change
Mortgages
Impairment charge £m 3.0 1.2 150%
Cost of risk % 0.01% 0.01% -
Cards
Impairment charge (net of debt recoveries) £m 27.3 14.6 87%
Cost of risk (net of debt recoveries) % 2.00% 1.51% 49bps
Total
Impairment charge (net of debt recoveries) £m 30.3 15.8 92%
Cost of risk (net of debt recoveries) % 0.12% 0.07% 5bps
Impaired loans as a % of loans and advances % 0.4% 0.5% (0.1) pp
Provisions as a % of impaired loans % 35.6% 29.5% 6.1pp
Virgin Money plc
Strategic report
5
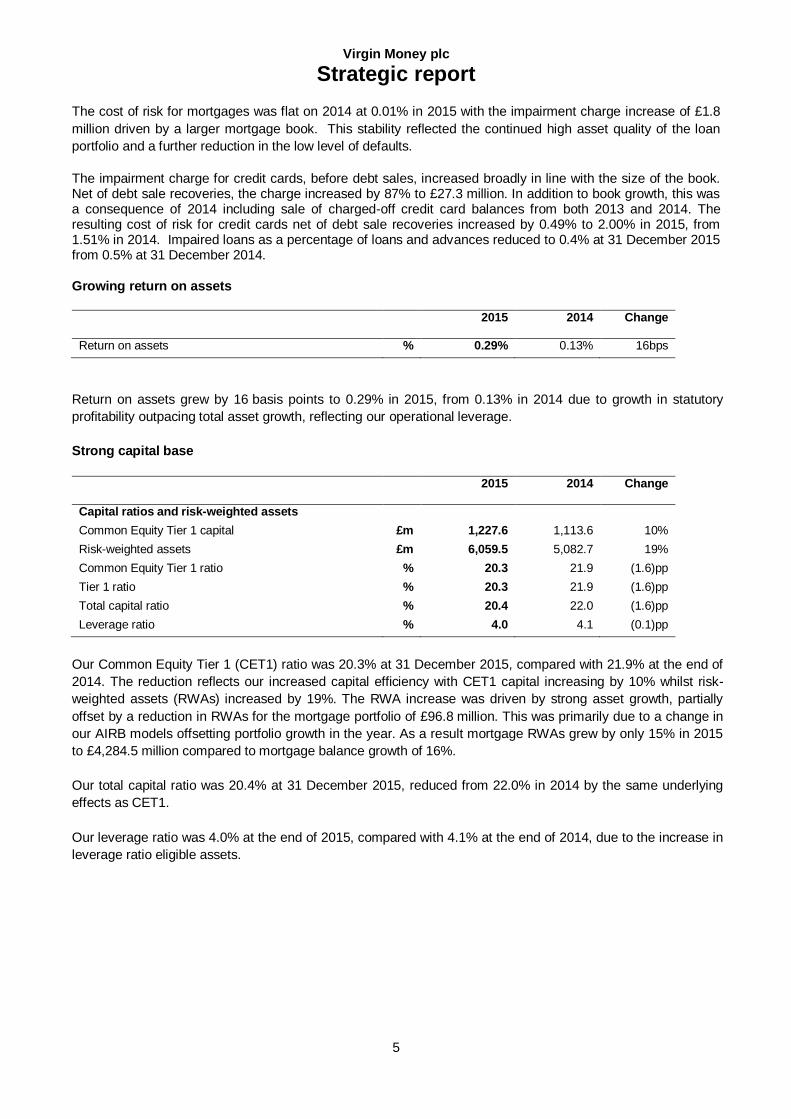
The cost of risk for mortgages was flat on 2014 at 0.01% in 2015 with the impairment charge increase of £1.8
million driven by a larger mortgage book. This stability reflected the continued high asset quality of the loan
portfolio and a further reduction in the low level of defaults.
The impairment charge for credit cards, before debt sales, increased broadly in line with the size of the book. Net of debt sale recoveries, the charge increased by 87% to £27.3 million. In addition to book growth, this was a consequence of 2014 including sale of charged-off credit card balances from both 2013 and 2014. The resulting cost of risk for credit cards net of debt sale recoveries increased by 0.49% to 2.00% in 2015, from 1.51% in 2014. Impaired loans as a percentage of loans and advances reduced to 0.4% at 31 December 2015 from 0.5% at 31 December 2014.
Growing return on assets
2015
2014
Change
Return on assets % 0.29% 0.13% 16bps
Return on assets grew by 16 basis points to 0.29% in 2015, from 0.13% in 2014 due to growth in statutory
profitability outpacing total asset growth, reflecting our operational leverage.
Strong capital base
2015
2014
Change
Capital ratios and risk-weighted assets
Common Equity Tier 1 capital £m 1,227.6 1,113.6 10%
Risk-weighted assets £m 6,059.5 5,082.7 19%
Common Equity Tier 1 ratio % 20.3 21.9 (1.6)pp
Tier 1 ratio % 20.3 21.9 (1.6)pp
Total capital ratio % 20.4 22.0 (1.6)pp
Leverage ratio % 4.0 4.1 (0.1)pp
Our Common Equity Tier 1 (CET1) ratio was 20.3% at 31 December 2015, compared with 21.9% at the end of
2014. The reduction reflects our increased capital efficiency with CET1 capital increasing by 10% whilst risk-
weighted assets (RWAs) increased by 19%. The RWA increase was driven by strong asset growth, partially
offset by a reduction in RWAs for the mortgage portfolio of £96.8 million. This was primarily due to a change in
our AIRB models offsetting portfolio growth in the year. As a result mortgage RWAs grew by only 15% in 2015
to £4,284.5 million compared to mortgage balance growth of 16%.
Our total capital ratio was 20.4% at 31 December 2015, reduced from 22.0% in 2014 by the same underlying
effects as CET1.
Our leverage ratio was 4.0% at the end of 2015, compared with 4.1% at the end of 2014, due to the increase in
leverage ratio eligible assets.
Virgin Money plc
Strategic report
6
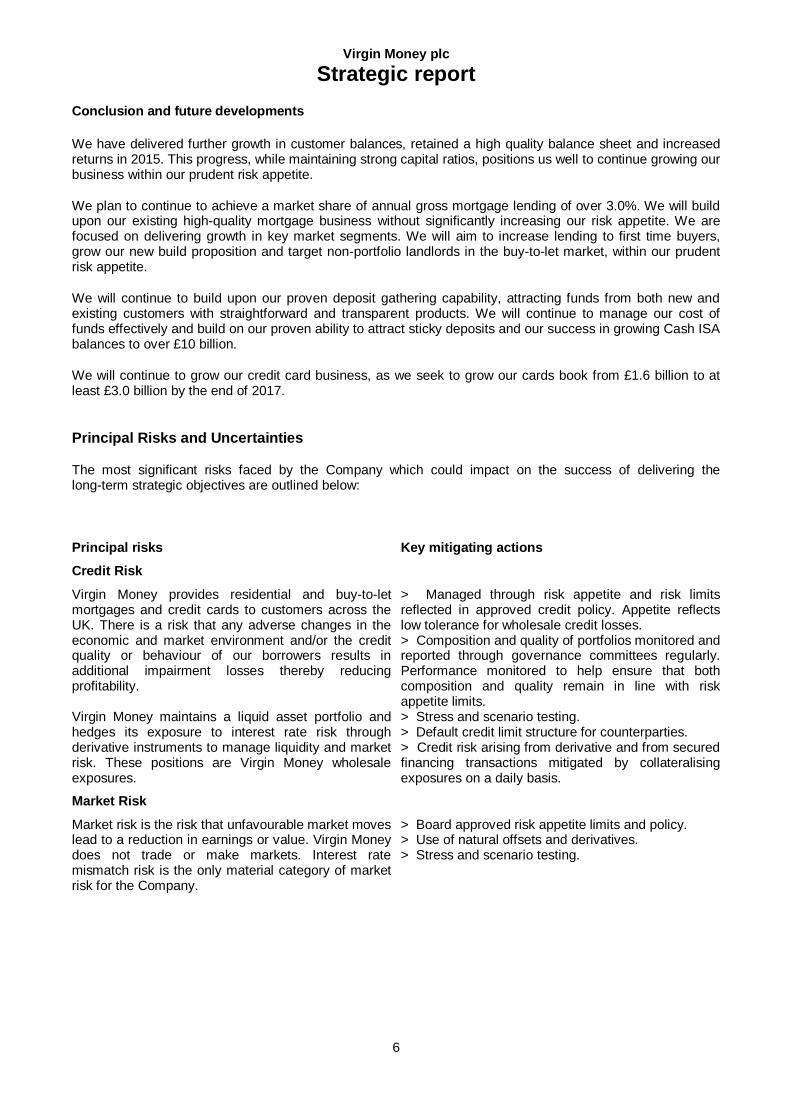
Conclusion and future developments
We have delivered further growth in customer balances, retained a high quality balance sheet and increased returns in 2015. This progress, while maintaining strong capital ratios, positions us well to continue growing our business within our prudent risk appetite.
We plan to continue to achieve a market share of annual gross mortgage lending of over 3.0%. We will build upon our existing high-quality mortgage business without significantly increasing our risk appetite. We are focused on delivering growth in key market segments. We will aim to increase lending to first time buyers, grow our new build proposition and target non-portfolio landlords in the buy-to-let market, within our prudent risk appetite.
We will continue to build upon our proven deposit gathering capability, attracting funds from both new and existing customers with straightforward and transparent products. We will continue to manage our cost of funds effectively and build on our proven ability to attract sticky deposits and our success in growing Cash ISA balances to over £10 billion.
We will continue to grow our credit card business, as we seek to grow our cards book from £1.6 billion to at least £3.0 billion by the end of 2017.
Principal Risks and Uncertainties
The most significant risks faced by the Company which could impact on the success of delivering the long-term strategic objectives are outlined below:
Principal risks Key mitigating actions
Credit Risk
Virgin Money provides residential and buy-to-let mortgages and credit cards to customers across the UK. There is a risk that any adverse changes in the economic and market environment and/or the credit quality or behaviour of our borrowers results in additional impairment losses thereby reducing profitability. Virgin Money maintains a liquid asset portfolio and hedges its exposure to interest rate risk through derivative instruments to manage liquidity and market risk. These positions are Virgin Money wholesale exposures.
> Managed through risk appetite and risk limits reflected in approved credit policy. Appetite reflects low tolerance for wholesale credit losses. > Composition and quality of portfolios monitored and reported through governance committees regularly. Performance monitored to help ensure that both composition and quality remain in line with risk appetite limits. > Stress and scenario testing. > Default credit limit structure for counterparties. > Credit risk arising from derivative and from secured financing transactions mitigated by collateralising exposures on a daily basis.
Market Risk
Market risk is the risk that unfavourable market moves lead to a reduction in earnings or value. Virgin Money does not trade or make markets. Interest rate mismatch risk is the only material category of market risk for the Company.
> Board approved risk appetite limits and policy. > Use of natural offsets and derivatives. > Stress and scenario testing.
Virgin Money plc
Strategic report
7
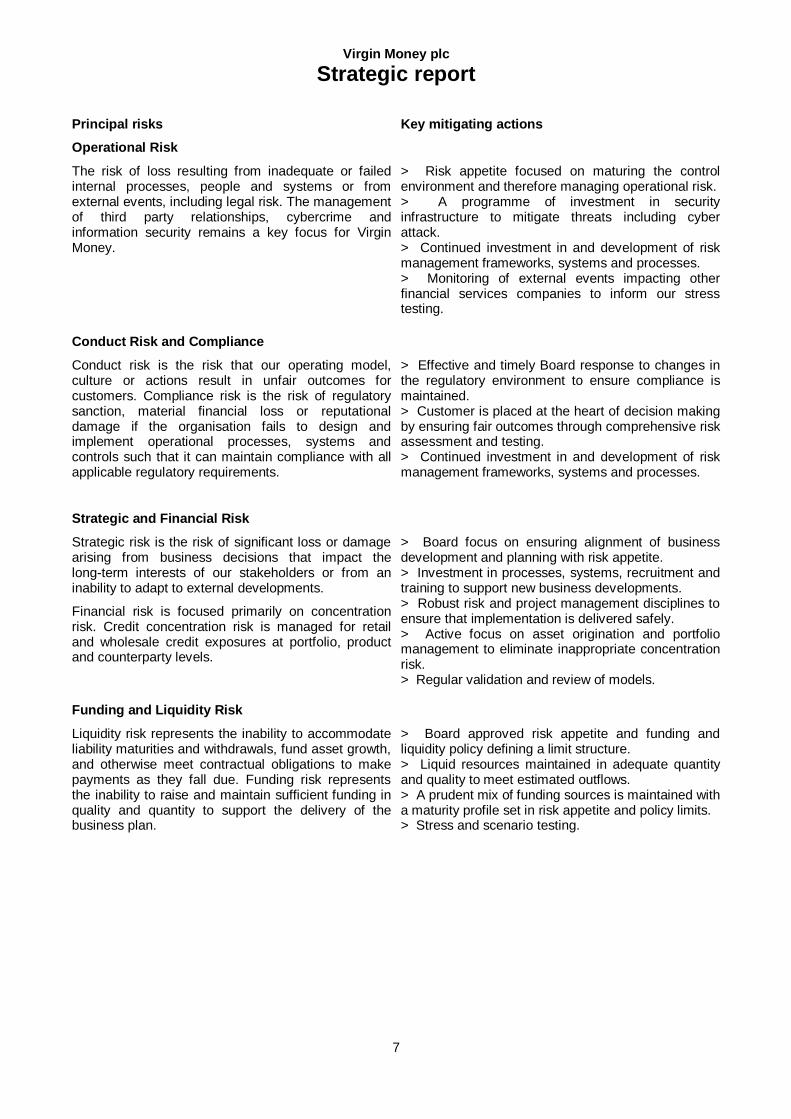
Principal risks Key mitigating actions
Operational Risk
The risk of loss resulting from inadequate or failed internal processes, people and systems or from external events, including legal risk. The management of third party relationships, cybercrime and information security remains a key focus for Virgin Money.
> Risk appetite focused on maturing the control environment and therefore managing operational risk. > A programme of investment in security infrastructure to mitigate threats including cyber attack. > Continued investment in and development of risk management frameworks, systems and processes. > Monitoring of external events impacting other financial services companies to inform our stress testing.
Conduct Risk and Compliance
Conduct risk is the risk that our operating model, culture or actions result in unfair outcomes for customers. Compliance risk is the risk of regulatory sanction, material financial loss or reputational damage if the organisation fails to design and implement operational processes, systems and controls such that it can maintain compliance with all applicable regulatory requirements.
> Effective and timely Board response to changes in the regulatory environment to ensure compliance is maintained. > Customer is placed at the heart of decision making by ensuring fair outcomes through comprehensive risk assessment and testing. > Continued investment in and development of risk management frameworks, systems and processes.
Strategic and Financial Risk
Strategic risk is the risk of significant loss or damage arising from business decisions that impact the long-term interests of our stakeholders or from an inability to adapt to external developments.
Financial risk is focused primarily on concentration risk. Credit concentration risk is managed for retail and wholesale credit exposures at portfolio, product and counterparty levels.
> Board focus on ensuring alignment of business development and planning with risk appetite. > Investment in processes, systems, recruitment and training to support new business developments. > Robust risk and project management disciplines to ensure that implementation is delivered safely. > Active focus on asset origination and portfolio management to eliminate inappropriate concentration risk. > Regular validation and review of models.
Funding and Liquidity Risk
Liquidity risk represents the inability to accommodate liability maturities and withdrawals, fund asset growth, and otherwise meet contractual obligations to make payments as they fall due. Funding risk represents the inability to raise and maintain sufficient funding in quality and quantity to support the delivery of the business plan.
> Board approved risk appetite and funding and liquidity policy defining a limit structure. > Liquid resources maintained in adequate quantity and quality to meet estimated outflows. > A prudent mix of funding sources is maintained with a maturity profile set in risk appetite and policy limits. > Stress and scenario testing.
Virgin Money plc
Strategic report
8
Financial Risk Management Objectives and Policies
Information regarding the financial risk management objectives and policies of the Company, in relation to the use of financial instruments, is given in note 31. Additional information can be found in the Annual Report and Accounts of Virgin Money Holdings (UK) plc, the Company’s ultimate parent, which does not form part of this report.
The Strategic Report has been approved by the Board of Directors.
On behalf of the Board
Jayne-Anne Gadhia CBE 1 March 2016 Chief Executive
Virgin Money plc
Directors’ report
9
Results
The income statement shows a statutory profit before tax for the year ended 31 December 2015 of £110.3 million. Dividends
The Directors do not propose to recommend a final dividend in respect of the year ended 31 December 2015. Post balance sheet events
On 25 January 2016, the Company raised £803.0 million from institutional investors through the Gosforth Funding 2016-1 Residential Mortgage Backed Securities transaction. Going concern
The going concern of the Company is dependent on successfully funding the balance sheet and maintaining adequate levels of capital. In order to satisfy themselves that the Company has adequate resources to continue to operate for the foreseeable future, the Directors have considered a number of key dependencies which are set out in the Strategic Report under Principal Risks and Uncertainties and additionally have considered projections for the Company’s capital and funding position.
Having considered these and made appropriate enquiries, the Directors consider that the Company has adequate reserves to continue in business for a period of at least twelve months from the date of approval of this report. As a result, it is appropriate to continue to adopt the going concern basis in preparing the accounts. Future developments
Information about future developments of the Company can be found in the Strategic Report. Financial risk management objectives and policies
The Company provides a wide range of banking and financial services through a range of channels including online and mobile, intermediaries, call centres and a national network of 75 Stores and six customer Lounges. Information about internal control and financial risk management systems, objectives and policies can be found in the Strategic Report. Information in relation to financial reporting and financial risk management objectives and policies in relation to the use of financial instruments can be found in note 31. Directors
The names of the Directors of the Company at the date of this report are shown on page 1.
Changes to the composition of the Board since 1 January 2015, and up to the date of this report, are shown in the table below:
Name Date of Appointment Date of Retirement
Glen Moreno 1 January 2015 Geeta Gopalan 25 June 2015 Sir David Clementi 30 June 2015 Lee Rochford 31 August 2015 Olivia Dickson 31 December 2015 Appointment and retirement of Directors
The appointment, removal and/or replacement of Directors is governed by the Company’s articles of association (the articles), and the Companies Act 2006 (the Act). The Company’s articles may only be amended by a special resolution of the shareholders in a general meeting.
The Company, as a public limited company, is required to hold an Annual General Meeting (AGM) at which one third of its Directors must retire from office every year. At the Company’s 2015 AGM Norman McLuskie, Marilyn H Spearing and Lee Rochford retired, submitted themselves for re-election and were duly re-elected.
Virgin Money plc
Directors’ report
10
Corporate Governance
Details of the corporate governance framework applying to the Company is set out in the Corporate Governance Report within the Annual Report and Accounts of the Group for the year ended 31 December 2015. Directors’ indemnities
The Directors of the Company, including former Directors who stepped down during the year, have entered into individual deeds of indemnity with the Company which constituted ‘qualifying third party indemnity provisions’ for the purposes of the Act. The deeds indemnify the Directors to the maximum extent permitted by law and remain in force for the duration of a Director’s period of office and for a period of six years thereafter. The deeds were in force during the whole of the financial year or from the date of appointment for those Directors appointed in 2015. Deeds for existing Directors are available for inspection at Virgin Money’s registered office. In addition, the Company had appropriate Directors’ and Officers’ insurance cover in place throughout 2015. Share capital, control and Directors’ powers
Information about share capital of the Company is shown in note 27 to the financial statements and is incorporated into this report by reference.
The powers of the Directors, including in relation to the issue or repurchase of the Company’s shares, are set out in the Company’s articles and the Act. The Company did not repurchase any of the issued Ordinary Shares during the year or up to the date of this report (2014: none).
There are no restrictions on the transfers of shares other than set out in the Company’s articles or the Act. Change of control
Virgin Money is not a party to any significant contracts that are subject to change of control provisions in the event of a takeover bid, other than the Virgin Money Trademark Licence Agreement. This is the agreement under which Virgin Enterprises Limited (VEL) grants a perpetual licence to Virgin Money providing the right to use the “Virgin” and “Virgin Money” trademarks. VEL has the right to terminate the agreement in the event of a change of control of the Group, other than a change of control pre-approved by VEL. VEL shall only be entitled to withhold consent in the event of a takeover by a third party who, in VEL’s reasonable opinion is a direct competitor of VEL or any Virgin entity in the UK or whose reputation or financial standing is reasonably likely to materially damage the value or reputation of the “Virgin” marks.
There are no agreements between Virgin Money and its Directors or employees providing compensation for loss of office or employment that occurs because of a takeover. In the event of a takeover or other change of control (excluding an internal reorganisation), outstanding awards under the Group's share plans vest to the extent any applicable performance conditions have been met, and subject to applicable time pre-rating, in accordance with the rules of the plans. Significant contracts
Details of related party transactions are set out in note 34 to the financial statements. Research and development activities
Virgin Money does not undertake formal research and development activities but does invest in the development of platforms and products. Employees
Virgin Money, as part of the Virgin Money Holdings (UK) plc Group, is committed to providing employment practices and policies which recognise the diversity of its workforce. The Company will not unfairly discriminate in the recruitment or employment practices on the basis of any factor which is not relevant to individuals’ performance including sex, race, disability, age, sexual orientation or religious belief. Additional information can be found in the Strategic Report within the 2015 Group Annual Report and Accounts.
Virgin Money plc
Directors’ report
11
Statement of Directors’ responsibilities
The Directors are responsible for preparing the Strategic Report, the Directors’ Report and the financial statements in accordance with applicable law and regulations. Company law requires the Directors to prepare financial statements for each financial year. Under that law they have elected to prepare the financial statements in accordance with IFRSs as adopted by the EU and applicable law.
Under company law, the Directors must not approve the financial statements unless they are satisfied that they give a true and fair view of the state of affairs of the Company and of the profit or loss of the Company for that period. In preparing these financial statements, the Directors are required to:
> select suitable accounting policies and then apply them consistently;
> make judgements and estimates that are reasonable and prudent;
> state whether they have been prepared in accordance with IFRSs as adopted by the EU; and
> prepare the financial statements on the going concern basis unless it is inappropriate to presume that the Company will continue in business.
The Directors are responsible for keeping adequate accounting records that are sufficient to show and explain the Company’s transactions and disclose with reasonable accuracy at any time the financial position of the Company and enable them to ensure that the financial statements comply with the Companies Act 2006. They have general responsibility for taking such steps as are reasonably open to them to safeguard the assets of the Company and to prevent and detect fraud and other irregularities.
The Directors are responsible for the maintenance and integrity of the corporate and financial information included on the Virgin Money Group website, www.virginmoney.com. Legislation in the UK governing the preparation and dissemination of financial statements may differ from legislation in other jurisdictions. Responsibility statement of the Directors in respect of the Annual Financial Report
Each of the Directors confirms that to the best of his or her knowledge:
> the financial statements, prepared in accordance with the applicable set of accounting standards, give a true and fair view of the assets, liabilities, financial position and profit or loss of the Company; and
> the Strategic Report and Directors’ Report includes a fair review of the development and performance of the business and the position of the Company together with a description of the principal risks and uncertainties that it faces.
Independent auditor and audit information
Each of the current Directors, who are in office at the date of approval of this report confirms that, to the best of his or her knowledge, there is no relevant audit information of which the Company’s auditor is unaware and each Director has taken all the steps that he or she ought to have taken as a Director to make himself or herself aware of any relevant audit information and to establish that Virgin Money’s auditor is aware of that information. This confirmation is given and should be interpreted in accordance with the provisions of the Act.
Pursuant to Section 491 of the Companies Act 2006, the auditor was be deemed to be reappointed and therefore KPMG LLP continued in office for the financial period 1 January 2015 to 31 December 2015. Following a tender process for the audit of Virgin Money Holdings (UK) plc and its subsidiaries that took place in 2015, it was recommended that PricewaterhouseCoopers LLP be appointed as auditor for the Virgin Money Group of entities effective for periods ending on or after 1 January 2016. As a result KPMG LLP will not be seeking reappointment as the Company's auditor for the financial year commencing 1 January 2016 and PricewaterhouseCoopers LLP will seek appointment instead at the Company’s 2016 AGM.
Katie Marshall 1 March 2016 Company Secretary Virgin Money plc Registered No. 06952311
Virgin Money plc
Independent auditor’s report
12
INDEPENDENT AUDITOR’S REPORT TO THE MEMBERS OF VIRGIN MONEY PLC
We have audited the financial statements of Virgin Money plc for the year ended 31 December 2015 set out on pages 13 to 83. The financial reporting framework that has been applied in their preparation is applicable law and International Financial Reporting Standards (IFRSs) as adopted by the EU. This report is made solely to the Company’s members, as a body, in accordance with Chapter 3 of Part 16 of the Companies Act 2006. Our audit work has been undertaken so that we might state to the Company’s members those matters we are required to state to them in an auditor’s report and for no other purpose. To the fullest extent permitted by law, we do not accept or assume responsibility to anyone other than the Company and the Company’s members, as a body, for our audit work, for this report, or for the opinions we have formed. Respective responsibilities of directors and auditor
As explained more fully in the Directors’ Responsibilities Statement set out on page 11, the directors are responsible for the preparation of the financial statements and for being satisfied that they give a true and fair view. Our responsibility is to audit, and express an opinion on, the financial statements in accordance with applicable law and International Standards on Auditing (UK and Ireland). Those standards require us to comply with the Auditing Practices Board’s Ethical Standards for Auditors. Scope of the audit of the financial statements
A description of the scope of an audit of financial statements is provided on the Financial Reporting Council’s website at www.frc.org.uk/auditscopeukprivate. Opinion on financial statements
In our opinion the financial statements: > give a true and fair view of the state of the Company’s affairs as at 31 December 2015 and of its profit
for the year then ended;
> have been properly prepared in accordance with IFRSs as adopted by the EU; and
> have been prepared in accordance with the requirements of the Companies Act 2006.
Opinion on other matter prescribed by the Companies Act 2006
In our opinion the information given in the Strategic Report and the Directors’ Report for the financial year for which the financial statements are prepared is consistent with the financial statements. Matters on which we are required to report by exception
We have nothing to report in respect of the following matters where the Companies Act 2006 requires us to report to you if, in our opinion:
> adequate accounting records have not been kept, or returns adequate for our audit have not been received from branches not visited by us; or
> the financial statements are not in agreement with the accounting records and returns; or
> certain disclosures of directors’ remuneration specified by law are not made; or
> we have not received all the information and explanations we require for our audit. John Ellacott (Senior Statutory Auditor) for and on behalf of KPMG LLP, Statutory Auditor Chartered Accountants 15 Canada Square London E14 5GL
1 March 2016
Virgin Money plc
Income statement
13
For the year ended 31 December
Note 2015
£m 2014
£m
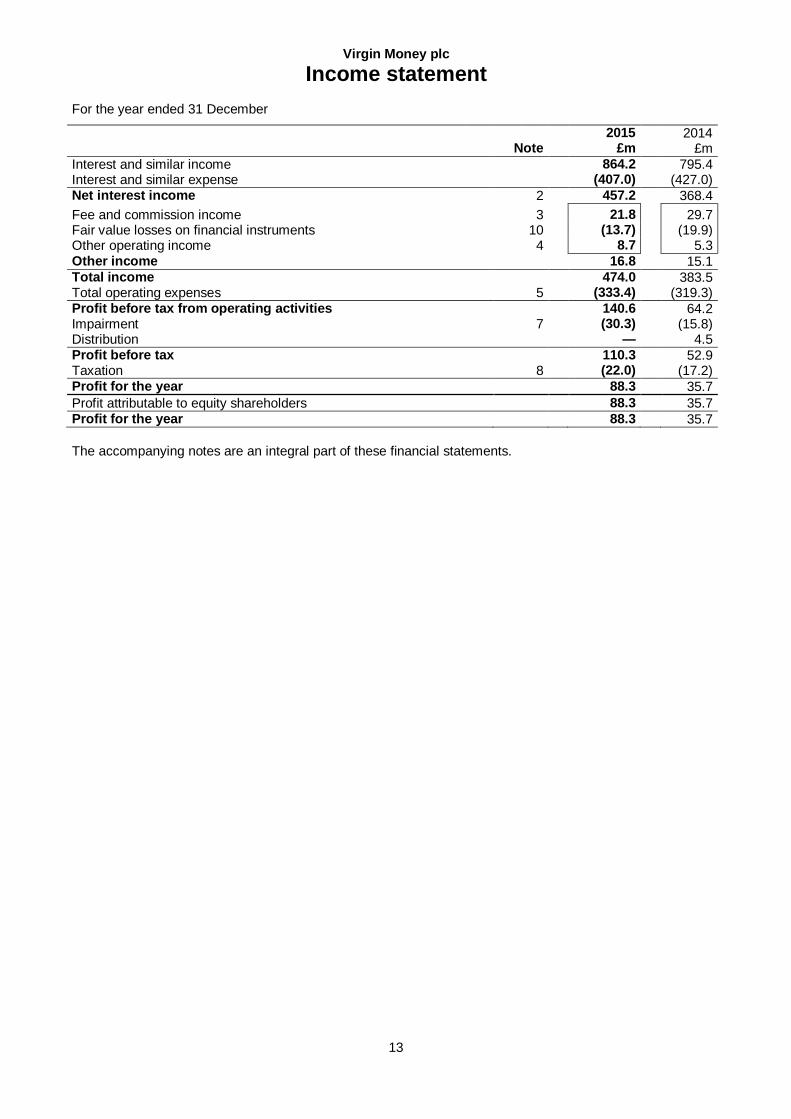
Interest and similar income 864.2 795.4 Interest and similar expense (407.0) (427.0) Net interest income 2 457.2 368.4
Fee and commission income 3 21.8 29.7 Fair value losses on financial instruments 10 (13.7) (19.9) Other operating income 4 8.7 5.3 Other income 16.8 15.1 Total income 474.0 383.5 Total operating expenses 5 (333.4) (319.3) Profit before tax from operating activities 140.6 64.2 Impairment 7 (30.3) (15.8) Distribution — 4.5 Profit before tax 110.3 52.9 Taxation 8 (22.0) (17.2) Profit for the year 88.3 35.7
Profit attributable to equity shareholders 88.3 35.7 Profit for the year 88.3 35.7
The accompanying notes are an integral part of these financial statements.
Virgin Money plc
Statement of comprehensive income
14
For the year ended 31 December
Note 2015
£m 2014
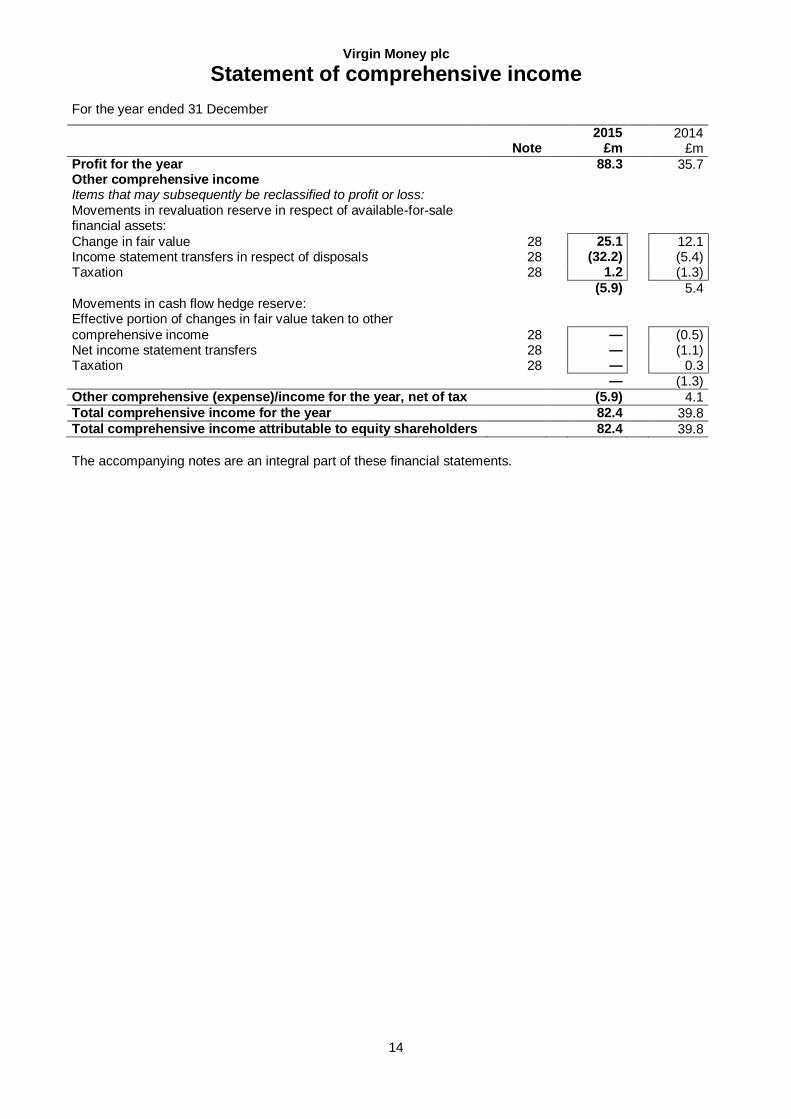
£m Profit for the year 88.3 35.7 Other comprehensive income Items that may subsequently be reclassified to profit or loss: Movements in revaluation reserve in respect of available-for-sale financial assets:
Change in fair value 28 25.1 12.1 Income statement transfers in respect of disposals 28 (32.2) (5.4) Taxation 28 1.2 (1.3)
(5.9) 5.4 Movements in cash flow hedge reserve: Effective portion of changes in fair value taken to other
comprehensive income 28 — (0.5) Net income statement transfers 28 — (1.1) Taxation 28 — 0.3 — (1.3) Other comprehensive (expense)/income for the year, net of tax (5.9) 4.1 Total comprehensive income for the year 82.4 39.8 Total comprehensive income attributable to equity shareholders 82.4 39.8
The accompanying notes are an integral part of these financial statements.
Virgin Money plc
Balance sheet
15
As at 31 December
Note 2015
£m 2014
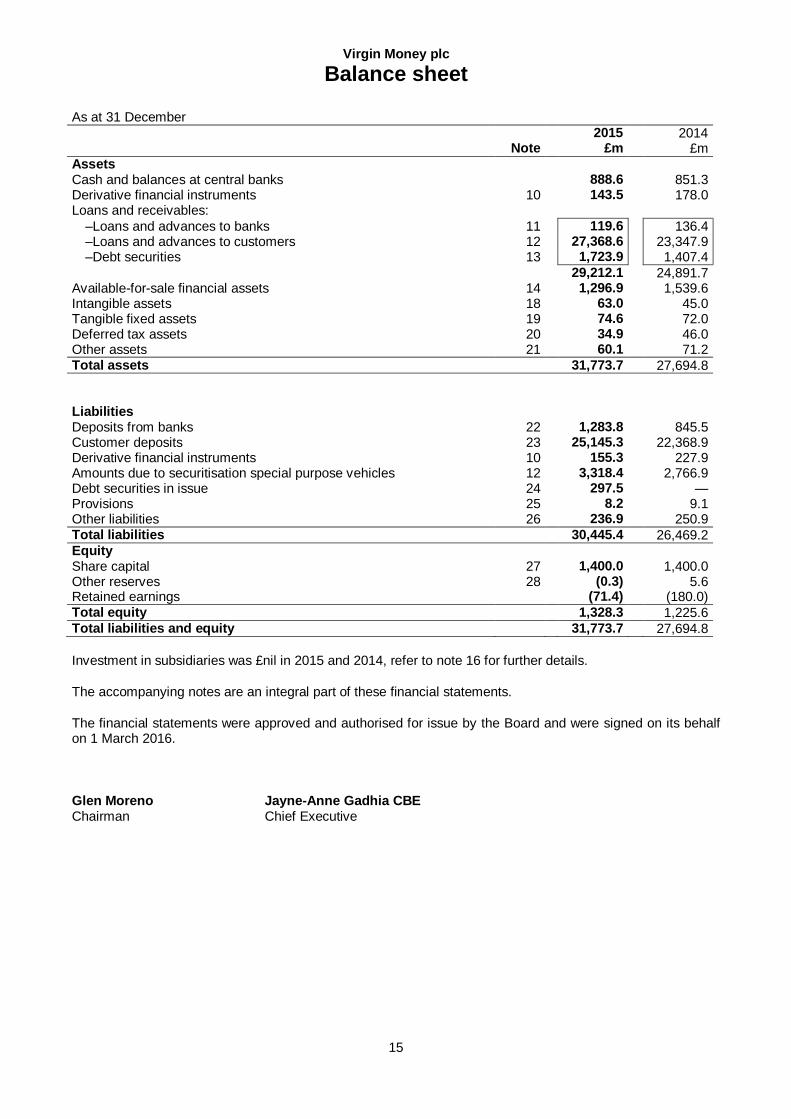
£m Assets Cash and balances at central banks 888.6 851.3 Derivative financial instruments 10 143.5 178.0 Loans and receivables:
–Loans and advances to banks 11 119.6 136.4 –Loans and advances to customers 12 27,368.6 23,347.9 –Debt securities 13 1,723.9 1,407.4
29,212.1 24,891.7 Available-for-sale financial assets 14 1,296.9 1,539.6 Intangible assets 18 63.0 45.0 Tangible fixed assets 19 74.6 72.0 Deferred tax assets 20 34.9 46.0 Other assets 21 60.1 71.2 Total assets 31,773.7 27,694.8 Liabilities Deposits from banks 22 1,283.8 845.5 Customer deposits 23 25,145.3 22,368.9 Derivative financial instruments 10 155.3 227.9 Amounts due to securitisation special purpose vehicles 12 3,318.4 2,766.9 Debt securities in issue 24 297.5 — Provisions 25 8.2 9.1 Other liabilities 26 236.9 250.9 Total liabilities 30,445.4 26,469.2 Equity Share capital 27 1,400.0 1,400.0 Other reserves 28 (0.3) 5.6 Retained earnings (71.4) (180.0) Total equity 1,328.3 1,225.6 Total liabilities and equity 31,773.7 27,694.8
Investment in subsidiaries was £nil in 2015 and 2014, refer to note 16 for further details.
The accompanying notes are an integral part of these financial statements.
The financial statements were approved and authorised for issue by the Board and were signed on its behalf on 1 March 2016.
Glen Moreno Jayne-Anne Gadhia CBE Chairman Chief Executive
Virgin Money plc
Statement of changes in equity
16
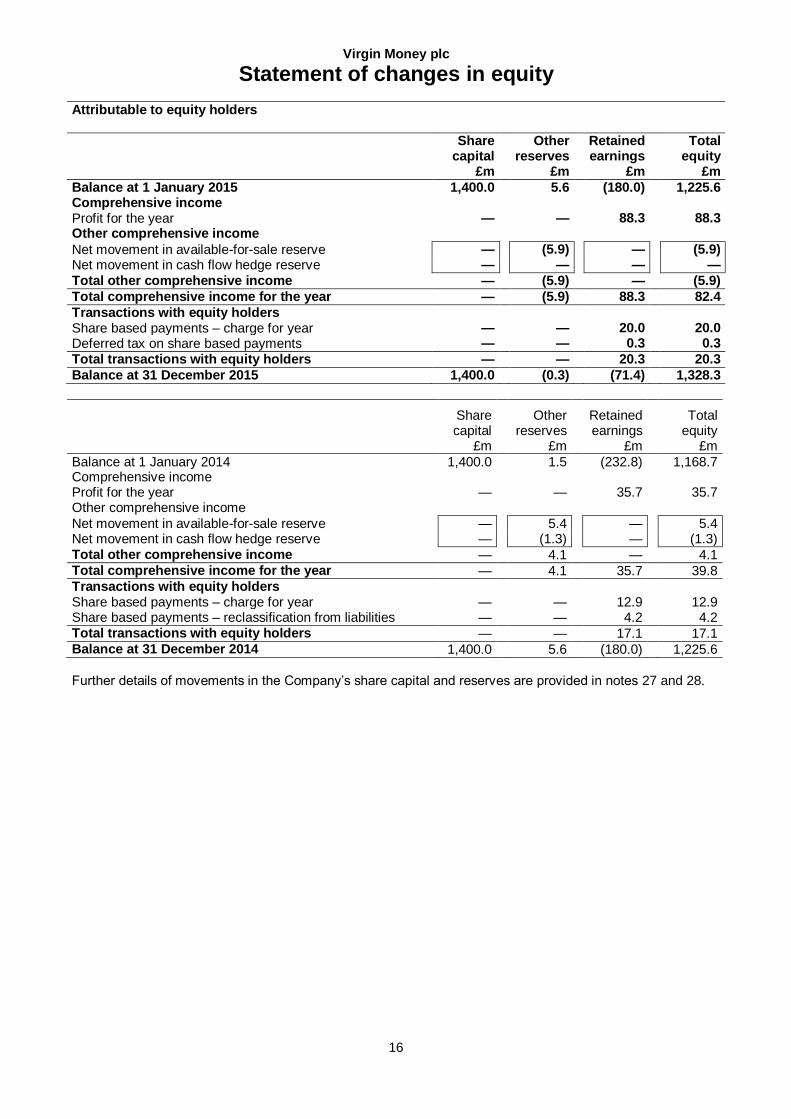
Attributable to equity holders
Share capital
£m
Other reserves
£m
Retained earnings
£m
Total equity
£m
Balance at 1 January 2015 1,400.0 5.6 (180.0) 1,225.6 Comprehensive income Profit for the year — — 88.3 88.3 Other comprehensive income
Net movement in available-for-sale reserve — (5.9) — (5.9) Net movement in cash flow hedge reserve — — — —
Total other comprehensive income — (5.9) — (5.9)
Total comprehensive income for the year — (5.9) 88.3 82.4
Transactions with equity holders Share based payments – charge for year — — 20.0 20.0 Deferred tax on share based payments — — 0.3 0.3
Total transactions with equity holders — — 20.3 20.3
Balance at 31 December 2015 1,400.0 (0.3) (71.4) 1,328.3
Share capital
£m
Other reserves
£m
Retained earnings
£m
Total equity
£m
Balance at 1 January 2014 1,400.0 1.5 (232.8) 1,168.7 Comprehensive income Profit for the year — — 35.7 35.7 Other comprehensive income
Net movement in available-for-sale reserve — 5.4 — 5.4 Net movement in cash flow hedge reserve — (1.3) — (1.3) Total other comprehensive income — 4.1 — 4.1 Total comprehensive income for the year — 4.1 35.7 39.8 Transactions with equity holders Share based payments – charge for year — — 12.9 12.9 Share based payments – reclassification from liabilities — — 4.2 4.2 Total transactions with equity holders — — 17.1 17.1 Balance at 31 December 2014 1,400.0 5.6 (180.0) 1,225.6
Further details of movements in the Company’s share capital and reserves are provided in notes 27 and 28.
Virgin Money plc
Cash flow statement
17
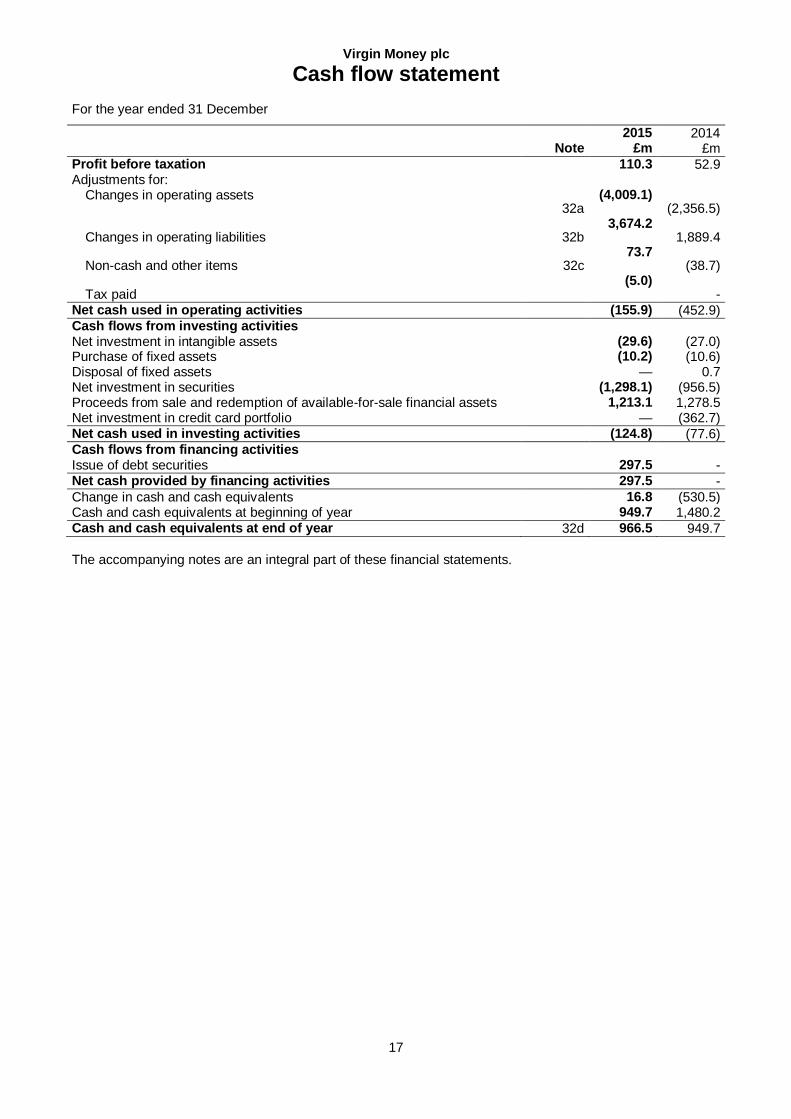
For the year ended 31 December
Note
2015 £m
2014 £m
Profit before taxation 110.3 52.9 Adjustments for:
Changes in operating assets 32a
(4,009.1) (2,356.5)
Changes in operating liabilities 32b 3,674.2
1,889.4
Non-cash and other items 32c 73.7
(38.7)
Tax paid (5.0)
- Net cash used in operating activities (155.9) (452.9) Cash flows from investing activities Net investment in intangible assets (29.6) (27.0) Purchase of fixed assets (10.2) (10.6) Disposal of fixed assets — 0.7 Net investment in securities (1,298.1) (956.5) Proceeds from sale and redemption of available-for-sale financial assets 1,213.1 1,278.5 Net investment in credit card portfolio — (362.7) Net cash used in investing activities (124.8) (77.6) Cash flows from financing activities Issue of debt securities 297.5 - Net cash provided by financing activities 297.5 -
Change in cash and cash equivalents 16.8 (530.5) Cash and cash equivalents at beginning of year 949.7 1,480.2 Cash and cash equivalents at end of year 32d 966.5 949.7
The accompanying notes are an integral part of these financial statements.
Virgin Money plc
Notes to the financial statements
18
Note 1: Basis of preparation
1.1 Reporting entity
Virgin Money plc (the Company) is a company incorporated and registered in England and Wales. The registered office is Jubilee House, Gosforth, Newcastle-Upon-Tyne, NE3 4PL. The Company was incorporated as a private limited company with registered number 06952311.
1.2 Basis of preparation
The Company financial statements, which should be read in conjunction with the Strategic Report and the Directors’ Report, have been prepared on a going concern basis in accordance with International Financial Reporting Standards (IFRS) as adopted by the EU and with those parts of the Companies Act 2006 applicable to companies reporting under IFRS.
The Directors have reviewed the strategic plan which shows the financial position, cash flow, liquidity and capital forecasts for the Company. The Directors are confident that they show that the Company will have sufficient resources to meet its liabilities as they fall due. Accordingly the Directors believe that it remains appropriate to prepare the financial statements on a going concern basis.
As permitted by section 400 of the Companies Act 2006 the Company has not prepared consolidated financial statements.
1.3 Changes in accounting policy
New standards, amendments to standards or interpretations adopted
The following amendment to IFRS 13 is mandatory for annual reporting periods beginning on or after 1 January 2015, has been endorsed for adoption by the EU and has been adopted by the Company during the year ended 31 December 2015:
> Amendment to IFRS 13, ‘Fair value measurement’
The amendment clarifies that the portfolio exception in IFRS 13, which allows an entity to measure the fair value of a group of financial assets and financial liabilities on a net basis, applies to all contracts (including non-financial contracts) within the scope of IAS 39 or IFRS 9. This amendment did not have a significant impact on the Company when adopted.
There are no other standards, amendments to standards or interpretations that are applicable in the year which have a material impact on these financial statements.
New accounting standards issued by the IASB which are effective in future periods are presented in note 37.
1.4 Basis of measurement
The financial statements have been prepared under the historical cost convention as modified by the revaluation of derivative financial instruments, available-for-sale and other assets held at fair value through profit or loss. A summary of the material accounting policies of the Company are included within note 1.6.
The accounting policies set out in note 1.6 have been applied consistently to all periods presented in these financial statements.
1.5 Foreign currency translation
The Company’s financial statements are presented in sterling, which is the functional currency of the Company.
Foreign currency transactions are translated into functional currency using the exchange rates prevailing at the dates of the transactions. Monetary items denominated in foreign currencies are translated at the rate prevailing at the balance sheet date. Foreign exchange gains and losses resulting from the restatement and settlement of such transactions are recognised in the income statement, except when recognised in other comprehensive income if relating to a qualifying cash flow hedge or available-for-sale assets. Non-monetary items (which are assets or liabilities which do not attach to a right to receive or an obligation to pay currency) measured at amortised cost and denominated in foreign currencies are translated at the exchange rate at the date of the transaction. Non-monetary items measured at fair value are translated at the exchange rate at the date of valuation. Where these are held at fair value through the income statement, exchange differences are reported as part of the fair value gain or loss.
Virgin Money plc
Notes to the financial statements
19
Note 1: Basis of preparation (continued)
1.6 Accounting policies
The accounting policies of the Company are set out below:
1.6.1 Interest income and expense
Interest income and expense are recognised in the income statement for all instruments measured at amortised cost using the effective interest rate method.
This method calculates the amortised cost of a financial asset or liability, and allocates the interest income or expense over the relevant period. The effective interest rate is the rate that exactly discounts estimated future cash receipts or payments through the expected life of the financial instrument or, where appropriate, a shorter period to the net carrying amount of the financial asset or liability. The Company estimates cash flows considering all contractual terms of the financial instrument (for example prepayment options) but does not consider future credit losses. The calculation includes all amounts received or paid by the Company that are an integral part of the overall return, direct incremental transaction costs related to the acquisition or issue of a financial instrument and all other premiums and discounts.
Once a financial asset or Company of similar financial assets has been written down as a result of an impairment loss, interest income is recognised using the rate of interest used to discount the future cash flows for the purpose of measuring the impairment loss.
Interest receivable or payable on derivatives, whether in economic or accounting hedges, is recorded on an accrual basis in interest receivable or payable. Interest on available-for-sale (AFS) debt securities is recorded in interest receivable using the effective interest rate method.
1.6.2 Fees and commissions
Where they are not included in the effective interest rate calculation, fees and commissions are recognised on an accruals basis when the service has been received or provided. Loan commitment fees for loans that are likely to be drawn down are deferred (together with related incremental direct costs) and recognised as an adjustment to the effective interest rate on the loan.
1.6.3 Other operating income
Other operating income comprises the fair value for services, net of value added tax, rebates and discounts. Other operating income is attributable to credit cards.
The Company recognises ongoing credit card income from strategic partners as other income.
1.6.4 Total operating expense
Operating expenses are recognised on an accruals basis as services are provided. Included within the employee benefits expense are employee share based payments. The accounting policy in relation to share based payments is set out in policy 1.6.5.
Staff costs
The Company accounts for the following components of employee costs on the following bases:
> Short-term employee benefits
Short-term employee benefits include salaries and social security costs and are recognised over the period in which the employees provide the services to which the payments relate.
Cash bonus awards are recognised to the extent that the Company has a present obligation to its employees that can be measured reliably and are recognised over the period of service that employees are required to work to qualify for the payment.
> Other long-term employee benefits
Other long-term employee benefits include deferred cash bonus awards. Deferred cash bonus awards are recognised at the present value of the obligation at the reporting date. These costs are recognised over the period of service that employees are required to work to qualify for the payment.
Retirement benefit obligations
A defined contribution plan is a post-employment benefit plan into which the Company pays fixed contributions and has no legal or constructive obligation to pay further amounts. Contributions are recognised as staff expenses in the income statement in the periods during which related employee services are fulfilled.
The Company operates defined contribution pension schemes for its Directors and employees. The assets of the schemes are held separately from those of the Company in independently administered funds.
Virgin Money plc
Notes to the financial statements
20
Note 1: Basis of preparation (continued)
Leases
If the lease agreement in which the Company is a lessee transfers the risks and rewards of the asset, the lease is recorded as a finance lease and the related asset is capitalised. At inception, the asset is recorded at the lower of the present value of the minimum lease payments or fair value and is depreciated over the estimated useful life. The lease obligations are recorded as borrowings.
If the lease does not transfer the risks and rewards of the asset, the lease is recorded as an operating lease.
Operating lease payments are charged to profit or loss on a straight line basis over the lease term unless a different systematic basis is more appropriate. Where an operating lease is terminated before the lease period has expired, any payment required to be made to the lessor in compensation is charged to profit or loss in the period in which termination is made.
1.6.5 Share based payments
The Group puts in place share schemes for employees to reward strong long-term business performance and to incentivise growth for the future.
The Group engages in equity and cash settled share based payment transactions in respect of services received from certain of its employees.
For equity settled share based payments, employees are employed by the Company but receive Virgin Money Holdings (UK) plc Ordinary Shares.
For equity settled share based payment transactions the grant date fair value of the award is recognised as an employee expense with a corresponding increase in equity over the period that the employees become unconditionally entitled to the awards.
The grant date fair value of the award is determined using valuation models which take into account the terms and conditions attached to the awards. Inputs into valuation models may include the exercise price, the risk-free interest rate, the expected volatility of Virgin Money Holdings (UK) plc’s share price and other various factors which relate to performance conditions attached to the awards.
The amount recognised as an expense is adjusted to reflect the actual number of awards for which the related service and non-market vesting conditions are expected to be met such that the amount ultimately recognised as an expense is based on the number of awards that do meet the related service and non-market performance conditions at the vesting date.
For share based payment awards with market performance conditions or non-vesting conditions the grant date fair value of the award is measured to reflect such conditions and there is no true-up for differences between expected and actual outcomes.
For cash settled share based payment transactions the fair value of the amount payable to the employee is recognised as an expense with a corresponding increase in liabilities. The fair value is initially measured at grant date and spread over the period during which the employees become unconditionally entitled to payment. The fair value is measured based on a valuation model taking into account the terms and conditions of the grant. The liability is revalued at each balance sheet date and settlement date with any changes to fair value being recognised in profit or loss.
1.6.6 Impairment losses
The Company assesses its financial assets or groups of financial assets for objective evidence of impairment at each balance sheet date. An impairment loss is recognised if and only if there is a loss event (or events) that has occurred after initial recognition, and on or before the balance sheet date, that has a reliably measurable impact on the estimated future cash flows of the financial assets or groups of financial assets. Losses that are incurred as a result of events occurring after the balance sheet date are not recognised in these financial statements.
Assets held at amortised cost
The Company first assesses whether objective evidence of impairment exists individually for financial assets that are individually significant, and individually or collectively for financial assets that are not individually significant. Objective evidence that a financial asset is impaired includes observable data that comes to the attention of the Company about the following loss events:
> there is evidence of the customer or issuer experiencing financial difficulty;
> there is a breach of contract, such as a default or delinquency in repayments;
> the customer is granted a concession that would otherwise not be considered;
> the borrower will enter bankruptcy or other financial reorganisation;
Virgin Money plc
Notes to the financial statements
21
Note 1: Basis of preparation (continued)
> the disappearance of an active market for that financial asset because of financial difficulties; and
> observable data indicating that there is a measurable decrease in the estimated future cash flows from a portfolio of assets since the initial recognition of those assets, although the decrease cannot yet be identified with the individual financial assets in the portfolio, including:
> there are adverse changes in the payment status of borrowers in the portfolio; and
> economic conditions that correlate with defaults on the assets in the portfolio
If the Company determines that no objective evidence of impairment exists for an individually assessed financial asset, whether significant or not, it includes the asset in a Company of financial assets with similar credit risk characteristics and collectively assesses them for impairment. In assessing collective impairment the Company uses statistical modelling of historic trends to assess the probability of a Company of financial assets going into default and the subsequent loss incurred. Regular model monitoring is performed to ensure model assumptions remain appropriate.
Assets that are individually assessed and for which an impairment loss is or continues to be recognised are not included in a collective assessment of impairment.
If there is objective evidence that an impairment loss on loans and receivables has been incurred, the amount of the loss is measured as the difference between the asset carrying amount and the present value of the estimated future cash flows (excluding future credit losses that have not been incurred) discounted at the financial asset’s original effective interest rate. The carrying amount of the asset is reduced through the use of an impairment allowance and the amount of the loss is recognised in the profit or loss.
When a loan or receivable is uncollectible, it is written off against the related provision for loan impairment. Such loans are written off after all the necessary procedures have been completed and the amount of the loss has been determined. Subsequent recoveries of amounts previously written off are recognised directly in the income statement. If, in a subsequent period, the amount of the impairment loss decreases and the decrease can be related objectively to an event occurring after the impairment was recognised (such as an improvement in the customer’s credit rating), the previously recognised impairment loss is reversed by adjusting the impairment allowance. The amount of the reversal is recognised in profit or loss.
A provision is also made in the case of accounts, which may not currently be in arrears, where losses may have been incurred but not yet recognised. An increased level of provision is held for accounts where an impairment trigger event has occurred which includes accounts benefitting from forbearance and those in arrears. Refer to note 31 for details of the forbearance policy.
1.6.7 Taxation
Taxation comprises current tax and deferred tax. Current tax and deferred tax are recognised in profit or loss except to the extent that they relate to items recognised directly in equity or other comprehensive income. Current tax is based on the taxable income or loss for the year, using tax rates enacted or substantively enacted at the reporting date, and any adjustment to tax payable in respect of previous years. The Company has adopted the Code of Practice on Taxation for Banks issued by HM Revenue and Customs.
1.6.8 Financial instruments
Financial assets
Financial assets can be classified in the following categories:
> loans and receivables;
> available-for-sale;
> held to maturity; or
> financial assets at fair value through profit or loss
Management determines the classification of its financial instruments at initial recognition. The Company measures all of its financial liabilities at amortised cost, other than derivatives and those instruments which have been designated as part of a hedging relationship. Purchases and sales of financial assets at fair value through profit or loss, held to maturity and available-for-sale are recognised on the trade date, the date on which the Company commits to purchase or sell the asset.
Virgin Money plc
Notes to the financial statements
22
Note 1: Basis of preparation (continued)
Loans and receivables at amortised cost
The Company’s loans and advances to banks and customers and some investment securities are classified as loans and receivables. Loans and receivables are non-derivative financial assets with fixed or determinable payments that are not quoted in an active market, whose recoverability is based solely on the credit risk of the customer and where the Company has no intention of trading the loan or receivable. Loans and receivables are initially recognised at fair value including direct and incremental transaction costs. Subsequent recognition is at amortised cost using the effective interest rate method, less any provision for impairment.
Available-for-sale financial assets
Available-for-sale financial assets are non-derivative assets that are either designated as available-for-sale or are assets that do not meet the definition of loans and receivables and are not derivatives or assets held at fair value through profit or loss. These are principally but not exclusively investment securities intended to be held for an indefinite period of time which may be sold in response to a need for liquidity or changes in interest rates, exchange rates or equity prices.
They are initially measured at fair value including direct and incremental transaction costs. Fair values are obtained from quoted market prices in active markets and, where these are not available, from valuation techniques including discounted cash flow models. With the exception of unquoted equity instruments measured at cost less impairment because their fair value cannot be measured reliably, subsequent measurement is at fair value, with changes in fair value being recognised in other comprehensive income except for impairment losses and translation differences, which are recognised in profit or loss.
Upon derecognition of the asset, or where there is objective evidence that the investment security is impaired, the cumulative gains and losses recognised in other comprehensive income are removed from other comprehensive income and recycled to profit or loss.
Held to maturity financial assets
Held to maturity financial assets are non-derivative financial assets with fixed or determinable payments that the Company has the ability and intention to hold to maturity. They are initially measured at fair value including direct and incremental transaction costs. Subsequent measurement is at amortised cost using the effective interest rate method. No financial assets were classified as held to maturity during either the current or prior year.
Financial assets at fair value through profit or loss
This category consists of derivative financial assets. Assets in this category are carried at fair value. The fair values of derivative instruments are calculated by discounted cash flow models using yield curves that are based on observable market data or are based on valuations obtained from counterparties. Gains and losses arising from the changes in the fair values are recognised in profit or loss. The fair values of quoted investments in active markets are based on current bid prices. If the market for a financial asset is not active (and for unlisted securities), the Company establishes fair value using valuation techniques. These include the use of recent arm’s length transactions, discounted cash flow analysis, option pricing models and other valuation techniques commonly used by market participants.
Financial liabilities
Borrowings, including deposits and debt securities in issue are recognised initially at fair value, being the issue proceeds net of premiums, discounts and transaction costs incurred. All borrowings are subsequently measured at amortised cost using the effective interest rate method. Amortised cost is adjusted for the amortisation of any premiums, discounts and transaction costs. The amortisation is recognised in interest expense and similar charges using the effective interest rate method. The Company does not hold any financial liabilities classified as held for trading.
Amounts due to securitisation special purpose vehicles are classified as financial liabilities at fair value through profit or loss (FVTPL). The fair value is based on the expected prepayments and maturities of mortgages within the securitised mortgage pool, which determine the repayment of the loans. The loans are valued using a discounted cash flow model.
Offsetting financial instruments
Financial assets and liabilities are offset and the net amount reported in the balance sheet when there is a legally enforceable right to offset the recognised amounts and there is an intention to settle on a net basis, or realise the asset and settle the liability simultaneously.
Virgin Money plc
Notes to the financial statements
23
Note 1: Basis of preparation (continued)
Sale and repurchase agreements
Securities sold subject to repurchase agreements (repos) are reclassified in the financial statements as assets pledged when the transferee has the right by contract or custom to sell or repledge the collateral. The counterparty liability is included in amounts due to other banks, deposits from banks, other deposits or deposits due to customers, as appropriate. Securities purchased under agreements to resell (reverse repos) are recorded as loans and advances to banks or customers as appropriate. The difference between sale and repurchase price is treated as interest and accrued over the life of the agreements using the effective interest rate method. Securities lent to counterparties are also retained in the financial statements.
Derecognition of financial assets and liabilities
Derecognition is the point at which the Company removes an asset or liability from its balance sheet. The Company’s policy is to derecognise financial assets only when the contractual right to the cash flows from the financial asset expires or when the Company transfers the financial assets to another party provided the transfer of the asset also transfers the right to receive the cash flows of the financial asset or where the Company has transferred substantially all the risks and rewards of ownership. Where the transfer does not result in the Company transferring the right to receive the cash flows of the financial assets, but it does result in the Company assuming a corresponding obligation to pay the cash flows to another recipient, the financial assets are also accordingly derecognised.
The Company derecognises financial liabilities only when the obligation specified in the contract is discharged, converted to shares, cancelled or has expired or is transferred to a third party. There were no transactions in the year where the Company transferred financial assets that should have been derecognised in their entirety.
1.6.9 Loans and advances to banks
The Company’s loans and advances to banks are classified as loans and receivables.
1.6.10 Loans and advances to customers
The Company’s loans and advances to customers are classified as loans and receivables.
Further details of the application of the effective interest rate method are included in policy 1.6.1 and provision for impairment in policy 1.6.6.
1.6.11 Debt securities classified as loans and receivables
Debt securities are designated as either available-for-sale or loans and receivables. Debt securities are principally available-for-sale as they are intended to be held for an indefinite period of time but may be sold in response to a need for liquidity or changes in interest rates, exchange rates or equity prices (refer to 1.6.12 for accounting treatment). Debt securities classified as loans and receivables are asset backed securities for which there is no active market.
1.6.12 Available-for-sale financial assets
The Company’s debt securities, treasury bills and equity investments not in subsidiary undertakings are held as available-for-sale assets. For available-for-sale financial assets, the Company assesses at each balance sheet date whether there is objective evidence that a financial asset, or group of financial assets are impaired. The amount of the loss is measured as the difference between the asset’s acquisition cost less principal repayments and amortisation and the current fair value. The amount of the impairment loss is recognised in profit or loss. This includes cumulative gains and losses previously recognised in other comprehensive income which are recycled from other comprehensive income to the income statement. If, in a subsequent period, the fair value of an instrument classified as available-for-sale increases and the increase can be objectively related to an event occurring after the impairment loss was recognised in profit or loss, the impairment loss is reversed through profit or loss.
Virgin Money plc
Notes to the financial statements
24
Note 1: Basis of preparation (continued)
1.6.13 Derivative financial instruments and hedge accounting
The Company is authorised to undertake the following types of derivative financial instrument transactions for non-trading purposes: cross currency swaps, interest rate swaps, equity swaps, interest rate caps, forward rate agreements, options, foreign exchange contracts and similar instruments.
The Company’s derivative activities are entered into for the purpose of matching or eliminating risk from potential movements in interest rates and foreign exchange rates inherent in the Company’s assets, liabilities and positions. All derivative transactions are for economic hedging purposes and it is decided at the outset which position the derivative will be hedging. Derivatives are reviewed regularly for their effectiveness as hedges and corrective action taken, if appropriate. Derivatives are measured initially at fair value and subsequently remeasured to fair value. Fair values are obtained from quoted market prices in active markets and, where these are not available, from valuation techniques including discounted cash flow models and option pricing models. Where derivatives are not designated as part of a hedging relationship, changes in fair value are recorded in the income statement. Where derivatives are designated within hedging relationships, the treatment of the changes in fair value depends on the nature of the hedging relationship as explained below.
Hedge accounting is used for derivatives designated in this way provided certain criteria are met. The Company documents at the inception of the hedge relationship the link between the hedging instrument and the hedged item as well as its risk management objective and strategy for undertaking various hedge transactions. The Company also documents its assessment both at hedge inception and on an ongoing basis of whether the derivatives used in hedging transactions are highly effective in offsetting changes in the fair values or cash flows of hedged items. The Company designates certain derivatives as either:
> Cash flow hedges
A cash flow hedge is used to hedge exposures to variability in cash flows, such as variable rate financial assets and liabilities. The effective portion of changes in the derivative fair value is recognised in other comprehensive income, and recycled to the income statement in the periods when the hedged item will affect profit and loss. Interest rate derivatives designated as cash flow hedges primarily hedge the exposure to cash flow vulnerability from forecast loans and advances to customers. The fair value gain or loss relating to the ineffective portion is recognised immediately in profit or loss.
> Fair value hedges
A fair value hedge is used to hedge exposures to variability in the fair value of financial assets and liabilities, such as fixed rate loans. Changes in fair value of derivatives that are designated and qualify as fair value hedges are recorded in the income statement, together with any changes in the fair value of the hedged asset or liability that are attributable to the hedged risk. If the hedge no longer meets the criteria for hedge accounting, the adjustment to the carrying amount of the hedged item is amortised to the income statement over the period to maturity.
The most frequently used fair value hedges are:
> hedging the interest rate risk of a portfolio of prepayable fixed rate assets with interest rate derivatives. This solution is used to establish a macro fair value hedge for derivatives hedging fixed rate mortgages;
> hedging the interest rate risk of a portfolio of fixed rate liabilities with interest rate derivatives. This solution is used to establish a macro fair value hedge for derivatives hedging fixed rate savings;
> hedging the interest rate risk of a portfolio of non-prepayable fixed rate assets with interest rate derivatives. This solution is used to establish a macro fair value hedge for fixed rate investments; and
> hedging the interest rate and foreign currency exchange risk of non- prepayable, foreign currency denominated fixed rate assets or liabilities on a one-for-one basis with fixed/floating or floating/fixed cross currency interest rate swaps.
1.6.14 Investments in subsidiaries
Investments in subsidiaries are valued at cost less provision for impairment. Investments in subsidiaries are included in the Company’s balance sheet, comprising equity investments in subsidiary entities. At each reporting date an assessment is undertaken to determine if there is any indication of impairment. This assessment can include reviewing factors such as the solvency, profitability and cash flows generated by the subsidiary. If there is an indication of impairment, an estimate of the recoverable amount is made. If the carrying value exceeds the recoverable amount then a provision for impairment is made to reduce the carrying value to the recoverable amount.
Virgin Money plc
Notes to the financial statements
25
Note 1: Basis of preparation (continued)
1.6.15 Business combinations
Business combinations
Business combinations are accounted for using the acquisition method as at the acquisition date, being when control is transferred to the Company. Control is having the power over an investee, exposure or rights to variable returns from its involvement with the investee and the ability to use its power to affect those returns.
The Company measures goodwill at the acquisition date as the fair value of the consideration transferred less the fair value of the net identifiable assets acquired and liabilities assumed.
When the excess is negative, the negative goodwill is recognised immediately in profit or loss.
The consideration transferred does not include amounts related to the settlement of pre-existing relationships. Such amounts are generally recognised in profit or loss.
Transaction costs, other than those associated with the issue of debt or equity securities, that the Company incurs in connection with a business combination are expensed as incurred.
Any contingent consideration payable is measured at fair value at the acquisition date. If the contingent consideration is classified as equity, then it is not remeasured and settlement is accounted within equity. Otherwise, subsequent changes in the fair value of the contingent consideration are recognised in profit or loss.
1.6.16 Intangible assets and amortisation
Intangible assets purchased separately from a business combination are capitalised at their cost and amortised from the date from which they become available for use over their useful economic life which is generally 3- 10 years. Intangible assets acquired as part of an acquisition are capitalised at their fair value where this can be measured reliably in accordance with IFRS 13 ‘Fair Value Measurement’.
Expenditure incurred in relation to scoping, planning and researching the build of an asset as part of a project is expensed as incurred.
Development expenditure incurred on a project is capitalised only if the following criteria are met:
> an asset is created that can be identified;
> it is probable that the asset created will generate future economic benefits; and
> the development cost of the asset can be measured reliably.
Following the initial recognition of development expenditure, the cost is amortised over the estimated useful lives of the assets created. Amortisation commences on the date that the asset is brought into use.
Internally generated intangible assets relate to computer software and core banking platforms.
> Computer software
Costs incurred in acquiring and developing computer software for internal use are capitalised as intangible assets where the software leads to the creation of an identifiable non-monetary asset and it is probable that the expected future economic benefits that are attributable to the asset will flow to the Company from its use for a period of over one year. The software is classified as an intangible asset where it is not an integral part of the related hardware and amortised over its estimated useful life on a straight line basis which is generally 3 to 10 years.
Costs associated with maintaining software are expensed as they are incurred.
> Core banking platforms
Core banking platforms primarily represent the construction of core operating platforms, which are internally generated. Core banking platforms are amortised on a straight line basis over 3-10 years.
> Impairment of intangible assets
Intangible assets are assessed for indications of impairment at each balance sheet date, or more frequently where required by events or changes in circumstances. If indications of impairment are found, these assets are subject to an impairment review. The impairment review compares the carrying value of the assets with their recoverable amounts, which are defined as the higher of the fair value less costs to sell and their value in use. Fair value less costs to sell is the amount at which the asset could be sold in a binding agreement in an arm’s length transaction. Value in use is calculated as the discounted cash flows generated as a result of the asset’s continued use including those generated by its ultimate disposal, discounted at a market rate of interest on a pre-tax basis.
Virgin Money plc
Notes to the financial statements
26
Note 1: Basis of preparation (continued)
Where impairments are indicated, the carrying values of intangible assets are written down by the amount of the impairment and the charge is recognised in the income statement in the period in which it occurs. A previously recognised impairment charge on a fixed asset may be reversed in full or in part where a change in circumstances leads to a change in the estimates used to determine its recoverable amount. The carrying value of the intangible asset will only be increased to the carrying value at which it would have been held had the impairment not been recognised.
1.6.17 Tangible fixed assets and depreciation
Tangible fixed assets are stated at cost less accumulated depreciation and provision for impairment, as appropriate. Cost includes the original purchase price of the asset and the costs attributable to bringing the asset to its working condition for its intended use. Additions and subsequent expenditure are included in the asset’s carrying value or are recognised as a separate asset only when they improve the expected future economic benefits to be derived from the asset. All other repairs and maintenance are charged to the income statement in the period in which they are incurred.
Depreciation is provided using the straight line method to allocate costs less residual values over estimated useful lives, as follows:
> Freehold property 50-100 years
> Leasehold property Unexpired period of the lease
> Plant and leasehold improvements 5-30 years
> Computer equipment 3-5 years
> Office equipment 3-10 years
> Motor vehicles 4 years
The residual values and useful lives of assets are reviewed, and adjusted if appropriate, at each balance sheet date. Where the cost of freehold land can be identified separately from buildings, the land is not depreciated. Tangible fixed assets are subject to impairment testing, as appropriate.
Impairment of tangible fixed assets
Tangible fixed assets are assessed for indications of impairment at each balance sheet date, or more frequently where required by events or changes in circumstances. If indications of impairment are found, these assets are subject to an impairment review. The impairment review compares the carrying value of the assets with their recoverable amount, which are defined as the higher of the fair value less costs to sell and their value in use. Fair value less costs to sell is the amount at which the asset could be sold in a binding agreement in an arm’s length transaction. Value in use is calculated as the discounted cash flows generated as a result of the asset’s continued use including those generated by its ultimate disposal, discounted at a market rate of interest on a pre-tax basis.
Where impairments are indicated, the carrying values of fixed assets are written down by the amount of the impairment and the charge is recognised in the income statement in the period in which it occurs. A previously recognised impairment charge on a fixed asset may be reversed in full or in part where a change in circumstances leads to a change in the estimates used to determine its recoverable amount. The carrying value of the fixed asset will only be increased to the carrying value at which it would have been held had the impairment not been recognised.
1.6.18 Deferred tax
Deferred tax is recognised in respect of temporary differences between the carrying amounts of assets and liabilities for financial reporting purposes and the amounts used for taxation purposes. Deferred tax is measured at the tax rates that are expected to be applied to temporary differences when they reverse, based on the laws that have been enacted or substantively enacted by the reporting date.
Deferred tax assets are recognised for unused tax losses, tax credits and deductible temporary differences, to the extent that it is probable that future taxable profits will be available against which they can be utilised. Deferred tax assets are reviewed at each reporting date and are reduced to the extent that it is no longer probable that the related tax benefit will be realised.
1.6.19 Other assets
Other assets include prepayments and other amounts the Company is due to receive from third parties in the normal course of business.
Virgin Money plc
Notes to the financial statements
27
Note 1: Basis of preparation (continued)
1.6.20 Deposits from banks
Deposits from banks are initially measured at fair value, which is normally the proceeds received net of any directly attributable transaction costs incurred. Subsequent measurement is at amortised cost, using the effective interest rate method.
1.6.21 Customer deposits
Customer deposits are initially measured at fair value, which is normally the proceeds received. Subsequent measurement is at amortised cost, using the effective interest rate method.
1.6.22 Provisions
Provisions are recognised for present obligations arising from past events where it is more likely than not that an outflow of resources will be required to settle the obligations and they can be estimated reliably.
A provision for bank levies is recognised when the condition that triggers the payment of the levy is met. If a levy obligation is subject to a minimum activity threshold so that the obligating event is reaching a minimum activity, then a provision is recognised when that minimum activity threshold is reached.
1.6.23 Other liabilities
Deferred income represents amounts received in advance of the Company providing services, and will be recognised as income in profit or loss when the services have been provided.
Other creditors represent amounts the Company is due to pay to third parties in the normal course of business. These include expense accruals, which have been incurred, but not yet billed.
Accrued expenses are amounts that the Company is due to pay to third parties in the normal course of business.
1.6.24 Share capital
> Share capital
The financial instruments issued by the Company are treated as equity (i.e. forming part of shareholders’ funds) only to the extent that they meet the following two conditions:
> they include no contractual obligations upon the Company to deliver cash or other financial assets or to exchange financial assets or financial liabilities with another party under conditions that are potentially unfavourable to the Company; and
> where the instrument will or may be settled in the Company’s own equity instruments, it is either a non-derivative that includes no obligation to deliver a variable number of the Company’s own equity instruments or is a derivative that will be settled by the Company exchanging a fixed amount of cash or other financial assets for a fixed number of its own equity instruments.
To the extent that this definition is not met, the proceeds of issue are classified as a financial liability.
> Share issue costs
Incremental costs directly attributable to the issue of new shares or options are shown in equity as a deduction, net of tax, from the proceeds.
> Dividends and appropriations
Dividends are recognised in equity in the period in which they are approved by the Company’s shareholders or paid.
1.6.25 Other reserves
> Available-for-sale reserve
The available-for-sale reserve represents the unrealised change in the fair value of available-for-sale investments since initial recognition.
> Cash flow hedge reserve
For derivatives designated in a cash flow hedge, the effective portion of changes in fair value is recognised in the cash flow hedge reserve and recycled to profit or loss in the periods when the hedged item will affect profit or loss.
Virgin Money plc
Notes to the financial statements
28
Note 1: Basis of preparation (continued)
1.6.26 Contingent liabilities
Contingent liabilities are possible obligations whose existence depends upon the outcome of uncertain future events or are present obligations where the outflows of resources are uncertain or cannot be reliably measured. Contingent liabilities are not recognised in the financial statements but are disclosed unless they are remote.
1.6.27 Fair value of financial assets and liabilities
Fair value is defined as the price that would be received to sell an asset or paid to transfer a liability in an orderly transaction between market participants at the measurement date in the principal, or in its absence, the most advantageous market to which the Company has access at that date. The fair value of a liability reflects its non-performance risk.
For the majority of instruments, fair value is determined with reference to quoted prices in an active market. A market is regarded as active if transactions for the asset or liability take place with sufficient frequency and volume to provide pricing information on an ongoing basis.
Refer to note 30 for a description of different levels within the fair value hierarchy. Levels are received at each balance sheet date and this determines where transfers between levels are required.
Where quoted prices are not available, fair value is based upon cash flow models, which use wherever possible independently sourced observable market parameters such as interest rate yield curves, currency rates and option volatilities. The chosen valuation technique incorporates all the factors that market participants would take into account in pricing a transaction and is discounted at a risk free rate.
The best evidence of the fair value of a financial instrument at initial recognition is normally the transaction price—i.e. the fair value of consideration given or received. The Company does not apply a credit valuation adjustment (CVA) or debit valuation adjustment (DVA) to reflect the credit risk of its derivative exposures as the Company’s portfolio is fully collateralised.
If an asset or a liability measured at fair value has a bid price and an ask price, the Company measures assets and long positions at bid price and liabilities and short positions at an ask price.
Portfolios of financial assets and financial liabilities that are exposed to market risk and credit risk that are managed by the Company on the basis of the net exposure to either market or credit risk, are measured on the basis of a price that would be received to sell a net long position (or transferred to sell a net short position) for a particular risk exposure. Those portfolio risk adjustments are allocated to the individual assets and liabilities on the basis of the relative risk adjustment of each of the individual instruments in the portfolio.
1.6.28 Cash and cash equivalents
For the purposes of the cash flow statement, cash and cash equivalents comprise balances with less than three months maturity from the date of acquisition, including cash and non-restricted balances with central banks.
1.7 Critical estimates and judgements
The preparation of financial statements in conformity with IFRS requires management to make judgements, estimates and assumptions that affect the application of accounting policies and the reported amounts of assets and liabilities at the date of the financial statements and the reported amounts of income and expenses during the reporting period. Although these estimates are based on management’s best knowledge of the amount, actual results ultimately may differ from those estimates.
The areas involving a higher degree of judgement or complexity, or areas where assumptions and estimates are significant to the 2015 financial statements as follows:
1.7.1 Effective interest rates
IAS 39 requires interest earned from mortgages and credit cards to be measured under the effective interest rate method. Management must therefore use judgement to estimate the expected life of each instrument and hence the expected cash flows relating to it. The accuracy of the effective interest rate would therefore be affected by unexpected market movements resulting in altered customer behaviour, inaccuracies in the models used compared to actual outcomes and incorrect assumptions.
If the estimated life of secured loans were increased or reduced by one month, the value of such loans on the balance sheet would be increased or decreased by £3.6 million (2014: £2.7 million) and £3.8 million (2014: £2.8 million) respectively.
If the estimated life of credit cards were increased or reduced by one month, the value of such assets on the balance sheet would be increased or decreased by £1.1 million (2014: £0.6 million) and £1.1 million (2014: £0.5 million) respectively.
Virgin Money plc
Notes to the financial statements
29
Note 1: Basis of preparation (continued)
1.7.2 Impairment of loans and receivables
Individual impairment losses on secured loans and advances are calculated based on an individual valuation of the underlying asset. Collective impairment losses on loans and advances are calculated using a statistical model.
The key assumptions used in the model are the probability of default; the probability of this default resulting in possession and/or write off; and the subsequent loss incurred. These key assumptions are monitored regularly to ensure the impairment allowance is entirely reflective of the current portfolio.
The accuracy of the impairment calculation would therefore be affected by unanticipated changes to the economic situation and assumptions which differ from actual outcomes. For mortgage loan receivables to the extent that:
> the loss given default differs by +/- 10%, for example if the loss given default is 10% then it is increased to 11%, the impairment allowance would be an estimated £0.3 million (2014: £0.2 million) higher or £0.3 million (2014: £0.2 million) lower respectively;
> the level of house prices differs by +/- 10%, for example a property value of £100,000 is increased to £110,000, the impairment allowance would be an estimated £1.3 million (2014: £0.7 million) lower or £3.0 million (2014: £3.4 million) higher respectively; and
> the emergence period of 6 months differs by +/- 3 months, the impairment allowance would be an estimated £0.2 million (2014: £0.1 million) higher or £0.2 million (2014: £0.1 million) lower respectively.
For credit card receivables, to the extent that the loss given default differs by +/- 10%, the impairment allowance would be an estimated £2.9 million (2014: £2.7 million) higher or £2.9 million (2014: £2.7 million) lower respectively, and to the extent the emergence period of 6 months differs by +/-3 months, the impairment allowance would be an estimated £3.8 million (2014: £2.0 million) higher or £3.8 million (2014: £2.0 million) lower respectively.
1.7.3 Capitalisation and impairment of intangibles
Intangibles are initially recognised when they are separable or arise from contractual or other legal rights, the cost can be measured reliably and, in the case of intangible assets not acquired in a business combination, where it is probable that future economic benefits attributable to the assets will flow from their use. Management review and monitor the capitalisation of significant project development costs on a regular basis to ensure that they meet the recognition criteria for capitalisation of an intangible asset and to ensure the costs are directly attributable to the individual projects where an asset is under construction. A review of capitalisation of intangibles has been undertaken to ensure these conditions have been met.
A review of intangible assets which are not yet in use for indications of impairment is undertaken at each reporting date. If there are indicators of impairment, an estimate of the recoverable amount is made. The recoverable amount of the asset is the higher of its fair value less costs to sell and its value in use. Value in use is calculated by discounting the future cash flows (both costs to complete and benefits post completion) generated from the continuing use of the asset. If the carrying value of the asset is less than the greater of the value in use and the fair value less costs to sell, an impairment charge is recognised.
Through their assessment of intangible assets and review for impairment indicators Management have not identified any assets that have an impairment, therefore a £nil impairment charge has been recognised (2014: £nil).
1.7.4 Deferred tax
Taxation involves estimation techniques to assess the liability in terms of possible outcomes. The assessment of the recoverability or otherwise of deferred tax assets is based mainly on a determination of whether the relevant entity will generate sufficient profits within 5 years to realise the deferred tax assets.
This is reviewed at each reporting date by the Directors with a detailed exercise conducted to establish the validity of profit forecasts and other relevant information including timescales over which the profits are expected to arise and the deferred tax assets will reverse. Deferred tax is determined using tax rates that have been enacted or substantially enacted by the balance sheet date and which are expected to apply when the related deferred tax assets are realised or the deferred tax liabilities are settled.
The judgement required in the assessment of whether to recognise deferred tax assets is set out in policy 1.6.18. Based on their interpretation of the timing and level of reversal of existing taxable temporary differences, in line with relevant accounting standards, the Directors conclude that a net deferred tax asset of £34.9 million (2014: £46.0 million) should be recognised at the balance sheet date.
Virgin Money plc
Notes to the financial statements
30
Note 1: Basis of preparation (continued)
1.7.5 Fair value of financial assets and liabilities
Management must use judgement and estimates calculating fair value where not all necessary inputs are observable or where factors specific to the Company’s holdings need to be considered. The accuracy of the fair value calculations would therefore be affected by unexpected market movements, inaccuracies within the models used compared to actual outcomes and incorrect assumptions. For example, if Management were to use a tightening in the credit spread of ten basis points, the fair values of liabilities (including derivatives) would increase from the reported fair values by £21.6 million (2014: £20.0 million).
1.7.6 Estimates and judgements significant to the 2014 financial statements
The following were considered as estimates and judgements significant to the financial statements for the year ended 31 December 2014:
> Fair value of share based payments
The fair values of share awards granted in 2014 were calculated using statistical models, requiring application of management judgement on the inputs to these models. The nature of schemes with awards granted in 2015 has are such that there is a reduced the degree of judgement and complexity in calculations for the 2015 financial statements.
> Tax uncertainty
The degree of judgement and uncertainty involved in determining the Company’s provision for income taxation, deferred taxation assets and liabilities and potential taxation liabilities was more significant in 2014. The ultimate outcome of certain tax matters is considered more certain.
> Provisions and contingent liabilities
Provision values and determining whether to recognise contingent liabilities are both based on the best information available at the reporting date, and the degree of judgement and uncertainty is not considered as significant as in 2014.
Further information on the above estimates and judgements is provided in the Annual Report and Accounts 2014.
Virgin Money plc
Notes to the financial statements
31
Note 2: Net interest income
Net interest income comprises:
2015 £m
20141
£m
Interest and similar income: Loans and advances to customers 821.2 748.2 Loans and advances to banks 0.6 0.3 Debt securities classified as loans and receivables 20.8 21.3 Interest receivable on loans and receivables 842.6 769.8
Available-for sale financial assets 10.5 11.5 Cash and balances at central banks 4.0 5.9 Securitisation subordinated loan 4.4 5.0 Other interest 2.7 3.2 Total interest and similar income 864.2 795.4
Interest and similar expense: Deposits from banks including liabilities under sale and repurchase agreements (6.8) (3.3) Customer deposits (340.0) (370.6) Debt Securities in Issue (3.5) — Securitisation special purpose vehicles (47.4) (46.6) Other (9.3) (6.5) Total interest and similar expense (407.0) (427.0) Net interest income 457.2 368.4
1 Items within interest income and expense have been reclassified to better reflect the interest bearing assets and liabilities to which they
relate.
Interest accrued on individually impaired assets was £6.8 million (2014: £6.8 million). Note 3: Fee and commission income
Fee and commission income comprises:
2015 £m
2014 £m
On loans and advances to customers 21.0 28.9 Other fee and commission income 0.8 0.8 Total fee and commission income 21.8 29.7
Note 4: Other operating income
Other operating income comprises:
2015 £m
2014 £m
Gain on sale of available-for-sale assets (note 14) 5.0 2.3 Other 3.7 3.0 Total other operating income 8.7 5.3
Total other operating income is derived in the United Kingdom and relates to trade with third parties and continuing operations.
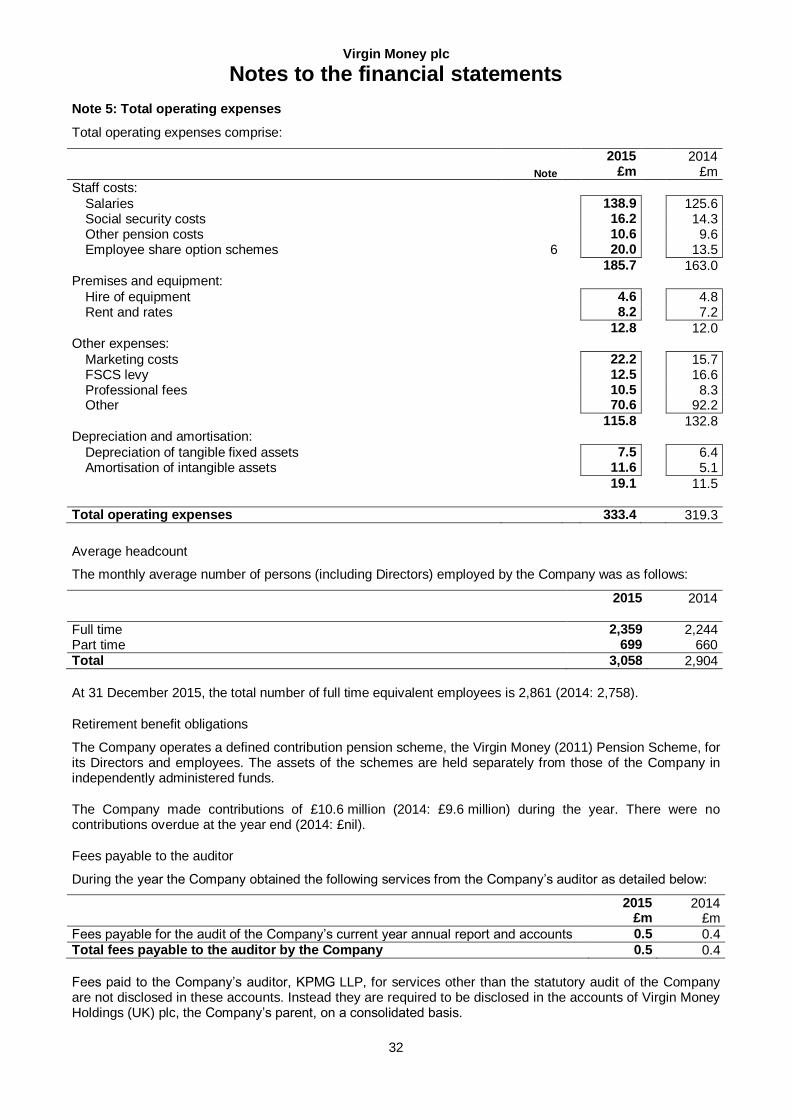
Virgin Money plc
Notes to the financial statements
32
Note 5: Total operating expenses
Total operating expenses comprise:
Note
2015 £m
2014 £m
Staff costs:
Salaries 138.9 125.6 Social security costs 16.2 14.3 Other pension costs 10.6 9.6 Employee share option schemes 6 20.0 13.5
185.7 163.0 Premises and equipment:
Hire of equipment 4.6 4.8 Rent and rates 8.2 7.2
12.8 12.0 Other expenses:
Marketing costs 22.2 15.7 FSCS levy 12.5 16.6 Professional fees 10.5 8.3 Other 70.6 92.2
115.8 132.8 Depreciation and amortisation:
Depreciation of tangible fixed assets 7.5 6.4 Amortisation of intangible assets 11.6 5.1
19.1 11.5 Total operating expenses 333.4 319.3
Average headcount
The monthly average number of persons (including Directors) employed by the Company was as follows:
2015
2014
Full time 2,359 2,244 Part time 699 660 Total 3,058 2,904
At 31 December 2015, the total number of full time equivalent employees is 2,861 (2014: 2,758).
Retirement benefit obligations
The Company operates a defined contribution pension scheme, the Virgin Money (2011) Pension Scheme, for its Directors and employees. The assets of the schemes are held separately from those of the Company in independently administered funds.
The Company made contributions of £10.6 million (2014: £9.6 million) during the year. There were no contributions overdue at the year end (2014: £nil).
Fees payable to the auditor
During the year the Company obtained the following services from the Company’s auditor as detailed below:
2015 £m
2014 £m
Fees payable for the audit of the Company’s current year annual report and accounts 0.5 0.4 Total fees payable to the auditor by the Company 0.5 0.4
Fees paid to the Company’s auditor, KPMG LLP, for services other than the statutory audit of the Company are not disclosed in these accounts. Instead they are required to be disclosed in the accounts of Virgin Money Holdings (UK) plc, the Company’s parent, on a consolidated basis.
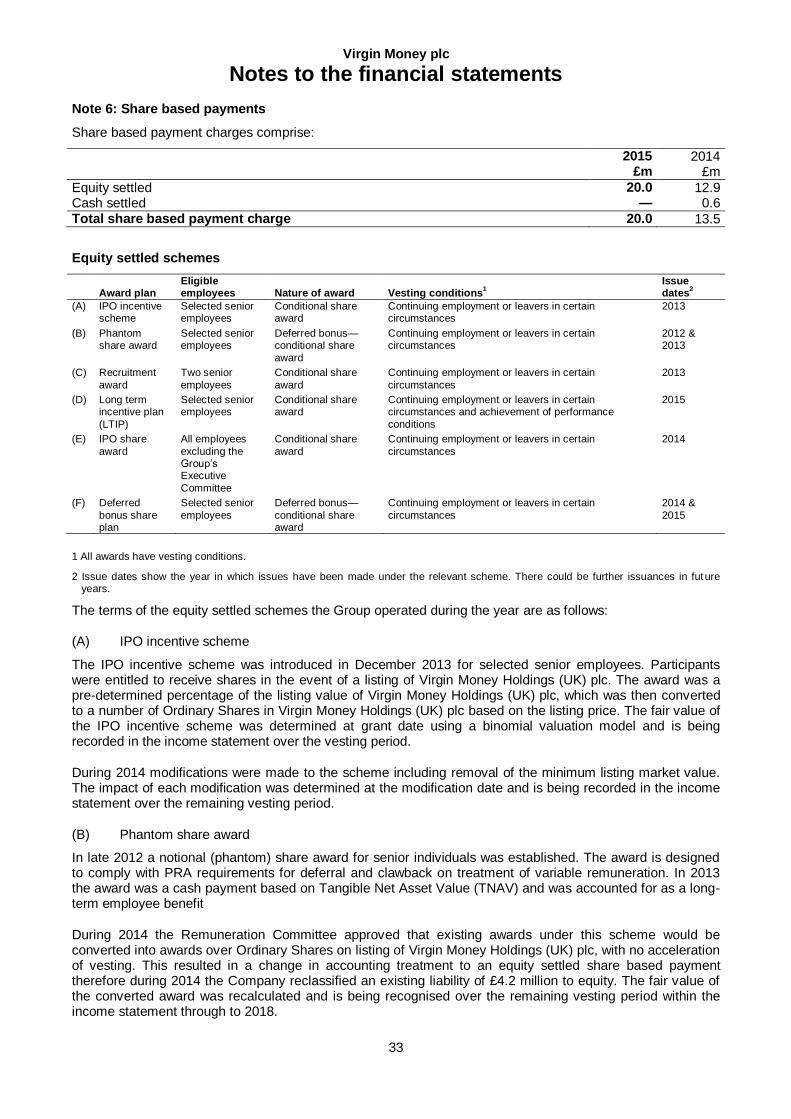
Virgin Money plc
Notes to the financial statements
33
Note 6: Share based payments
Share based payment charges comprise:
2015 £m
2014 £m
Equity settled 20.0 12.9 Cash settled — 0.6 Total share based payment charge 20.0 13.5
Equity settled schemes
Award plan
Eligible employees Nature of award Vesting conditions
1
Issue dates
2
(A) IPO incentive scheme
Selected senior employees
Conditional share award
Continuing employment or leavers in certain circumstances
2013
(B) Phantom share award
Selected senior employees
Deferred bonus—conditional share
award
Continuing employment or leavers in certain circumstances
2012 & 2013
(C) Recruitment
award
Two senior
employees
Conditional share
award
Continuing employment or leavers in certain
circumstances
2013
(D) Long term incentive plan
(LTIP)
Selected senior employees
Conditional share award
Continuing employment or leavers in certain circumstances and achievement of performance
conditions
2015
(E) IPO share
award
All employees
excluding the Group’s Executive
Committee
Conditional share
award
Continuing employment or leavers in certain
circumstances
2014
(F) Deferred
bonus share plan
Selected senior
employees
Deferred bonus—
conditional share award
Continuing employment or leavers in certain
circumstances
2014 &
2015
1 All awards have vesting conditions.
2 Issue dates show the year in which issues have been made under the relevant scheme. There could be further issuances in fut ure years.
The terms of the equity settled schemes the Group operated during the year are as follows:
(A) IPO incentive scheme
The IPO incentive scheme was introduced in December 2013 for selected senior employees. Participants were entitled to receive shares in the event of a listing of Virgin Money Holdings (UK) plc. The award was a pre-determined percentage of the listing value of Virgin Money Holdings (UK) plc, which was then converted to a number of Ordinary Shares in Virgin Money Holdings (UK) plc based on the listing price. The fair value of the IPO incentive scheme was determined at grant date using a binomial valuation model and is being recorded in the income statement over the vesting period.
During 2014 modifications were made to the scheme including removal of the minimum listing market value. The impact of each modification was determined at the modification date and is being recorded in the income statement over the remaining vesting period.
(B) Phantom share award
In late 2012 a notional (phantom) share award for senior individuals was established. The award is designed to comply with PRA requirements for deferral and clawback on treatment of variable remuneration. In 2013 the award was a cash payment based on Tangible Net Asset Value (TNAV) and was accounted for as a long-term employee benefit
During 2014 the Remuneration Committee approved that existing awards under this scheme would be converted into awards over Ordinary Shares on listing of Virgin Money Holdings (UK) plc, with no acceleration of vesting. This resulted in a change in accounting treatment to an equity settled share based payment therefore during 2014 the Company reclassified an existing liability of £4.2 million to equity. The fair value of the converted award was recalculated and is being recognised over the remaining vesting period within the income statement through to 2018.
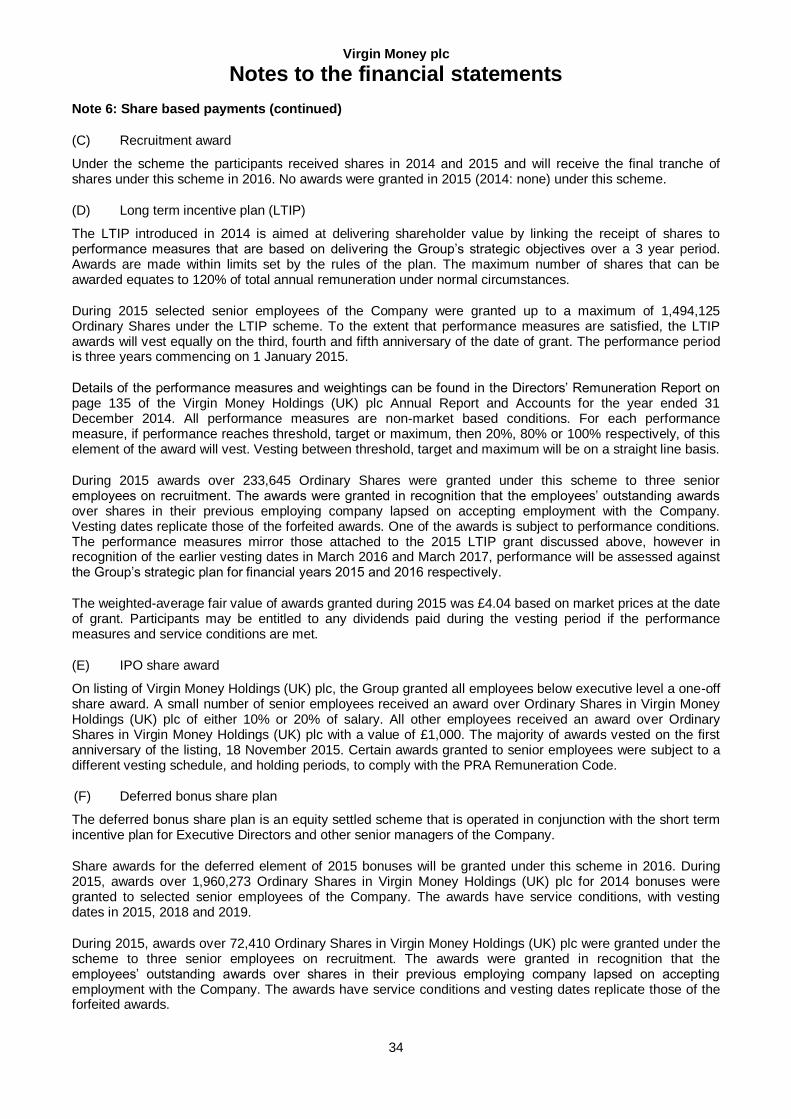
Virgin Money plc
Notes to the financial statements
34
Note 6: Share based payments (continued)
(C) Recruitment award
Under the scheme the participants received shares in 2014 and 2015 and will receive the final tranche of shares under this scheme in 2016. No awards were granted in 2015 (2014: none) under this scheme.
(D) Long term incentive plan (LTIP)
The LTIP introduced in 2014 is aimed at delivering shareholder value by linking the receipt of shares to performance measures that are based on delivering the Group’s strategic objectives over a 3 year period. Awards are made within limits set by the rules of the plan. The maximum number of shares that can be awarded equates to 120% of total annual remuneration under normal circumstances.
During 2015 selected senior employees of the Company were granted up to a maximum of 1,494,125 Ordinary Shares under the LTIP scheme. To the extent that performance measures are satisfied, the LTIP awards will vest equally on the third, fourth and fifth anniversary of the date of grant. The performance period is three years commencing on 1 January 2015.
Details of the performance measures and weightings can be found in the Directors’ Remuneration Report on page 135 of the Virgin Money Holdings (UK) plc Annual Report and Accounts for the year ended 31 December 2014. All performance measures are non-market based conditions. For each performance measure, if performance reaches threshold, target or maximum, then 20%, 80% or 100% respectively, of this element of the award will vest. Vesting between threshold, target and maximum will be on a straight line basis.
During 2015 awards over 233,645 Ordinary Shares were granted under this scheme to three senior employees on recruitment. The awards were granted in recognition that the employees’ outstanding awards over shares in their previous employing company lapsed on accepting employment with the Company. Vesting dates replicate those of the forfeited awards. One of the awards is subject to performance conditions. The performance measures mirror those attached to the 2015 LTIP grant discussed above, however in recognition of the earlier vesting dates in March 2016 and March 2017, performance will be assessed against the Group’s strategic plan for financial years 2015 and 2016 respectively.
The weighted-average fair value of awards granted during 2015 was £4.04 based on market prices at the date of grant. Participants may be entitled to any dividends paid during the vesting period if the performance measures and service conditions are met.
(E) IPO share award
On listing of Virgin Money Holdings (UK) plc, the Group granted all employees below executive level a one-off share award. A small number of senior employees received an award over Ordinary Shares in Virgin Money Holdings (UK) plc of either 10% or 20% of salary. All other employees received an award over Ordinary Shares in Virgin Money Holdings (UK) plc with a value of £1,000. The majority of awards vested on the first anniversary of the listing, 18 November 2015. Certain awards granted to senior employees were subject to a different vesting schedule, and holding periods, to comply with the PRA Remuneration Code.
(F) Deferred bonus share plan
The deferred bonus share plan is an equity settled scheme that is operated in conjunction with the short term incentive plan for Executive Directors and other senior managers of the Company.
Share awards for the deferred element of 2015 bonuses will be granted under this scheme in 2016. During 2015, awards over 1,960,273 Ordinary Shares in Virgin Money Holdings (UK) plc for 2014 bonuses were granted to selected senior employees of the Company. The awards have service conditions, with vesting dates in 2015, 2018 and 2019.
During 2015, awards over 72,410 Ordinary Shares in Virgin Money Holdings (UK) plc were granted under the scheme to three senior employees on recruitment. The awards were granted in recognition that the employees’ outstanding awards over shares in their previous employing company lapsed on accepting employment with the Company. The awards have service conditions and vesting dates replicate those of the forfeited awards.
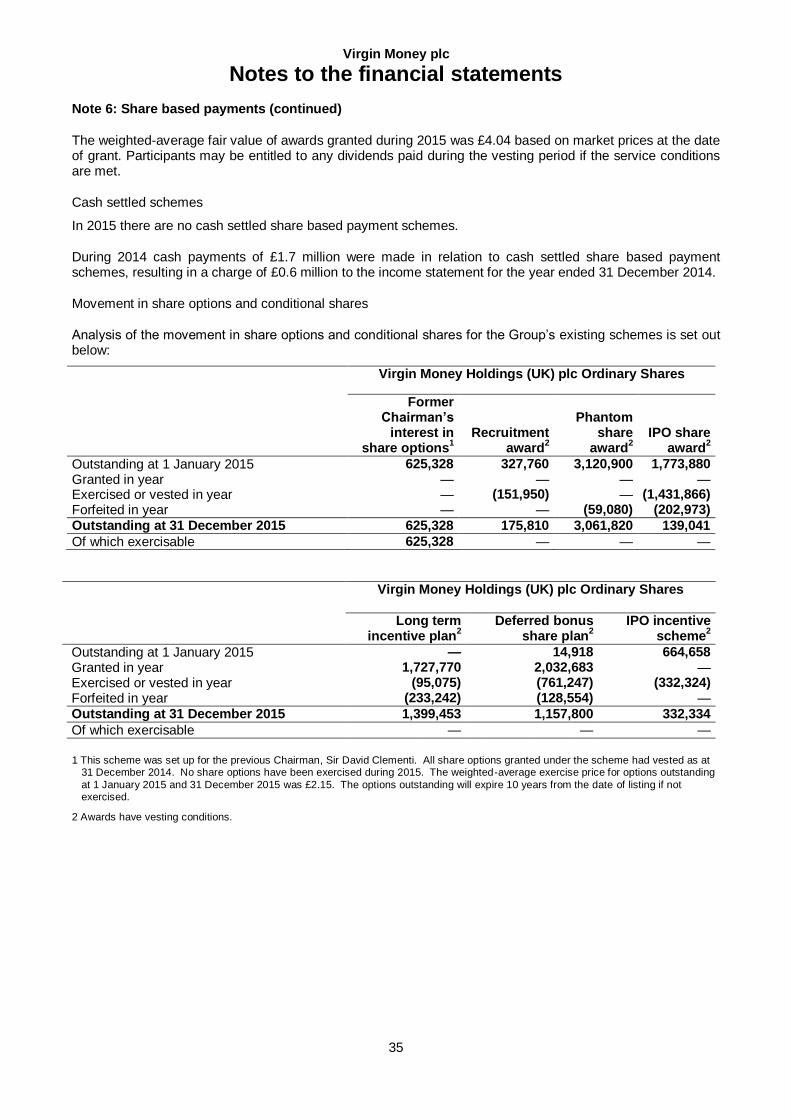
Virgin Money plc
Notes to the financial statements
35
Note 6: Share based payments (continued)
The weighted-average fair value of awards granted during 2015 was £4.04 based on market prices at the date of grant. Participants may be entitled to any dividends paid during the vesting period if the service conditions are met.
Cash settled schemes
In 2015 there are no cash settled share based payment schemes.
During 2014 cash payments of £1.7 million were made in relation to cash settled share based payment schemes, resulting in a charge of £0.6 million to the income statement for the year ended 31 December 2014.
Movement in share options and conditional shares
Analysis of the movement in share options and conditional shares for the Group’s existing schemes is set out below:
Virgin Money Holdings (UK) plc Ordinary Shares
Former Chairman’s
interest in share options
1
Recruitment award
2
Phantom share
award2
IPO share award
2
Outstanding at 1 January 2015 625,328 327,760 3,120,900 1,773,880 Granted in year — — — — Exercised or vested in year — (151,950) — (1,431,866) Forfeited in year — — (59,080) (202,973)
Outstanding at 31 December 2015 625,328 175,810 3,061,820 139,041
Of which exercisable 625,328 — — —
Virgin Money Holdings (UK) plc Ordinary Shares
Long term incentive plan
2
Deferred bonus share plan
2
IPO incentive scheme
2
Outstanding at 1 January 2015 — 14,918 664,658 Granted in year 1,727,770 2,032,683 — Exercised or vested in year (95,075) (761,247) (332,324) Forfeited in year (233,242) (128,554) — Outstanding at 31 December 2015 1,399,453 1,157,800 332,334
Of which exercisable — — —
1 This scheme was set up for the previous Chairman, Sir David Clementi. All share options granted under the scheme had vested as at
31 December 2014. No share options have been exercised during 2015. The weighted-average exercise price for options outstanding
at 1 January 2015 and 31 December 2015 was £2.15. The options outstanding will expire 10 years from the date of listing if not exercised.
2 Awards have vesting conditions.
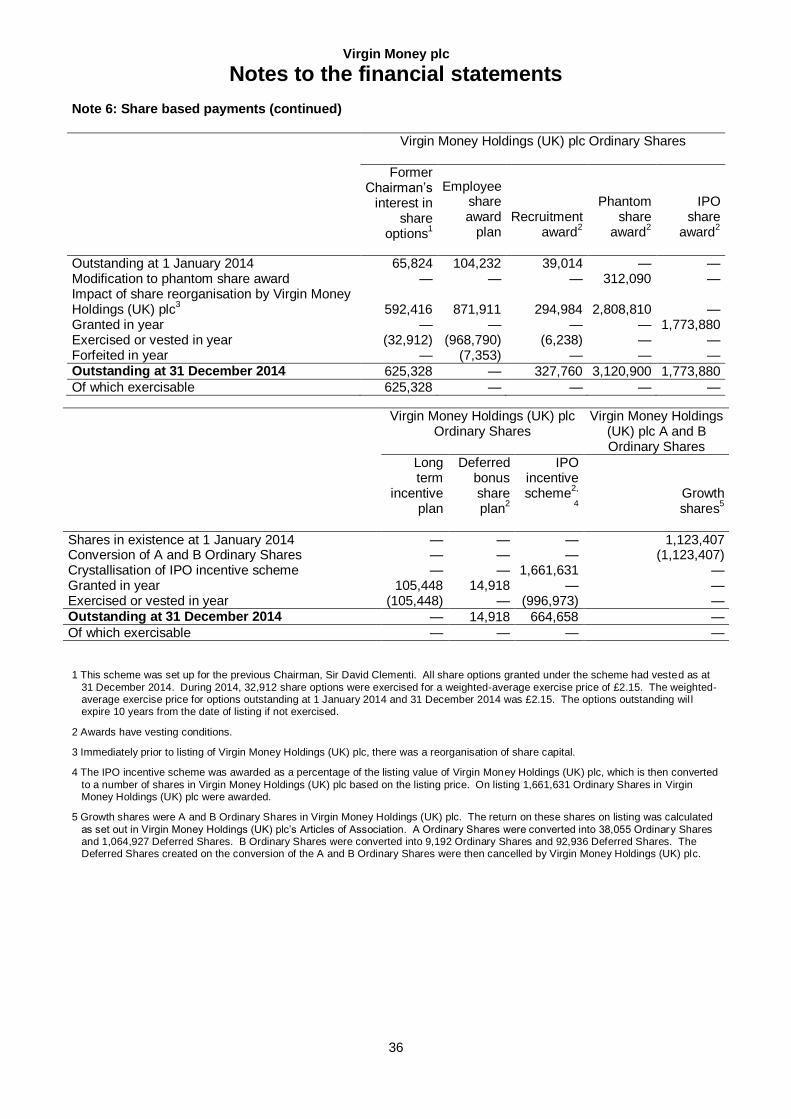
Virgin Money plc
Notes to the financial statements
36
Note 6: Share based payments (continued)
Virgin Money Holdings (UK) plc Ordinary Shares
Former Chairman’s
interest in share
options1
Employee share award
plan
Recruitment award
2
Phantom share
award2
IPO share
award2
Outstanding at 1 January 2014 65,824 104,232 39,014 — — Modification to phantom share award — — — 312,090 — Impact of share reorganisation by Virgin Money Holdings (UK) plc
3 592,416 871,911 294,984 2,808,810 —
Granted in year — — — — 1,773,880 Exercised or vested in year (32,912) (968,790) (6,238) — — Forfeited in year — (7,353) — — — Outstanding at 31 December 2014 625,328 — 327,760 3,120,900 1,773,880
Of which exercisable 625,328 — — — —
Virgin Money Holdings (UK) plc Ordinary Shares
Virgin Money Holdings (UK) plc A and B Ordinary Shares
Long term
incentive plan
Deferred bonus share plan
2
IPO incentive scheme
2,
4
Growth shares
5
Shares in existence at 1 January 2014 — — — 1,123,407 Conversion of A and B Ordinary Shares — — — (1,123,407) Crystallisation of IPO incentive scheme — — 1,661,631 — Granted in year 105,448 14,918 — — Exercised or vested in year (105,448) — (996,973) — Outstanding at 31 December 2014 — 14,918 664,658 —
Of which exercisable — — — —
1 This scheme was set up for the previous Chairman, Sir David Clementi. All share options granted under the scheme had vested as at
31 December 2014. During 2014, 32,912 share options were exercised for a weighted-average exercise price of £2.15. The weighted-average exercise price for options outstanding at 1 January 2014 and 31 December 2014 was £2.15. The options outstanding wil l expire 10 years from the date of listing if not exercised.
2 Awards have vesting conditions.
3 Immediately prior to listing of Virgin Money Holdings (UK) plc, there was a reorganisation of share capital.
4 The IPO incentive scheme was awarded as a percentage of the listing value of Virgin Money Holdings (UK) plc, which is then converted
to a number of shares in Virgin Money Holdings (UK) plc based on the listing price. On listing 1,661,631 Ordinary Shares in Virgin Money Holdings (UK) plc were awarded.
5 Growth shares were A and B Ordinary Shares in Virgin Money Holdings (UK) plc. The return on these shares on listing was calculated
as set out in Virgin Money Holdings (UK) plc’s Articles of Association. A Ordinary Shares were converted into 38,055 Ordinary Shares and 1,064,927 Deferred Shares. B Ordinary Shares were converted into 9,192 Ordinary Shares and 92,936 Deferred Shares. The Deferred Shares created on the conversion of the A and B Ordinary Shares were then cancelled by Virgin Money Holdings (UK) plc.
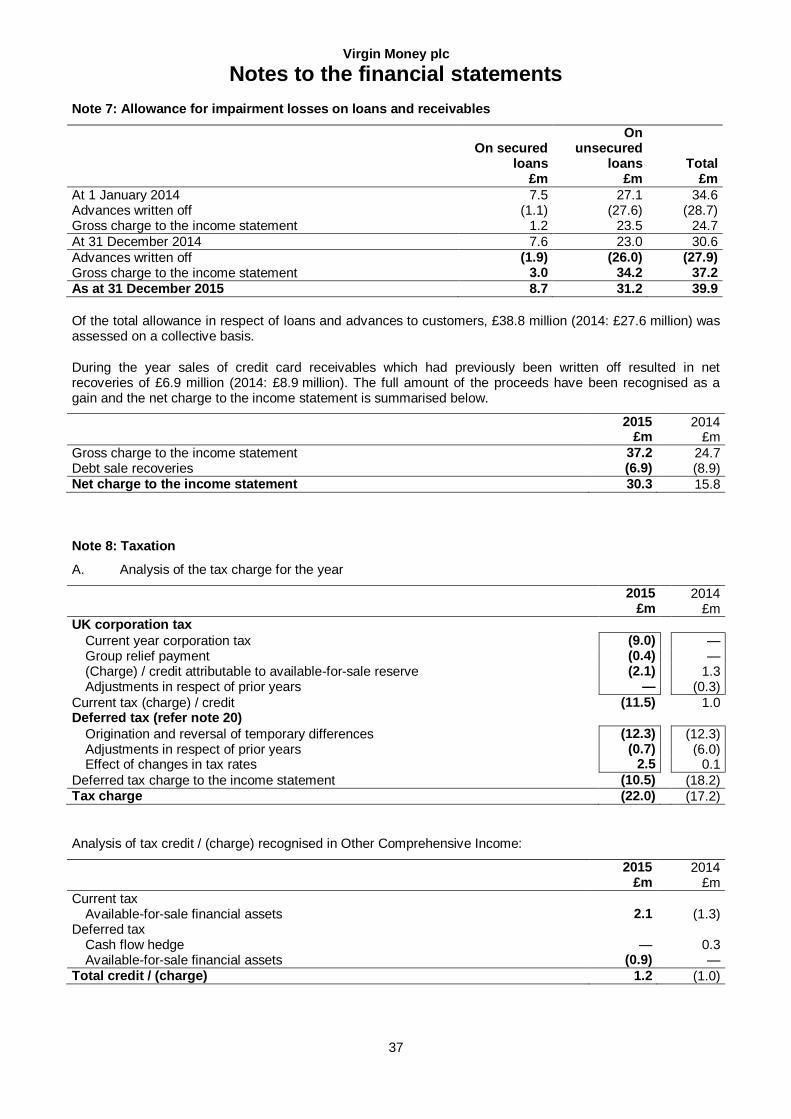
Virgin Money plc
Notes to the financial statements
37
Note 7: Allowance for impairment losses on loans and receivables
On secured loans
£m
On unsecured
loans £m
Total £m
At 1 January 2014 7.5 27.1 34.6 Advances written off (1.1) (27.6) (28.7) Gross charge to the income statement 1.2 23.5 24.7
At 31 December 2014 7.6 23.0 30.6
Advances written off (1.9) (26.0) (27.9) Gross charge to the income statement 3.0 34.2 37.2
As at 31 December 2015 8.7 31.2 39.9
Of the total allowance in respect of loans and advances to customers, £38.8 million (2014: £27.6 million) was assessed on a collective basis.
During the year sales of credit card receivables which had previously been written off resulted in net recoveries of £6.9 million (2014: £8.9 million). The full amount of the proceeds have been recognised as a gain and the net charge to the income statement is summarised below.
2015 £m
2014 £m
Gross charge to the income statement 37.2 24.7 Debt sale recoveries (6.9) (8.9) Net charge to the income statement 30.3 15.8 Note 8: Taxation
A. Analysis of the tax charge for the year
2015 £m
2014 £m
UK corporation tax
Current year corporation tax (9.0) — Group relief payment (0.4) — (Charge) / credit attributable to available-for-sale reserve (2.1) 1.3 Adjustments in respect of prior years — (0.3)
Current tax (charge) / credit (11.5) 1.0 Deferred tax (refer note 20)
Origination and reversal of temporary differences (12.3) (12.3) Adjustments in respect of prior years (0.7) (6.0) Effect of changes in tax rates 2.5 0.1
Deferred tax charge to the income statement (10.5) (18.2) Tax charge (22.0) (17.2)
Analysis of tax credit / (charge) recognised in Other Comprehensive Income:
2015 £m
2014 £m
Current tax Available-for-sale financial assets 2.1 (1.3)
Deferred tax Cash flow hedge — 0.3 Available-for-sale financial assets (0.9) —
Total credit / (charge) 1.2 (1.0)
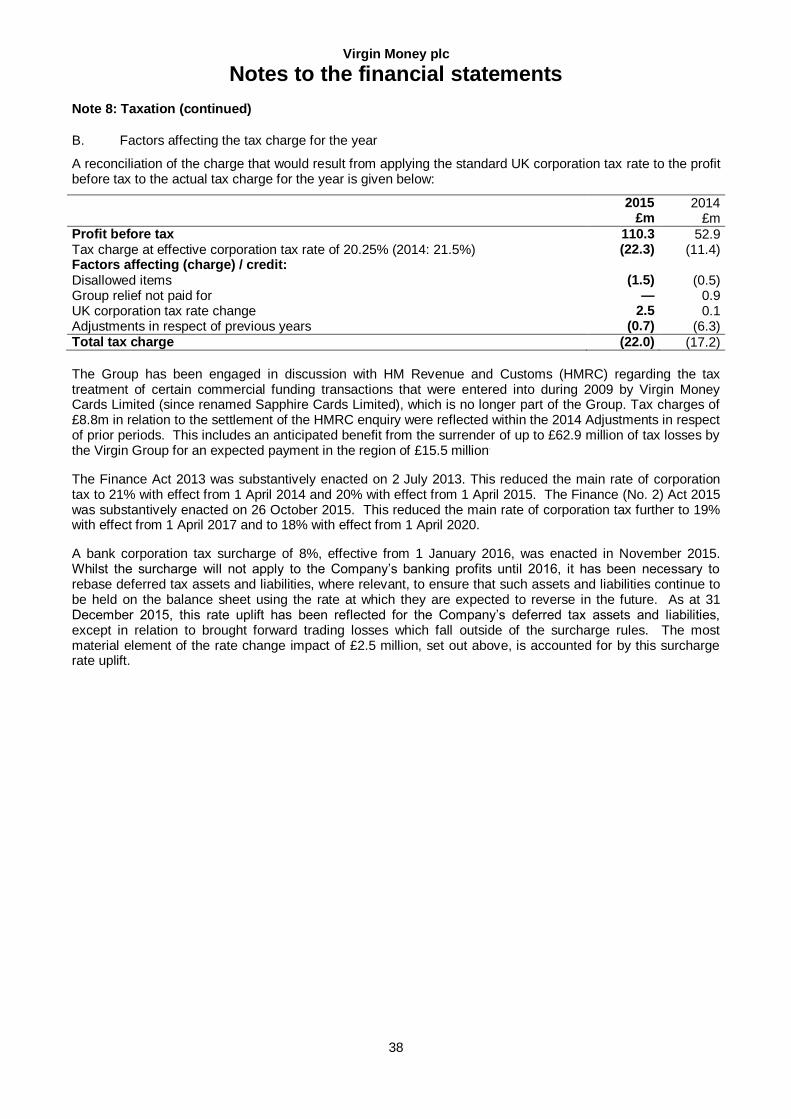
Virgin Money plc
Notes to the financial statements
38
Note 8: Taxation (continued)
B. Factors affecting the tax charge for the year
A reconciliation of the charge that would result from applying the standard UK corporation tax rate to the profit before tax to the actual tax charge for the year is given below:
2015 £m
2014 £m
Profit before tax 110.3 52.9 Tax charge at effective corporation tax rate of 20.25% (2014: 21.5%) (22.3) (11.4) Factors affecting (charge) / credit: Disallowed items (1.5) (0.5) Group relief not paid for — 0.9 UK corporation tax rate change 2.5 0.1 Adjustments in respect of previous years (0.7) (6.3) Total tax charge (22.0) (17.2)
The Group has been engaged in discussion with HM Revenue and Customs (HMRC) regarding the tax treatment of certain commercial funding transactions that were entered into during 2009 by Virgin Money Cards Limited (since renamed Sapphire Cards Limited), which is no longer part of the Group. Tax charges of £8.8m in relation to the settlement of the HMRC enquiry were reflected within the 2014 Adjustments in respect of prior periods. This includes an anticipated benefit from the surrender of up to £62.9 million of tax losses by the Virgin Group for an expected payment in the region of £15.5 million.
The Finance Act 2013 was substantively enacted on 2 July 2013. This reduced the main rate of corporation tax to 21% with effect from 1 April 2014 and 20% with effect from 1 April 2015. The Finance (No. 2) Act 2015 was substantively enacted on 26 October 2015. This reduced the main rate of corporation tax further to 19% with effect from 1 April 2017 and to 18% with effect from 1 April 2020.
A bank corporation tax surcharge of 8%, effective from 1 January 2016, was enacted in November 2015. Whilst the surcharge will not apply to the Company’s banking profits until 2016, it has been necessary to rebase deferred tax assets and liabilities, where relevant, to ensure that such assets and liabilities continue to be held on the balance sheet using the rate at which they are expected to reverse in the future. As at 31 December 2015, this rate uplift has been reflected for the Company’s deferred tax assets and liabilities, except in relation to brought forward trading losses which fall outside of the surcharge rules. The most material element of the rate change impact of £2.5 million, set out above, is accounted for by this surcharge rate uplift.
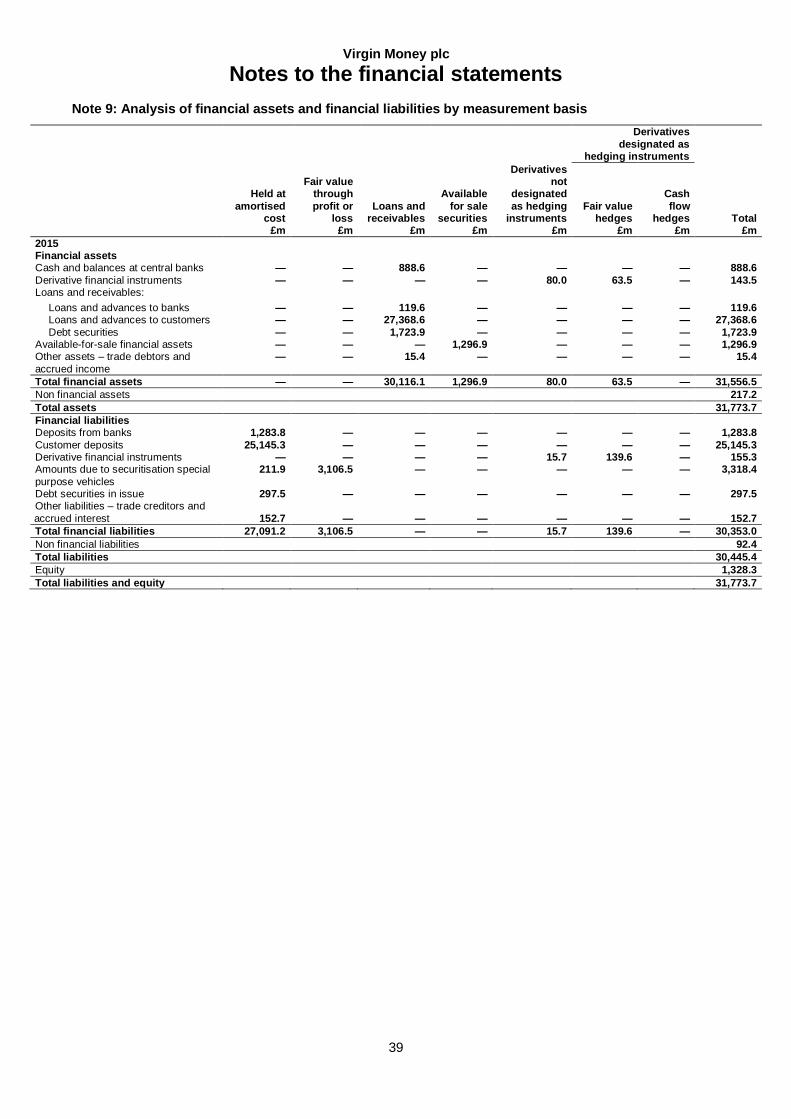
Virgin Money plc
Notes to the financial statements
39
Note 9: Analysis of financial assets and financial liabilities by measurement basis
Derivatives
designated as hedging instruments
Held at
amortised cost
£m
Fair value through
profit or loss
£m
Loans and receivables
£m
Available
for sale securities
£m
Derivatives not
designated
as hedging instruments
£m
Fair value hedges
£m
Cash
flow hedges
£m Total
£m
2015 Financial assets Cash and balances at central banks — — 888.6 — — — — 888.6 Derivative financial instruments — — — — 80.0 63.5 — 143.5 Loans and receivables:
Loans and advances to banks — — 119.6 — — — — 119.6 Loans and advances to customers — — 27,368.6 — — — — 27,368.6 Debt securities — — 1,723.9 — — — — 1,723.9
Available-for-sale financial assets — — — 1,296.9 — — — 1,296.9 Other assets – trade debtors and
accrued income
— — 15.4 — — — — 15.4
Total financial assets — — 30,116.1 1,296.9 80.0 63.5 — 31,556.5 Non financial assets 217.2 Total assets 31,773.7 Financial liabilities Deposits from banks 1,283.8 — — — — — — 1,283.8 Customer deposits 25,145.3 — — — — — — 25,145.3 Derivative financial instruments — — — — 15.7 139.6 — 155.3 Amounts due to securitisation special
purpose vehicles
211.9 3,106.5 — — — — — 3,318.4
Debt securities in issue 297.5 — — — — — — 297.5 Other liabilities – trade creditors and
accrued interest 152.7 — — — — — — 152.7 Total financial liabilities 27,091.2 3,106.5 — — 15.7 139.6 — 30,353.0 Non financial liabilities 92.4 Total liabilities 30,445.4 Equity 1,328.3 Total liabilities and equity 31,773.7
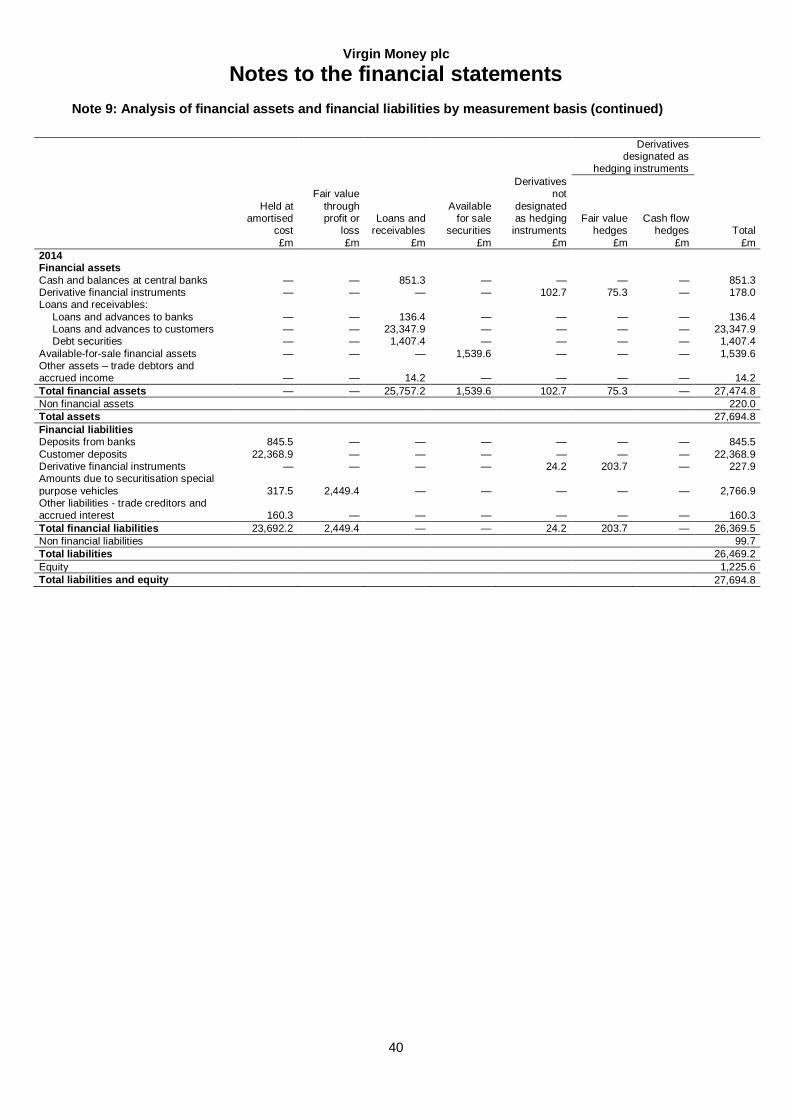
Virgin Money plc
Notes to the financial statements
40
Note 9: Analysis of financial assets and financial liabilities by measurement basis (continued)
Derivatives designated as
hedging instruments
Held at amortised
cost
£m
Fair value
through profit or
loss
£m
Loans and receivables
£m
Available for sale
securities
£m
Derivatives not
designated as hedging
instruments
£m
Fair value hedges
£m
Cash flow hedges
£m
Total
£m
2014 Financial assets
Cash and balances at central banks — — 851.3 — — — — 851.3 Derivative financial instruments — — — — 102.7 75.3 — 178.0 Loans and receivables:
Loans and advances to banks — — 136.4 — — — — 136.4 Loans and advances to customers — — 23,347.9 — — — — 23,347.9 Debt securities — — 1,407.4 — — — — 1,407.4
Available-for-sale financial assets — — — 1,539.6 — — — 1,539.6 Other assets – trade debtors and accrued income — — 14.2 — — — — 14.2
Total financial assets — — 25,757.2 1,539.6 102.7 75.3 — 27,474.8
Non financial assets 220.0
Total assets 27,694.8
Financial liabilities Deposits from banks 845.5 — — — — — — 845.5
Customer deposits 22,368.9 — — — — — — 22,368.9 Derivative financial instruments — — — — 24.2 203.7 — 227.9 Amounts due to securitisation special
purpose vehicles 317.5 2,449.4 — — — — — 2,766.9 Other liabilities - trade creditors and accrued interest 160.3 — — — — — — 160.3
Total financial liabilities 23,692.2 2,449.4 — — 24.2 203.7 — 26,369.5
Non financial liabilities 99.7
Total liabilities 26,469.2
Equity 1,225.6
Total liabilities and equity 27,694.8
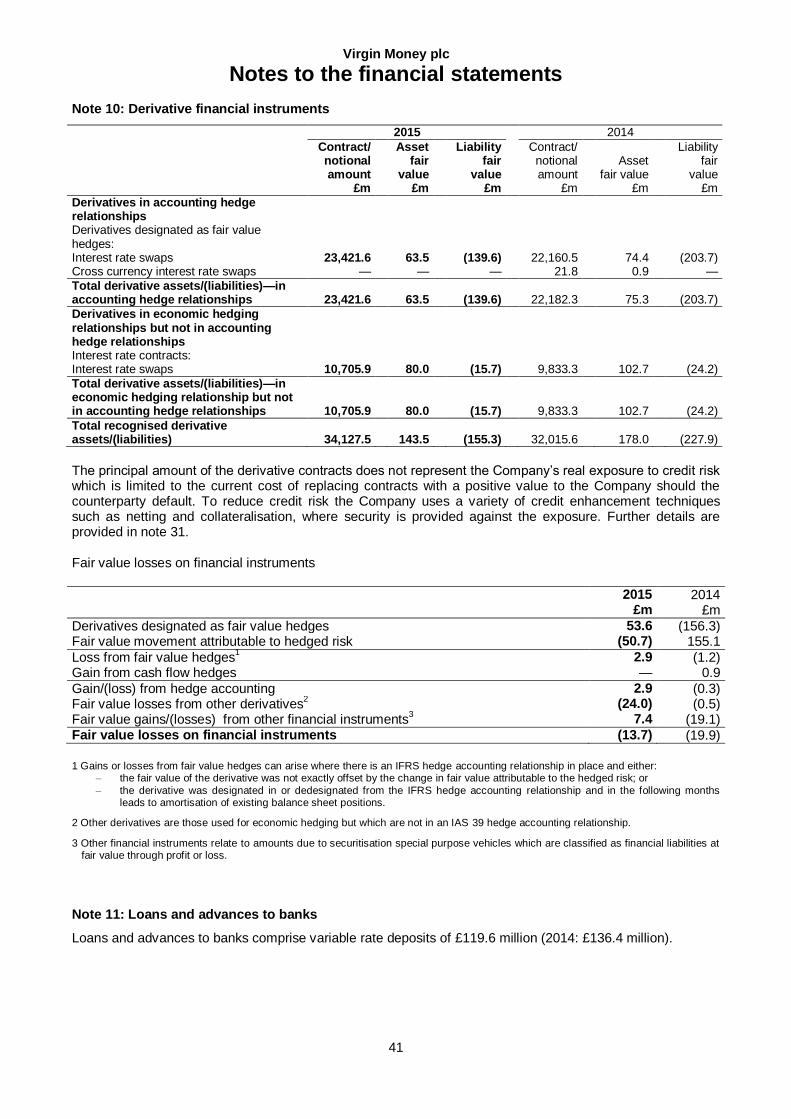
Virgin Money plc
Notes to the financial statements
41
Note 10: Derivative financial instruments
2015 2014
Contract/ notional amount
£m
Asset fair
value £m
Liability fair
value £m
Contract/ notional amount
£m
Asset
fair value £m
Liability fair
value £m
Derivatives in accounting hedge relationships
Derivatives designated as fair value hedges:
Interest rate swaps 23,421.6 63.5 (139.6) 22,160.5 74.4 (203.7) Cross currency interest rate swaps — — — 21.8 0.9 —
Total derivative assets/(liabilities)—in accounting hedge relationships 23,421.6 63.5 (139.6)
22,182.3
75.3
(203.7)
Derivatives in economic hedging relationships but not in accounting hedge relationships
Interest rate contracts: Interest rate swaps 10,705.9 80.0 (15.7) 9,833.3 102.7 (24.2)
Total derivative assets/(liabilities)—in economic hedging relationship but not in accounting hedge relationships 10,705.9
80.0 (15.7)
9,833.3
102.7
(24.2)
Total recognised derivative assets/(liabilities) 34,127.5
143.5 (155.3)
32,015.6
178.0
(227.9)
The principal amount of the derivative contracts does not represent the Company’s real exposure to credit risk which is limited to the current cost of replacing contracts with a positive value to the Company should the counterparty default. To reduce credit risk the Company uses a variety of credit enhancement techniques such as netting and collateralisation, where security is provided against the exposure. Further details are provided in note 31.
Fair value losses on financial instruments
2015 £m
2014 £m
Derivatives designated as fair value hedges 53.6 (156.3) Fair value movement attributable to hedged risk (50.7) 155.1
Loss from fair value hedges1 2.9 (1.2)
Gain from cash flow hedges — 0.9
Gain/(loss) from hedge accounting 2.9 (0.3) Fair value losses from other derivatives
2 (24.0) (0.5)
Fair value gains/(losses) from other financial instruments3
7.4 (19.1) Fair value losses on financial instruments (13.7) (19.9)
1 Gains or losses from fair value hedges can arise where there is an IFRS hedge accounting relationship in place and either: – the fair value of the derivative was not exactly offset by the change in fair value attributable to the hedged risk; or
– the derivative was designated in or dedesignated from the IFRS hedge accounting relationship and in the following months leads to amortisation of existing balance sheet positions.
2 Other derivatives are those used for economic hedging but which are not in an IAS 39 hedge accounting relationship.
3 Other financial instruments relate to amounts due to securitisation special purpose vehicles which are classified as financial liabilities at fair value through profit or loss.
Note 11: Loans and advances to banks
Loans and advances to banks comprise variable rate deposits of £119.6 million (2014: £136.4 million).
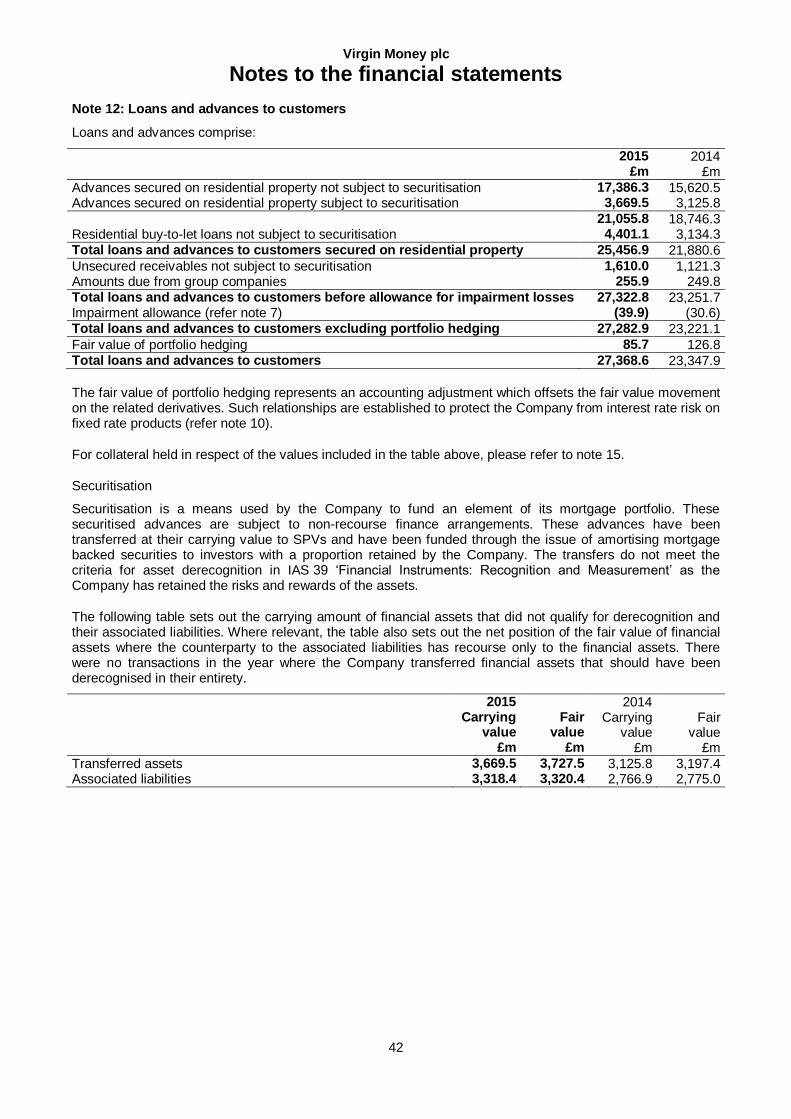
Virgin Money plc
Notes to the financial statements
42
Note 12: Loans and advances to customers
Loans and advances comprise:
2015 £m
2014 £m
Advances secured on residential property not subject to securitisation 17,386.3 15,620.5 Advances secured on residential property subject to securitisation 3,669.5 3,125.8
21,055.8 18,746.3 Residential buy-to-let loans not subject to securitisation 4,401.1 3,134.3 Total loans and advances to customers secured on residential property 25,456.9 21,880.6
Unsecured receivables not subject to securitisation 1,610.0 1,121.3 Amounts due from group companies 255.9 249.8 Total loans and advances to customers before allowance for impairment losses 27,322.8 23,251.7 Impairment allowance (refer note 7) (39.9) (30.6) Total loans and advances to customers excluding portfolio hedging 27,282.9 23,221.1
Fair value of portfolio hedging 85.7 126.8 Total loans and advances to customers 27,368.6 23,347.9
The fair value of portfolio hedging represents an accounting adjustment which offsets the fair value movement on the related derivatives. Such relationships are established to protect the Company from interest rate risk on fixed rate products (refer note 10).
For collateral held in respect of the values included in the table above, please refer to note 15.
Securitisation
Securitisation is a means used by the Company to fund an element of its mortgage portfolio. These securitised advances are subject to non-recourse finance arrangements. These advances have been transferred at their carrying value to SPVs and have been funded through the issue of amortising mortgage backed securities to investors with a proportion retained by the Company. The transfers do not meet the criteria for asset derecognition in IAS 39 ‘Financial Instruments: Recognition and Measurement’ as the Company has retained the risks and rewards of the assets.
The following table sets out the carrying amount of financial assets that did not qualify for derecognition and their associated liabilities. Where relevant, the table also sets out the net position of the fair value of financial assets where the counterparty to the associated liabilities has recourse only to the financial assets. There were no transactions in the year where the Company transferred financial assets that should have been derecognised in their entirety.
2015 Carrying
value £m
Fair value
£m
2014 Carrying
value £m
Fair value
£m
Transferred assets 3,669.5 3,727.5 3,125.8 3,197.4 Associated liabilities 3,318.4 3,320.4 2,766.9 2,775.0
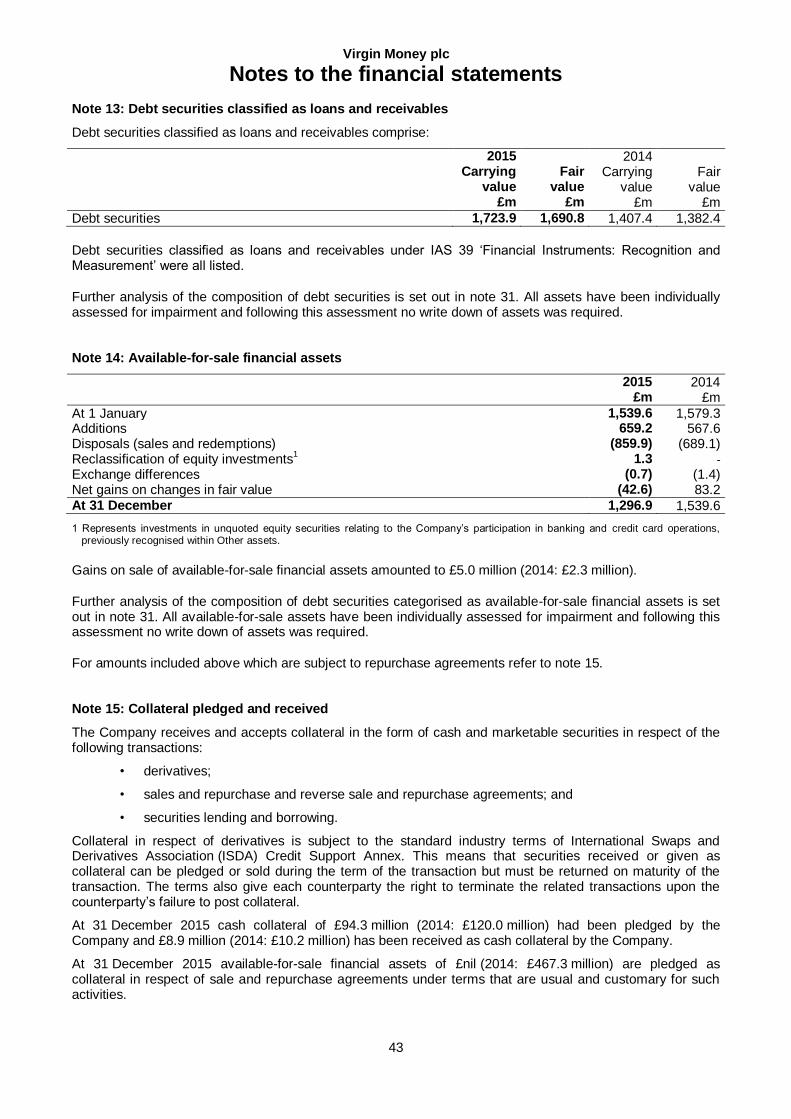
Virgin Money plc
Notes to the financial statements
43
Note 13: Debt securities classified as loans and receivables
Debt securities classified as loans and receivables comprise:
2015 Carrying
value £m
Fair value
£m
2014 Carrying
value £m
Fair value
£m
Debt securities 1,723.9 1,690.8 1,407.4 1,382.4
Debt securities classified as loans and receivables under IAS 39 ‘Financial Instruments: Recognition and Measurement’ were all listed.
Further analysis of the composition of debt securities is set out in note 31. All assets have been individually assessed for impairment and following this assessment no write down of assets was required. Note 14: Available-for-sale financial assets
2015 £m
2014 £m
At 1 January 1,539.6 1,579.3 Additions 659.2 567.6 Disposals (sales and redemptions) (859.9) (689.1) Reclassification of equity investments
1 1.3 -
Exchange differences (0.7) (1.4) Net gains on changes in fair value (42.6) 83.2 At 31 December 1,296.9 1,539.6
1 Represents investments in unquoted equity securities relating to the Company’s participation in banking and credit card operations, previously recognised within Other assets.
Gains on sale of available-for-sale financial assets amounted to £5.0 million (2014: £2.3 million).
Further analysis of the composition of debt securities categorised as available-for-sale financial assets is set out in note 31. All available-for-sale assets have been individually assessed for impairment and following this assessment no write down of assets was required.
For amounts included above which are subject to repurchase agreements refer to note 15. Note 15: Collateral pledged and received
The Company receives and accepts collateral in the form of cash and marketable securities in respect of the following transactions:
• derivatives;
• sales and repurchase and reverse sale and repurchase agreements; and
• securities lending and borrowing.
Collateral in respect of derivatives is subject to the standard industry terms of International Swaps and Derivatives Association (ISDA) Credit Support Annex. This means that securities received or given as collateral can be pledged or sold during the term of the transaction but must be returned on maturity of the transaction. The terms also give each counterparty the right to terminate the related transactions upon the counterparty’s failure to post collateral.
At 31 December 2015 cash collateral of £94.3 million (2014: £120.0 million) had been pledged by the Company and £8.9 million (2014: £10.2 million) has been received as cash collateral by the Company.
At 31 December 2015 available-for-sale financial assets of £nil (2014: £467.3 million) are pledged as collateral in respect of sale and repurchase agreements under terms that are usual and customary for such activities.
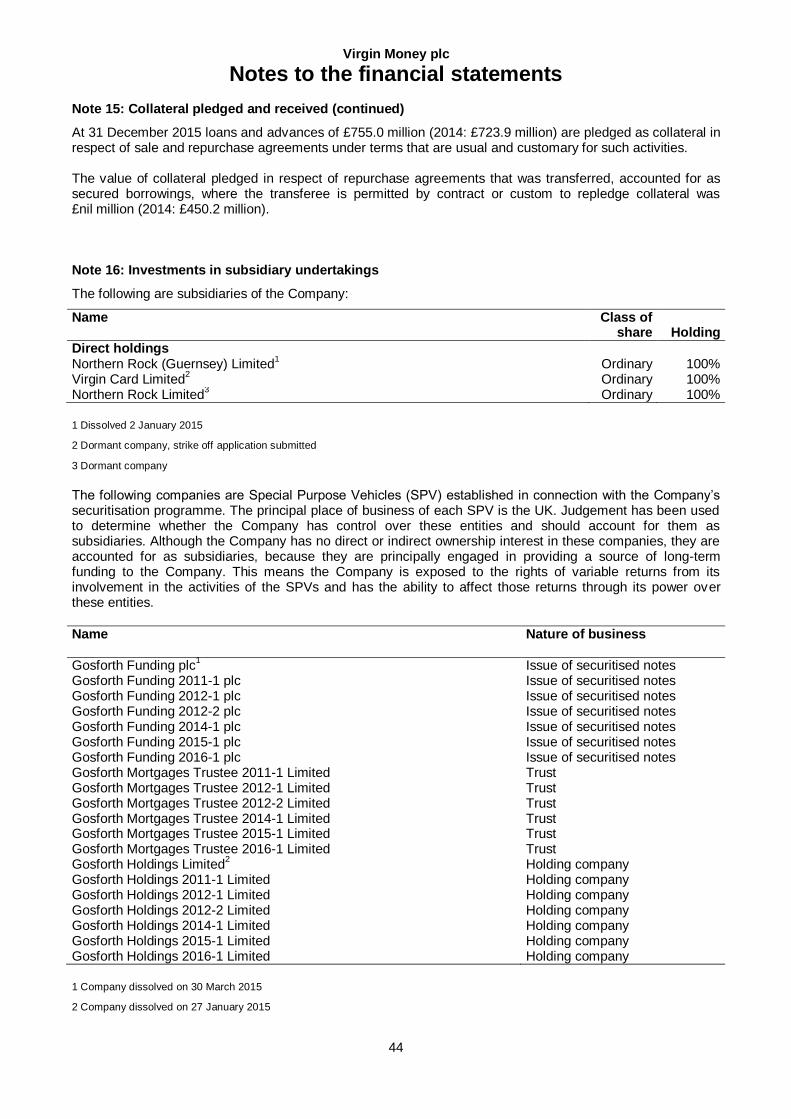
Virgin Money plc
Notes to the financial statements
44
Note 15: Collateral pledged and received (continued)
At 31 December 2015 loans and advances of £755.0 million (2014: £723.9 million) are pledged as collateral in respect of sale and repurchase agreements under terms that are usual and customary for such activities. The value of collateral pledged in respect of repurchase agreements that was transferred, accounted for as secured borrowings, where the transferee is permitted by contract or custom to repledge collateral was £nil million (2014: £450.2 million). Note 16: Investments in subsidiary undertakings
The following are subsidiaries of the Company:
Name Class of share Holding
Direct holdings Northern Rock (Guernsey) Limited
1 Ordinary 100%
Virgin Card Limited2 Ordinary 100%
Northern Rock Limited3 Ordinary 100%
1 Dissolved 2 January 2015
2 Dormant company, strike off application submitted
3 Dormant company
The following companies are Special Purpose Vehicles (SPV) established in connection with the Company’s securitisation programme. The principal place of business of each SPV is the UK. Judgement has been used to determine whether the Company has control over these entities and should account for them as subsidiaries. Although the Company has no direct or indirect ownership interest in these companies, they are accounted for as subsidiaries, because they are principally engaged in providing a source of long-term funding to the Company. This means the Company is exposed to the rights of variable returns from its involvement in the activities of the SPVs and has the ability to affect those returns through its power over these entities.
Name
Nature of business
Gosforth Funding plc1 Issue of securitised notes
Gosforth Funding 2011-1 plc Issue of securitised notes Gosforth Funding 2012-1 plc Issue of securitised notes Gosforth Funding 2012-2 plc Issue of securitised notes Gosforth Funding 2014-1 plc Issue of securitised notes Gosforth Funding 2015-1 plc Issue of securitised notes Gosforth Funding 2016-1 plc Issue of securitised notes Gosforth Mortgages Trustee 2011-1 Limited Trust Gosforth Mortgages Trustee 2012-1 Limited Trust Gosforth Mortgages Trustee 2012-2 Limited Trust Gosforth Mortgages Trustee 2014-1 Limited Trust Gosforth Mortgages Trustee 2015-1 Limited Trust Gosforth Mortgages Trustee 2016-1 Limited Trust Gosforth Holdings Limited
2 Holding company
Gosforth Holdings 2011-1 Limited Holding company Gosforth Holdings 2012-1 Limited Holding company Gosforth Holdings 2012-2 Limited Holding company Gosforth Holdings 2014-1 Limited Holding company Gosforth Holdings 2015-1 Limited Holding company Gosforth Holdings 2016-1 Limited Holding company
1 Company dissolved on 30 March 2015
2 Company dissolved on 27 January 2015
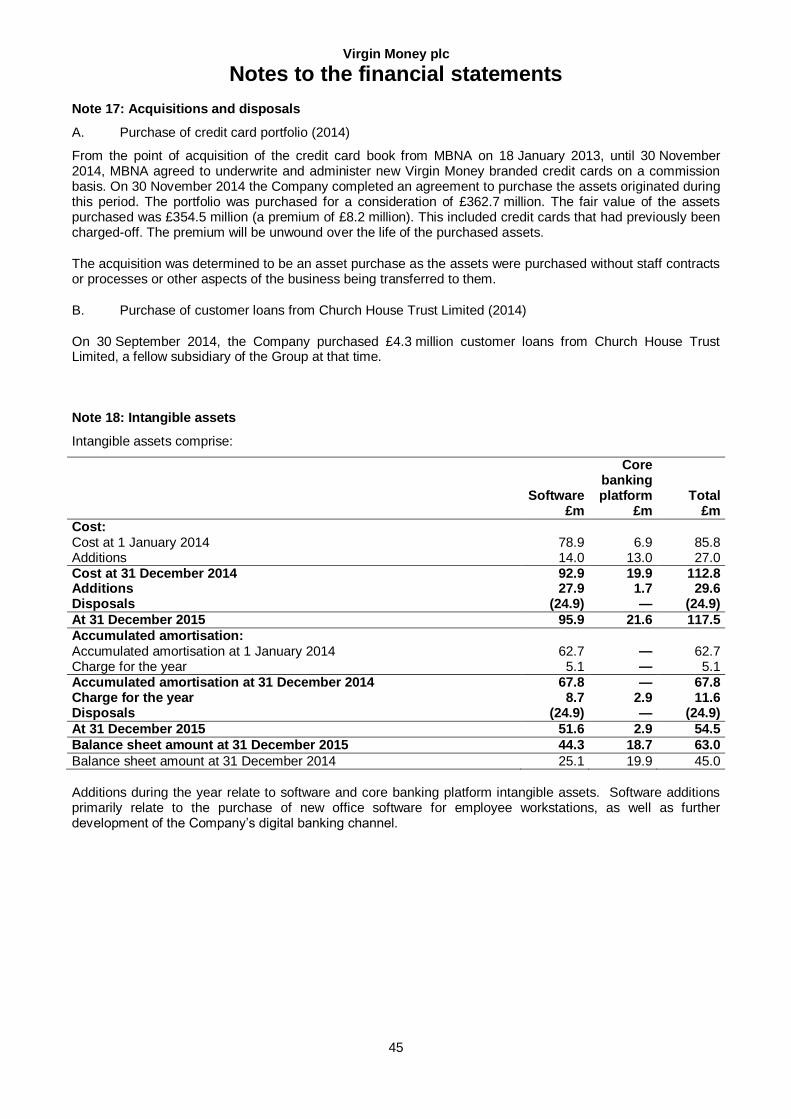
Virgin Money plc
Notes to the financial statements
45
Note 17: Acquisitions and disposals
A. Purchase of credit card portfolio (2014)
From the point of acquisition of the credit card book from MBNA on 18 January 2013, until 30 November 2014, MBNA agreed to underwrite and administer new Virgin Money branded credit cards on a commission basis. On 30 November 2014 the Company completed an agreement to purchase the assets originated during this period. The portfolio was purchased for a consideration of £362.7 million. The fair value of the assets purchased was £354.5 million (a premium of £8.2 million). This included credit cards that had previously been charged-off. The premium will be unwound over the life of the purchased assets.
The acquisition was determined to be an asset purchase as the assets were purchased without staff contracts or processes or other aspects of the business being transferred to them.
B. Purchase of customer loans from Church House Trust Limited (2014)
On 30 September 2014, the Company purchased £4.3 million customer loans from Church House Trust Limited, a fellow subsidiary of the Group at that time. Note 18: Intangible assets
Intangible assets comprise:
Software £m
Core banking platform
£m Total
£m
Cost: Cost at 1 January 2014 78.9 6.9 85.8 Additions 14.0 13.0 27.0 Cost at 31 December 2014 92.9 19.9 112.8 Additions 27.9 1.7 29.6 Disposals (24.9) — (24.9)
At 31 December 2015 95.9 21.6 117.5
Accumulated amortisation: Accumulated amortisation at 1 January 2014 62.7 — 62.7 Charge for the year 5.1 — 5.1 Accumulated amortisation at 31 December 2014 67.8 — 67.8 Charge for the year 8.7 2.9 11.6 Disposals (24.9) — (24.9)
At 31 December 2015 51.6 2.9 54.5
Balance sheet amount at 31 December 2015 44.3 18.7 63.0
Balance sheet amount at 31 December 2014 25.1 19.9 45.0 Additions during the year relate to software and core banking platform intangible assets. Software additions primarily relate to the purchase of new office software for employee workstations, as well as further development of the Company’s digital banking channel.
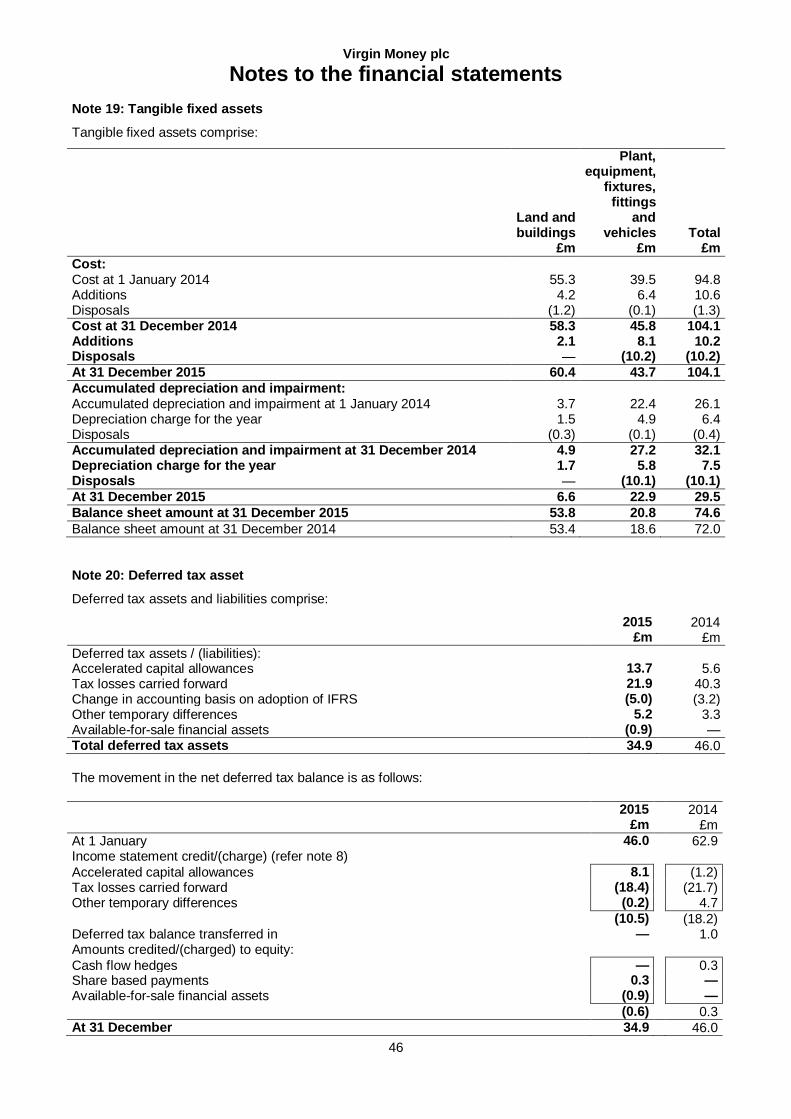
Virgin Money plc
Notes to the financial statements
46
Note 19: Tangible fixed assets
Tangible fixed assets comprise:
Land and buildings
£m
Plant, equipment,
fixtures, fittings
and vehicles
£m Total
£m
Cost: Cost at 1 January 2014 55.3 39.5 94.8 Additions 4.2 6.4 10.6 Disposals (1.2) (0.1) (1.3) Cost at 31 December 2014 58.3 45.8 104.1 Additions 2.1 8.1 10.2 Disposals — (10.2) (10.2)
At 31 December 2015 60.4 43.7 104.1
Accumulated depreciation and impairment: Accumulated depreciation and impairment at 1 January 2014 3.7 22.4 26.1 Depreciation charge for the year 1.5 4.9 6.4 Disposals (0.3) (0.1) (0.4) Accumulated depreciation and impairment at 31 December 2014 4.9 27.2 32.1 Depreciation charge for the year 1.7 5.8 7.5 Disposals — (10.1) (10.1)
At 31 December 2015 6.6 22.9 29.5
Balance sheet amount at 31 December 2015 53.8 20.8 74.6
Balance sheet amount at 31 December 2014 53.4 18.6 72.0
Note 20: Deferred tax asset
Deferred tax assets and liabilities comprise:
2015 £m
2014 £m
Deferred tax assets / (liabilities): Accelerated capital allowances 13.7 5.6 Tax losses carried forward 21.9 40.3 Change in accounting basis on adoption of IFRS (5.0) (3.2) Other temporary differences 5.2 3.3 Available-for-sale financial assets (0.9) — Total deferred tax assets 34.9 46.0
The movement in the net deferred tax balance is as follows:
2015 £m
2014 £m
At 1 January 46.0 62.9 Income statement credit/(charge) (refer note 8)
Accelerated capital allowances 8.1 (1.2) Tax losses carried forward (18.4) (21.7) Other temporary differences (0.2) 4.7
(10.5) (18.2) Deferred tax balance transferred in — 1.0 Amounts credited/(charged) to equity:
Cash flow hedges — 0.3 Share based payments 0.3 — Available-for-sale financial assets (0.9) —
(0.6) 0.3 At 31 December 34.9 46.0
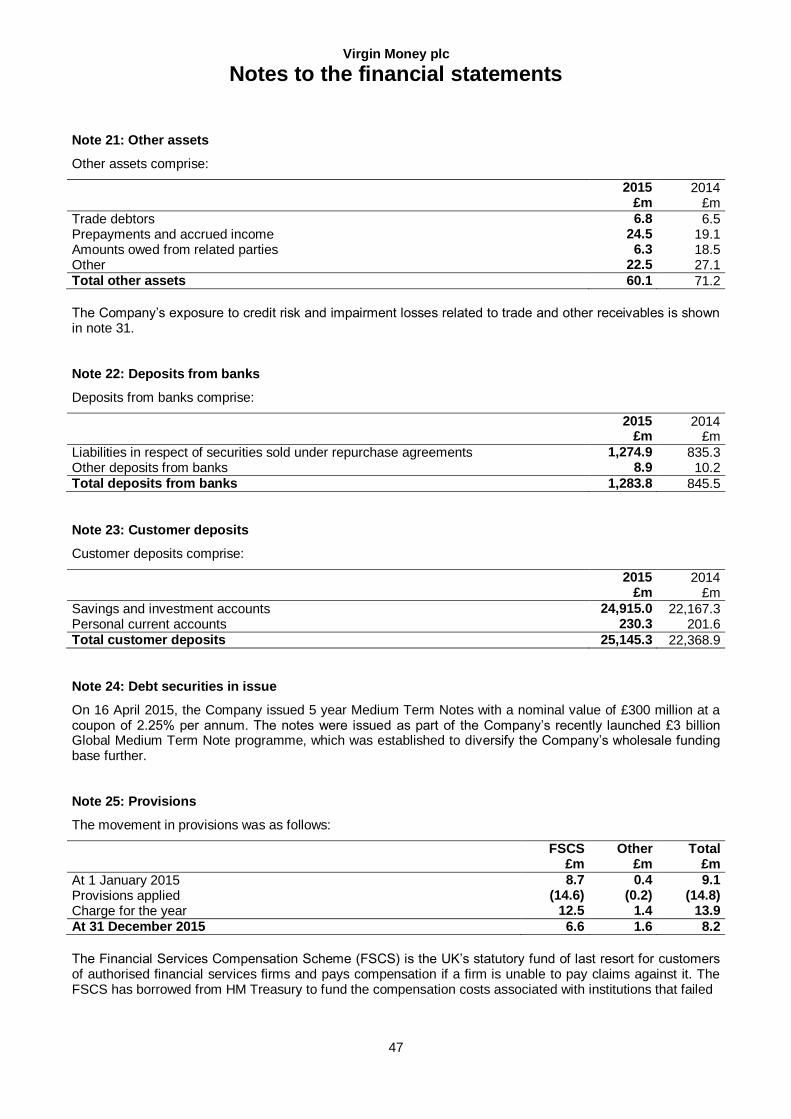
Virgin Money plc
Notes to the financial statements
47
Note 21: Other assets
Other assets comprise:
2015 £m
2014 £m
Trade debtors 6.8 6.5 Prepayments and accrued income 24.5 19.1 Amounts owed from related parties 6.3 18.5 Other 22.5 27.1 Total other assets 60.1 71.2
The Company’s exposure to credit risk and impairment losses related to trade and other receivables is shown in note 31. Note 22: Deposits from banks
Deposits from banks comprise:
2015 £m
2014 £m
Liabilities in respect of securities sold under repurchase agreements 1,274.9 835.3 Other deposits from banks 8.9 10.2 Total deposits from banks 1,283.8 845.5
Note 23: Customer deposits
Customer deposits comprise:
2015 £m
2014 £m
Savings and investment accounts 24,915.0 22,167.3 Personal current accounts 230.3 201.6 Total customer deposits 25,145.3 22,368.9
Note 24: Debt securities in issue
On 16 April 2015, the Company issued 5 year Medium Term Notes with a nominal value of £300 million at a coupon of 2.25% per annum. The notes were issued as part of the Company’s recently launched £3 billion Global Medium Term Note programme, which was established to diversify the Company’s wholesale funding base further. Note 25: Provisions
The movement in provisions was as follows:
FSCS £m
Other £m
Total £m
At 1 January 2015 8.7 0.4 9.1 Provisions applied (14.6) (0.2) (14.8) Charge for the year 12.5 1.4 13.9
At 31 December 2015 6.6 1.6 8.2
The Financial Services Compensation Scheme (FSCS) is the UK’s statutory fund of last resort for customers of authorised financial services firms and pays compensation if a firm is unable to pay claims against it. The FSCS has borrowed from HM Treasury to fund the compensation costs associated with institutions that failed
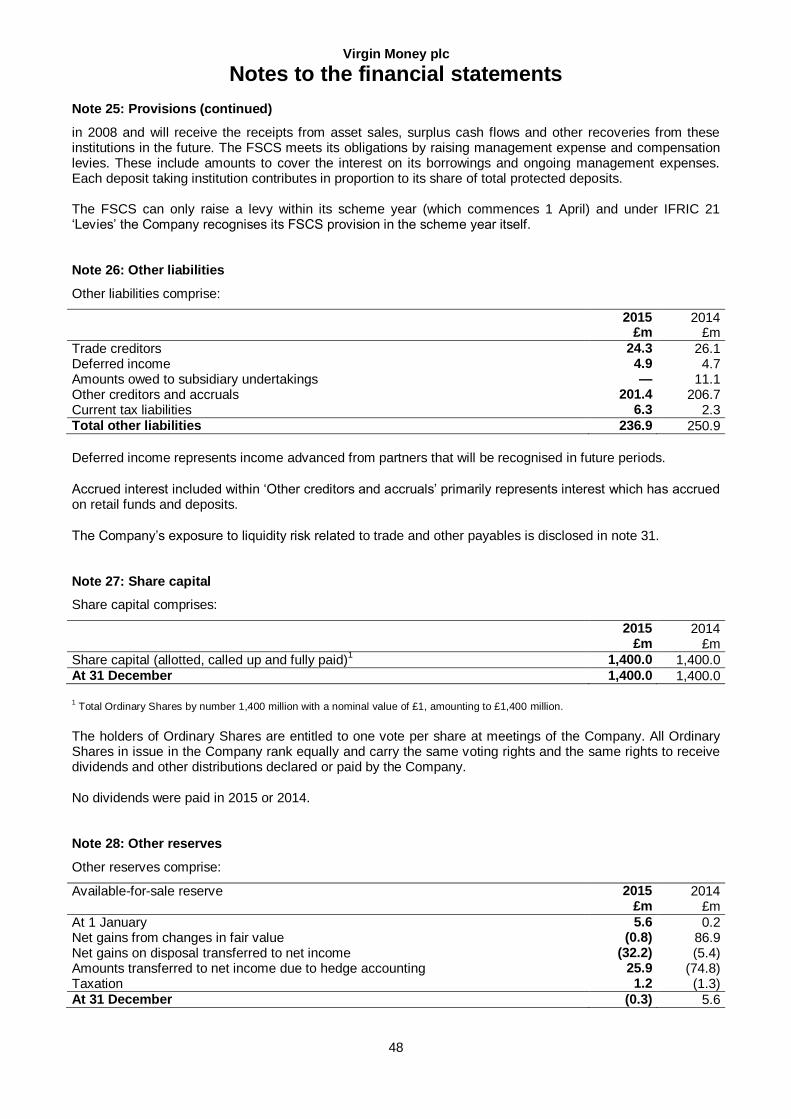
Virgin Money plc
Notes to the financial statements
48
Note 25: Provisions (continued)
in 2008 and will receive the receipts from asset sales, surplus cash flows and other recoveries from these institutions in the future. The FSCS meets its obligations by raising management expense and compensation levies. These include amounts to cover the interest on its borrowings and ongoing management expenses. Each deposit taking institution contributes in proportion to its share of total protected deposits. The FSCS can only raise a levy within its scheme year (which commences 1 April) and under IFRIC 21 ‘Levies’ the Company recognises its FSCS provision in the scheme year itself. Note 26: Other liabilities
Other liabilities comprise:
2015 £m
2014 £m
Trade creditors 24.3 26.1 Deferred income 4.9 4.7 Amounts owed to subsidiary undertakings — 11.1 Other creditors and accruals 201.4 206.7 Current tax liabilities 6.3 2.3 Total other liabilities 236.9 250.9
Deferred income represents income advanced from partners that will be recognised in future periods.
Accrued interest included within ‘Other creditors and accruals’ primarily represents interest which has accrued on retail funds and deposits.
The Company’s exposure to liquidity risk related to trade and other payables is disclosed in note 31. Note 27: Share capital
Share capital comprises:
2015 £m
2014 £m
Share capital (allotted, called up and fully paid)1 1,400.0 1,400.0
At 31 December 1,400.0 1,400.0
1 Total Ordinary Shares by number 1,400 million with a nominal value of £1, amounting to £1,400 million.
The holders of Ordinary Shares are entitled to one vote per share at meetings of the Company. All Ordinary Shares in issue in the Company rank equally and carry the same voting rights and the same rights to receive dividends and other distributions declared or paid by the Company.
No dividends were paid in 2015 or 2014. Note 28: Other reserves
Other reserves comprise:
Available-for-sale reserve 2015 £m
2014 £m
At 1 January 5.6 0.2 Net gains from changes in fair value (0.8) 86.9 Net gains on disposal transferred to net income (32.2) (5.4) Amounts transferred to net income due to hedge accounting 25.9 (74.8) Taxation 1.2 (1.3) At 31 December (0.3) 5.6
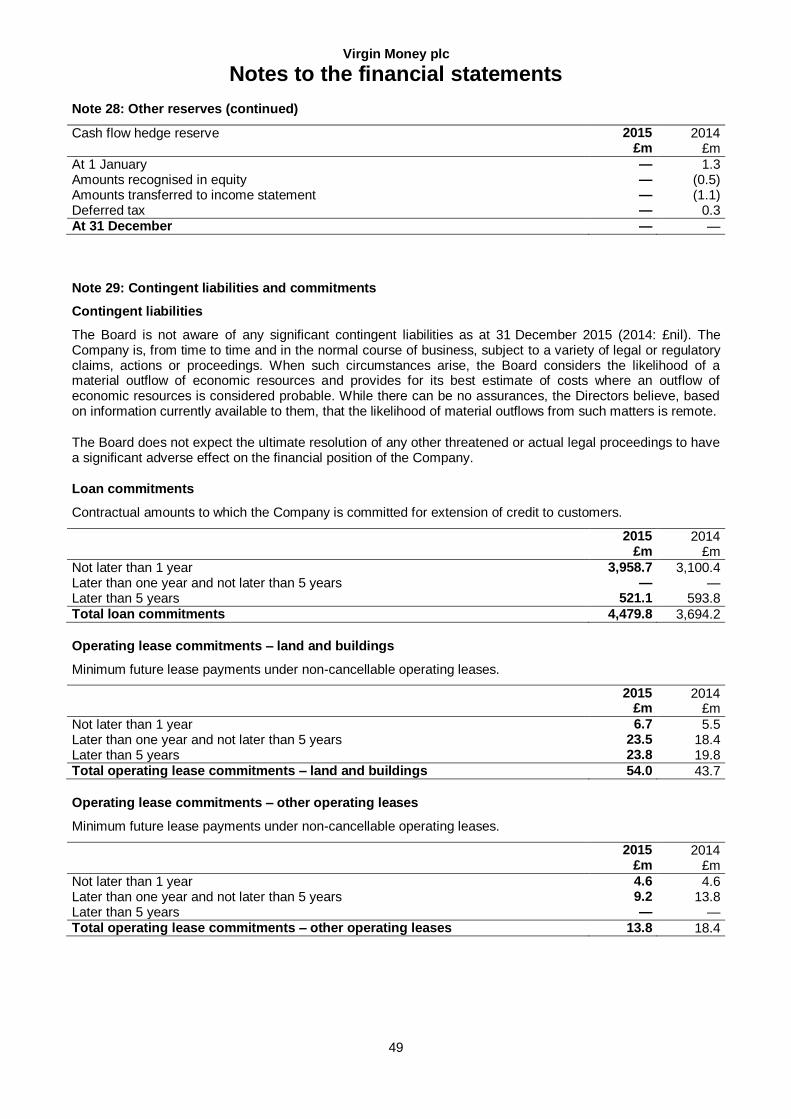
Virgin Money plc
Notes to the financial statements
49
Note 28: Other reserves (continued)
Cash flow hedge reserve 2015 £m
2014 £m
At 1 January — 1.3 Amounts recognised in equity — (0.5) Amounts transferred to income statement — (1.1) Deferred tax — 0.3 At 31 December — —
Note 29: Contingent liabilities and commitments
Contingent liabilities
The Board is not aware of any significant contingent liabilities as at 31 December 2015 (2014: £nil). The Company is, from time to time and in the normal course of business, subject to a variety of legal or regulatory claims, actions or proceedings. When such circumstances arise, the Board considers the likelihood of a material outflow of economic resources and provides for its best estimate of costs where an outflow of economic resources is considered probable. While there can be no assurances, the Directors believe, based on information currently available to them, that the likelihood of material outflows from such matters is remote.
The Board does not expect the ultimate resolution of any other threatened or actual legal proceedings to have a significant adverse effect on the financial position of the Company.
Loan commitments
Contractual amounts to which the Company is committed for extension of credit to customers.
2015 £m
2014 £m
Not later than 1 year 3,958.7 3,100.4 Later than one year and not later than 5 years — — Later than 5 years 521.1 593.8 Total loan commitments 4,479.8 3,694.2
Operating lease commitments – land and buildings
Minimum future lease payments under non-cancellable operating leases.
2015 £m
2014 £m
Not later than 1 year 6.7 5.5 Later than one year and not later than 5 years 23.5 18.4 Later than 5 years 23.8 19.8 Total operating lease commitments – land and buildings 54.0 43.7
Operating lease commitments – other operating leases
Minimum future lease payments under non-cancellable operating leases.
2015 £m
2014 £m
Not later than 1 year 4.6 4.6 Later than one year and not later than 5 years 9.2 13.8 Later than 5 years — — Total operating lease commitments – other operating leases 13.8 18.4
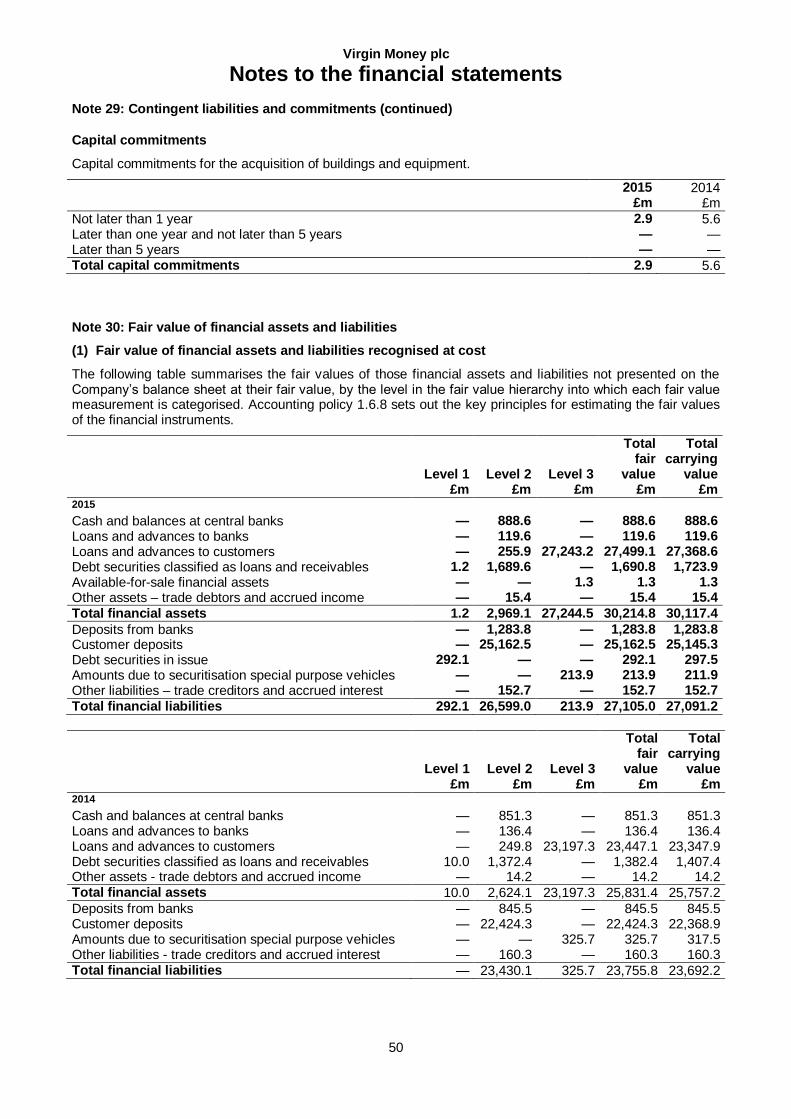
Virgin Money plc
Notes to the financial statements
50
Note 29: Contingent liabilities and commitments (continued)
Capital commitments
Capital commitments for the acquisition of buildings and equipment.
2015 £m
2014 £m
Not later than 1 year 2.9 5.6 Later than one year and not later than 5 years — — Later than 5 years — — Total capital commitments 2.9 5.6
Note 30: Fair value of financial assets and liabilities
(1) Fair value of financial assets and liabilities recognised at cost
The following table summarises the fair values of those financial assets and liabilities not presented on the Company’s balance sheet at their fair value, by the level in the fair value hierarchy into which each fair value measurement is categorised. Accounting policy 1.6.8 sets out the key principles for estimating the fair values of the financial instruments.
Level 1 £m
Level 2 £m
Level 3 £m
Total fair
value £m
Total carrying
value £m
2015 Cash and balances at central banks — 888.6 — 888.6 888.6 Loans and advances to banks — 119.6 — 119.6 119.6 Loans and advances to customers — 255.9 27,243.2 27,499.1 27,368.6 Debt securities classified as loans and receivables 1.2 1,689.6 — 1,690.8 1,723.9 Available-for-sale financial assets — — 1.3 1.3 1.3 Other assets – trade debtors and accrued income — 15.4 — 15.4 15.4
Total financial assets 1.2 2,969.1 27,244.5 30,214.8 30,117.4
Deposits from banks — 1,283.8 — 1,283.8 1,283.8 Customer deposits — 25,162.5 — 25,162.5 25,145.3 Debt securities in issue 292.1 — — 292.1 297.5 Amounts due to securitisation special purpose vehicles — — 213.9 213.9 211.9 Other liabilities – trade creditors and accrued interest — 152.7 — 152.7 152.7
Total financial liabilities 292.1 26,599.0 213.9 27,105.0 27,091.2
Level 1 £m
Level 2 £m
Level 3 £m
Total fair
value £m
Total carrying
value £m
2014 Cash and balances at central banks — 851.3 — 851.3 851.3 Loans and advances to banks — 136.4 — 136.4 136.4 Loans and advances to customers — 249.8 23,197.3 23,447.1 23,347.9 Debt securities classified as loans and receivables 10.0 1,372.4 — 1,382.4 1,407.4 Other assets - trade debtors and accrued income — 14.2 — 14.2 14.2 Total financial assets 10.0 2,624.1 23,197.3 25,831.4 25,757.2
Deposits from banks — 845.5 — 845.5 845.5 Customer deposits — 22,424.3 — 22,424.3 22,368.9 Amounts due to securitisation special purpose vehicles — — 325.7 325.7 317.5 Other liabilities - trade creditors and accrued interest — 160.3 — 160.3 160.3 Total financial liabilities — 23,430.1 325.7 23,755.8 23,692.2
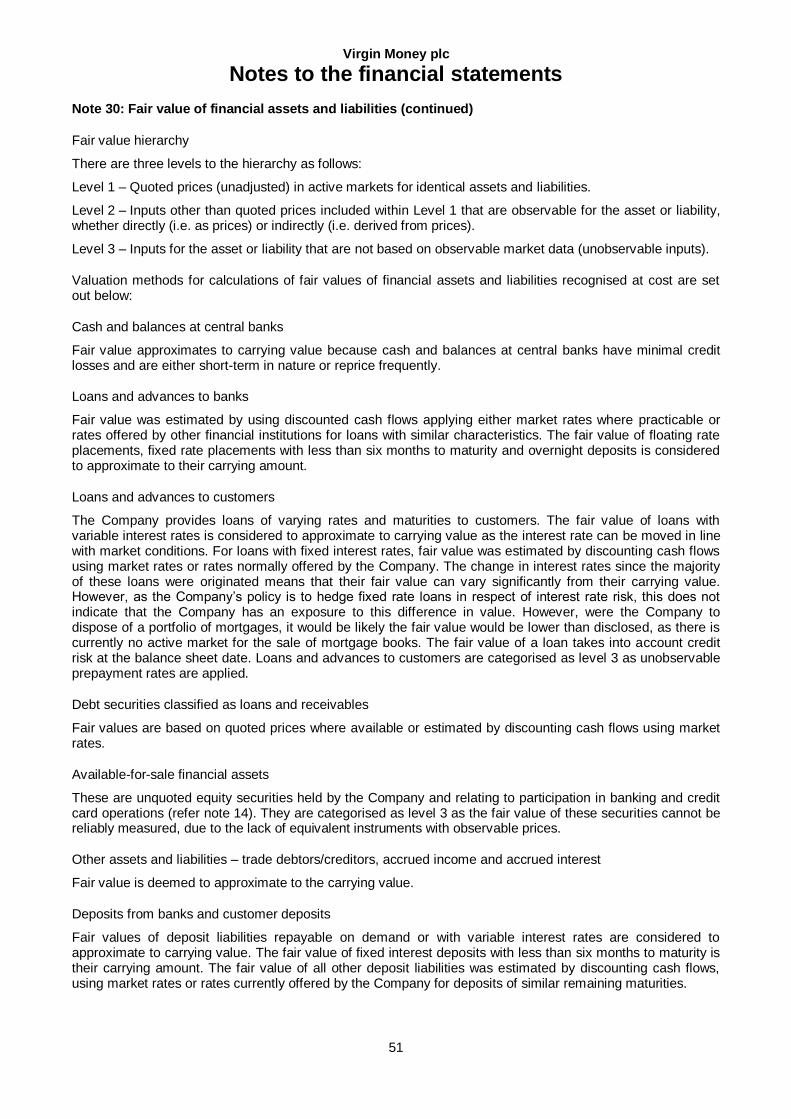
Virgin Money plc
Notes to the financial statements
51
Note 30: Fair value of financial assets and liabilities (continued)
Fair value hierarchy
There are three levels to the hierarchy as follows:
Level 1 – Quoted prices (unadjusted) in active markets for identical assets and liabilities.
Level 2 – Inputs other than quoted prices included within Level 1 that are observable for the asset or liability, whether directly (i.e. as prices) or indirectly (i.e. derived from prices).
Level 3 – Inputs for the asset or liability that are not based on observable market data (unobservable inputs).
Valuation methods for calculations of fair values of financial assets and liabilities recognised at cost are set out below:
Cash and balances at central banks
Fair value approximates to carrying value because cash and balances at central banks have minimal credit losses and are either short-term in nature or reprice frequently.
Loans and advances to banks
Fair value was estimated by using discounted cash flows applying either market rates where practicable or rates offered by other financial institutions for loans with similar characteristics. The fair value of floating rate placements, fixed rate placements with less than six months to maturity and overnight deposits is considered to approximate to their carrying amount.
Loans and advances to customers
The Company provides loans of varying rates and maturities to customers. The fair value of loans with variable interest rates is considered to approximate to carrying value as the interest rate can be moved in line with market conditions. For loans with fixed interest rates, fair value was estimated by discounting cash flows using market rates or rates normally offered by the Company. The change in interest rates since the majority of these loans were originated means that their fair value can vary significantly from their carrying value. However, as the Company’s policy is to hedge fixed rate loans in respect of interest rate risk, this does not indicate that the Company has an exposure to this difference in value. However, were the Company to dispose of a portfolio of mortgages, it would be likely the fair value would be lower than disclosed, as there is currently no active market for the sale of mortgage books. The fair value of a loan takes into account credit risk at the balance sheet date. Loans and advances to customers are categorised as level 3 as unobservable prepayment rates are applied.
Debt securities classified as loans and receivables
Fair values are based on quoted prices where available or estimated by discounting cash flows using market rates.
Available-for-sale financial assets
These are unquoted equity securities held by the Company and relating to participation in banking and credit card operations (refer note 14). They are categorised as level 3 as the fair value of these securities cannot be reliably measured, due to the lack of equivalent instruments with observable prices.
Other assets and liabilities – trade debtors/creditors, accrued income and accrued interest
Fair value is deemed to approximate to the carrying value.
Deposits from banks and customer deposits
Fair values of deposit liabilities repayable on demand or with variable interest rates are considered to approximate to carrying value. The fair value of fixed interest deposits with less than six months to maturity is their carrying amount. The fair value of all other deposit liabilities was estimated by discounting cash flows, using market rates or rates currently offered by the Company for deposits of similar remaining maturities.
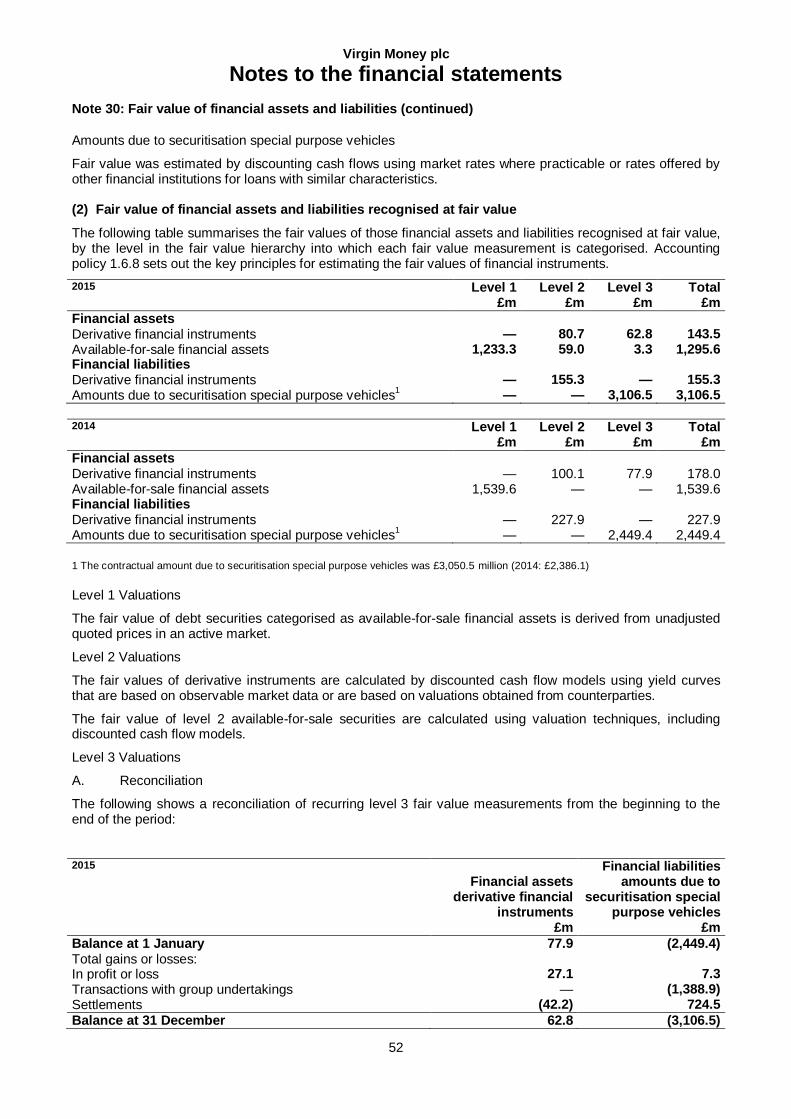
Virgin Money plc
Notes to the financial statements
52
Note 30: Fair value of financial assets and liabilities (continued)
Amounts due to securitisation special purpose vehicles
Fair value was estimated by discounting cash flows using market rates where practicable or rates offered by other financial institutions for loans with similar characteristics. (2) Fair value of financial assets and liabilities recognised at fair value
The following table summarises the fair values of those financial assets and liabilities recognised at fair value, by the level in the fair value hierarchy into which each fair value measurement is categorised. Accounting policy 1.6.8 sets out the key principles for estimating the fair values of financial instruments.
2015 Level 1 £m
Level 2 £m
Level 3 £m
Total £m
Financial assets Derivative financial instruments — 80.7 62.8 143.5 Available-for-sale financial assets 1,233.3 59.0 3.3 1,295.6 Financial liabilities Derivative financial instruments — 155.3 — 155.3 Amounts due to securitisation special purpose vehicles
1 — — 3,106.5 3,106.5
2014 Level 1
£m Level 2
£m Level 3
£m Total
£m
Financial assets Derivative financial instruments — 100.1 77.9 178.0 Available-for-sale financial assets 1,539.6 — — 1,539.6 Financial liabilities Derivative financial instruments — 227.9 — 227.9 Amounts due to securitisation special purpose vehicles
1 — — 2,449.4 2,449.4
1 The contractual amount due to securitisation special purpose vehicles was £3,050.5 million (2014: £2,386.1)
Level 1 Valuations
The fair value of debt securities categorised as available-for-sale financial assets is derived from unadjusted quoted prices in an active market.
Level 2 Valuations
The fair values of derivative instruments are calculated by discounted cash flow models using yield curves that are based on observable market data or are based on valuations obtained from counterparties.
The fair value of level 2 available-for-sale securities are calculated using valuation techniques, including discounted cash flow models.
Level 3 Valuations
A. Reconciliation
The following shows a reconciliation of recurring level 3 fair value measurements from the beginning to the end of the period:
2015
Financial assets derivative financial
instruments £m
Financial liabilities amounts due to
securitisation special purpose vehicles
£m
Balance at 1 January 77.9 (2,449.4) Total gains or losses: In profit or loss 27.1 7.3 Transactions with group undertakings — (1,388.9) Settlements (42.2) 724.5
Balance at 31 December 62.8 (3,106.5)
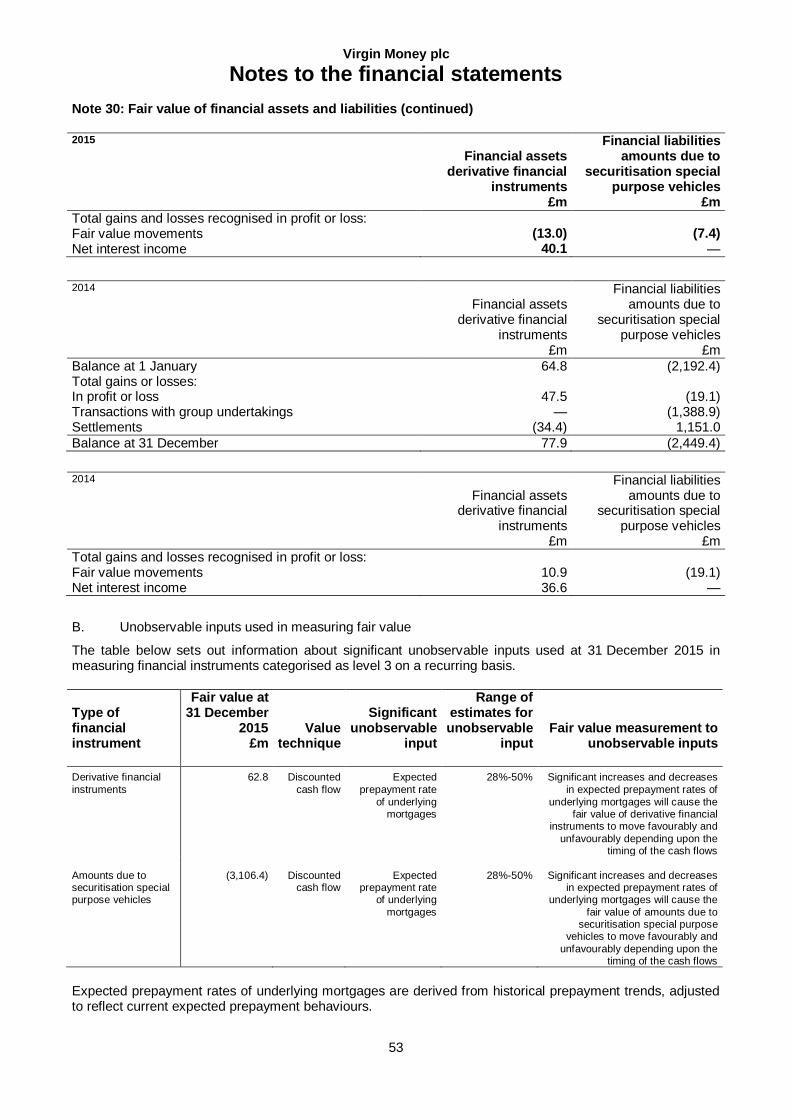
Virgin Money plc
Notes to the financial statements
53
Note 30: Fair value of financial assets and liabilities (continued)
2015
Financial assets derivative financial
instruments £m
Financial liabilities amounts due to
securitisation special purpose vehicles
£m
Total gains and losses recognised in profit or loss: Fair value movements (13.0) (7.4) Net interest income 40.1 —
2014
Financial assets derivative financial
instruments £m
Financial liabilities amounts due to
securitisation special purpose vehicles
£m
Balance at 1 January 64.8 (2,192.4) Total gains or losses: In profit or loss 47.5 (19.1) Transactions with group undertakings — (1,388.9) Settlements (34.4) 1,151.0
Balance at 31 December 77.9 (2,449.4)
2014
Financial assets derivative financial
instruments £m
Financial liabilities amounts due to
securitisation special purpose vehicles
£m
Total gains and losses recognised in profit or loss: Fair value movements 10.9 (19.1) Net interest income 36.6 —
B. Unobservable inputs used in measuring fair value
The table below sets out information about significant unobservable inputs used at 31 December 2015 in measuring financial instruments categorised as level 3 on a recurring basis.
Type of financial instrument
Fair value at 31 December
2015 £m
Value technique
Significant unobservable
input
Range of estimates for unobservable
input
Fair value measurement to unobservable inputs
Derivative financial
instruments
62.8 Discounted
cash flow
Expected
prepayment rate
of underlying mortgages
28%-50% Significant increases and decreases
in expected prepayment rates of
underlying mortgages will cause the fair value of derivative financial
instruments to move favourably and
unfavourably depending upon the timing of the cash flows
Amounts due to securitisation special purpose vehicles
(3,106.4) Discounted cash flow
Expected prepayment rate
of underlying
mortgages
28%-50% Significant increases and decreases in expected prepayment rates of
underlying mortgages will cause the
fair value of amounts due to securitisation special purpose
vehicles to move favourably and
unfavourably depending upon the timing of the cash flows
Expected prepayment rates of underlying mortgages are derived from historical prepayment trends, adjusted to reflect current expected prepayment behaviours.
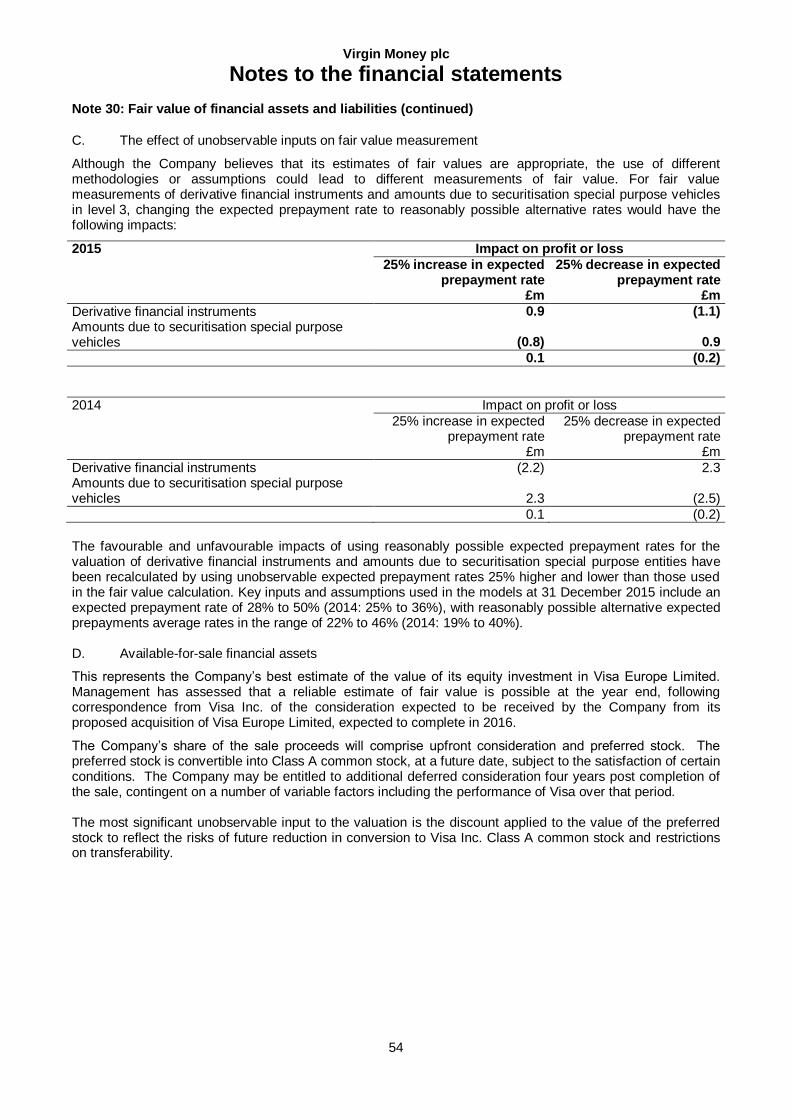
Virgin Money plc
Notes to the financial statements
54
Note 30: Fair value of financial assets and liabilities (continued)
C. The effect of unobservable inputs on fair value measurement
Although the Company believes that its estimates of fair values are appropriate, the use of different methodologies or assumptions could lead to different measurements of fair value. For fair value measurements of derivative financial instruments and amounts due to securitisation special purpose vehicles in level 3, changing the expected prepayment rate to reasonably possible alternative rates would have the following impacts:
2015 Impact on profit or loss 25% increase in expected
prepayment rate £m
25% decrease in expected prepayment rate
£m
Derivative financial instruments 0.9 (1.1) Amounts due to securitisation special purpose vehicles (0.8) 0.9
0.1 (0.2)
2014 Impact on profit or loss 25% increase in expected
prepayment rate £m
25% decrease in expected prepayment rate
£m
Derivative financial instruments (2.2) 2.3 Amounts due to securitisation special purpose vehicles 2.3 (2.5)
0.1 (0.2)
The favourable and unfavourable impacts of using reasonably possible expected prepayment rates for the valuation of derivative financial instruments and amounts due to securitisation special purpose entities have been recalculated by using unobservable expected prepayment rates 25% higher and lower than those used in the fair value calculation. Key inputs and assumptions used in the models at 31 December 2015 include an expected prepayment rate of 28% to 50% (2014: 25% to 36%), with reasonably possible alternative expected prepayments average rates in the range of 22% to 46% (2014: 19% to 40%). D. Available-for-sale financial assets
This represents the Company’s best estimate of the value of its equity investment in Visa Europe Limited. Management has assessed that a reliable estimate of fair value is possible at the year end, following correspondence from Visa Inc. of the consideration expected to be received by the Company from its proposed acquisition of Visa Europe Limited, expected to complete in 2016.
The Company’s share of the sale proceeds will comprise upfront consideration and preferred stock. The preferred stock is convertible into Class A common stock, at a future date, subject to the satisfaction of certain conditions. The Company may be entitled to additional deferred consideration four years post completion of the sale, contingent on a number of variable factors including the performance of Visa over that period. The most significant unobservable input to the valuation is the discount applied to the value of the preferred stock to reflect the risks of future reduction in conversion to Visa Inc. Class A common stock and restrictions on transferability.
Virgin Money plc
Notes to the financial statements
55
Note 31: Financial risk management
The principal risks to the Company through the use of financial instruments are: market risk, which includes interest rate mismatch risk and foreign currency risk; credit risk; and liquidity risk.
(1) Market risk
The Company uses various market risk measures for risk reporting and setting risk appetite limits and triggers. These measures include Capital at Risk and Earnings at Risk.
A. Interest rate mismatch risk
Interest rate mismatch risk arises from the different repricing characteristics of the assets and liabilities. Liabilities are either insensitive to interest rate movements, for example interest free or very low interest customer deposits, or are sensitive to interest rate changes and bear rates which may be varied at the Company’s discretion. There is a significant proportion of deposits with contractually fixed rates for their term to maturity.
Many assets are sensitive to interest rate movements. Some managed rate assets such as variable rate mortgages may be considered as a partial offset to the interest rate risk arising from the managed rate liabilities. A significant proportion of the Company’s lending assets (mortgages) bear interest rates which are contractually fixed for periods of up to five years or longer.
The Company establishes two types of hedge accounting relationships for interest rate risk: fair value hedges and cash flow hedges. The Company is exposed to fair value interest rate risk on fixed rate customer loans, fixed rate customer deposits and to cash flow interest rate risk on variable rate loans and deposits.
The following tables give an analysis of the repricing periods of assets and liabilities on the balance sheet. Mismatches in the repricing timing of assets, liabilities, and off-balance sheet positions create interest rate risk quantified in Capital at Risk and Earnings at Risk.
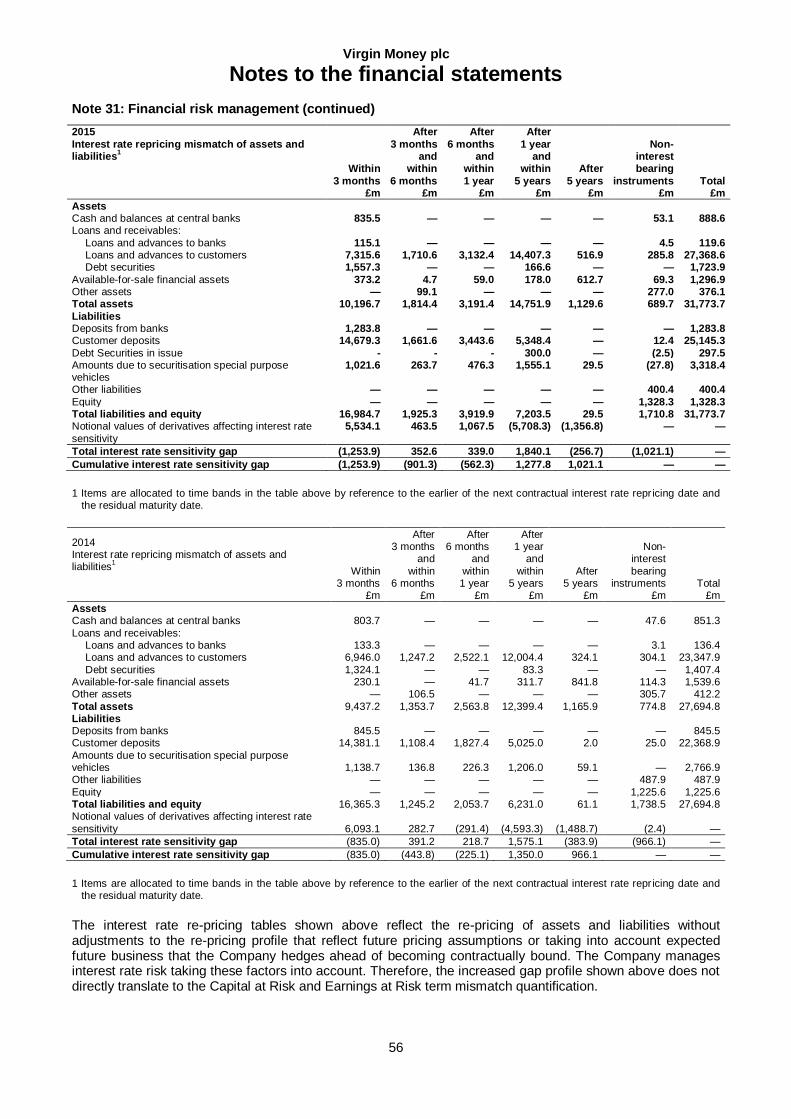
Virgin Money plc
Notes to the financial statements
56
Note 31: Financial risk management (continued)
2015
Interest rate repricing mismatch of assets and liabilities
1
Within
3 months £m
After
3 months and
within
6 months £m
After
6 months and
within
1 year £m
After
1 year and
within
5 years £m
After
5 years £m
Non-interest bearing
instruments £m
Total £m
Assets Cash and balances at central banks 835.5 — — — — 53.1 888.6 Loans and receivables:
Loans and advances to banks 115.1 — — — — 4.5 119.6 Loans and advances to customers 7,315.6 1,710.6 3,132.4 14,407.3 516.9 285.8 27,368.6 Debt securities 1,557.3 — — 166.6 — — 1,723.9
Available-for-sale financial assets 373.2 4.7 59.0 178.0 612.7 69.3 1,296.9 Other assets — 99.1 — — — 277.0 376.1 Total assets 10,196.7 1,814.4 3,191.4 14,751.9 1,129.6 689.7 31,773.7
Liabilities Deposits from banks 1,283.8 — — — — — 1,283.8 Customer deposits 14,679.3 1,661.6 3,443.6 5,348.4 — 12.4 25,145.3
Debt Securities in issue - - - 300.0 — (2.5) 297.5 Amounts due to securitisation special purpose vehicles
1,021.6 263.7 476.3 1,555.1 29.5 (27.8) 3,318.4
Other liabilities — — — — — 400.4 400.4
Equity — — — — — 1,328.3 1,328.3 Total liabilities and equity 16,984.7 1,925.3 3,919.9 7,203.5 29.5 1,710.8 31,773.7 Notional values of derivatives affecting interest rate
sensitivity
5,534.1 463.5 1,067.5 (5,708.3) (1,356.8) — —
Total interest rate sensitivity gap (1,253.9) 352.6 339.0 1,840.1 (256.7) (1,021.1) —
Cumulative interest rate sensitivity gap (1,253.9) (901.3) (562.3) 1,277.8 1,021.1 — —
1 Items are allocated to time bands in the table above by reference to the earlier of the next contractual interest rate repr icing date and the residual maturity date.
2014 Interest rate repricing mismatch of assets and liabilities
1 Within
3 months £m
After 3 months
and
within 6 months
£m
After 6 months
and
within 1 year
£m
After 1 year
and
within 5 years
£m
After 5 years
£m
Non- interest
bearing instruments
£m Total
£m
Assets Cash and balances at central banks 803.7 — — — — 47.6 851.3
Loans and receivables: Loans and advances to banks 133.3 — — — — 3.1 136.4 Loans and advances to customers 6,946.0 1,247.2 2,522.1 12,004.4 324.1 304.1 23,347.9
Debt securities 1,324.1 — — 83.3 — — 1,407.4 Available-for-sale financial assets 230.1 — 41.7 311.7 841.8 114.3 1,539.6 Other assets — 106.5 — — — 305.7 412.2
Total assets 9,437.2 1,353.7 2,563.8 12,399.4 1,165.9 774.8 27,694.8 Liabilities Deposits from banks 845.5 — — — — — 845.5 Customer deposits 14,381.1 1,108.4 1,827.4 5,025.0 2.0 25.0 22,368.9
Amounts due to securitisation special purpose vehicles 1,138.7 136.8 226.3 1,206.0 59.1 — 2,766.9 Other liabilities — — — — — 487.9 487.9
Equity — — — — — 1,225.6 1,225.6 Total liabilities and equity 16,365.3 1,245.2 2,053.7 6,231.0 61.1 1,738.5 27,694.8 Notional values of derivatives affecting interest rate
sensitivity 6,093.1 282.7 (291.4) (4,593.3) (1,488.7) (2.4) —
Total interest rate sensitivity gap (835.0) 391.2 218.7 1,575.1 (383.9) (966.1) —
Cumulative interest rate sensitivity gap (835.0) (443.8) (225.1) 1,350.0 966.1 — —
1 Items are allocated to time bands in the table above by reference to the earlier of the next contractual interest rate repr icing date and the residual maturity date.
The interest rate re-pricing tables shown above reflect the re-pricing of assets and liabilities without adjustments to the re-pricing profile that reflect future pricing assumptions or taking into account expected future business that the Company hedges ahead of becoming contractually bound. The Company manages interest rate risk taking these factors into account. Therefore, the increased gap profile shown above does not directly translate to the Capital at Risk and Earnings at Risk term mismatch quantification.
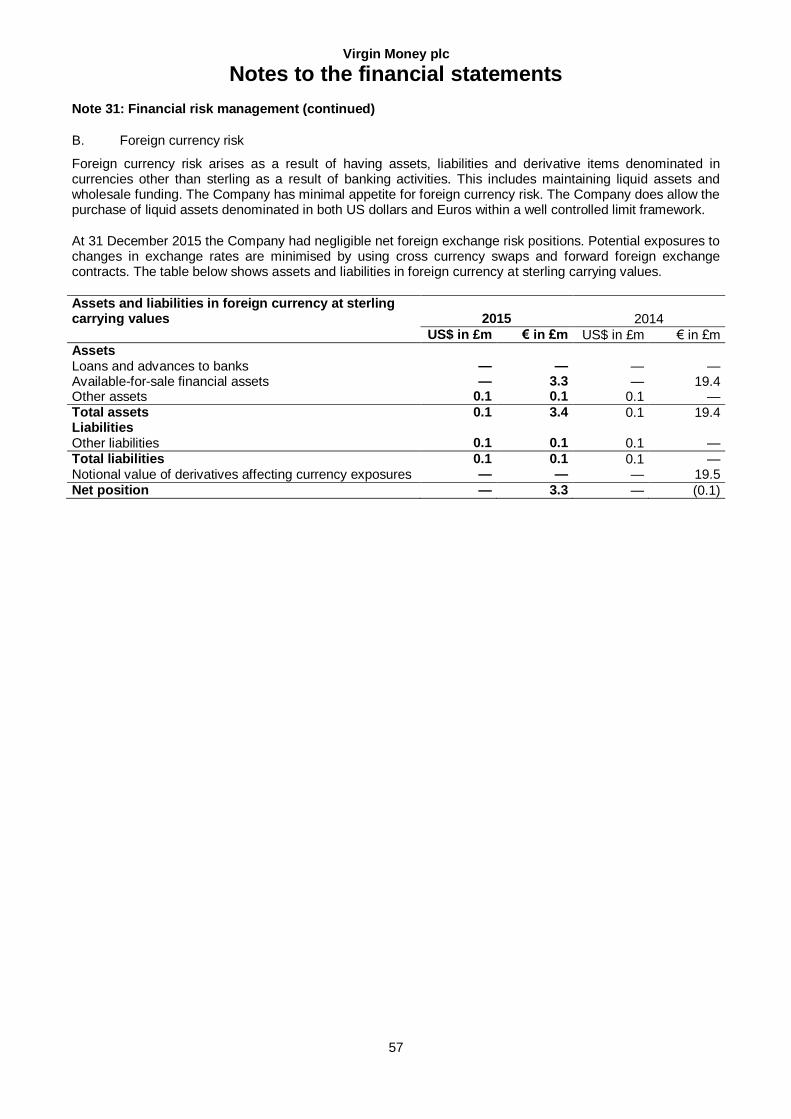
Virgin Money plc
Notes to the financial statements
57
Note 31: Financial risk management (continued)
B. Foreign currency risk
Foreign currency risk arises as a result of having assets, liabilities and derivative items denominated in currencies other than sterling as a result of banking activities. This includes maintaining liquid assets and wholesale funding. The Company has minimal appetite for foreign currency risk. The Company does allow the purchase of liquid assets denominated in both US dollars and Euros within a well controlled limit framework.
At 31 December 2015 the Company had negligible net foreign exchange risk positions. Potential exposures to changes in exchange rates are minimised by using cross currency swaps and forward foreign exchange contracts. The table below shows assets and liabilities in foreign currency at sterling carrying values.
Assets and liabilities in foreign currency at sterling carrying values 2015 2014
US$ in £m € in £m US$ in £m € in £m Assets Loans and advances to banks — — — — Available-for-sale financial assets — 3.3 — 19.4 Other assets 0.1 0.1 0.1 — Total assets 0.1 3.4 0.1 19.4 Liabilities Other liabilities 0.1 0.1 0.1 — Total liabilities 0.1 0.1 0.1 — Notional value of derivatives affecting currency exposures — — — 19.5 Net position — 3.3 — (0.1)
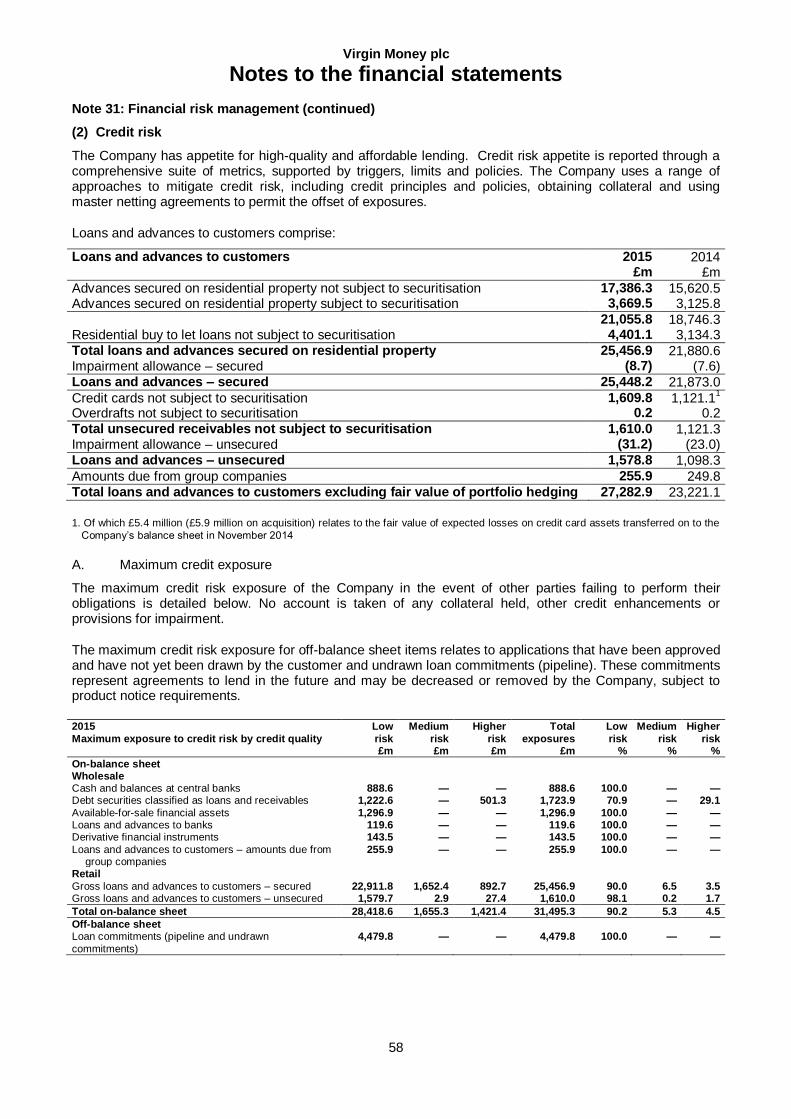
Virgin Money plc
Notes to the financial statements
58
Note 31: Financial risk management (continued)
(2) Credit risk
The Company has appetite for high-quality and affordable lending. Credit risk appetite is reported through a comprehensive suite of metrics, supported by triggers, limits and policies. The Company uses a range of approaches to mitigate credit risk, including credit principles and policies, obtaining collateral and using master netting agreements to permit the offset of exposures.
Loans and advances to customers comprise:
Loans and advances to customers 2015 £m
2014 £m
Advances secured on residential property not subject to securitisation 17,386.3 15,620.5 Advances secured on residential property subject to securitisation 3,669.5 3,125.8
21,055.8 18,746.3 Residential buy to let loans not subject to securitisation 4,401.1 3,134.3 Total loans and advances secured on residential property 25,456.9 21,880.6 Impairment allowance – secured (8.7) (7.6) Loans and advances – secured 25,448.2 21,873.0
Credit cards not subject to securitisation 1,609.8 1,121.11
Overdrafts not subject to securitisation 0.2 0.2 Total unsecured receivables not subject to securitisation 1,610.0 1,121.3 Impairment allowance – unsecured (31.2) (23.0) Loans and advances – unsecured 1,578.8 1,098.3
Amounts due from group companies 255.9 249.8 Total loans and advances to customers excluding fair value of portfolio hedging 27,282.9 23,221.1
1. Of which £5.4 million (£5.9 million on acquisition) relates to the fair value of expected losses on credit card assets transferred on to the
Company’s balance sheet in November 2014
A. Maximum credit exposure
The maximum credit risk exposure of the Company in the event of other parties failing to perform their obligations is detailed below. No account is taken of any collateral held, other credit enhancements or provisions for impairment.
The maximum credit risk exposure for off-balance sheet items relates to applications that have been approved and have not yet been drawn by the customer and undrawn loan commitments (pipeline). These commitments represent agreements to lend in the future and may be decreased or removed by the Company, subject to product notice requirements.
2015
Maximum exposure to credit risk by credit quality
Low
risk £m
Medium
risk £m
Higher
risk £m
Total
exposures £m
Low
risk %
Medium
risk %
Higher
risk %
On-balance sheet Wholesale Cash and balances at central banks 888.6 — — 888.6 100.0 — — Debt securities classified as loans and receivables 1,222.6 — 501.3 1,723.9 70.9 — 29.1
Available-for-sale financial assets 1,296.9 — — 1,296.9 100.0 — — Loans and advances to banks 119.6 — — 119.6 100.0 — — Derivative financial instruments 143.5 — — 143.5 100.0 — —
Loans and advances to customers – amounts due from group companies
255.9 — — 255.9 100.0 — —
Retail
Gross loans and advances to customers – secured 22,911.8 1,652.4 892.7 25,456.9 90.0 6.5 3.5 Gross loans and advances to customers – unsecured 1,579.7 2.9 27.4 1,610.0 98.1 0.2 1.7
Total on-balance sheet 28,418.6 1,655.3 1,421.4 31,495.3 90.2 5.3 4.5
Off-balance sheet Loan commitments (pipeline and undrawn
commitments)
4,479.8 — — 4,479.8 100.0 — —
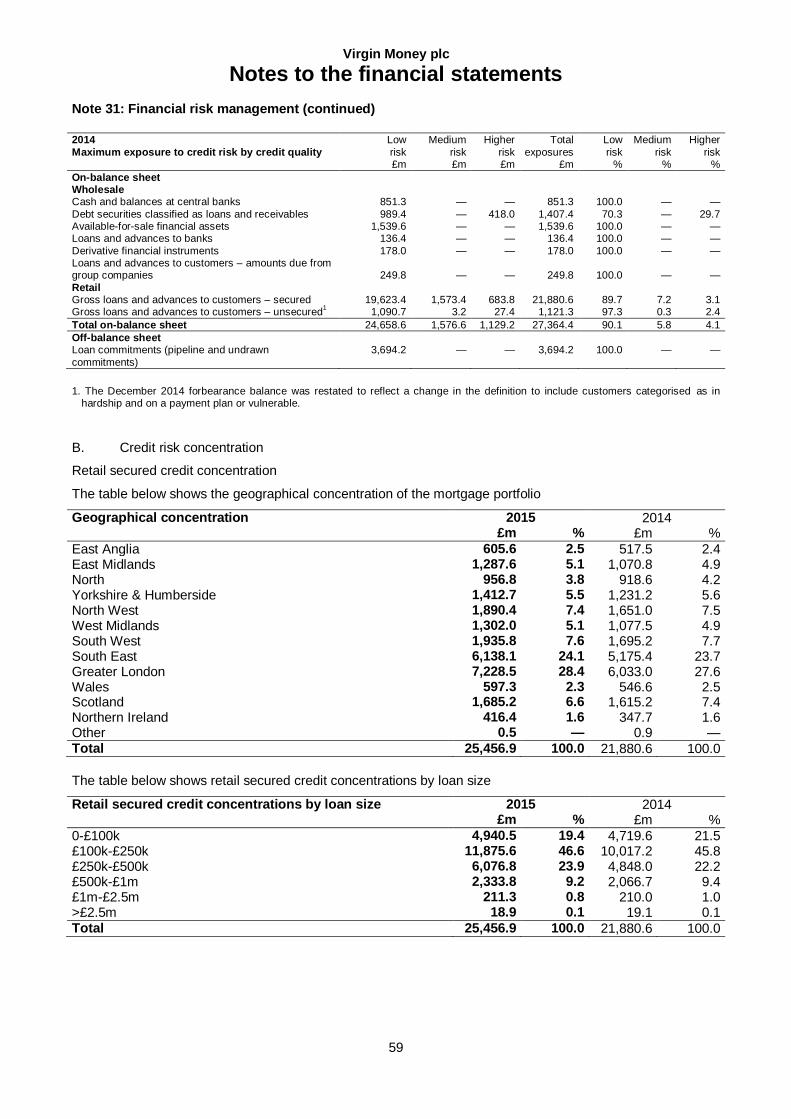
Virgin Money plc
Notes to the financial statements
59
Note 31: Financial risk management (continued)
2014
Maximum exposure to credit risk by credit quality
Low
risk £m
Medium
risk £m
Higher
risk £m
Total
exposures £m
Low
risk %
Medium
risk %
Higher
risk %
On-balance sheet Wholesale Cash and balances at central banks 851.3 — — 851.3 100.0 — —
Debt securities classified as loans and receivables 989.4 — 418.0 1,407.4 70.3 — 29.7 Available-for-sale financial assets 1,539.6 — — 1,539.6 100.0 — — Loans and advances to banks 136.4 — — 136.4 100.0 — —
Derivative financial instruments 178.0 — — 178.0 100.0 — — Loans and advances to customers – amounts due from group companies 249.8 — — 249.8 100.0 — —
Retail Gross loans and advances to customers – secured 19,623.4 1,573.4 683.8 21,880.6 89.7 7.2 3.1 Gross loans and advances to customers – unsecured
1 1,090.7 3.2 27.4 1,121.3 97.3 0.3 2.4
Total on-balance sheet 24,658.6 1,576.6 1,129.2 27,364.4 90.1 5.8 4.1
Off-balance sheet Loan commitments (pipeline and undrawn
commitments)
3,694.2 — — 3,694.2 100.0 — —
1. The December 2014 forbearance balance was restated to reflect a change in the definition to include customers categorised as in hardship and on a payment plan or vulnerable.
B. Credit risk concentration
Retail secured credit concentration
The table below shows the geographical concentration of the mortgage portfolio
Geographical concentration 2015 2014 £m % £m %
East Anglia 605.6 2.5 517.5 2.4 East Midlands 1,287.6 5.1 1,070.8 4.9 North 956.8 3.8 918.6 4.2 Yorkshire & Humberside 1,412.7 5.5 1,231.2 5.6 North West 1,890.4 7.4 1,651.0 7.5 West Midlands 1,302.0 5.1 1,077.5 4.9 South West 1,935.8 7.6 1,695.2 7.7 South East 6,138.1 24.1 5,175.4 23.7 Greater London 7,228.5 28.4 6,033.0 27.6 Wales 597.3 2.3 546.6 2.5 Scotland 1,685.2 6.6 1,615.2 7.4 Northern Ireland 416.4 1.6 347.7 1.6 Other 0.5 — 0.9 — Total 25,456.9 100.0 21,880.6 100.0
The table below shows retail secured credit concentrations by loan size
Retail secured credit concentrations by loan size 2015 2014 £m % £m %
0-£100k 4,940.5 19.4 4,719.6 21.5 £100k-£250k 11,875.6 46.6 10,017.2 45.8 £250k-£500k 6,076.8 23.9 4,848.0 22.2 £500k-£1m 2,333.8 9.2 2,066.7 9.4 £1m-£2.5m 211.3 0.8 210.0 1.0 >£2.5m 18.9 0.1 19.1 0.1 Total 25,456.9 100.0 21,880.6 100.0
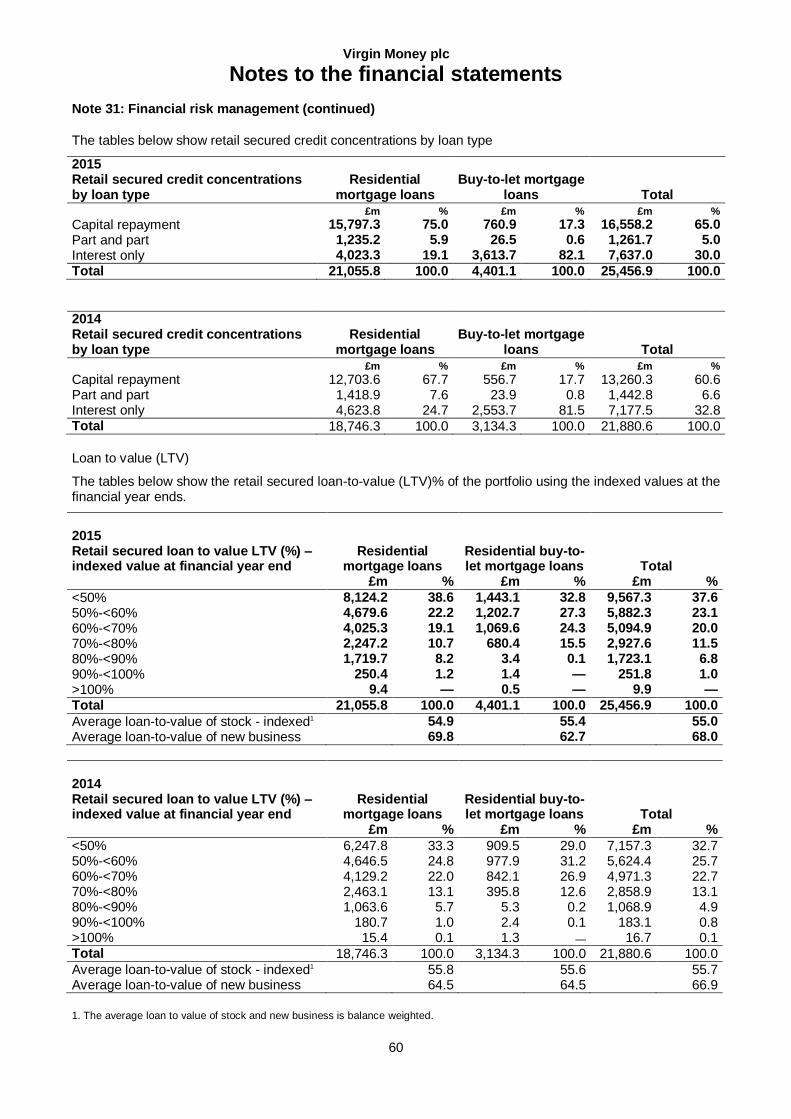
Virgin Money plc
Notes to the financial statements
60
Note 31: Financial risk management (continued)
The tables below show retail secured credit concentrations by loan type
2015 Retail secured credit concentrations by loan type
Residential mortgage loans
Buy-to-let mortgage loans Total
£m % £m % £m %
Capital repayment 15,797.3 75.0 760.9 17.3 16,558.2 65.0 Part and part 1,235.2 5.9 26.5 0.6 1,261.7 5.0 Interest only 4,023.3 19.1 3,613.7 82.1 7,637.0 30.0
Total 21,055.8 100.0 4,401.1 100.0 25,456.9 100.0
2014 Retail secured credit concentrations by loan type
Residential mortgage loans
Buy-to-let mortgage loans Total
£m % £m % £m %
Capital repayment 12,703.6 67.7 556.7 17.7 13,260.3 60.6 Part and part 1,418.9 7.6 23.9 0.8 1,442.8 6.6 Interest only 4,623.8 24.7 2,553.7 81.5 7,177.5 32.8 Total 18,746.3 100.0 3,134.3 100.0 21,880.6 100.0
Loan to value (LTV)
The tables below show the retail secured loan-to-value (LTV)% of the portfolio using the indexed values at the financial year ends.
2015 Retail secured loan to value LTV (%) – indexed value at financial year end
Residential mortgage loans
Residential buy-to-let mortgage loans Total
£m % £m % £m %
<50% 8,124.2 38.6 1,443.1 32.8 9,567.3 37.6 50%-<60% 4,679.6 22.2 1,202.7 27.3 5,882.3 23.1 60%-<70% 4,025.3 19.1 1,069.6 24.3 5,094.9 20.0 70%-<80% 2,247.2 10.7 680.4 15.5 2,927.6 11.5 80%-<90% 1,719.7 8.2 3.4 0.1 1,723.1 6.8 90%-<100% 250.4 1.2 1.4 — 251.8 1.0 >100% 9.4 — 0.5 — 9.9 —
Total 21,055.8 100.0 4,401.1 100.0 25,456.9 100.0
Average loan-to-value of stock - indexed1 54.9 55.4 55.0 Average loan-to-value of new business 69.8 62.7 68.0
2014 Retail secured loan to value LTV (%) – indexed value at financial year end
Residential mortgage loans
Residential buy-to-let mortgage loans Total
£m % £m % £m %
<50% 6,247.8 33.3 909.5 29.0 7,157.3 32.7 50%-<60% 4,646.5 24.8 977.9 31.2 5,624.4 25.7 60%-<70% 4,129.2 22.0 842.1 26.9 4,971.3 22.7 70%-<80% 2,463.1 13.1 395.8 12.6 2,858.9 13.1 80%-<90% 1,063.6 5.7 5.3 0.2 1,068.9 4.9 90%-<100% 180.7 1.0 2.4 0.1 183.1 0.8 >100% 15.4 0.1 1.3 — 16.7 0.1 Total 18,746.3 100.0 3,134.3 100.0 21,880.6 100.0
Average loan-to-value of stock - indexed1 55.8 55.6 55.7 Average loan-to-value of new business 64.5 64.5 66.9
1. The average loan to value of stock and new business is balance weighted.
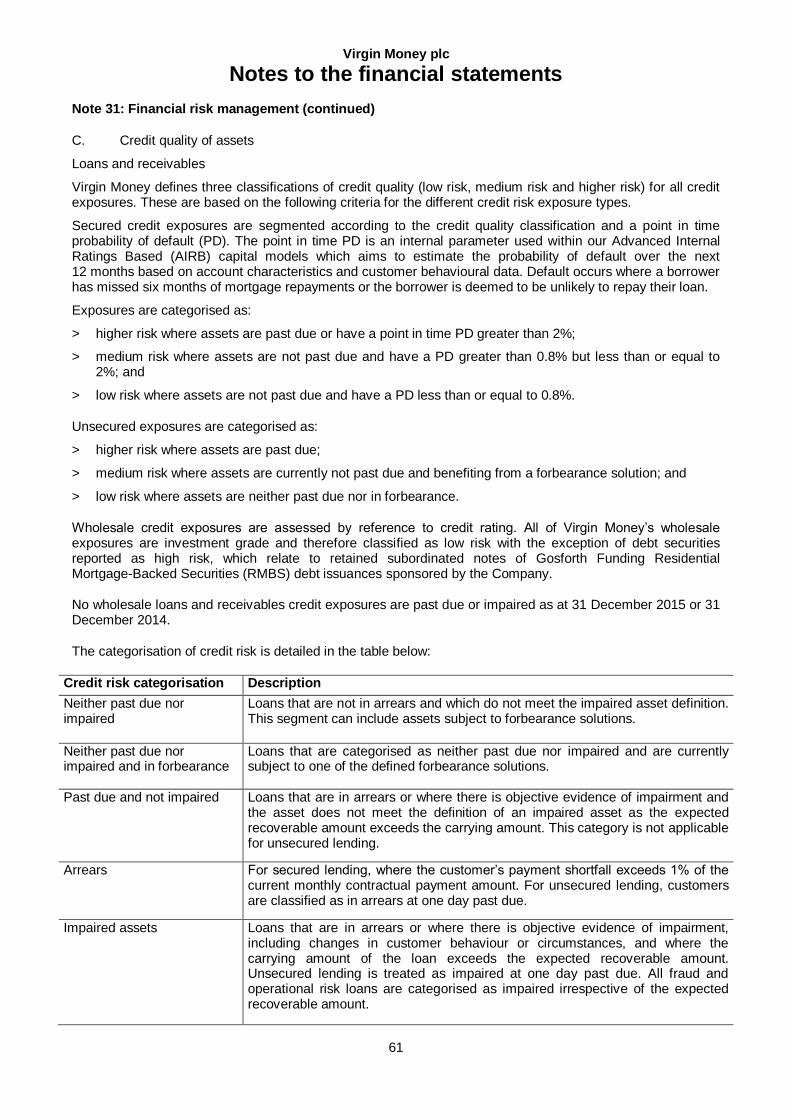
Virgin Money plc
Notes to the financial statements
61
Note 31: Financial risk management (continued)
C. Credit quality of assets
Loans and receivables
Virgin Money defines three classifications of credit quality (low risk, medium risk and higher risk) for all credit exposures. These are based on the following criteria for the different credit risk exposure types.
Secured credit exposures are segmented according to the credit quality classification and a point in time probability of default (PD). The point in time PD is an internal parameter used within our Advanced Internal Ratings Based (AIRB) capital models which aims to estimate the probability of default over the next 12 months based on account characteristics and customer behavioural data. Default occurs where a borrower has missed six months of mortgage repayments or the borrower is deemed to be unlikely to repay their loan.
Exposures are categorised as:
> higher risk where assets are past due or have a point in time PD greater than 2%;
> medium risk where assets are not past due and have a PD greater than 0.8% but less than or equal to 2%; and
> low risk where assets are not past due and have a PD less than or equal to 0.8%.
Unsecured exposures are categorised as:
> higher risk where assets are past due;
> medium risk where assets are currently not past due and benefiting from a forbearance solution; and
> low risk where assets are neither past due nor in forbearance.
Wholesale credit exposures are assessed by reference to credit rating. All of Virgin Money’s wholesale exposures are investment grade and therefore classified as low risk with the exception of debt securities reported as high risk, which relate to retained subordinated notes of Gosforth Funding Residential Mortgage-Backed Securities (RMBS) debt issuances sponsored by the Company.
No wholesale loans and receivables credit exposures are past due or impaired as at 31 December 2015 or 31 December 2014.
The categorisation of credit risk is detailed in the table below:
Credit risk categorisation Description
Neither past due nor impaired
Loans that are not in arrears and which do not meet the impaired asset definition. This segment can include assets subject to forbearance solutions.
Neither past due nor impaired and in forbearance
Loans that are categorised as neither past due nor impaired and are currently subject to one of the defined forbearance solutions.
Past due and not impaired Loans that are in arrears or where there is objective evidence of impairment and the asset does not meet the definition of an impaired asset as the expected recoverable amount exceeds the carrying amount. This category is not applicable for unsecured lending.
Arrears For secured lending, where the customer’s payment shortfall exceeds 1% of the current monthly contractual payment amount. For unsecured lending, customers are classified as in arrears at one day past due.
Impaired assets Loans that are in arrears or where there is objective evidence of impairment, including changes in customer behaviour or circumstances, and where the carrying amount of the loan exceeds the expected recoverable amount. Unsecured lending is treated as impaired at one day past due. All fraud and operational risk loans are categorised as impaired irrespective of the expected recoverable amount.
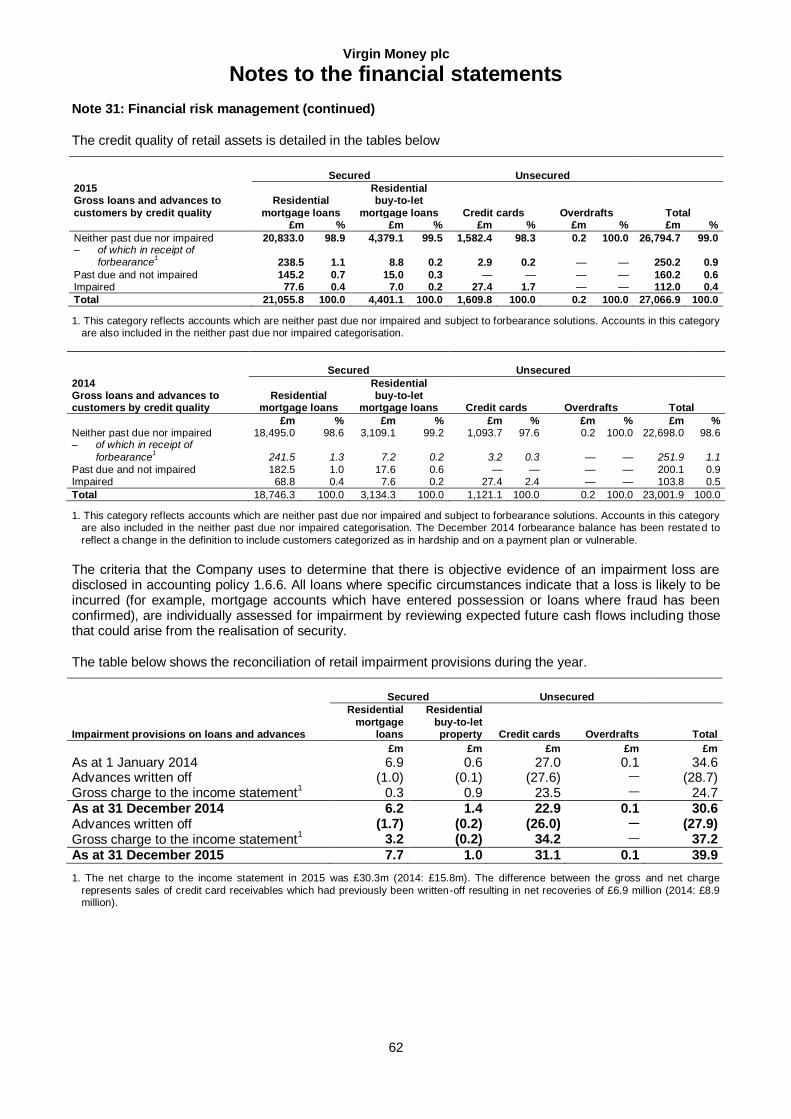
Virgin Money plc
Notes to the financial statements
62
Note 31: Financial risk management (continued)
The credit quality of retail assets is detailed in the tables below
Secured
Unsecured
2015 Gross loans and advances to
customers by credit quality
Residential
mortgage loans
Residential buy-to-let
mortgage loans Credit cards Overdrafts Total £m % £m % £m % £m % £m %
Neither past due nor impaired 20,833.0 98.9 4,379.1 99.5 1,582.4 98.3 0.2 100.0 26,794.7 99.0 – of which in receipt of
forbearance1 238.5 1.1 8.8 0.2 2.9 0.2 — — 250.2 0.9
Past due and not impaired 145.2 0.7 15.0 0.3 — — — — 160.2 0.6 Impaired 77.6 0.4 7.0 0.2 27.4 1.7 — — 112.0 0.4
Total 21,055.8 100.0 4,401.1 100.0 1,609.8 100.0 0.2 100.0 27,066.9 100.0
1. This category reflects accounts which are neither past due nor impaired and subject to forbearance solutions. Accounts in this category are also included in the neither past due nor impaired categorisation.
Secured Unsecured
2014 Gross loans and advances to customers by credit quality
Residential mortgage loans
Residential buy-to-let
mortgage loans Credit cards Overdrafts Total
£m % £m % £m % £m % £m % Neither past due nor impaired 18,495.0 98.6 3,109.1 99.2 1,093.7 97.6 0.2 100.0 22,698.0 98.6 – of which in receipt of
forbearance1 241.5 1.3 7.2 0.2 3.2 0.3 — — 251.9 1.1
Past due and not impaired 182.5 1.0 17.6 0.6 — — — — 200.1 0.9 Impaired 68.8 0.4 7.6 0.2 27.4 2.4 — — 103.8 0.5
Total 18,746.3 100.0 3,134.3 100.0 1,121.1 100.0 0.2 100.0 23,001.9 100.0
1. This category reflects accounts which are neither past due nor impaired and subject to forbearance solutions. Accounts in this category are also included in the neither past due nor impaired categorisation. The December 2014 forbearance balance has been restated to
reflect a change in the definition to include customers categorized as in hardship and on a payment plan or vulnerable.
The criteria that the Company uses to determine that there is objective evidence of an impairment loss are disclosed in accounting policy 1.6.6. All loans where specific circumstances indicate that a loss is likely to be incurred (for example, mortgage accounts which have entered possession or loans where fraud has been confirmed), are individually assessed for impairment by reviewing expected future cash flows including those that could arise from the realisation of security.
The table below shows the reconciliation of retail impairment provisions during the year.
Secured Unsecured
Impairment provisions on loans and advances
Residential
mortgage loans
Residential
buy-to-let property Credit cards Overdrafts Total
£m £m £m £m £m
As at 1 January 2014 6.9 0.6 27.0 0.1 34.6 Advances written off (1.0) (0.1) (27.6) — (28.7) Gross charge to the income statement
1 0.3 0.9 23.5 — 24.7
As at 31 December 2014 6.2 1.4 22.9 0.1 30.6 Advances written off (1.7) (0.2) (26.0) — (27.9) Gross charge to the income statement
1 3.2 (0.2) 34.2 — 37.2
As at 31 December 2015 7.7 1.0 31.1 0.1 39.9
1. The net charge to the income statement in 2015 was £30.3m (2014: £15.8m). The difference between the gross and net charge
represents sales of credit card receivables which had previously been written-off resulting in net recoveries of £6.9 million (2014: £8.9 million).
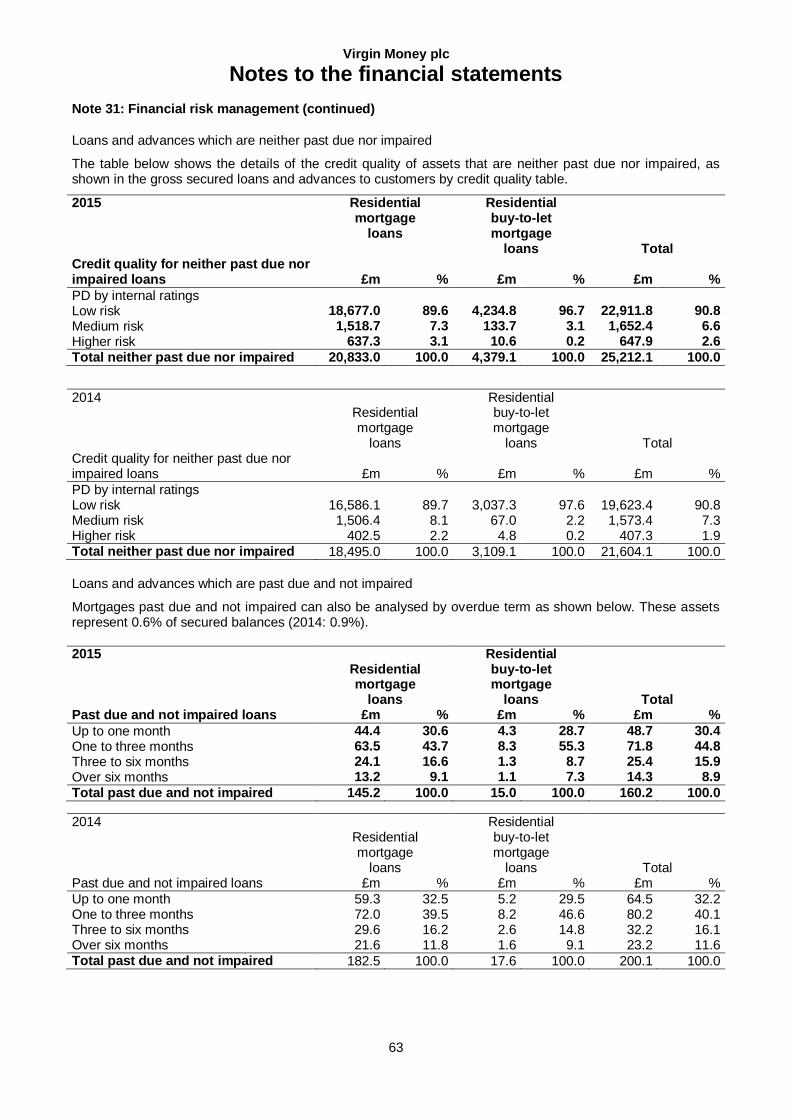
Virgin Money plc
Notes to the financial statements
63
Note 31: Financial risk management (continued)
Loans and advances which are neither past due nor impaired
The table below shows the details of the credit quality of assets that are neither past due nor impaired, as shown in the gross secured loans and advances to customers by credit quality table.
2015
Residential mortgage
loans
Residential buy-to-let mortgage
loans Total Credit quality for neither past due nor impaired loans £m % £m % £m %
PD by internal ratings Low risk 18,677.0 89.6 4,234.8 96.7 22,911.8 90.8 Medium risk 1,518.7 7.3 133.7 3.1 1,652.4 6.6 Higher risk 637.3 3.1 10.6 0.2 647.9 2.6
Total neither past due nor impaired 20,833.0 100.0 4,379.1 100.0 25,212.1 100.0
2014
Residential mortgage
loans
Residential buy-to-let mortgage
loans Total Credit quality for neither past due nor impaired loans £m % £m % £m %
PD by internal ratings Low risk 16,586.1 89.7 3,037.3 97.6 19,623.4 90.8 Medium risk 1,506.4 8.1 67.0 2.2 1,573.4 7.3 Higher risk 402.5 2.2 4.8 0.2 407.3 1.9 Total neither past due nor impaired 18,495.0 100.0 3,109.1 100.0 21,604.1 100.0
Loans and advances which are past due and not impaired
Mortgages past due and not impaired can also be analysed by overdue term as shown below. These assets represent 0.6% of secured balances (2014: 0.9%).
2015
Residential mortgage
loans
Residential buy-to-let mortgage
loans Total Past due and not impaired loans £m % £m % £m %
Up to one month 44.4 30.6 4.3 28.7 48.7 30.4 One to three months 63.5 43.7 8.3 55.3 71.8 44.8 Three to six months 24.1 16.6 1.3 8.7 25.4 15.9 Over six months 13.2 9.1 1.1 7.3 14.3 8.9
Total past due and not impaired 145.2 100.0 15.0 100.0 160.2 100.0
2014
Residential mortgage
loans
Residential buy-to-let mortgage
loans Total Past due and not impaired loans £m % £m % £m %
Up to one month 59.3 32.5 5.2 29.5 64.5 32.2 One to three months 72.0 39.5 8.2 46.6 80.2 40.1 Three to six months 29.6 16.2 2.6 14.8 32.2 16.1 Over six months 21.6 11.8 1.6 9.1 23.2 11.6 Total past due and not impaired 182.5 100.0 17.6 100.0 200.1 100.0
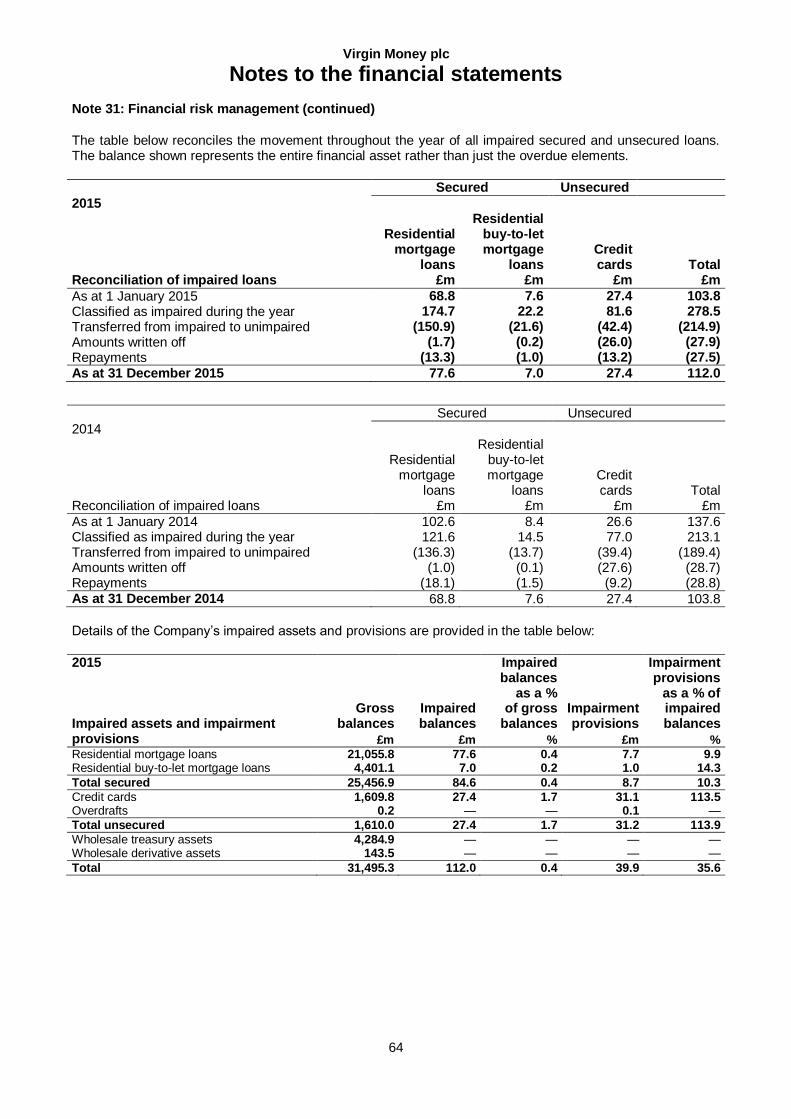
Virgin Money plc
Notes to the financial statements
64
Note 31: Financial risk management (continued)
The table below reconciles the movement throughout the year of all impaired secured and unsecured loans. The balance shown represents the entire financial asset rather than just the overdue elements.
Secured Unsecured
2015
Residential mortgage
loans
Residential buy-to-let mortgage
loans Credit cards Total
Reconciliation of impaired loans £m £m £m £m
As at 1 January 2015 68.8 7.6 27.4 103.8 Classified as impaired during the year 174.7 22.2 81.6 278.5 Transferred from impaired to unimpaired (150.9) (21.6) (42.4) (214.9) Amounts written off (1.7) (0.2) (26.0) (27.9) Repayments (13.3) (1.0) (13.2) (27.5)
As at 31 December 2015 77.6 7.0 27.4 112.0
Secured Unsecured
2014
Residential mortgage
loans
Residential buy-to-let mortgage
loans Credit cards Total
Reconciliation of impaired loans £m £m £m £m
As at 1 January 2014 102.6 8.4 26.6 137.6 Classified as impaired during the year 121.6 14.5 77.0 213.1 Transferred from impaired to unimpaired (136.3) (13.7) (39.4) (189.4) Amounts written off (1.0) (0.1) (27.6) (28.7) Repayments (18.1) (1.5) (9.2) (28.8) As at 31 December 2014 68.8 7.6 27.4 103.8
Details of the Company’s impaired assets and provisions are provided in the table below:
2015 Impaired assets and impairment
Gross balances
Impaired balances
Impaired balances
as a % of gross
balances Impairment provisions
Impairment provisions
as a % of impaired balances
provisions £m £m % £m %
Residential mortgage loans 21,055.8 77.6 0.4 7.7 9.9 Residential buy-to-let mortgage loans 4,401.1 7.0 0.2 1.0 14.3
Total secured 25,456.9 84.6 0.4 8.7 10.3
Credit cards 1,609.8 27.4 1.7 31.1 113.5 Overdrafts 0.2 — — 0.1 —
Total unsecured 1,610.0 27.4 1.7 31.2 113.9
Wholesale treasury assets 4,284.9 — — — — Wholesale derivative assets 143.5 — — — —
Total 31,495.3 112.0 0.4 39.9 35.6
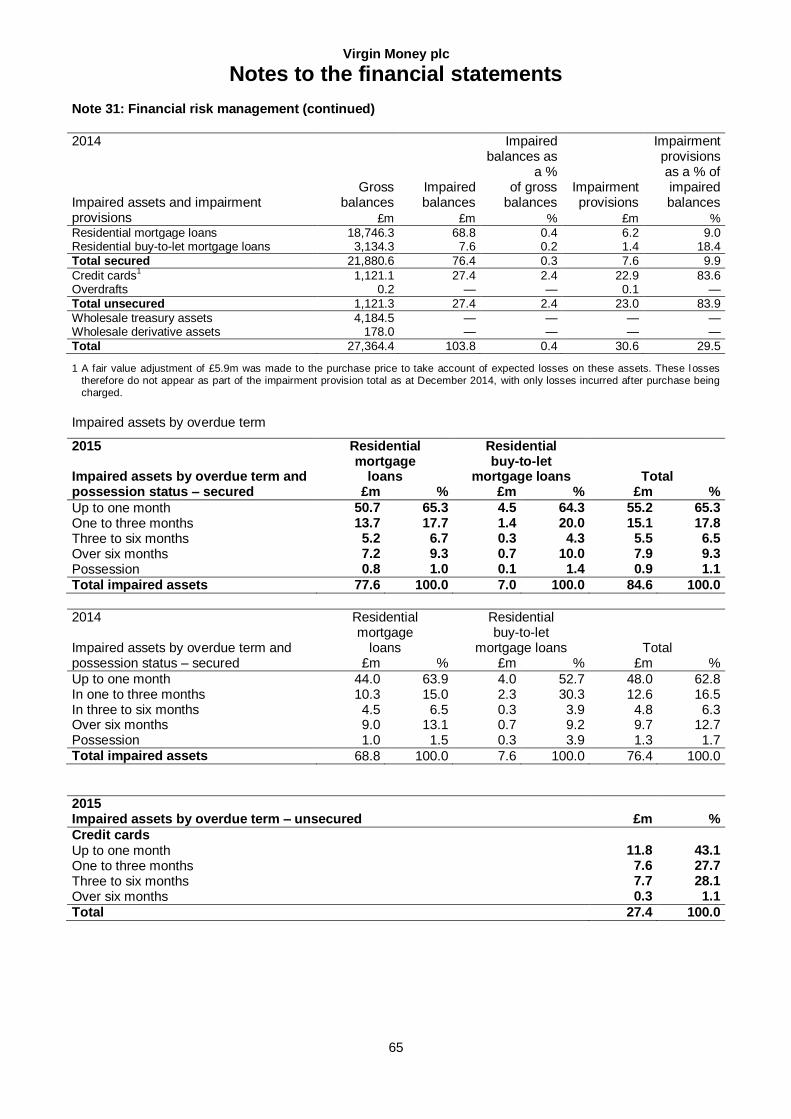
Virgin Money plc
Notes to the financial statements
65
Note 31: Financial risk management (continued)
2014 Impaired assets and impairment
Gross balances
Impaired balances
Impaired balances as
a % of gross
balances Impairment provisions
Impairment provisions as a % of impaired balances
provisions £m £m % £m %
Residential mortgage loans 18,746.3 68.8 0.4 6.2 9.0 Residential buy-to-let mortgage loans 3,134.3 7.6 0.2 1.4 18.4
Total secured 21,880.6 76.4 0.3 7.6 9.9
Credit cards1 1,121.1 27.4 2.4 22.9 83.6
Overdrafts 0.2 — — 0.1 —
Total unsecured 1,121.3 27.4 2.4 23.0 83.9
Wholesale treasury assets 4,184.5 — — — — Wholesale derivative assets 178.0 — — — — Total 27,364.4 103.8 0.4 30.6 29.5
1 A fair value adjustment of £5.9m was made to the purchase price to take account of expected losses on these assets. These losses therefore do not appear as part of the impairment provision total as at December 2014, with only losses incurred after purchase being charged.
Impaired assets by overdue term
2015 Impaired assets by overdue term and
Residential mortgage
loans
Residential buy-to-let
mortgage loans Total possession status – secured £m % £m % £m %
Up to one month 50.7 65.3 4.5 64.3 55.2 65.3 One to three months 13.7 17.7 1.4 20.0 15.1 17.8 Three to six months 5.2 6.7 0.3 4.3 5.5 6.5 Over six months 7.2 9.3 0.7 10.0 7.9 9.3 Possession 0.8 1.0 0.1 1.4 0.9 1.1
Total impaired assets 77.6 100.0 7.0 100.0 84.6 100.0
2014 Impaired assets by overdue term and
Residential mortgage
loans
Residential buy-to-let
mortgage loans Total possession status – secured £m % £m % £m %
Up to one month 44.0 63.9 4.0 52.7 48.0 62.8 In one to three months 10.3 15.0 2.3 30.3 12.6 16.5 In three to six months 4.5 6.5 0.3 3.9 4.8 6.3 Over six months 9.0 13.1 0.7 9.2 9.7 12.7 Possession 1.0 1.5 0.3 3.9 1.3 1.7 Total impaired assets 68.8 100.0 7.6 100.0 76.4 100.0
2015 Impaired assets by overdue term – unsecured £m %
Credit cards Up to one month 11.8 43.1 One to three months 7.6 27.7 Three to six months 7.7 28.1 Over six months 0.3 1.1
Total 27.4 100.0
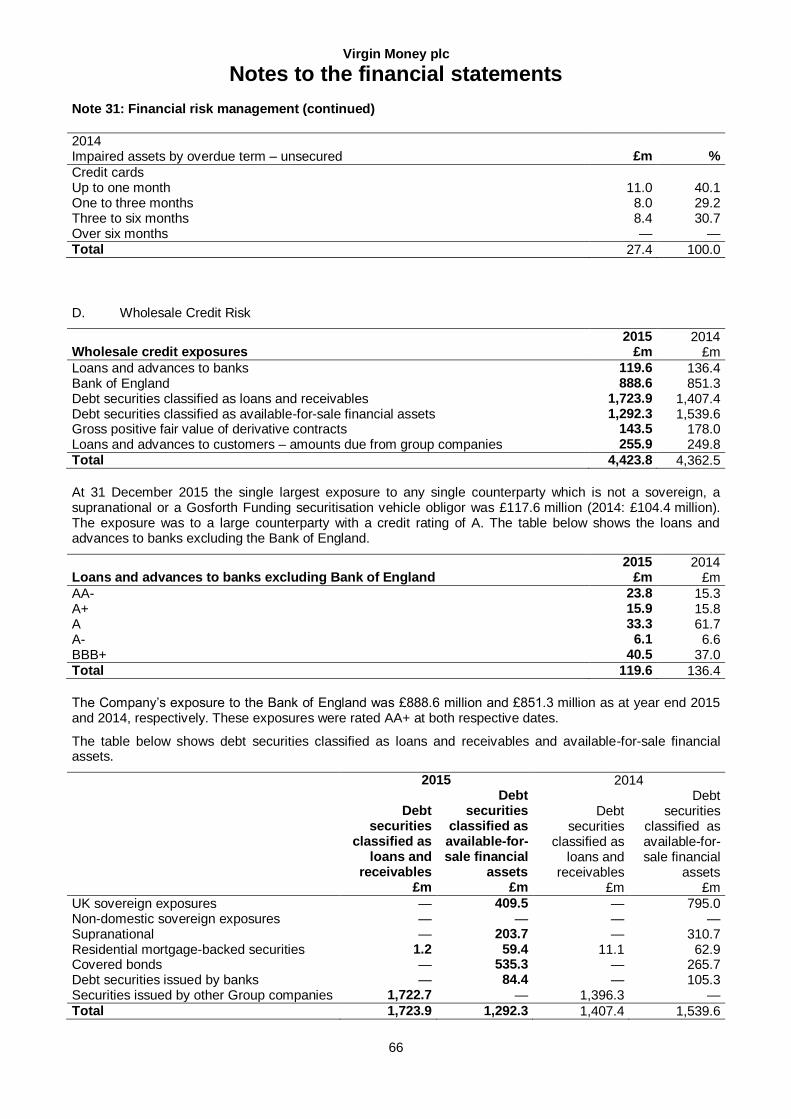
Virgin Money plc
Notes to the financial statements
66
Note 31: Financial risk management (continued)
2014 Impaired assets by overdue term – unsecured £m %
Credit cards Up to one month 11.0 40.1 One to three months 8.0 29.2 Three to six months 8.4 30.7 Over six months — — Total 27.4 100.0
D. Wholesale Credit Risk
Wholesale credit exposures 2015
£m 2014
£m
Loans and advances to banks 119.6 136.4 Bank of England 888.6 851.3 Debt securities classified as loans and receivables 1,723.9 1,407.4 Debt securities classified as available-for-sale financial assets 1,292.3 1,539.6 Gross positive fair value of derivative contracts 143.5 178.0 Loans and advances to customers – amounts due from group companies 255.9 249.8 Total 4,423.8 4,362.5
At 31 December 2015 the single largest exposure to any single counterparty which is not a sovereign, a supranational or a Gosforth Funding securitisation vehicle obligor was £117.6 million (2014: £104.4 million). The exposure was to a large counterparty with a credit rating of A. The table below shows the loans and advances to banks excluding the Bank of England.
Loans and advances to banks excluding Bank of England 2015
£m 2014
£m
AA- 23.8 15.3 A+ 15.9 15.8 A 33.3 61.7 A- 6.1 6.6 BBB+ 40.5 37.0 Total 119.6 136.4
The Company’s exposure to the Bank of England was £888.6 million and £851.3 million as at year end 2015 and 2014, respectively. These exposures were rated AA+ at both respective dates.
The table below shows debt securities classified as loans and receivables and available-for-sale financial assets.
2015 2014
Debt securities
classified as loans and
receivables
Debt securities
classified as available-for- sale financial
assets
Debt securities
classified as loans and
receivables
Debt securities
classified as available-for- sale financial
assets £m £m £m £m
UK sovereign exposures — 409.5 — 795.0 Non-domestic sovereign exposures — — — — Supranational — 203.7 — 310.7 Residential mortgage-backed securities 1.2 59.4 11.1 62.9 Covered bonds — 535.3 — 265.7 Debt securities issued by banks — 84.4 — 105.3 Securities issued by other Group companies 1,722.7 — 1,396.3 — Total 1,723.9 1,292.3 1,407.4 1,539.6
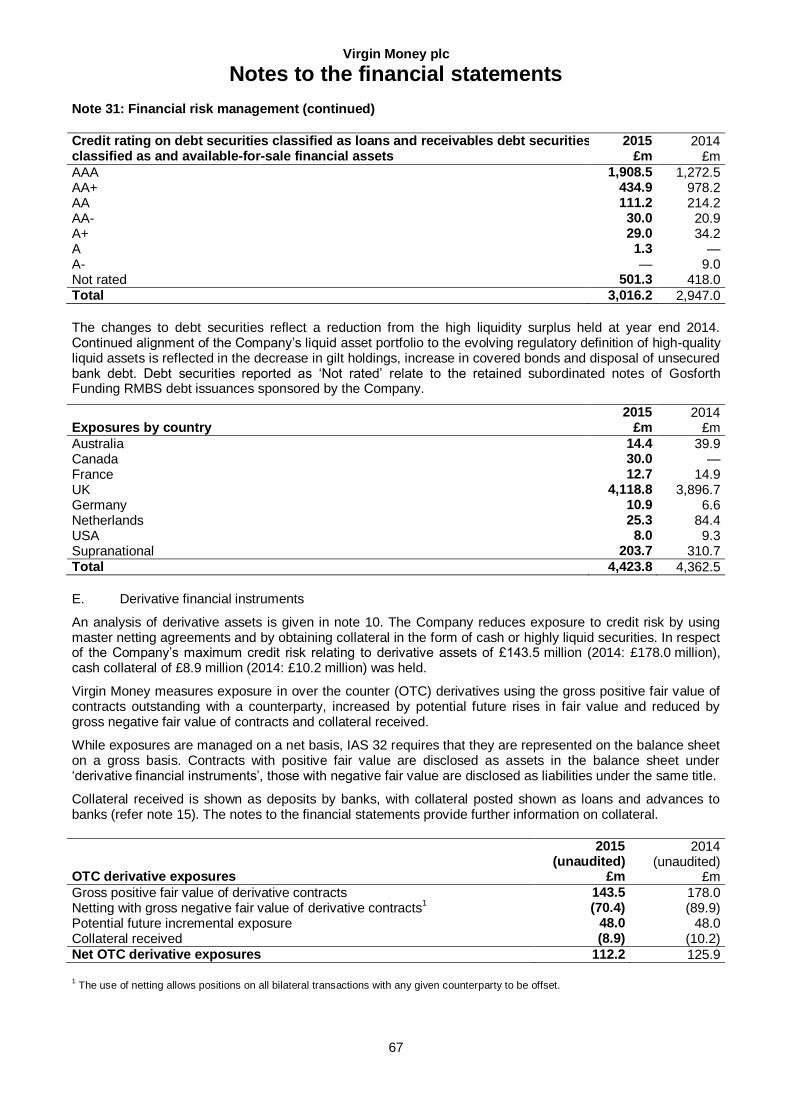
Virgin Money plc
Notes to the financial statements
67
Note 31: Financial risk management (continued)
Credit rating on debt securities classified as loans and receivables debt securities 2015 2014 classified as and available-for-sale financial assets £m £m
AAA 1,908.5 1,272.5 AA+ 434.9 978.2 AA 111.2 214.2 AA- 30.0 20.9 A+ 29.0 34.2 A 1.3 — A- — 9.0 Not rated 501.3 418.0 Total 3,016.2 2,947.0
The changes to debt securities reflect a reduction from the high liquidity surplus held at year end 2014. Continued alignment of the Company’s liquid asset portfolio to the evolving regulatory definition of high-quality liquid assets is reflected in the decrease in gilt holdings, increase in covered bonds and disposal of unsecured bank debt. Debt securities reported as ‘Not rated’ relate to the retained subordinated notes of Gosforth Funding RMBS debt issuances sponsored by the Company.
2015 2014 Exposures by country £m £m
Australia 14.4 39.9 Canada 30.0 — France 12.7 14.9 UK 4,118.8 3,896.7 Germany 10.9 6.6 Netherlands 25.3 84.4 USA 8.0 9.3 Supranational 203.7 310.7 Total 4,423.8 4,362.5
E. Derivative financial instruments
An analysis of derivative assets is given in note 10. The Company reduces exposure to credit risk by using master netting agreements and by obtaining collateral in the form of cash or highly liquid securities. In respect of the Company’s maximum credit risk relating to derivative assets of £143.5 million (2014: £178.0 million), cash collateral of £8.9 million (2014: £10.2 million) was held.
Virgin Money measures exposure in over the counter (OTC) derivatives using the gross positive fair value of contracts outstanding with a counterparty, increased by potential future rises in fair value and reduced by gross negative fair value of contracts and collateral received.
While exposures are managed on a net basis, IAS 32 requires that they are represented on the balance sheet on a gross basis. Contracts with positive fair value are disclosed as assets in the balance sheet under ‘derivative financial instruments’, those with negative fair value are disclosed as liabilities under the same title.
Collateral received is shown as deposits by banks, with collateral posted shown as loans and advances to banks (refer note 15). The notes to the financial statements provide further information on collateral.
2015 (unaudited)
2014 (unaudited)
OTC derivative exposures £m £m
Gross positive fair value of derivative contracts 143.5 178.0 Netting with gross negative fair value of derivative contracts
1 (70.4) (89.9)
Potential future incremental exposure 48.0 48.0 Collateral received (8.9) (10.2) Net OTC derivative exposures 112.2 125.9
1 The use of netting allows positions on all bilateral transactions with any given counterparty to be offset.
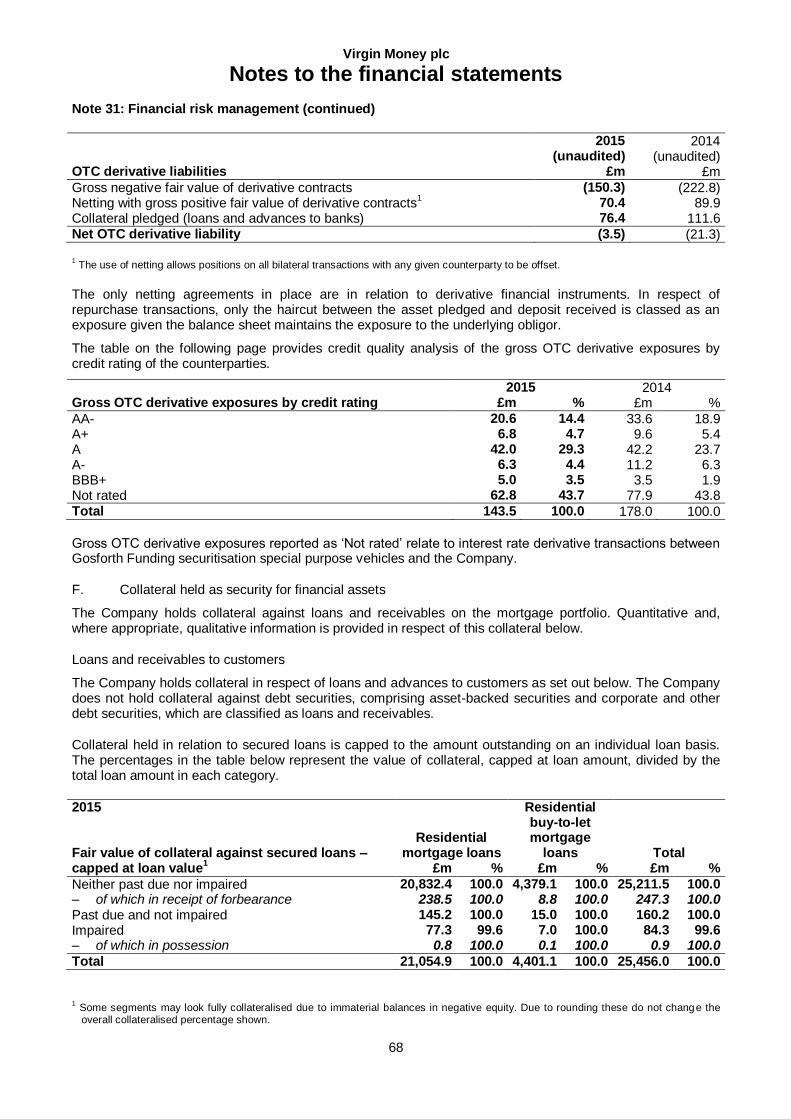
Virgin Money plc
Notes to the financial statements
68
Note 31: Financial risk management (continued)
2015 (unaudited)
2014 (unaudited)
OTC derivative liabilities £m £m
Gross negative fair value of derivative contracts (150.3) (222.8) Netting with gross positive fair value of derivative contracts
1 70.4 89.9
Collateral pledged (loans and advances to banks) 76.4 111.6 Net OTC derivative liability (3.5) (21.3)
1 The use of netting allows positions on all bilateral transactions with any given counterparty to be offset.
The only netting agreements in place are in relation to derivative financial instruments. In respect of repurchase transactions, only the haircut between the asset pledged and deposit received is classed as an exposure given the balance sheet maintains the exposure to the underlying obligor.
The table on the following page provides credit quality analysis of the gross OTC derivative exposures by credit rating of the counterparties.
2015 2014 Gross OTC derivative exposures by credit rating £m % £m %
AA- 20.6 14.4 33.6 18.9 A+ 6.8 4.7 9.6 5.4 A 42.0 29.3 42.2 23.7 A- 6.3 4.4 11.2 6.3 BBB+ 5.0 3.5 3.5 1.9 Not rated 62.8 43.7 77.9 43.8 Total 143.5 100.0 178.0 100.0
Gross OTC derivative exposures reported as ‘Not rated’ relate to interest rate derivative transactions between Gosforth Funding securitisation special purpose vehicles and the Company.
F. Collateral held as security for financial assets
The Company holds collateral against loans and receivables on the mortgage portfolio. Quantitative and, where appropriate, qualitative information is provided in respect of this collateral below.
Loans and receivables to customers
The Company holds collateral in respect of loans and advances to customers as set out below. The Company does not hold collateral against debt securities, comprising asset-backed securities and corporate and other debt securities, which are classified as loans and receivables.
Collateral held in relation to secured loans is capped to the amount outstanding on an individual loan basis. The percentages in the table below represent the value of collateral, capped at loan amount, divided by the total loan amount in each category.
2015 Fair value of collateral against secured loans –
Residential mortgage loans
Residential buy-to-let mortgage
loans Total capped at loan value
1 £m % £m % £m %
Neither past due nor impaired 20,832.4 100.0 4,379.1 100.0 25,211.5 100.0 – of which in receipt of forbearance 238.5 100.0 8.8 100.0 247.3 100.0 Past due and not impaired 145.2 100.0 15.0 100.0 160.2 100.0 Impaired 77.3 99.6 7.0 100.0 84.3 99.6 – of which in possession 0.8 100.0 0.1 100.0 0.9 100.0
Total 21,054.9 100.0 4,401.1 100.0 25,456.0 100.0
1 Some segments may look fully collateralised due to immaterial balances in negative equity. Due to rounding these do not change the overall collateralised percentage shown.
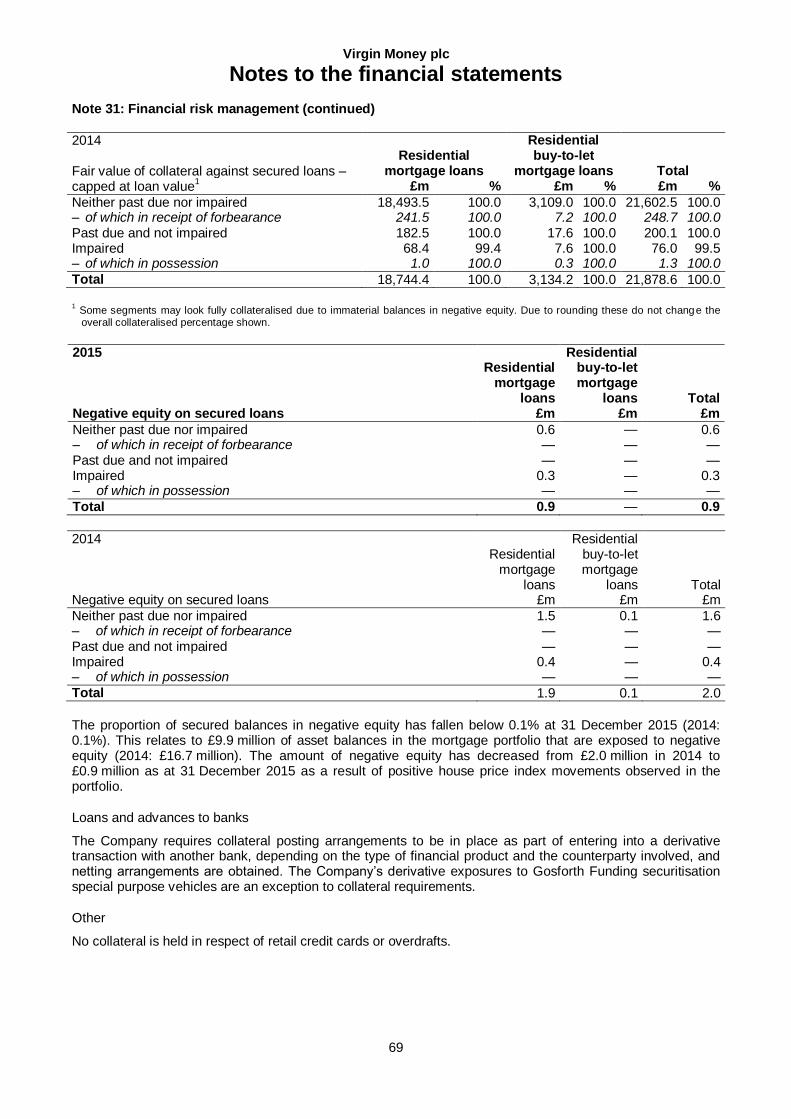
Virgin Money plc
Notes to the financial statements
69
Note 31: Financial risk management (continued)
2014 Fair value of collateral against secured loans –
Residential mortgage loans
Residential buy-to-let
mortgage loans Total capped at loan value
1 £m % £m % £m %
Neither past due nor impaired 18,493.5 100.0 3,109.0 100.0 21,602.5 100.0 – of which in receipt of forbearance 241.5 100.0 7.2 100.0 248.7 100.0 Past due and not impaired 182.5 100.0 17.6 100.0 200.1 100.0 Impaired 68.4 99.4 7.6 100.0 76.0 99.5 – of which in possession 1.0 100.0 0.3 100.0 1.3 100.0
Total 18,744.4 100.0 3,134.2 100.0 21,878.6 100.0
1 Some segments may look fully collateralised due to immaterial balances in negative equity. Due to rounding these do not change the overall collateralised percentage shown.
2015 Residential
mortgage loans
Residential buy-to-let mortgage
loans Total Negative equity on secured loans £m £m £m
Neither past due nor impaired 0.6 — 0.6 – of which in receipt of forbearance — — — Past due and not impaired — — — Impaired 0.3 — 0.3 – of which in possession — — —
Total 0.9 — 0.9
2014 Residential
mortgage loans
Residential buy-to-let mortgage
loans Total Negative equity on secured loans £m £m £m
Neither past due nor impaired 1.5 0.1 1.6 – of which in receipt of forbearance — — — Past due and not impaired — — — Impaired 0.4 — 0.4 – of which in possession — — —
Total 1.9 0.1 2.0
The proportion of secured balances in negative equity has fallen below 0.1% at 31 December 2015 (2014: 0.1%). This relates to £9.9 million of asset balances in the mortgage portfolio that are exposed to negative equity (2014: £16.7 million). The amount of negative equity has decreased from £2.0 million in 2014 to £0.9 million as at 31 December 2015 as a result of positive house price index movements observed in the portfolio.
Loans and advances to banks
The Company requires collateral posting arrangements to be in place as part of entering into a derivative transaction with another bank, depending on the type of financial product and the counterparty involved, and netting arrangements are obtained. The Company’s derivative exposures to Gosforth Funding securitisation special purpose vehicles are an exception to collateral requirements.
Other
No collateral is held in respect of retail credit cards or overdrafts.
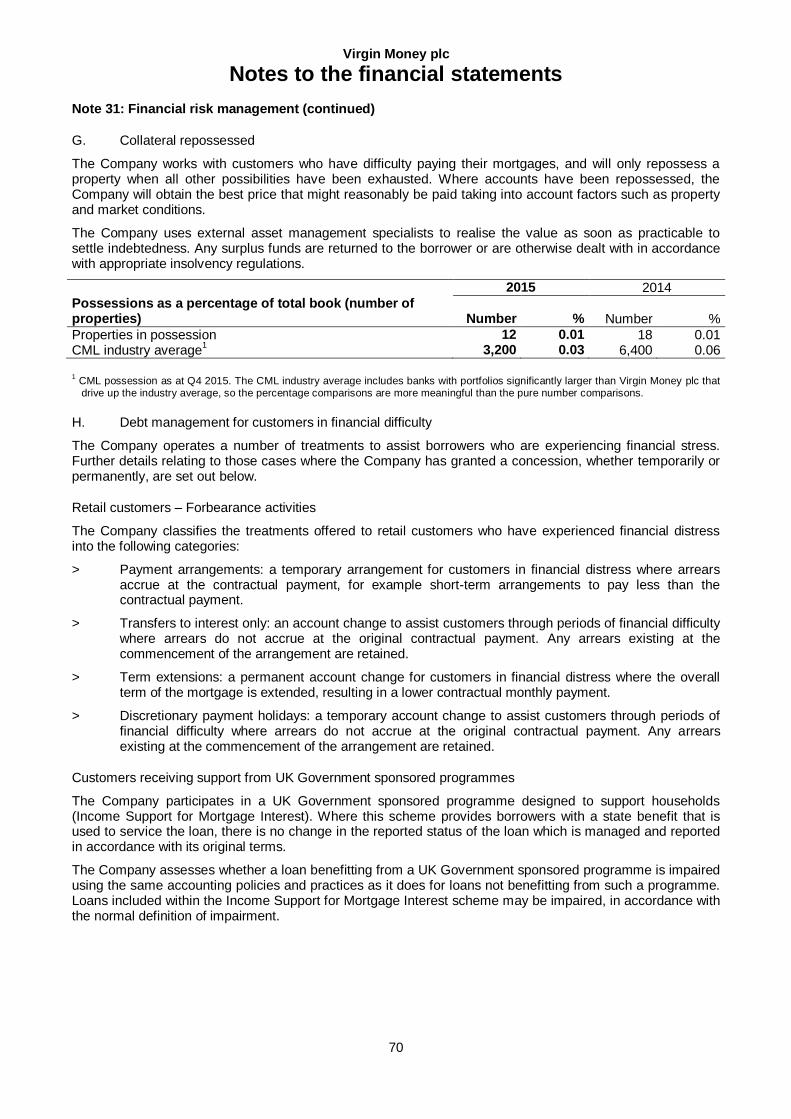
Virgin Money plc
Notes to the financial statements
70
Note 31: Financial risk management (continued)
G. Collateral repossessed
The Company works with customers who have difficulty paying their mortgages, and will only repossess a property when all other possibilities have been exhausted. Where accounts have been repossessed, the Company will obtain the best price that might reasonably be paid taking into account factors such as property and market conditions.
The Company uses external asset management specialists to realise the value as soon as practicable to settle indebtedness. Any surplus funds are returned to the borrower or are otherwise dealt with in accordance with appropriate insolvency regulations.
2015 2014 Possessions as a percentage of total book (number of properties) Number % Number %
Properties in possession 12 0.01 18 0.01 CML industry average
1 3,200 0.03 6,400 0.06
1 CML possession as at Q4 2015. The CML industry average includes banks with portfolios significantly larger than Virgin Money plc that drive up the industry average, so the percentage comparisons are more meaningful than the pure number comparisons.
H. Debt management for customers in financial difficulty
The Company operates a number of treatments to assist borrowers who are experiencing financial stress. Further details relating to those cases where the Company has granted a concession, whether temporarily or permanently, are set out below.
Retail customers – Forbearance activities
The Company classifies the treatments offered to retail customers who have experienced financial distress into the following categories:
> Payment arrangements: a temporary arrangement for customers in financial distress where arrears accrue at the contractual payment, for example short-term arrangements to pay less than the contractual payment.
> Transfers to interest only: an account change to assist customers through periods of financial difficulty where arrears do not accrue at the original contractual payment. Any arrears existing at the commencement of the arrangement are retained.
> Term extensions: a permanent account change for customers in financial distress where the overall term of the mortgage is extended, resulting in a lower contractual monthly payment.
> Discretionary payment holidays: a temporary account change to assist customers through periods of financial difficulty where arrears do not accrue at the original contractual payment. Any arrears existing at the commencement of the arrangement are retained.
Customers receiving support from UK Government sponsored programmes
The Company participates in a UK Government sponsored programme designed to support households (Income Support for Mortgage Interest). Where this scheme provides borrowers with a state benefit that is used to service the loan, there is no change in the reported status of the loan which is managed and reported in accordance with its original terms.
The Company assesses whether a loan benefitting from a UK Government sponsored programme is impaired using the same accounting policies and practices as it does for loans not benefitting from such a programme. Loans included within the Income Support for Mortgage Interest scheme may be impaired, in accordance with the normal definition of impairment.
Virgin Money plc
Notes to the financial statements
71
Note 31: Financial risk management (continued)
Customers in financial difficulty receiving support under other schemes
The Company measures the success of forbearance schemes for secured loans. This is based upon the proportion of customers who remain neither past due nor impaired or repay their loan fully over the 12 months following the exit from a forbearance treatment. For temporary treatments, 100% of customers accepting reduced payment arrangements have remained within contractual terms following the end of their treatment, and are either fully up to date or had redeemed their loan as at 31 December 2015. For permanent treatments, 94% of customers who have accepted interest only concessions, 96% of customers who have had a discretionary payment holiday and 95% of customers who have accepted term extensions, remained within contractual terms following the end of their treatment as at 31 December 2015.
Forbearance identification and classification
The Company classifies a retail account as forborne at the time a customer in financial difficulty is granted a concession. Accounts are classified as forborne only for the period of time which the exposure is known to be, or may still be, in financial difficulty. Where temporary forbearance is granted, exit criteria are applied to include accounts until they are known to no longer be in financial difficulty. Where the treatment involves a permanent change to the contractual basis of the customer’s account such as conversion to interest only or term extension, the Company classifies the balance as forborne for a period of 12 months, after which no distinction is made between these accounts and others where no change has been made.
Secured retail lending
At 31 December 2015, retail secured loans and advances currently or recently subject to forbearance were £259.4 million (2014: £267.3 million) of total retail secured loans and advances.
Collective impairment assessment of retail secured loans subject to forbearance
Loans which are forborne are grouped with other assets with similar risk characteristics and assessed collectively for impairment as described below. The loans are not considered as impaired loans unless they meet the Company’s definition of an impaired asset.
The Company’s approach is to ensure that provisioning models, supported by management judgement, appropriately reflect the incurred loss risk of exposures. The Company uses sophisticated behavioural scoring to assess customers’ credit risk. The underlying behavioural scorecards consider many different characteristics of customer behaviour, both static and dynamic, from internal sources and also from credit bureau data, including characteristics that may identify when a customer has been in arrears on products held with other firms. Hence, these models take a range of potential indicators of customer financial distress into account.
The performance of provision models is monitored and challenged on an ongoing basis, in line with the Retail Credit Provisioning Policy. The models are also regularly recalibrated to reflect up to date customer behaviour and market conditions. Specifically, regular detailed analysis of modelled provision outputs is undertaken to demonstrate that the risk of forbearance or other similar activities is recognised, that the outcome period adequately captures the risk and that the underlying risk is appropriately reflected. Where this is not the case, additional provisions are applied to capture the risk.
Unsecured retail lending
At 31 December 2015, total retail unsecured loans and advances benefitting from forbearance totalled £10.7 million (2014: £12.9 million).
Collective impairment assessment of retail unsecured loans and advances subject to forbearance
Credit risk provisioning for the retail unsecured portfolio is undertaken on a collective basis, except for fraud cases which are fully provided for. The approach used is based on roll rates for various behavioural and arrears status segments, measuring the likelihood of default and the probability of charge- off given default.
Following the migration of the credit card portfolio, the Company widened its definition of forbearance. The migration of the credit card portfolio to the Company’s infrastructure has resulted in improved management information to better identify individual customer circumstances.
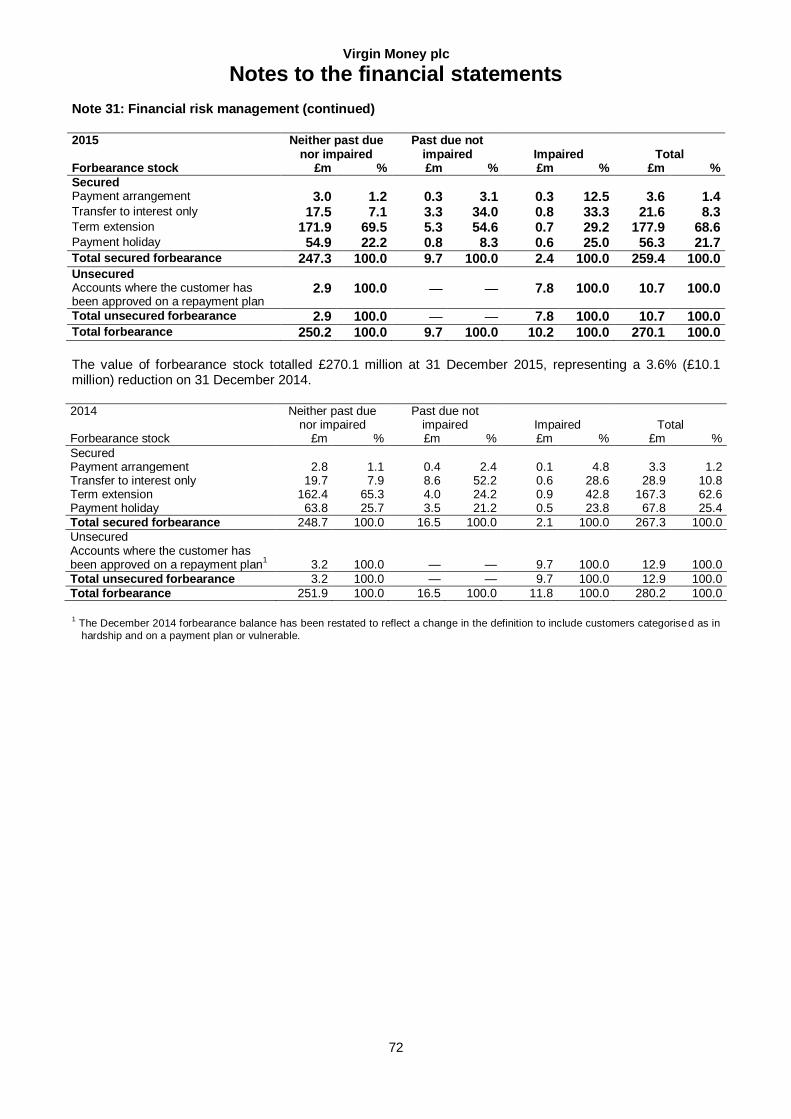
Virgin Money plc
Notes to the financial statements
72
Note 31: Financial risk management (continued)
2015
Neither past due nor impaired
Past due not impaired Impaired Total
Forbearance stock £m % £m % £m % £m %
Secured Payment arrangement 3.0 1.2 0.3 3.1 0.3 12.5 3.6 1.4 Transfer to interest only 17.5 7.1 3.3 34.0 0.8 33.3 21.6 8.3 Term extension 171.9 69.5 5.3 54.6 0.7 29.2 177.9 68.6 Payment holiday 54.9 22.2 0.8 8.3 0.6 25.0 56.3 21.7 Total secured forbearance 247.3 100.0 9.7 100.0 2.4 100.0 259.4 100.0 Unsecured Accounts where the customer has been approved on a repayment plan
2.9 100.0 — — 7.8 100.0 10.7 100.0
Total unsecured forbearance 2.9 100.0 — — 7.8 100.0 10.7 100.0 Total forbearance 250.2 100.0 9.7 100.0 10.2 100.0 270.1 100.0
The value of forbearance stock totalled £270.1 million at 31 December 2015, representing a 3.6% (£10.1 million) reduction on 31 December 2014.
2014
Neither past due nor impaired
Past due not impaired Impaired Total
Forbearance stock £m % £m % £m % £m %
Secured Payment arrangement 2.8 1.1 0.4 2.4 0.1 4.8 3.3 1.2 Transfer to interest only 19.7 7.9 8.6 52.2 0.6 28.6 28.9 10.8 Term extension 162.4 65.3 4.0 24.2 0.9 42.8 167.3 62.6 Payment holiday 63.8 25.7 3.5 21.2 0.5 23.8 67.8 25.4
Total secured forbearance 248.7 100.0 16.5 100.0 2.1 100.0 267.3 100.0
Unsecured Accounts where the customer has been approved on a repayment plan
1 3.2 100.0 — — 9.7 100.0 12.9 100.0
Total unsecured forbearance 3.2 100.0 — — 9.7 100.0 12.9 100.0
Total forbearance 251.9 100.0 16.5 100.0 11.8 100.0 280.2 100.0
1 The December 2014 forbearance balance has been restated to reflect a change in the definition to include customers categorised as in
hardship and on a payment plan or vulnerable.
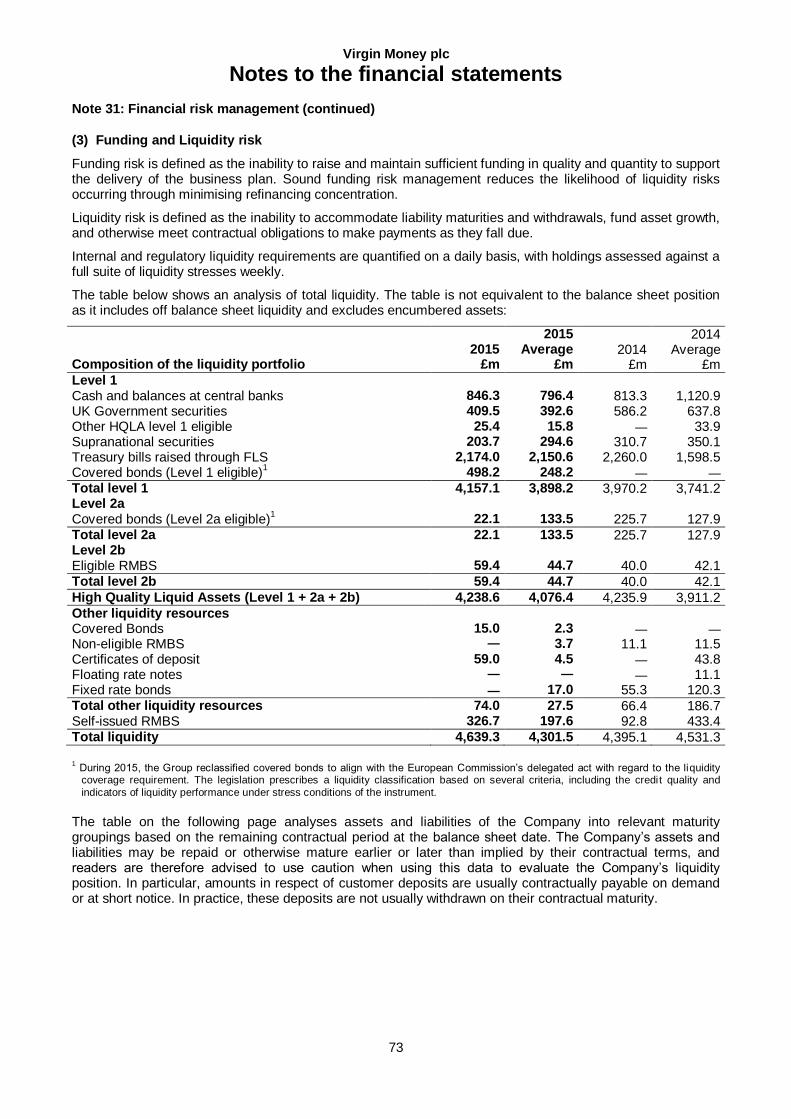
Virgin Money plc
Notes to the financial statements
73
Note 31: Financial risk management (continued)
(3) Funding and Liquidity risk
Funding risk is defined as the inability to raise and maintain sufficient funding in quality and quantity to support the delivery of the business plan. Sound funding risk management reduces the likelihood of liquidity risks occurring through minimising refinancing concentration.
Liquidity risk is defined as the inability to accommodate liability maturities and withdrawals, fund asset growth, and otherwise meet contractual obligations to make payments as they fall due.
Internal and regulatory liquidity requirements are quantified on a daily basis, with holdings assessed against a full suite of liquidity stresses weekly.
The table below shows an analysis of total liquidity. The table is not equivalent to the balance sheet position as it includes off balance sheet liquidity and excludes encumbered assets:
Composition of the liquidity portfolio 2015
£m
2015 Average
£m 2014
£m
2014 Average
£m Level 1 Cash and balances at central banks 846.3 796.4 813.3 1,120.9 UK Government securities 409.5 392.6 586.2 637.8 Other HQLA level 1 eligible 25.4 15.8 — 33.9 Supranational securities 203.7 294.6 310.7 350.1 Treasury bills raised through FLS 2,174.0 2,150.6 2,260.0 1,598.5 Covered bonds (Level 1 eligible)
1 498.2 248.2 — —
Total level 1 4,157.1 3,898.2 3,970.2 3,741.2 Level 2a Covered bonds (Level 2a eligible)
1 22.1 133.5 225.7 127.9
Total level 2a 22.1 133.5 225.7 127.9 Level 2b Eligible RMBS 59.4 44.7 40.0 42.1 Total level 2b 59.4 44.7 40.0 42.1 High Quality Liquid Assets (Level 1 + 2a + 2b) 4,238.6 4,076.4 4,235.9 3,911.2 Other liquidity resources Covered Bonds 15.0 2.3 — — Non-eligible RMBS — 3.7 11.1 11.5 Certificates of deposit 59.0 4.5 — 43.8 Floating rate notes — — — 11.1 Fixed rate bonds — 17.0 55.3 120.3 Total other liquidity resources 74.0 27.5 66.4 186.7 Self-issued RMBS 326.7 197.6 92.8 433.4 Total liquidity 4,639.3 4,301.5 4,395.1 4,531.3
1 During 2015, the Group reclassified covered bonds to align with the European Commission’s delegated act with regard to the liquidity coverage requirement. The legislation prescribes a liquidity classification based on several criteria, including the credit quality and
indicators of liquidity performance under stress conditions of the instrument.
The table on the following page analyses assets and liabilities of the Company into relevant maturity groupings based on the remaining contractual period at the balance sheet date. The Company’s assets and liabilities may be repaid or otherwise mature earlier or later than implied by their contractual terms, and readers are therefore advised to use caution when using this data to evaluate the Company’s liquidity position. In particular, amounts in respect of customer deposits are usually contractually payable on demand or at short notice. In practice, these deposits are not usually withdrawn on their contractual maturity.
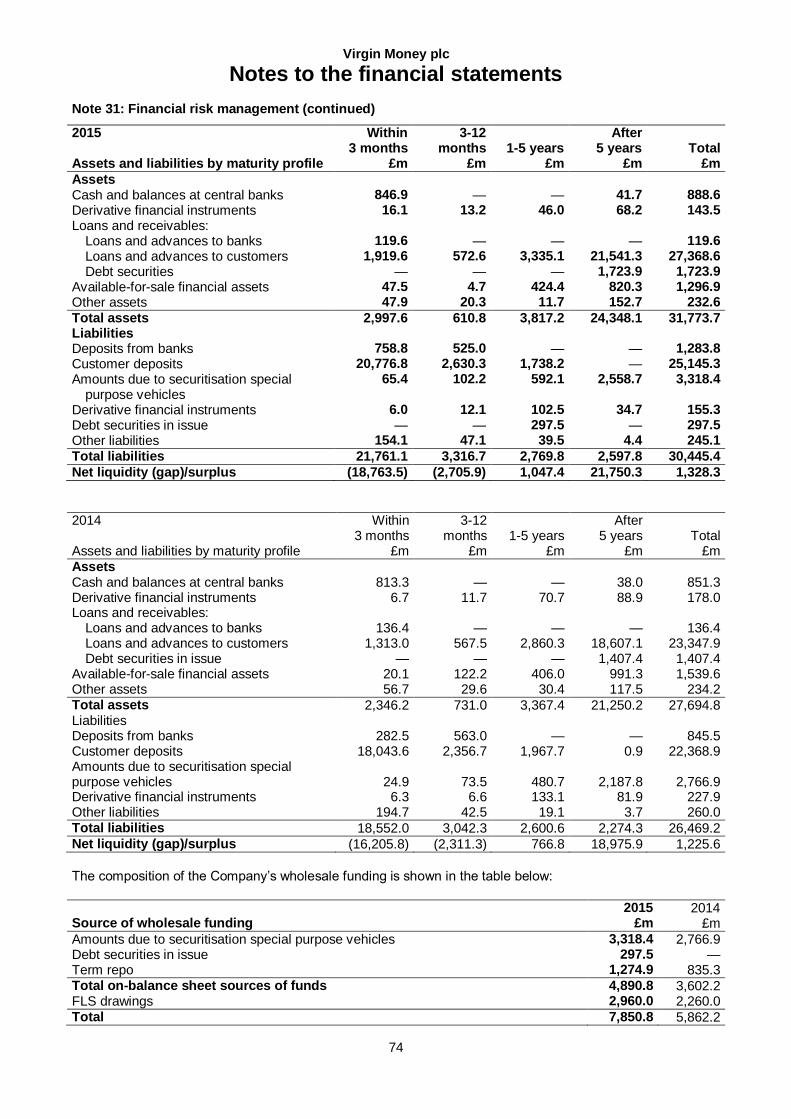
Virgin Money plc
Notes to the financial statements
74
Note 31: Financial risk management (continued)
2015 Assets and liabilities by maturity profile
Within 3 months
£m
3-12 months
£m 1-5 years
£m
After 5 years
£m Total
£m
Assets Cash and balances at central banks 846.9 — — 41.7 888.6 Derivative financial instruments 16.1 13.2 46.0 68.2 143.5 Loans and receivables:
Loans and advances to banks 119.6 — — — 119.6 Loans and advances to customers 1,919.6 572.6 3,335.1 21,541.3 27,368.6 Debt securities — — — 1,723.9 1,723.9
Available-for-sale financial assets 47.5 4.7 424.4 820.3 1,296.9 Other assets 47.9 20.3 11.7 152.7 232.6
Total assets 2,997.6 610.8 3,817.2 24,348.1 31,773.7 Liabilities Deposits from banks 758.8 525.0 — — 1,283.8 Customer deposits 20,776.8 2,630.3 1,738.2 — 25,145.3 Amounts due to securitisation special
purpose vehicles 65.4 102.2 592.1 2,558.7 3,318.4
Derivative financial instruments 6.0 12.1 102.5 34.7 155.3 Debt securities in issue — — 297.5 — 297.5 Other liabilities 154.1 47.1 39.5 4.4 245.1
Total liabilities 21,761.1 3,316.7 2,769.8 2,597.8 30,445.4
Net liquidity (gap)/surplus (18,763.5) (2,705.9) 1,047.4 21,750.3 1,328.3
2014 Assets and liabilities by maturity profile
Within 3 months
£m
3-12 months
£m 1-5 years
£m
After 5 years
£m Total
£m Assets Cash and balances at central banks 813.3 — — 38.0 851.3 Derivative financial instruments 6.7 11.7 70.7 88.9 178.0 Loans and receivables:
Loans and advances to banks 136.4 — — — 136.4 Loans and advances to customers 1,313.0 567.5 2,860.3 18,607.1 23,347.9 Debt securities in issue — — — 1,407.4 1,407.4
Available-for-sale financial assets 20.1 122.2 406.0 991.3 1,539.6 Other assets 56.7 29.6 30.4 117.5 234.2 Total assets 2,346.2 731.0 3,367.4 21,250.2 27,694.8 Liabilities Deposits from banks 282.5 563.0 — — 845.5 Customer deposits 18,043.6 2,356.7 1,967.7 0.9 22,368.9 Amounts due to securitisation special purpose vehicles 24.9 73.5 480.7 2,187.8 2,766.9 Derivative financial instruments 6.3 6.6 133.1 81.9 227.9 Other liabilities 194.7 42.5 19.1 3.7 260.0 Total liabilities 18,552.0 3,042.3 2,600.6 2,274.3 26,469.2 Net liquidity (gap)/surplus (16,205.8) (2,311.3) 766.8 18,975.9 1,225.6
The composition of the Company’s wholesale funding is shown in the table below:
Source of wholesale funding 2015
£m 2014
£m
Amounts due to securitisation special purpose vehicles 3,318.4 2,766.9 Debt securities in issue 297.5 — Term repo 1,274.9 835.3 Total on-balance sheet sources of funds 4,890.8 3,602.2 FLS drawings 2,960.0 2,260.0 Total 7,850.8 5,862.2
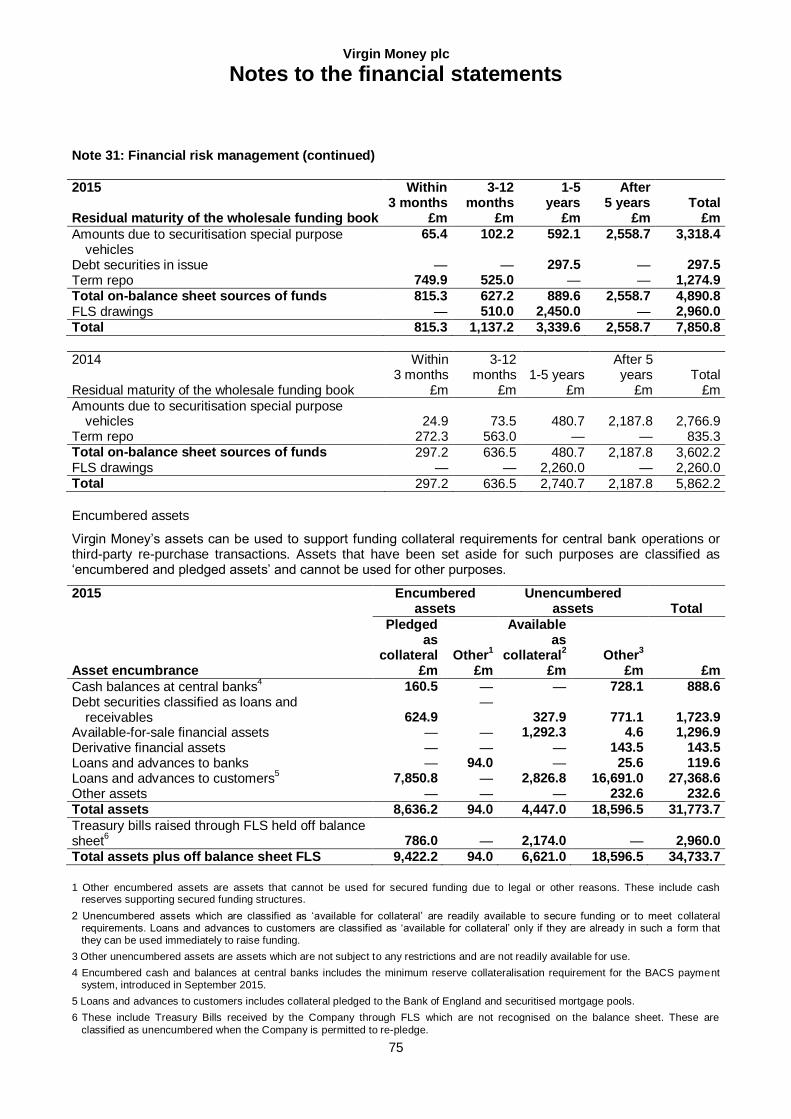
Virgin Money plc
Notes to the financial statements
75
Note 31: Financial risk management (continued)
2015 Residual maturity of the wholesale funding book
Within 3 months
£m
3-12 months
£m
1-5 years
£m
After 5 years
£m Total
£m
Amounts due to securitisation special purpose vehicles
65.4 102.2 592.1 2,558.7 3,318.4
Debt securities in issue — — 297.5 — 297.5 Term repo 749.9 525.0 — — 1,274.9
Total on-balance sheet sources of funds 815.3 627.2 889.6 2,558.7 4,890.8 FLS drawings — 510.0 2,450.0 — 2,960.0
Total 815.3 1,137.2 3,339.6 2,558.7 7,850.8
2014 Residual maturity of the wholesale funding book
Within 3 months
£m
3-12 months
£m 1-5 years
£m
After 5 years
£m Total
£m
Amounts due to securitisation special purpose vehicles 24.9 73.5 480.7 2,187.8 2,766.9
Term repo 272.3 563.0 — — 835.3 Total on-balance sheet sources of funds 297.2 636.5 480.7 2,187.8 3,602.2 FLS drawings — — 2,260.0 — 2,260.0 Total 297.2 636.5 2,740.7 2,187.8 5,862.2
Encumbered assets
Virgin Money’s assets can be used to support funding collateral requirements for central bank operations or third-party re-purchase transactions. Assets that have been set aside for such purposes are classified as ‘encumbered and pledged assets’ and cannot be used for other purposes.
2015 Encumbered assets
Unencumbered assets Total
Asset encumbrance
Pledged as
collateral £m
Other1
£m
Available as
collateral2
£m Other
3
£m £m
Cash balances at central banks4
160.5 — — 728.1 888.6 Debt securities classified as loans and
receivables 624.9 —
327.9 771.1 1,723.9 Available-for-sale financial assets — — 1,292.3 4.6 1,296.9 Derivative financial assets — — — 143.5 143.5 Loans and advances to banks — 94.0 — 25.6 119.6 Loans and advances to customers
5 7,850.8 — 2,826.8 16,691.0 27,368.6
Other assets — — — 232.6 232.6
Total assets 8,636.2 94.0 4,447.0 18,596.5 31,773.7
Treasury bills raised through FLS held off balance sheet
6 786.0 — 2,174.0 — 2,960.0
Total assets plus off balance sheet FLS 9,422.2 94.0 6,621.0 18,596.5 34,733.7
1 Other encumbered assets are assets that cannot be used for secured funding due to legal or other reasons. These include cash reserves supporting secured funding structures.
2 Unencumbered assets which are classified as ‘available for collateral’ are readily available to secure funding or to meet collateral requirements. Loans and advances to customers are classified as ‘available for collateral’ only if they are already in such a form that they can be used immediately to raise funding.
3 Other unencumbered assets are assets which are not subject to any restrictions and are not readily available for use.
4 Encumbered cash and balances at central banks includes the minimum reserve collateralisation requirement for the BACS payment system, introduced in September 2015.
5 Loans and advances to customers includes collateral pledged to the Bank of England and securitised mortgage pools.
6 These include Treasury Bills received by the Company through FLS which are not recognised on the balance sheet. These are
classified as unencumbered when the Company is permitted to re-pledge.
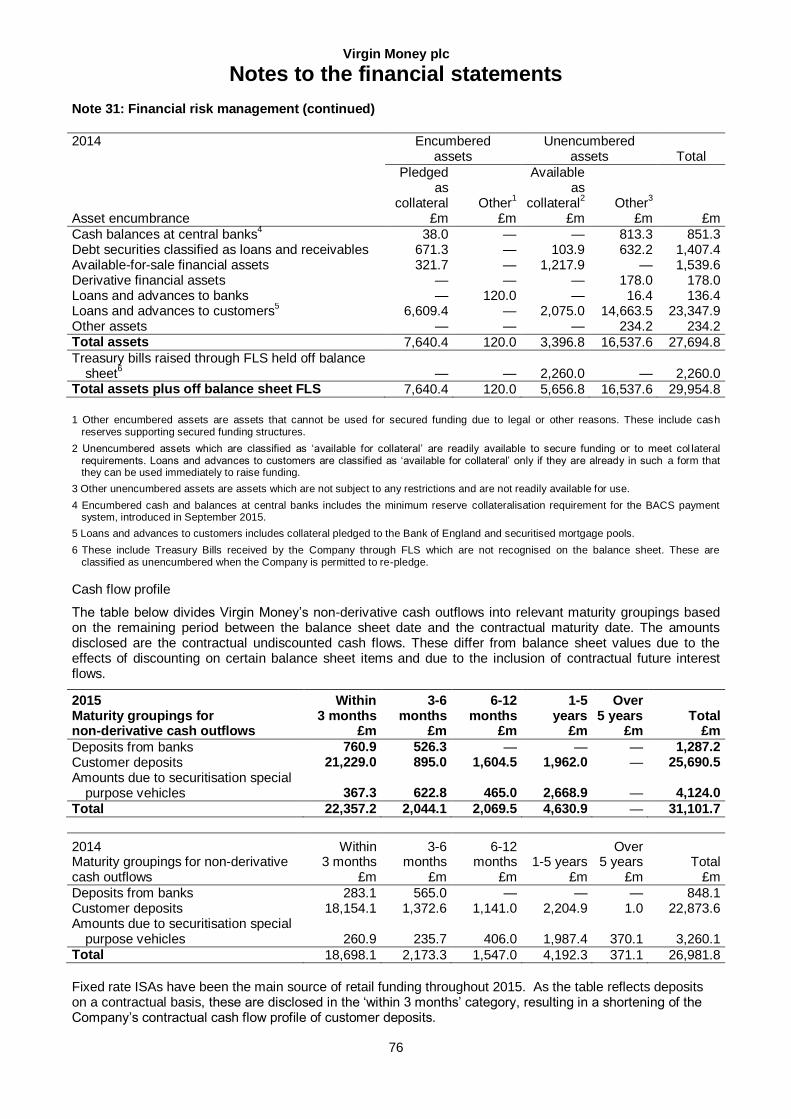
Virgin Money plc
Notes to the financial statements
76
Note 31: Financial risk management (continued)
2014
Encumbered assets
Unencumbered assets Total
Asset encumbrance
Pledged as
collateral £m
Other1
£m
Available as
collateral2
£m Other
3
£m
£m
Cash balances at central banks4
38.0 — — 813.3 851.3 Debt securities classified as loans and receivables 671.3 — 103.9 632.2 1,407.4 Available-for-sale financial assets 321.7 — 1,217.9 — 1,539.6 Derivative financial assets — — — 178.0 178.0 Loans and advances to banks — 120.0 — 16.4 136.4 Loans and advances to customers
5 6,609.4 — 2,075.0 14,663.5 23,347.9
Other assets — — — 234.2 234.2 Total assets 7,640.4 120.0 3,396.8 16,537.6 27,694.8
Treasury bills raised through FLS held off balance sheet
6 — — 2,260.0 — 2,260.0
Total assets plus off balance sheet FLS 7,640.4 120.0 5,656.8 16,537.6 29,954.8
1 Other encumbered assets are assets that cannot be used for secured funding due to legal or other reasons. These include cash reserves supporting secured funding structures.
2 Unencumbered assets which are classified as ‘available for collateral’ are readily available to secure funding or to meet col lateral requirements. Loans and advances to customers are classified as ‘available for collateral’ only if they are already in such a form that they can be used immediately to raise funding.
3 Other unencumbered assets are assets which are not subject to any restrictions and are not readily available for use.
4 Encumbered cash and balances at central banks includes the minimum reserve collateralisation requirement for the BACS payment system, introduced in September 2015.
5 Loans and advances to customers includes collateral pledged to the Bank of England and securitised mortgage pools.
6 These include Treasury Bills received by the Company through FLS which are not recognised on the balance sheet. These are classified as unencumbered when the Company is permitted to re-pledge.
Cash flow profile
The table below divides Virgin Money’s non-derivative cash outflows into relevant maturity groupings based on the remaining period between the balance sheet date and the contractual maturity date. The amounts disclosed are the contractual undiscounted cash flows. These differ from balance sheet values due to the effects of discounting on certain balance sheet items and due to the inclusion of contractual future interest flows.
2015 Maturity groupings for non-derivative cash outflows
Within 3 months
£m
3-6 months
£m
6-12 months
£m
1-5 years
£m
Over 5 years
£m Total
£m
Deposits from banks 760.9 526.3 — — — 1,287.2 Customer deposits 21,229.0 895.0 1,604.5 1,962.0 — 25,690.5 Amounts due to securitisation special
purpose vehicles 367.3 622.8 465.0 2,668.9 — 4,124.0
Total 22,357.2 2,044.1 2,069.5 4,630.9 — 31,101.7
2014 Maturity groupings for non-derivative cash outflows
Within 3 months
£m
3-6 months
£m
6-12 months
£m 1-5 years
£m
Over 5 years
£m Total
£m
Deposits from banks 283.1 565.0 — — — 848.1 Customer deposits 18,154.1 1,372.6 1,141.0 2,204.9 1.0 22,873.6 Amounts due to securitisation special
purpose vehicles 260.9 235.7 406.0 1,987.4 370.1 3,260.1 Total 18,698.1 2,173.3 1,547.0 4,192.3 371.1 26,981.8
Fixed rate ISAs have been the main source of retail funding throughout 2015. As the table reflects deposits on a contractual basis, these are disclosed in the ‘within 3 months’ category, resulting in a shortening of the Company’s contractual cash flow profile of customer deposits.
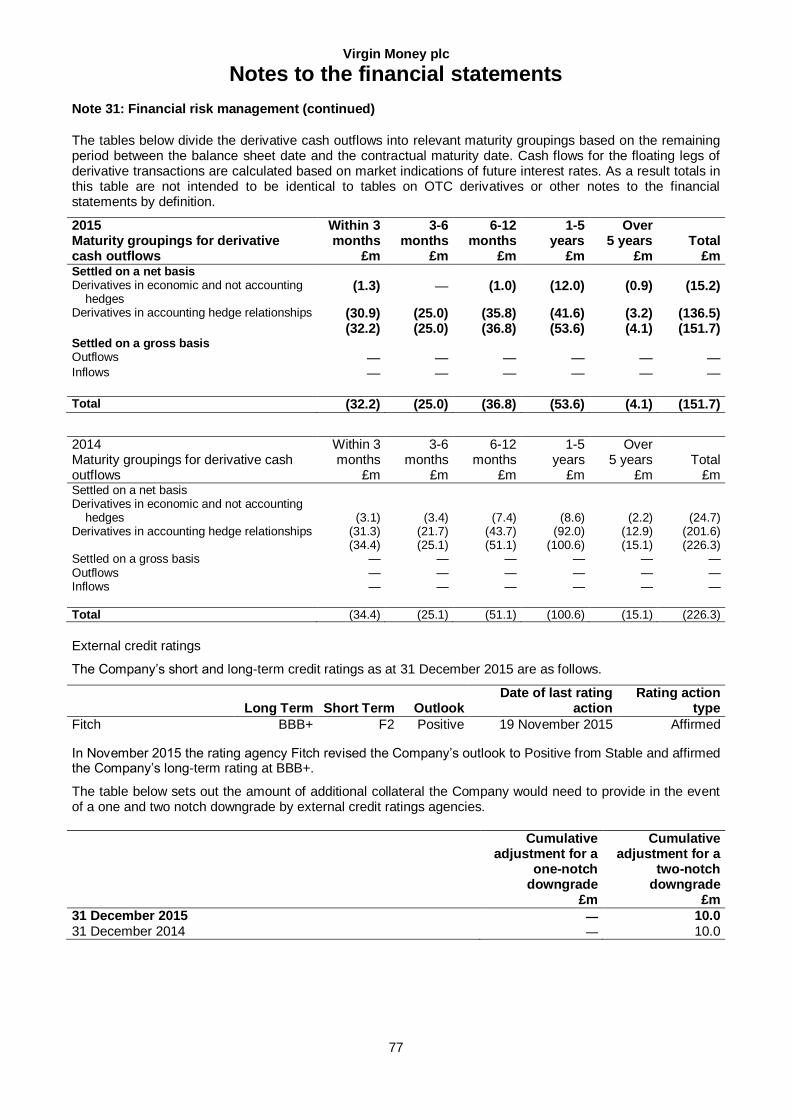
Virgin Money plc
Notes to the financial statements
77
Note 31: Financial risk management (continued)
The tables below divide the derivative cash outflows into relevant maturity groupings based on the remaining period between the balance sheet date and the contractual maturity date. Cash flows for the floating legs of derivative transactions are calculated based on market indications of future interest rates. As a result totals in this table are not intended to be identical to tables on OTC derivatives or other notes to the financial statements by definition.
2015 Maturity groupings for derivative cash outflows
Within 3 months
£m
3-6 months
£m
6-12 months
£m
1-5 years
£m
Over 5 years
£m Total
£m Settled on a net basis Derivatives in economic and not accounting
hedges (1.3) — (1.0) (12.0) (0.9) (15.2)
Derivatives in accounting hedge relationships (30.9) (25.0) (35.8) (41.6) (3.2) (136.5) (32.2) (25.0) (36.8) (53.6) (4.1) (151.7) Settled on a gross basis Outflows — — — — — — Inflows — — — — — — Total (32.2) (25.0) (36.8) (53.6) (4.1) (151.7)
2014 Maturity groupings for derivative cash outflows
Within 3 months
£m
3-6 months
£m
6-12 months
£m
1-5 years
£m
Over 5 years
£m Total
£m Settled on a net basis Derivatives in economic and not accounting
hedges (3.1) (3.4) (7.4) (8.6) (2.2) (24.7) Derivatives in accounting hedge relationships (31.3) (21.7) (43.7) (92.0) (12.9) (201.6) (34.4) (25.1) (51.1) (100.6) (15.1) (226.3) Settled on a gross basis — — — — — — Outflows — — — — — — Inflows — — — — — —
Total (34.4) (25.1) (51.1) (100.6) (15.1) (226.3)
External credit ratings
The Company’s short and long-term credit ratings as at 31 December 2015 are as follows.
Long Term Short Term Outlook
Date of last rating action
Rating action type
Fitch BBB+ F2 Positive 19 November 2015 Affirmed
In November 2015 the rating agency Fitch revised the Company’s outlook to Positive from Stable and affirmed the Company’s long-term rating at BBB+.
The table below sets out the amount of additional collateral the Company would need to provide in the event of a one and two notch downgrade by external credit ratings agencies.
Cumulative adjustment for a
one-notch downgrade
£m
Cumulative adjustment for a
two-notch downgrade
£m
31 December 2015 — 10.0 31 December 2014 — 10.0
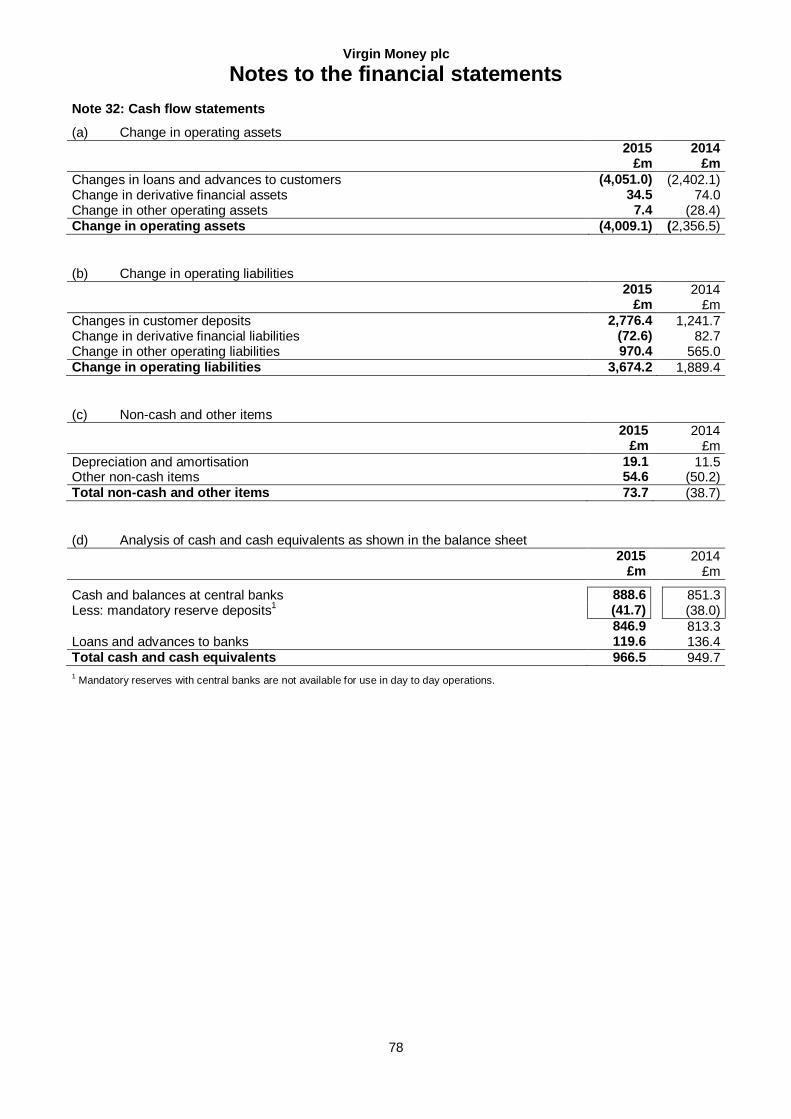
Virgin Money plc
Notes to the financial statements
78
Note 32: Cash flow statements
(a) Change in operating assets 2015
£m 2014
£m
Changes in loans and advances to customers (4,051.0) (2,402.1) Change in derivative financial assets 34.5 74.0 Change in other operating assets 7.4 (28.4) Change in operating assets (4,009.1) (2,356.5)
(b) Change in operating liabilities 2015
£m 2014
£m
Changes in customer deposits 2,776.4 1,241.7 Change in derivative financial liabilities (72.6) 82.7 Change in other operating liabilities 970.4 565.0 Change in operating liabilities 3,674.2 1,889.4
(c) Non-cash and other items 2015
£m 2014
£m
Depreciation and amortisation 19.1 11.5 Other non-cash items 54.6 (50.2) Total non-cash and other items 73.7 (38.7)
(d) Analysis of cash and cash equivalents as shown in the balance sheet
2015 £m
2014 £m
Cash and balances at central banks 888.6 851.3 Less: mandatory reserve deposits
1 (41.7) (38.0)
846.9 813.3 Loans and advances to banks 119.6 136.4 Total cash and cash equivalents 966.5 949.7
1 Mandatory reserves with central banks are not available for use in day to day operations.
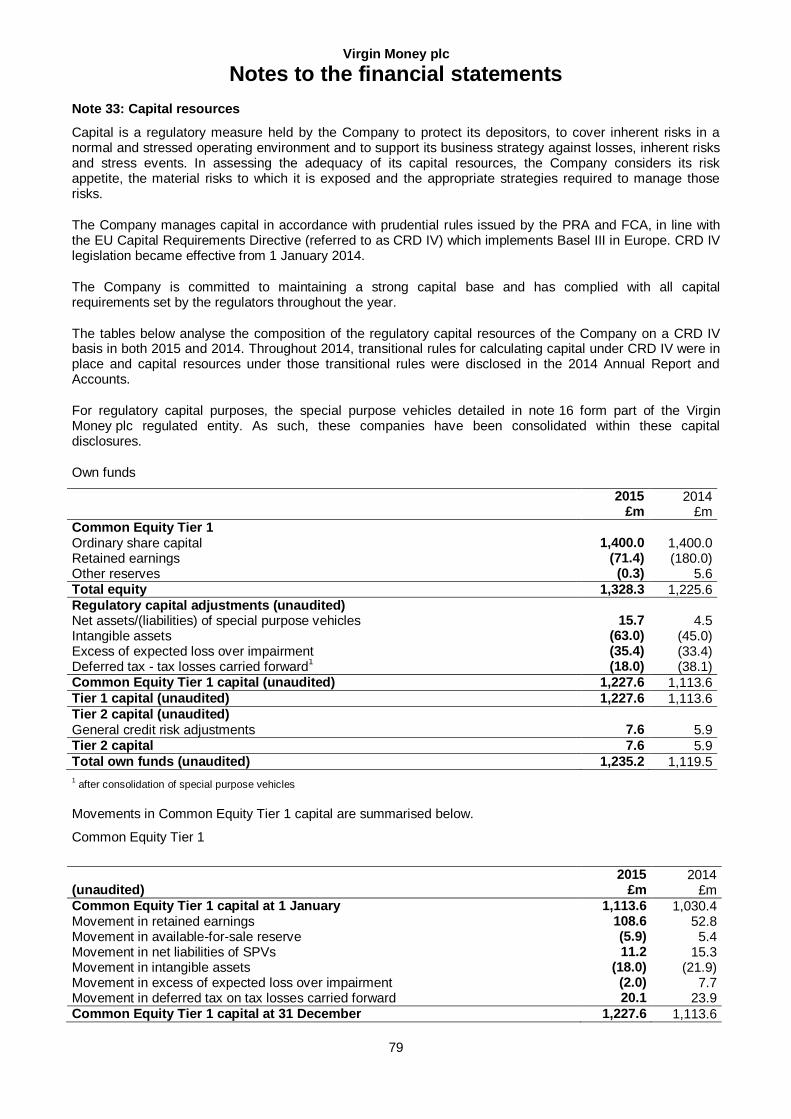
Virgin Money plc
Notes to the financial statements
79
Note 33: Capital resources
Capital is a regulatory measure held by the Company to protect its depositors, to cover inherent risks in a normal and stressed operating environment and to support its business strategy against losses, inherent risks and stress events. In assessing the adequacy of its capital resources, the Company considers its risk appetite, the material risks to which it is exposed and the appropriate strategies required to manage those risks.
The Company manages capital in accordance with prudential rules issued by the PRA and FCA, in line with the EU Capital Requirements Directive (referred to as CRD IV) which implements Basel III in Europe. CRD IV legislation became effective from 1 January 2014.
The Company is committed to maintaining a strong capital base and has complied with all capital requirements set by the regulators throughout the year.
The tables below analyse the composition of the regulatory capital resources of the Company on a CRD IV basis in both 2015 and 2014. Throughout 2014, transitional rules for calculating capital under CRD IV were in place and capital resources under those transitional rules were disclosed in the 2014 Annual Report and Accounts.
For regulatory capital purposes, the special purpose vehicles detailed in note 16 form part of the Virgin Money plc regulated entity. As such, these companies have been consolidated within these capital disclosures.
Own funds
2015 £m
2014 £m
Common Equity Tier 1 Ordinary share capital 1,400.0 1,400.0 Retained earnings (71.4) (180.0) Other reserves (0.3) 5.6 Total equity 1,328.3 1,225.6 Regulatory capital adjustments (unaudited) Net assets/(liabilities) of special purpose vehicles 15.7 4.5 Intangible assets (63.0) (45.0) Excess of expected loss over impairment (35.4) (33.4) Deferred tax - tax losses carried forward
1 (18.0) (38.1)
Common Equity Tier 1 capital (unaudited) 1,227.6 1,113.6 Tier 1 capital (unaudited) 1,227.6 1,113.6 Tier 2 capital (unaudited) General credit risk adjustments 7.6 5.9 Tier 2 capital 7.6 5.9 Total own funds (unaudited) 1,235.2 1,119.5
1 after consolidation of special purpose vehicles
Movements in Common Equity Tier 1 capital are summarised below.
Common Equity Tier 1
(unaudited) 2015
£m 2014
£m Common Equity Tier 1 capital at 1 January 1,113.6 1,030.4 Movement in retained earnings 108.6 52.8 Movement in available-for-sale reserve (5.9) 5.4 Movement in net liabilities of SPVs 11.2 15.3 Movement in intangible assets (18.0) (21.9) Movement in excess of expected loss over impairment (2.0) 7.7 Movement in deferred tax on tax losses carried forward 20.1 23.9 Common Equity Tier 1 capital at 31 December 1,227.6 1,113.6
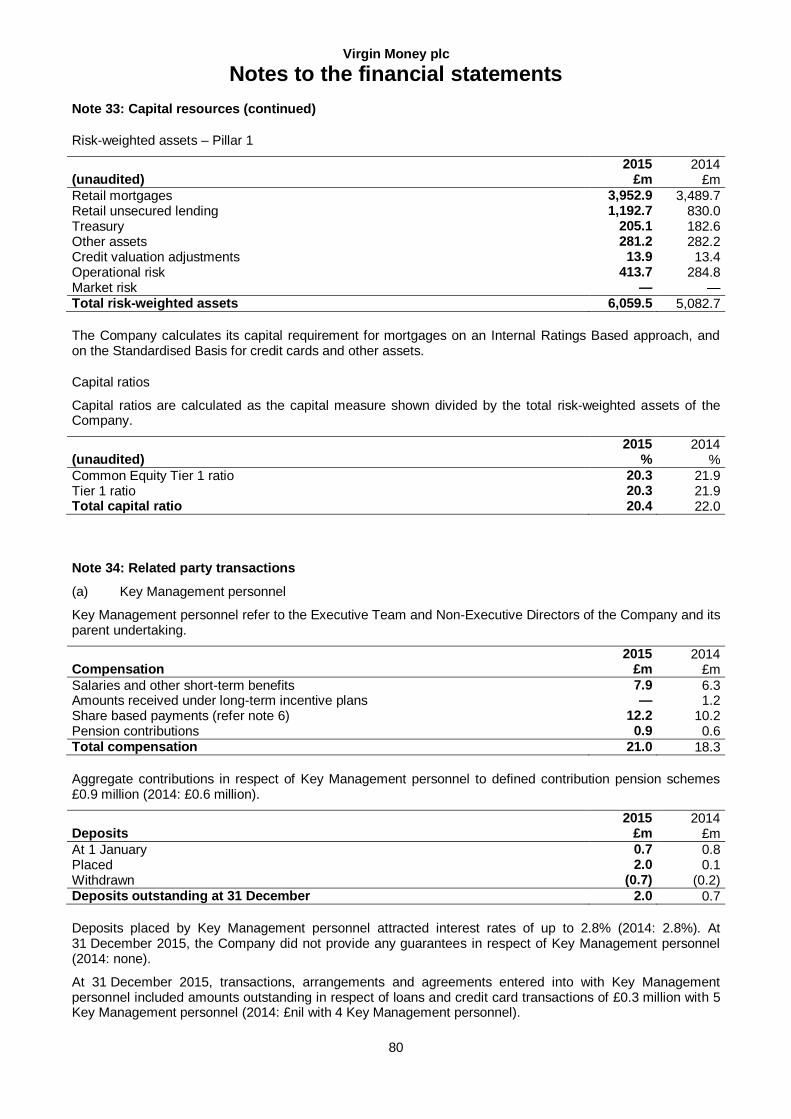
Virgin Money plc
Notes to the financial statements
80
Note 33: Capital resources (continued)
Risk-weighted assets – Pillar 1
(unaudited) 2015
£m 2014
£m
Retail mortgages 3,952.9 3,489.7 Retail unsecured lending 1,192.7 830.0 Treasury 205.1 182.6 Other assets 281.2 282.2 Credit valuation adjustments 13.9 13.4 Operational risk 413.7 284.8 Market risk — — Total risk-weighted assets 6,059.5 5,082.7
The Company calculates its capital requirement for mortgages on an Internal Ratings Based approach, and on the Standardised Basis for credit cards and other assets.
Capital ratios
Capital ratios are calculated as the capital measure shown divided by the total risk-weighted assets of the Company.
(unaudited) 2015
% 2014
%
Common Equity Tier 1 ratio 20.3 21.9 Tier 1 ratio 20.3 21.9 Total capital ratio 20.4 22.0 Note 34: Related party transactions
(a) Key Management personnel
Key Management personnel refer to the Executive Team and Non-Executive Directors of the Company and its parent undertaking.
Compensation 2015
£m 2014
£m
Salaries and other short-term benefits 7.9 6.3 Amounts received under long-term incentive plans — 1.2 Share based payments (refer note 6) 12.2 10.2 Pension contributions 0.9 0.6 Total compensation 21.0 18.3
Aggregate contributions in respect of Key Management personnel to defined contribution pension schemes £0.9 million (2014: £0.6 million).
Deposits 2015
£m 2014
£m
At 1 January 0.7 0.8 Placed 2.0 0.1 Withdrawn (0.7) (0.2) Deposits outstanding at 31 December 2.0 0.7
Deposits placed by Key Management personnel attracted interest rates of up to 2.8% (2014: 2.8%). At 31 December 2015, the Company did not provide any guarantees in respect of Key Management personnel (2014: none).
At 31 December 2015, transactions, arrangements and agreements entered into with Key Management personnel included amounts outstanding in respect of loans and credit card transactions of £0.3 million with 5 Key Management personnel (2014: £nil with 4 Key Management personnel).
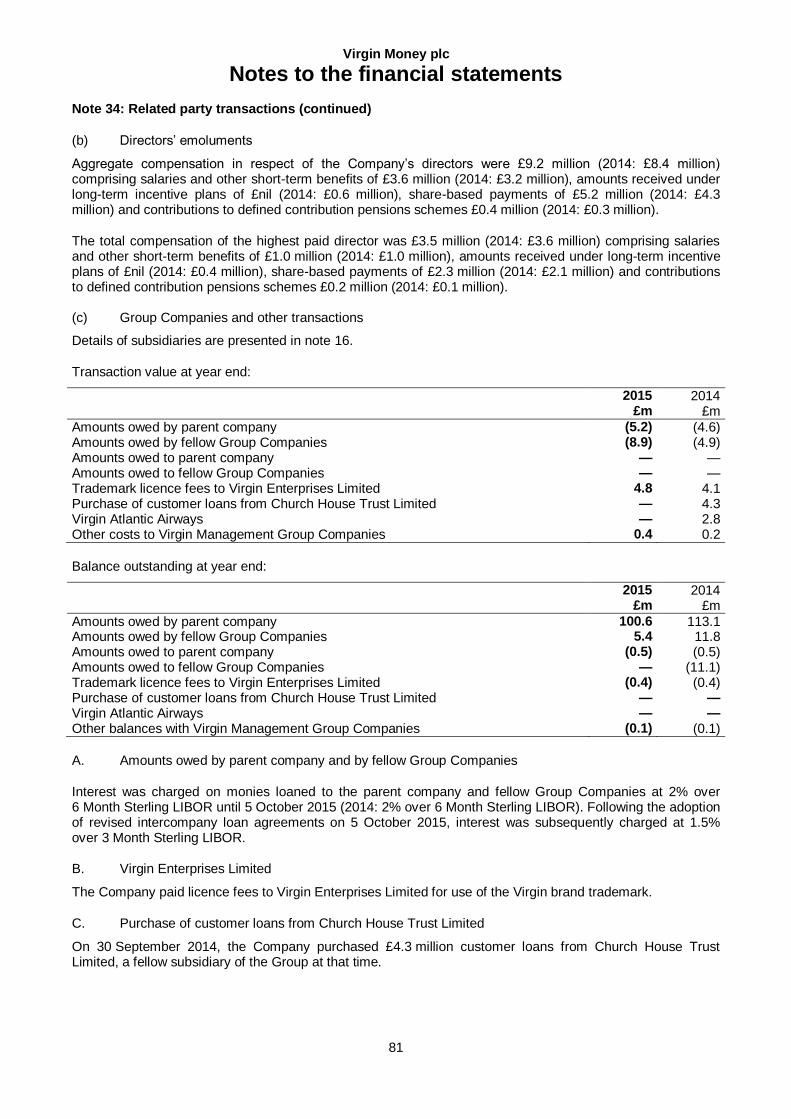
Virgin Money plc
Notes to the financial statements
81
Note 34: Related party transactions (continued)
(b) Directors’ emoluments
Aggregate compensation in respect of the Company’s directors were £9.2 million (2014: £8.4 million) comprising salaries and other short-term benefits of £3.6 million (2014: £3.2 million), amounts received under long-term incentive plans of £nil (2014: £0.6 million), share-based payments of £5.2 million (2014: £4.3 million) and contributions to defined contribution pensions schemes £0.4 million (2014: £0.3 million).
The total compensation of the highest paid director was £3.5 million (2014: £3.6 million) comprising salaries and other short-term benefits of £1.0 million (2014: £1.0 million), amounts received under long-term incentive plans of £nil (2014: £0.4 million), share-based payments of £2.3 million (2014: £2.1 million) and contributions to defined contribution pensions schemes £0.2 million (2014: £0.1 million). (c) Group Companies and other transactions
Details of subsidiaries are presented in note 16.
Transaction value at year end:
2015 £m
2014 £m
Amounts owed by parent company (5.2) (4.6) Amounts owed by fellow Group Companies (8.9) (4.9) Amounts owed to parent company — — Amounts owed to fellow Group Companies — — Trademark licence fees to Virgin Enterprises Limited 4.8 4.1 Purchase of customer loans from Church House Trust Limited — 4.3 Virgin Atlantic Airways — 2.8 Other costs to Virgin Management Group Companies 0.4 0.2
Balance outstanding at year end:
2015 £m
2014 £m
Amounts owed by parent company 100.6 113.1 Amounts owed by fellow Group Companies 5.4 11.8 Amounts owed to parent company (0.5) (0.5) Amounts owed to fellow Group Companies — (11.1) Trademark licence fees to Virgin Enterprises Limited (0.4) (0.4) Purchase of customer loans from Church House Trust Limited — — Virgin Atlantic Airways — — Other balances with Virgin Management Group Companies (0.1) (0.1)
A. Amounts owed by parent company and by fellow Group Companies
Interest was charged on monies loaned to the parent company and fellow Group Companies at 2% over 6 Month Sterling LIBOR until 5 October 2015 (2014: 2% over 6 Month Sterling LIBOR). Following the adoption of revised intercompany loan agreements on 5 October 2015, interest was subsequently charged at 1.5% over 3 Month Sterling LIBOR.
B. Virgin Enterprises Limited
The Company paid licence fees to Virgin Enterprises Limited for use of the Virgin brand trademark.
C. Purchase of customer loans from Church House Trust Limited
On 30 September 2014, the Company purchased £4.3 million customer loans from Church House Trust Limited, a fellow subsidiary of the Group at that time.
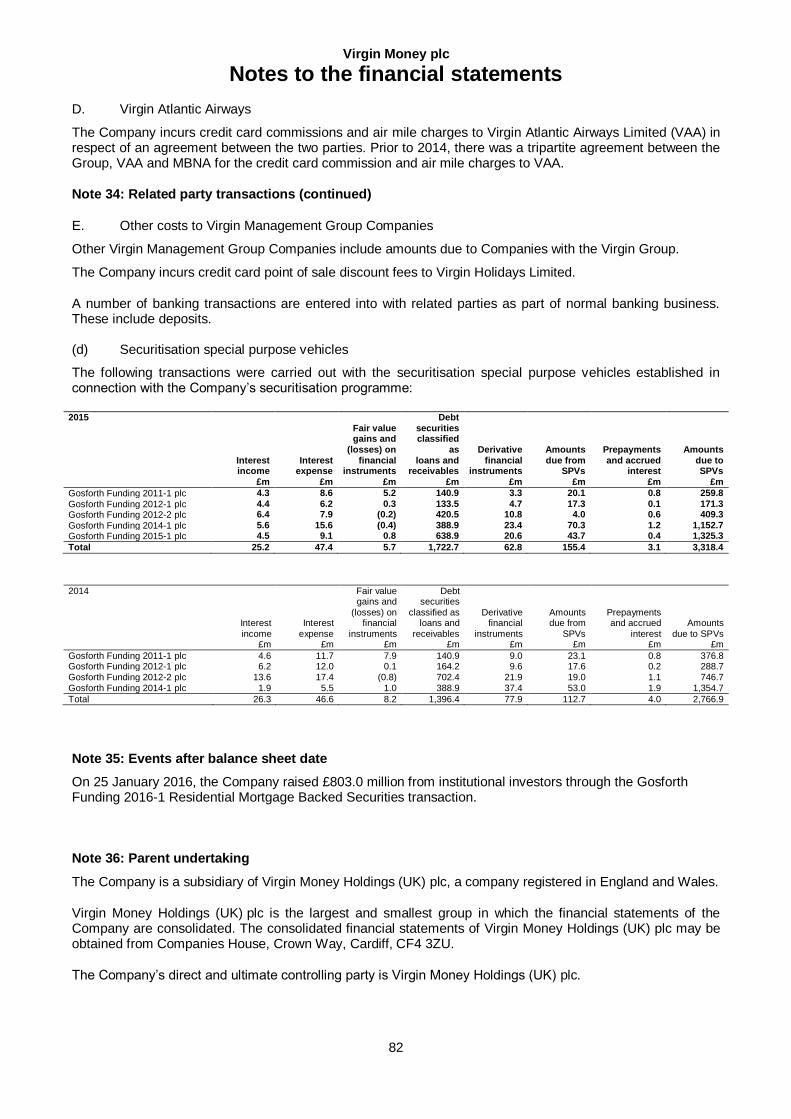
Virgin Money plc
Notes to the financial statements
82
D. Virgin Atlantic Airways
The Company incurs credit card commissions and air mile charges to Virgin Atlantic Airways Limited (VAA) in respect of an agreement between the two parties. Prior to 2014, there was a tripartite agreement between the Group, VAA and MBNA for the credit card commission and air mile charges to VAA.
Note 34: Related party transactions (continued)
E. Other costs to Virgin Management Group Companies
Other Virgin Management Group Companies include amounts due to Companies with the Virgin Group.
The Company incurs credit card point of sale discount fees to Virgin Holidays Limited.
A number of banking transactions are entered into with related parties as part of normal banking business. These include deposits. (d) Securitisation special purpose vehicles
The following transactions were carried out with the securitisation special purpose vehicles established in connection with the Company’s securitisation programme:
2015
Interest income
£m
Interest expense
£m
Fair value gains and
(losses) on financial
instruments £m
Debt securities classified
as loans and
receivables £m
Derivative financial
instruments £m
Amounts due from
SPVs £m
Prepayments and accrued
interest £m
Amounts due to SPVs
£m
Gosforth Funding 2011-1 plc 4.3 8.6 5.2 140.9 3.3 20.1 0.8 259.8
Gosforth Funding 2012-1 plc 4.4 6.2 0.3 133.5 4.7 17.3 0.1 171.3 Gosforth Funding 2012-2 plc 6.4 7.9 (0.2) 420.5 10.8 4.0 0.6 409.3
Gosforth Funding 2014-1 plc 5.6 15.6 (0.4) 388.9 23.4 70.3 1.2 1,152.7 Gosforth Funding 2015-1 plc 4.5 9.1 0.8 638.9 20.6 43.7 0.4 1,325.3
Total 25.2 47.4 5.7 1,722.7 62.8 155.4 3.1 3,318.4
2014
Interest income
£m
Interest expense
£m
Fair value gains and
(losses) on financial
instruments £m
Debt securities
classified as loans and
receivables £m
Derivative financial
instruments £m
Amounts due from
SPVs £m
Prepayments and accrued
interest £m
Amounts due to SPVs
£m
Gosforth Funding 2011-1 plc 4.6 11.7 7.9 140.9 9.0 23.1 0.8 376.8 Gosforth Funding 2012-1 plc 6.2 12.0 0.1 164.2 9.6 17.6 0.2 288.7 Gosforth Funding 2012-2 plc 13.6 17.4 (0.8) 702.4 21.9 19.0 1.1 746.7 Gosforth Funding 2014-1 plc 1.9 5.5 1.0 388.9 37.4 53.0 1.9 1,354.7
Total 26.3 46.6 8.2 1,396.4 77.9 112.7 4.0 2,766.9
Note 35: Events after balance sheet date
On 25 January 2016, the Company raised £803.0 million from institutional investors through the Gosforth Funding 2016-1 Residential Mortgage Backed Securities transaction. Note 36: Parent undertaking
The Company is a subsidiary of Virgin Money Holdings (UK) plc, a company registered in England and Wales.
Virgin Money Holdings (UK) plc is the largest and smallest group in which the financial statements of the Company are consolidated. The consolidated financial statements of Virgin Money Holdings (UK) plc may be obtained from Companies House, Crown Way, Cardiff, CF4 3ZU.
The Company’s direct and ultimate controlling party is Virgin Money Holdings (UK) plc.
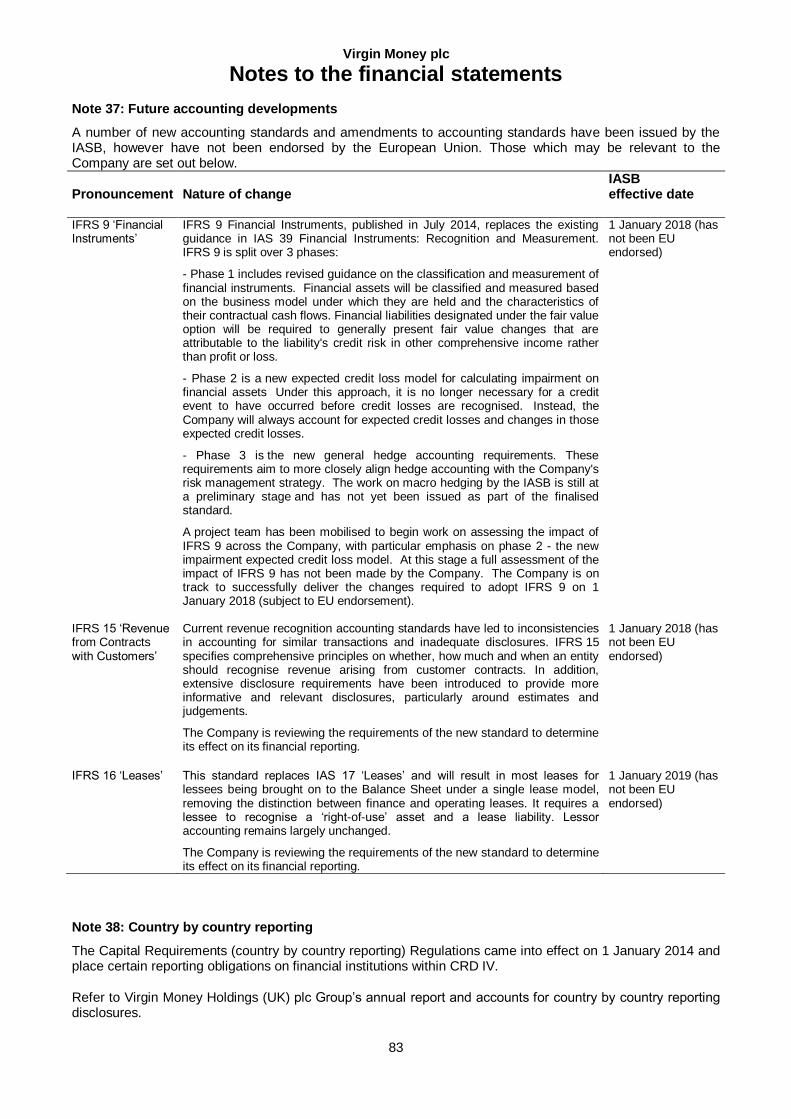
Virgin Money plc
Notes to the financial statements
83
Note 37: Future accounting developments
A number of new accounting standards and amendments to accounting standards have been issued by the IASB, however have not been endorsed by the European Union. Those which may be relevant to the Company are set out below.
Pronouncement
Nature of change
IASB effective date
IFRS 9 ‘Financial Instruments’
IFRS 9 Financial Instruments, published in July 2014, replaces the existing guidance in IAS 39 Financial Instruments: Recognition and Measurement. IFRS 9 is split over 3 phases:
1 January 2018 (has not been EU endorsed)
- Phase 1 includes revised guidance on the classification and measurement of financial instruments. Financial assets will be classified and measured based on the business model under which they are held and the characteristics of their contractual cash flows. Financial liabilities designated under the fair value option will be required to generally present fair value changes that are attributable to the liability's credit risk in other comprehensive income rather than profit or loss.
- Phase 2 is a new expected credit loss model for calculating impairment on financial assets Under this approach, it is no longer necessary for a credit event to have occurred before credit losses are recognised. Instead, the Company will always account for expected credit losses and changes in those expected credit losses.
- Phase 3 is the new general hedge accounting requirements. These requirements aim to more closely align hedge accounting with the Company's risk management strategy. The work on macro hedging by the IASB is still at a preliminary stage and has not yet been issued as part of the finalised standard.
A project team has been mobilised to begin work on assessing the impact of IFRS 9 across the Company, with particular emphasis on phase 2 - the new impairment expected credit loss model. At this stage a full assessment of the impact of IFRS 9 has not been made by the Company. The Company is on track to successfully deliver the changes required to adopt IFRS 9 on 1 January 2018 (subject to EU endorsement).
IFRS 15 ‘Revenue from Contracts with Customers’
Current revenue recognition accounting standards have led to inconsistencies in accounting for similar transactions and inadequate disclosures. IFRS 15 specifies comprehensive principles on whether, how much and when an entity should recognise revenue arising from customer contracts. In addition, extensive disclosure requirements have been introduced to provide more informative and relevant disclosures, particularly around estimates and judgements.
1 January 2018 (has not been EU endorsed)
The Company is reviewing the requirements of the new standard to determine its effect on its financial reporting.
IFRS 16 ‘Leases’ This standard replaces IAS 17 ‘Leases’ and will result in most leases for lessees being brought on to the Balance Sheet under a single lease model, removing the distinction between finance and operating leases. It requires a lessee to recognise a ‘right-of-use’ asset and a lease liability. Lessor accounting remains largely unchanged.
The Company is reviewing the requirements of the new standard to determine its effect on its financial reporting.
1 January 2019 (has not been EU endorsed)
Note 38: Country by country reporting
The Capital Requirements (country by country reporting) Regulations came into effect on 1 January 2014 and place certain reporting obligations on financial institutions within CRD IV.
Refer to Virgin Money Holdings (UK) plc Group’s annual report and accounts for country by country reporting disclosures.

84
(This page has been left blank intentionally)