Embed Size (px)
Citation preview
2 March 2016 Pursuant to Listing Rule 9.6.1, copies of the following documents have been submitted to the UK Listing Authority and will shortly be available for inspection at the UK Listing Authority's Document Viewing Facility, via the National Storage Mechanism, which is located at: www.hemscott.com/nsm.do. A copy of the Annual Report and Accounts 2015, Pillar III Report 2015 and an investor presentation are available within the Investor Relations section of our website www.virginmoney.com. This announcement also contains additional information for the purposes of compliance with the Disclosure and Transparency Rules, including principal risks and uncertainties, details of related party transactions and a responsibility statement. Reference to pages and numbers refer to page numbers and notes to the annual accounts in the Annual Report and Accounts 2015.
Virgin Money Holdings (UK) plc
Full year results BASIS OF PRESENTATION This report covers the results of Virgin Money Holdings (UK) plc together with its subsidiaries (“Virgin Money” or “the Group”) for the year ended 31 December 2015. Statutory basis Statutory information is set out in the Financial Statements section of this announcement. Underlying results In order to present a more meaningful view of business performance, the results of the Group and its divisions are presented on an underlying basis of reporting as described below. The following items have been excluded from underlying profits:
additional Northern Rock consideration;
other costs associated with IPO including share based payment charges; and
strategic items and compensation for senior leavers. Unless otherwise stated, income statement commentaries throughout this document compare the year ended 31 December 2015 to the year ended 31 December 2014, and the balance sheet analysis compares the Group balance sheet as at 31 December 2015 to the Group balance sheet as at 31 December 2014. Forward looking statements This document contains certain forward looking statements with respect to the business, strategy and plans of Virgin Money Group and its current goals and expectations relating to its future financial condition and performance. Statements that are not historical facts, including statements about Virgin Money Group‟s or its directors‟ and/or management‟s beliefs and expectations, are forward looking statements. By their nature, forward looking statements involve risk and uncertainty because they relate to events and depend upon circumstances that will or may occur in the future. Factors that could cause actual business, strategy, plans and/or results to differ materially from the plans, objectives, expectations, estimates and intentions expressed in such forward looking statements made by the Group or on its behalf include, but are not limited to: general economic and business conditions in the UK and internationally; inflation, deflation, interest rates and policies of the Bank of England, the European Central Bank and other G8 central banks; fluctuations in exchange rates, stock markets and currencies; the ability to access sufficient sources of capital, liquidity and funding when required; changes to Virgin Money‟s credit ratings; the ability to derive cost savings; changing demographic developments, including mortality, and changing customer behaviour, including consumer spending, saving and borrowing habits; changes in customer preferences; changes to borrower or counterparty credit quality; instability in the global financial markets, including Eurozone instability, the potential for one or more countries to exit the
Eurozone or European Union (EU) (including the UK as a result of a referendum on its EU membership), and the impact of any sovereign credit rating downgrade or other sovereign financial issues; technological changes and risks to cyber security; natural and other disasters, adverse weather and similar contingencies outside Virgin Money‟s control; inadequate or failed internal or external processes, people and systems; terrorist acts and other acts of war or hostility and responses to those acts; geopolitical, pandemic or other such events; changes in laws, regulations, taxation, accounting standards or practices; regulatory capital or liquidity requirements and similar contingencies outside Virgin Money‟s control; the policies and actions of governmental or regulatory authorities in the UK, the EU, the US or elsewhere including the implementation and interpretation of key legislation and regulation; the ability to attract and retain senior management and other employees; the extent of any future impairment charges or write–downs caused by, but not limited to, depressed asset valuations, market disruptions and illiquid markets; market relating trends and developments; exposure to regulatory scrutiny, legal proceedings, regulatory investigations or complaints; changes in competition and pricing environments; the inability to hedge certain risks economically; the adequacy of loss reserves; the actions of competitors, including non–bank financial services and lending companies; and the success of Virgin Money in managing the risks of the foregoing. Any forward–looking statements made in this document speak only as of the date they are made and it should not be assumed that they have been revised or updated in the light of new information of future events. Except as required by the Prudential Regulation Authority, the Financial Conduct Authority, the London Stock Exchange plc or applicable law, Virgin Money expressly disclaims any obligation or undertaking to release publicly any updates of revisions to any forward–looking statements contained in this document to reflect any change in Virgin Money‟s expectations with regard thereto or any change in events, conditions or circumstances on which any such statement is based.
VIRGIN MONEY GROUP 2015 RESULTS
Virgin Money Holdings (UK) plc delivers strong performance in its first full financial year since listing
Market-beating growth across core mortgages, savings and credit card businesses Underlying profit before tax increased by 53% to £160.3 million, from £104.8 million in
2014 Financial Highlights
Underlying profit before tax increased by 53 per cent to £160.3 million, from £104.8 million in 2014.
Underlying net interest margin increased to 165 basis points, from 150 basis points in 2014.
Underlying cost:income ratio improved to 63.6 per cent, from 72.5 per cent in 2014.
Underlying return on tangible equity increased to 10.9 per cent in 2015 from 7.4 per cent in 2014.
Statutory profit before tax of £138.0 million, compared to a statutory profit before tax of £34.0 million in 2014.
The Board recommends a final dividend of 3.1 pence per ordinary share. The total dividend for the year will be 4.5 pence per ordinary share.
Delivered significant growth across our core businesses
Retail deposit balances increased to £25.1 billion, up 12 per cent versus market growth of 7 per cent.
1
Credit card balances increased to £1.6 billion, up 44 per cent versus market growth of 4 per cent.1
Mortgage balances increased to £25.5 billion, up 16 per cent versus market growth of 1.8 per cent.1
Gross mortgage lending of £7.5 billion, representing a market share of 3.4 per cent, and net lending of £3.6 billion, representing a market share of 10.6 per cent.
1
Maintained our focus on a high-quality balance sheet, underpinned by strong asset quality and a prudent risk appetite
Strong capital position, with a Common Equity Tier 1 ratio of 17.5 per cent at 31 December 2015.
Total capital ratio of 20.2 per cent and a leverage ratio of 4.0 per cent at 31 December 2015.
Mortgage arrears held at low levels, with loans over three months in arrears of 0.22 per cent compared with the latest industry average of 1.12 per cent.
2
Low credit card arrears maintained, with credit card balances two or more payments in arrears of 0.96 per cent, compared with the latest industry average of 2.7 per cent.
3
Continued to work with our stakeholders to deliver on our philosophy of making ‘everyone better off’
Customers - overall Net Promoter Score, a key measure of customer advocacy, increased from +14 to +19 and customer numbers increased to over 3 million.
Communities - over £92.5 million was donated to charities in 2015, including Gift Aid, through Virgin Money Giving, Virgin Money‟s not-for-profit online donation service.
Corporate partners - over 12,500 Intermediary Partners introduced mortgage business to Virgin Money in 2015, and the Group was awarded the prestigious „Best Lender Award‟
4 at the Legal &
General Mortgage Club Awards.
Colleagues - increased colleague engagement to 88 per cent, with 92 per cent of colleagues fully supporting our values and 86 per cent believing strongly in Virgin Money's goals and objectives.
1Source: Bank of England |
2Source: Council of Mortgage Lenders |
3Source: Argus Industry Benchmark 2015 |
4 „Best Lender for
Partnership‟
Jayne-Anne Gadhia, Chief Executive at Virgin Money, said: “I am delighted to report a 53 per cent increase in underlying profit for 2015 which ended the year at £160.3 million. We have performed strongly against our objectives, including delivering market-beating growth in our core mortgages, savings and credit card businesses, maintaining the quality of our balance sheet and delivering a customer satisfaction rating among the highest scoring retail banks in the UK. Growth in our mortgage book outpaced the market as we continued to support demand for housing in the UK. Our savings franchise continued to flourish and deposit balances are now higher than at any point in our history. The success of our new credit card business, following the successful migration of credit card accounts to our own platform, means we now expect to grow card balances to at least £3 billion by the end of 2017, a year earlier than planned. We will continue to put our customers at the heart of everything we do and look to the future with confidence.” Continued strong performance in 2015 provides a solid platform for future growth OUTLOOK
The fundamentals of the UK economy remain stable, with high levels of employment, positive wage growth and lower oil prices boosting disposable incomes. The continuation of positive domestic economic factors supports consumer confidence and our organic plan for growth albeit in a lower interest rate environment.
We have considered the changes regarding the buy-to-let market and believe buy-to-let mortgages will continue to support the demand for private rented accommodation. Our mortgage business is comprised of 83 per cent residential and 17 per cent buy-to-let mortgages and our buy-to-let lending is high-quality. We do not expect the new tax regulations for buy-to-let landlords to have a material impact on our business.
In addition to growing our core businesses, we continue to explore new opportunities in SME banking and we are conducting a Personal Current Account (PCA) feasibility study with a view to defining our expansion into the broader PCA market, beyond our market-leading Basic Bank Account.
As a result of the strength of the business and our continued ability to manage our cost base, we are confident of hitting our targeted returns despite the challenges of a lower for longer interest rate environment. We are able to absorb the impact of the new bank tax surcharge and we are well placed to achieve a mid-teens return on tangible equity by the end of 2017.
Our philosophy regarding acquisitions is unchanged. We will consider potential opportunities that are a good fit with the business, value accretive and within our prudent risk appetite.
UNDERLYING BASIS - CONSOLIDATED INCOME STATEMENT
2015
£ million 2014
£ million Change
%
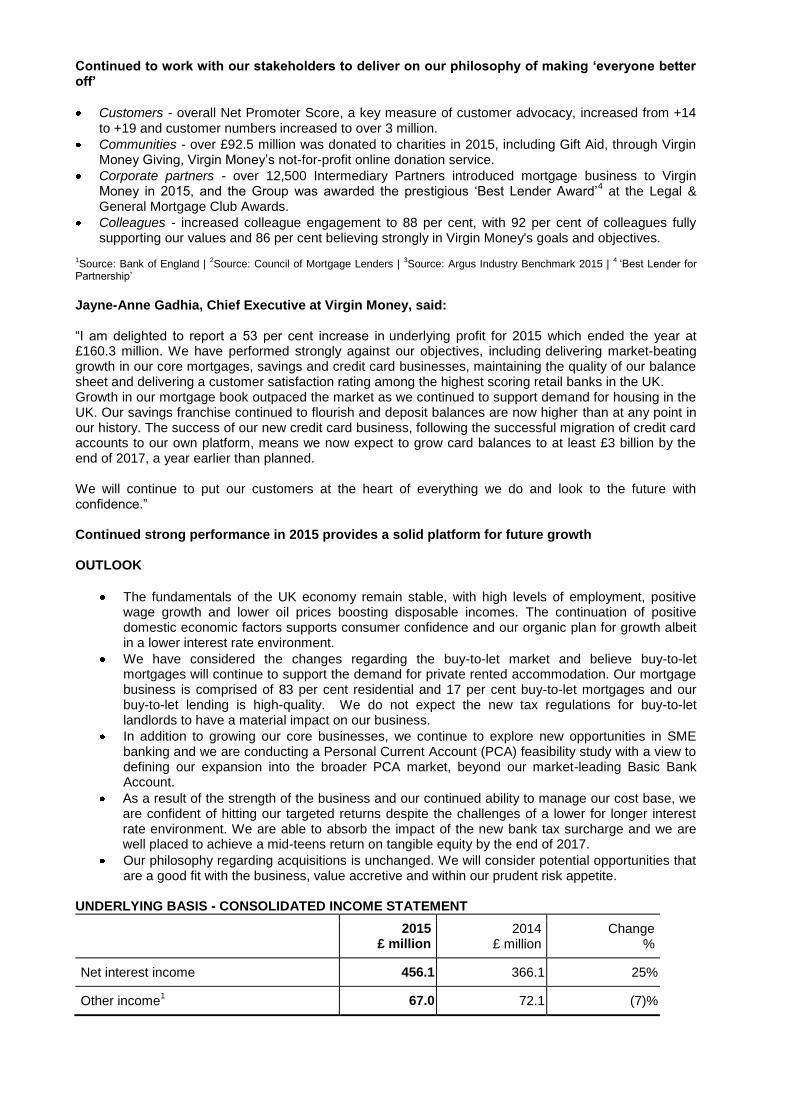
Net interest income 456.1 366.1 25%
Other income1 67.0 72.1 (7)%
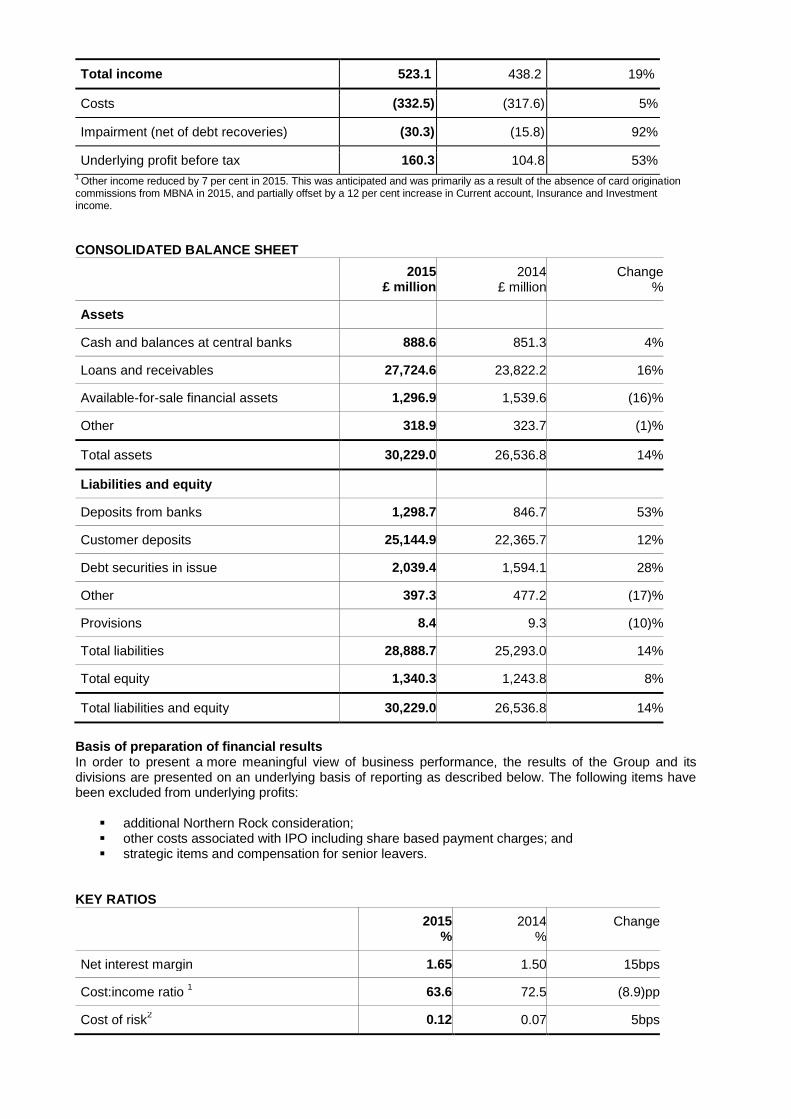
Total income 523.1 438.2 19%
Costs (332.5) (317.6) 5%
Impairment (net of debt recoveries) (30.3) (15.8) 92%
Underlying profit before tax 160.3 104.8 53% 1 Other income reduced by 7 per cent in 2015. This was anticipated and was primarily as a result of the absence of card origination
commissions from MBNA in 2015, and partially offset by a 12 per cent increase in Current account, Insurance and Investment income.
CONSOLIDATED BALANCE SHEET
2015
£ million 2014
£ million Change
%
Assets
Cash and balances at central banks 888.6 851.3 4%
Loans and receivables 27,724.6 23,822.2 16%
Available-for-sale financial assets 1,296.9 1,539.6 (16)%
Other 318.9 323.7 (1)%
Total assets 30,229.0 26,536.8 14%
Liabilities and equity
Deposits from banks 1,298.7 846.7 53%
Customer deposits 25,144.9 22,365.7 12%
Debt securities in issue 2,039.4 1,594.1 28%
Other 397.3 477.2 (17)%
Provisions 8.4 9.3 (10)%
Total liabilities 28,888.7 25,293.0 14%
Total equity 1,340.3 1,243.8 8%
Total liabilities and equity 30,229.0 26,536.8 14%
Basis of preparation of financial results In order to present a more meaningful view of business performance, the results of the Group and its divisions are presented on an underlying basis of reporting as described below. The following items have been excluded from underlying profits:
additional Northern Rock consideration; other costs associated with IPO including share based payment charges; and strategic items and compensation for senior leavers.
KEY RATIOS
2015
% 2014
% Change
Net interest margin 1.65 1.50 15bps
Cost:income ratio 1 63.6 72.5 (8.9)pp
Cost of risk2 0.12 0.07 5bps
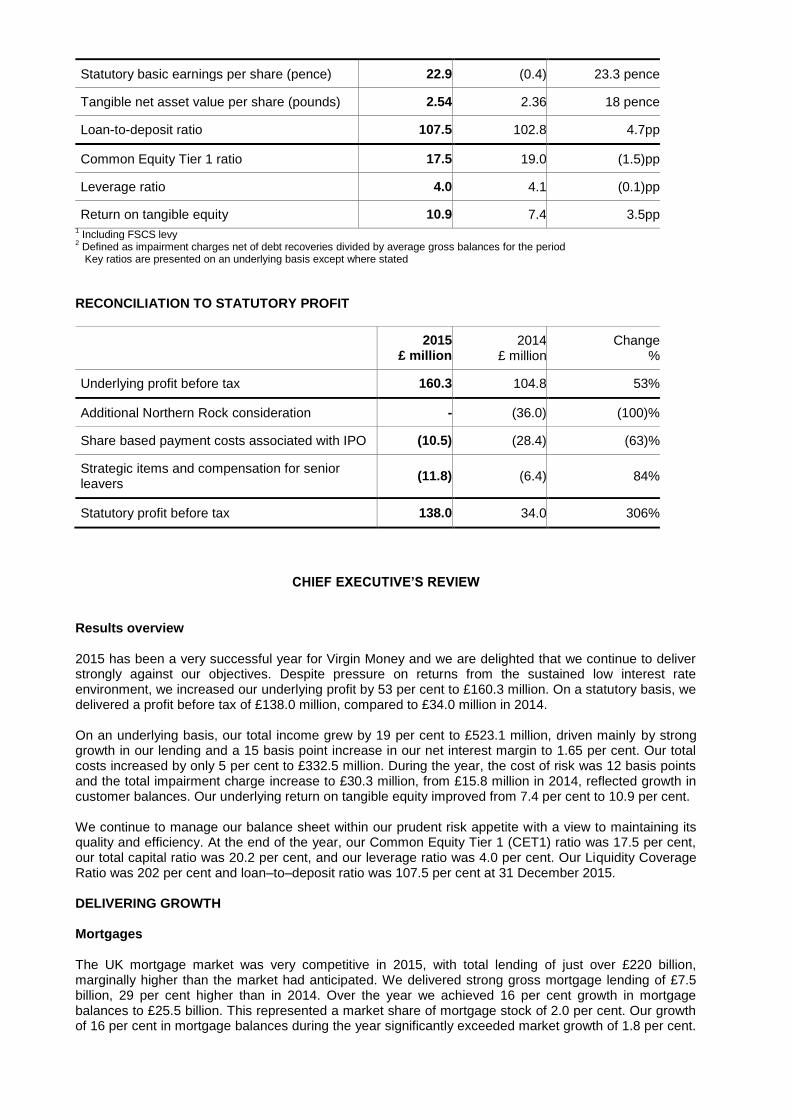
Statutory basic earnings per share (pence) 22.9 (0.4) 23.3 pence
Tangible net asset value per share (pounds) 2.54 2.36 18 pence
Loan-to-deposit ratio 107.5 102.8 4.7pp
Common Equity Tier 1 ratio 17.5 19.0 (1.5)pp
Leverage ratio 4.0 4.1 (0.1)pp
Return on tangible equity 10.9 7.4 3.5pp 1 Including FSCS levy
2 Defined as impairment charges net of debt recoveries divided by average gross balances for the period Key ratios are presented on an underlying basis except where stated
RECONCILIATION TO STATUTORY PROFIT
2015
£ million 2014
£ million Change
%
Underlying profit before tax 160.3 104.8 53%
Additional Northern Rock consideration - (36.0) (100)%
Share based payment costs associated with IPO (10.5) (28.4) (63)%
Strategic items and compensation for senior leavers
(11.8) (6.4) 84%
Statutory profit before tax 138.0 34.0 306%
CHIEF EXECUTIVE’S REVIEW Results overview 2015 has been a very successful year for Virgin Money and we are delighted that we continue to deliver strongly against our objectives. Despite pressure on returns from the sustained low interest rate environment, we increased our underlying profit by 53 per cent to £160.3 million. On a statutory basis, we delivered a profit before tax of £138.0 million, compared to £34.0 million in 2014. On an underlying basis, our total income grew by 19 per cent to £523.1 million, driven mainly by strong growth in our lending and a 15 basis point increase in our net interest margin to 1.65 per cent. Our total costs increased by only 5 per cent to £332.5 million. During the year, the cost of risk was 12 basis points and the total impairment charge increase to £30.3 million, from £15.8 million in 2014, reflected growth in customer balances. Our underlying return on tangible equity improved from 7.4 per cent to 10.9 per cent. We continue to manage our balance sheet within our prudent risk appetite with a view to maintaining its quality and efficiency. At the end of the year, our Common Equity Tier 1 (CET1) ratio was 17.5 per cent, our total capital ratio was 20.2 per cent, and our leverage ratio was 4.0 per cent. Our Liquidity Coverage Ratio was 202 per cent and loan–to–deposit ratio was 107.5 per cent at 31 December 2015. DELIVERING GROWTH Mortgages The UK mortgage market was very competitive in 2015, with total lending of just over £220 billion, marginally higher than the market had anticipated. We delivered strong gross mortgage lending of £7.5 billion, 29 per cent higher than in 2014. Over the year we achieved 16 per cent growth in mortgage balances to £25.5 billion. This represented a market share of mortgage stock of 2.0 per cent. Our growth of 16 per cent in mortgage balances during the year significantly exceeded market growth of 1.8 per cent.
We increased our proportion of loans to first–time buyers during the year to 14 per cent of our gross residential mortgage lending. We also continue to support the Government‟s Help to Buy Guarantee and Equity Loan schemes and completed more than 4,000 of these loans during the year. Our mortgage business remains high–quality and is comprised of 83 per cent residential and 17 per cent buy–to–let mortgages. The average loan–to–value of new mortgage lending was 68.0 per cent in 2015. Impairments in our mortgage business increased slightly during the course of the year as a result of portfolio growth. This was partially offset by strong arrears performance, with loans over three months in arrears at 0.22 per cent, significantly below the latest CML industry average of 1.12 per cent. Buy–to–let continues to support the demand for private rented accommodation and our buy–to–let lending is high–quality. The average loan–to–value of stock was 55.4 per cent at 31 December 2015, and our affordability and rental cover requirements are among the most prudent in the sector. As such, we do not expect the new tax regulations for buy–to–let landlords, including the new additional 3 per cent stamp duty announced in the Autumn Statement, to have a material impact on our business. We were delighted to win the „Best Service from a Buy–to–Let Lender‟ award at the 2015 Business Moneyfacts Awards. We have a thriving intermediary business and continued to invest in improving the service we provide to our Intermediary Partners. The launch of our refreshed intermediary proposition, which reinforces our commitment to offering excellent service to our Intermediary Partners, was well received and resulted in a significant improvement in our Intermediary Net Promoter Score (NPS), from +25 in 2014, to +40 in 2015. The quality of our intermediary service was recognised by winning the prestigious „Best Lender for Partnership‟, at the Legal & General Mortgage Club Awards. We are pleased with the ongoing strength of the mortgage business, having achieved a market share of gross mortgage lending of 3.4 per cent in 2015. We will continue to build on this strong foundation and target a market share of more than 3.0 per cent in the future. Credit cards During the year we made significant strides with our credit card business, including successfully migrating over 675,000 customer accounts from MBNA to our own platform. We developed the platform in partnership with leading systems provider TSYS which gives us full control of our credit card operation. Improving consumer confidence in the UK has seen a general upward trend in demand for unsecured borrowing, and new business volumes since launching our new range of cards in April have been better than expected. Credit card balances increased to £1.6 billion at 31 December 2015, 44 per cent higher than at the end of 2014 and representing a 2.5 per cent share of the £65 billion market. Growing credit card balances will enable us to achieve a more efficient use of our capital. The financial performance of the card business has been strong at both a new business and portfolio level. The overall contribution was £51.2 million at 31 December, 13 per cent higher than 2014. The FCA published their interim findings from their market study into credit cards in November 2015, noting that competition is working fairly well for most consumers. The final report is expected to be published in spring 2016. If changes are required by the FCA, our platform and capability give us confidence that we will be able to comply with limited economic impact. We are excited about the future of our credit card business. In 2014 we announced that we aimed to grow credit card balances to at least £3 billion by the end of 2018. We now aim to reach that target a year earlier by the end of 2017. Deposits The UK savings market has continued to grow strongly, helped by a positive economic backdrop and supportive government policy, including the increases to ISA limits and the introduction of the new Help to Buy ISA. During 2015, our deposits franchise continued to flourish and our funding position is strong. Deposit balances grew by 12 per cent to £25.1 billion in 2015, a market share of 1.5 per cent. Deposit balances are now higher than at any point in our history. We offer customers a range of competitively–priced instant access and fixed term savings products, both available as ISAs, through all our channels: store, online, digital, postal and telephone. Our online–led
distribution model, supported by our efficient national store footprint, continues to be a key factor in growing our retail deposit business cost effectively. We continue to support customers‟ home ownership aspirations and as such we launched our Help to Buy ISA on 1 December 2015. The Help to Buy ISA is a way for first time buyers to save tax efficiently and receive government assistance towards their first home deposit. Access to wholesale funding to support growth Our funding strategy is to access wholesale funding to supplement our core retail deposit base in order to optimise funding costs, extend tenor and ensure we have appropriate diversification in the funding base. In April 2015, we issued £300 million of senior unsecured debt, our debut issuance under our Medium Term Note (MTN) programme. In addition, we have an established Residential Mortgage Backed Securities (RMBS) programme with a strong reputation, from which we raised a further £750 million in June 2015. In January 2016, Gosforth 2016–1 raised a further £803 million of funding across three tranches denominated in Sterling, Euros and U.S. Dollars. This was the first time a Gosforth RMBS had raised funding in U.S. Dollars, in addition to its presence in the Sterling and Euro markets, and we were delighted with the response from investors. We also accessed the Funding for Lending scheme to support lending growth and liquidity. As we develop our wholesale funding programmes, our mix of wholesale may rise but will remain relatively low as a proportion of overall funding. We have amended our risk appetite to accommodate a loan–to–deposit ratio of up to 115 per cent, from 110 per cent, as a result of our successful participation in the wholesale markets. Our loan–to–deposit ratio was 107.5 per cent at 31 December 2015. Increased wholesale funding and careful management of our retail deposit book reduced our weighted average cost of funds to 1.43 per cent in 2015 from 1.69 per cent in 2014. Current Account, Insurance and Investments The Virgin Essential Current Account (ECA) is now available across our network of 75 Stores, following the full national roll–out which completed in March 2015. Our potential to grow profitably at scale in current accounts is currently limited by the structure of the UK current account market, including the low level of switching and the predominance of free–if–in credit banking. We launched our new simple life insurance product in partnership with Friends Life in March and we continue to develop our general insurance proposition with Ageas to complement our successful travel insurance range. We launched three new investment funds during the year, increasing the number of passively managed funds in our range to five. The new funds provide our customers with more choice and will support growth in our funds under management. Our funds under management stood at £3.0 billion at 31 December 2015, helping to drive a 9 per cent increase in investment income. The launch of these insurance and investment products creates the foundation from which to grow our non–interest income. Maintaining a High–Quality Balance Sheet In 2015, we continued to manage our balance sheet within our prudent risk appetite with a view to maintaining its quality and efficiency. Our Common Equity Tier 1 ratio was 17.5 per cent at the end of 2015. Our total capital ratio was 20.2 per cent and our leverage ratio was 4.0 per cent at 31 December 2015. Our liquidity position remains strong and we remain confident, though not complacent, that our liquidity policy enables us to achieve an appropriate balance between profitability and liquidity risk. In October 2015 the Liquidity Coverage Ratio (LCR) was introduced by the PRA as the Pillar 1 standard for liquidity in the UK. Our LCR was significantly above the regulatory minimum at 202 per cent, reflecting our focus on ensuring high quality liquidity positions. In November 2015, the rating agency Fitch revised Virgin Money plc‟s outlook to Positive from Stable and affirmed our long–term rating at BBB+. Fitch noted this reflected a well–managed low risk profile, which has resulted in healthy asset quality and improving profitability. Strong Financial Performance
Our underlying return on tangible equity strengthened from 7.4 per cent to 10.9 per cent as a result of the successful delivery of our business plan for 2015. Key contributors to this improvement were strong growth in lending and an improvement in our net interest margin, enabling us to grow income during the year by 19 per cent. We continue to deliver on our cost efficiency targets. Underlying cost growth during the year was limited to 5 per cent, and we improved our cost:income ratio to 63.6 per cent in 2015 from 72.5 per cent in 2014. We will continue to take advantage of our operational leverage and drive efficiency in the business. We are well positioned to achieve a cost:income ratio of 50 per cent as planned in 2017. Colleagues We were delighted with the results from our Colleague Engagement Survey for 2015. The results indicate that our culture, underpinned by our ambition to make „everyone better off‟ (EBO), our philosophy and approach have the full backing of our colleagues. Engagement scores compared strongly against industry standards at 88 per cent, with 92 per cent of colleagues fully supporting our values and 86 per cent believing strongly in Virgin Money‟s goals and objectives. Our EBO culture sustains a virtuous circle based on a commitment to the communities in which we work and raises awareness of the Virgin Money brand and business as a force for good. Our culture cannot be readily and credibly replicated in the UK banking sector and it provides the foundation for our strategy and differentiated approach to banking. Customers We offer our customers straightforward products, supported by the delivery of outstanding customer service, through all forms of distribution channels including online, mobile, intermediary, store, telephone and also through our Virgin Money Lounges. During the year our approach was rewarded and we now have over 3 million customers and a year–on–year improvement in customer satisfaction ratings. Our overall NPS, which is the measure of customer service and the likelihood of customers recommending us, improved in the year from +14 to +19, maintaining our position as one of the leading UK retail banks for customer service. Investment in the digital channel in 2015 has continued to develop both functionality and content to enhance our customer experience. Customers are increasingly accessing our products and services online through mobile devices, with almost 40 per cent of website visits in 2015 made in this way, up from 29 per cent in 2014. In August 2015, we opened our sixth Virgin Money Lounge in Haymarket, London. The Lounges delivered an NPS of +86 and are a strong commercial success. As a result, we will open a new customer Lounge in Sheffield in 2016. Management team To support continued growth in the business and the planned expansion of product lines, we have strengthened the Executive further. We are delighted that Peter Bole will be joining us as Chief Financial Officer in 2017, and Hugh Chater will join the business by June 2016, as Chief Commercial Officer. George Ashworth has joined the business as Managing Director, SME, to lead the development and strategy for Virgin Money in small and medium–sized enterprise (SME) banking. Harnessing the talents of women in financial services In July 2015, the government asked me to lead the review into the representation of women in senior managerial roles in the financial services industry. This followed concerns that, whilst equal numbers of men and women are entering the financial services sector, it appears that many women do not progress from middle to senior management. Businesses perform better when they include the best people from a range of backgrounds and many employers are already taking steps to increase diversity, including gender diversity. My preliminary recommendations proposed that firms appoint an Executive responsible for gender diversity and report publicly on their progress. Also, organisations should link Executive bonuses to the appointment of senior women. Final findings are due to be published in March 2016.
Outlook The macro environment has changed materially for banks like Virgin Money over the past 12 months. In particular, the year has seen the introduction of a new bank tax surcharge, the timetable for UK rate rises continues to be pushed back and we have seen regulatory concerns in the buy–to–let mortgage market. In addition, there are the emerging capital regulations from Europe. This has resulted in uncertainty relating to the potential for continued growth and profitability for banks of our scale in the sector. We think very carefully about our operating environment to ensure the business is able to continue delivering sustainable success for all stakeholders. The tax rate for UK banks will rise by 8 percentage points to 28 per cent in 2016, as a result of the bank tax surcharge announced in the 2015 Summer Budget. We understand that in taking this action HM Treasury has started to level the playing field on the taxation of banks. Nevertheless, there is still much to be done to level the playing field overall. The CMA has a significant opportunity to intervene in the personal current account market, as part of their investigation into the current account and business banking sectors. This would open UK retail banking up to improved competition and it would go a long way to levelling the playing field in a way that would underpin strong competition and ensure that customers are better served in the future. In 2015, we anticipated two increases to the official Bank Rate. However, interest rates remained at their historical low. Our results demonstrate that we have the flexibility to deliver on our targeted return levels, despite the lower for longer interest rate environment. As a result of the benign interest rate environment, which provides supportive credit conditions, and our highly robust underwriting standards, we expect our high asset quality to be maintained in 2016. When the Bank Rate does begin to rise, subsequent increases are expected to be gradual and limited. In the mortgage market, the continuation of positive domestic economic factors and competitive mortgage deals all helped to underpin demand. We were able to take a strong share of the market, protect spreads and maintain asset quality. In addition, we also demonstrated our ability to grow our credit card book strongly. During the year, our weighted average cost of funds reduced against a background of falling deposit interest rates across the market, which broadly offset pressure on mortgage margins. All of these things together, including signs of mortgage pricing stabilising in 2016, mean that we have confidence in growing assets at the right price, supported by high asset quality and low impairments, and funding that growth in a cost efficient way. This will support our earnings and therefore our capital position for the future. Given our successful participation in the wholesale markets, we have amended our risk appetite to accommodate a loan–to–deposit ratio of up to 115 per cent. This will support our aim of increasing balance sheet efficiency and funding diversification. We are very clear on the concerns raised by policymakers regarding the buy–to–let market. We are also very aware of the risks posed should the market become overheated, and the associated economic and political risks. The lack of housing supply in the UK supports the demand for private rented accommodation and a material number of people are going to want to rent for the foreseeable future. We have built our participation in the buy–to–let market with that in mind. We focus on buy–to–let for retail customers, rather than portfolio landlords, and our affordability and rental cover requirements are among the most prudent in the sector. We review our capital structure on an ongoing basis to ensure it is well placed to react to prevailing economic and regulatory conditions. We are delighted with our strong capital position and excellent asset quality, as the UK and European regulatory frameworks continue to evolve. As a result of the confidence we have in our strong capital position we believe that it is right, despite uncertainty in the macro environment, to pay a dividend. Given our capital position, even following the payment of dividends, our outlook for capital remains strong. The UK will hold a referendum on its continued membership of the EU on 23 June 2016. The potential for Brexit will weigh on the prospects of the UK economy and there could be a lengthy period of elevated uncertainty should there be a vote in favour of an exit. As a result of the strength of the business and our continued ability to manage our cost base, we are well placed to hit our targeted returns. We are able to absorb the impact of the new bank tax surcharge and are well placed to achieve a mid–teens return on tangible equity by the end of 2017.
In addition to our core business, we have new opportunities in SME, Personal Current Accounts (PCA) and unsecured lending to continue to grow. The SME market is underserved by the large incumbent banks and we continue to develop our strategy accordingly. We are also conducting a PCA feasibility study with a view to defining our entry into the broader PCA market. To conclude, we are delighted that we have delivered strongly against our objectives in 2015. I would like to extend my thanks to our Virgin Money Colleagues for their hard work and achievements over the year, and to our customers, corporate partners and shareholders who play such an important part in our success. We will continue to put customers at the heart of everything we do and look to the future with confidence. Jayne–Anne Gadhia CBE Chief Executive 1 March 2016
CHIEF FINANCIAL OFFICER’S OVERVIEW OF PERFORMANCE
Virgin Money is a simple business where the performance is driven by:
Growth – our ability to add both assets and liabilities at high quality while maintaining margin development;
Operational leverage – our platform of systems, people and processes can scale business volumes without parallel scaling of costs, and
Quality – controlled via rigorous underwriting, supporting capital management and a low cost of risk.
Despite the external headwinds from the flat base rate environment and market pressures on mortgage margins, the business was able to deliver against all these driving factors – with strong balance sheet growth and net interest margin improvements, continued cost management and controlled development of the cost of risk. This allowed us to deliver an increase in underlying profit before tax of 53 per cent compared to 2014, rising by £55.5 million to £160.3 million. As a consequence, return on tangible equity improved to 10.9 per cent from 7.4 per cent. Strong balance sheet growth
At 31 Dec 2015 At 31 Dec 2014 Change
£m £m
Funding and liquidity Loans and advances to customers 27,109.0 23,093.1 17%
Funded assets¹ 27,885.1 24,181.9 15%
Customer deposits 25,144.9 22,365.7 12%
Wholesale funding 3,314.3 2,429.4 36%
Wholesale funding <1 year maturity 1,274.9 835.3 53%
Loan to deposit ratio 107.5% 102.8% 4.7pp
High Quality Liquid Assets² 4,238.6 4,235.9 – ¹ Loans and advances to customers and banks, encumbered available–for–sale assets and encumbered cash and balances with central banks. ² Level 1 + 2a + 2b. See Risk Management Report page 197 for definition. These include Funding for Lending drawings which are held off balance sheet but are available for repo and hence count towards liquidity resources.
During the year, we grew customer deposit balances by 12 per cent or £2.8 billion, well in excess of market growth of 7 per cent. Similarly, mortgage balances grew by 16 per cent to £25.5 billion, significantly ahead of market growth of 1.8 per cent, and our cards book increased by 44 per cent to £1.6 billion. We have a strong and increasingly diversified funding base. Residential Mortgage Backed Security (RMBS) notes in issue increased by £147.8 million to £1,741.9 million during 2015. This was as a result
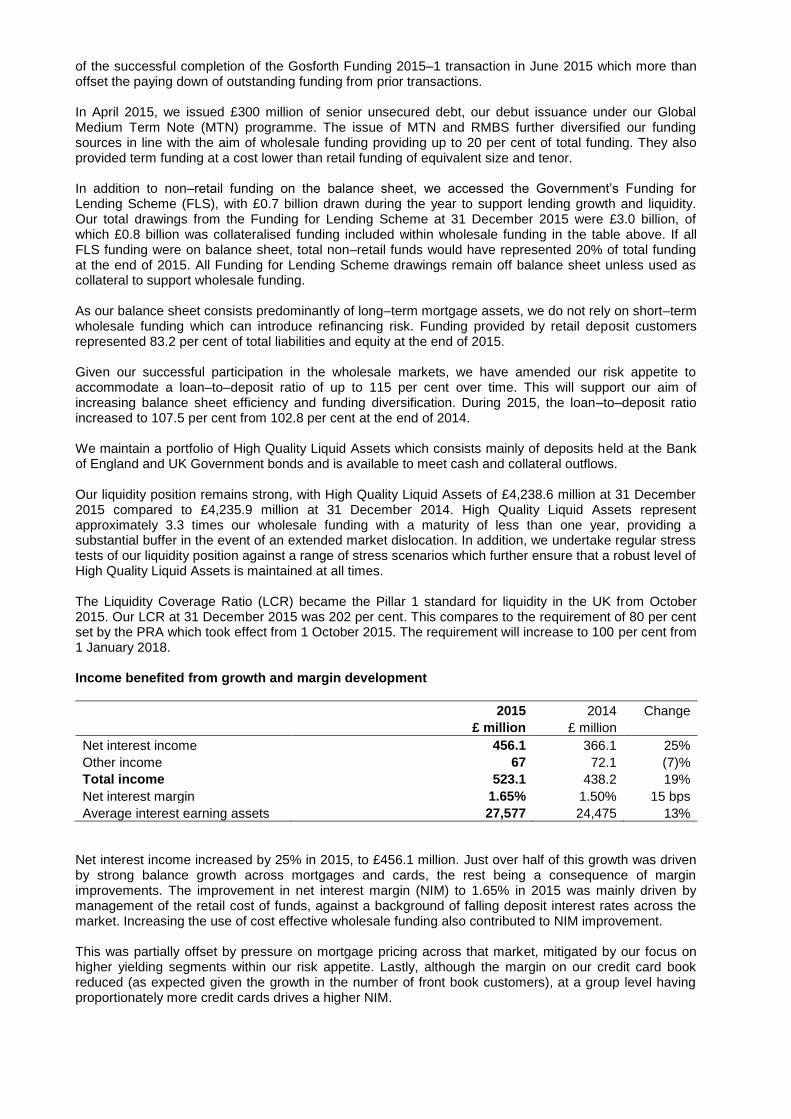
of the successful completion of the Gosforth Funding 2015–1 transaction in June 2015 which more than offset the paying down of outstanding funding from prior transactions. In April 2015, we issued £300 million of senior unsecured debt, our debut issuance under our Global Medium Term Note (MTN) programme. The issue of MTN and RMBS further diversified our funding sources in line with the aim of wholesale funding providing up to 20 per cent of total funding. They also provided term funding at a cost lower than retail funding of equivalent size and tenor. In addition to non–retail funding on the balance sheet, we accessed the Government‟s Funding for Lending Scheme (FLS), with £0.7 billion drawn during the year to support lending growth and liquidity. Our total drawings from the Funding for Lending Scheme at 31 December 2015 were £3.0 billion, of which £0.8 billion was collateralised funding included within wholesale funding in the table above. If all FLS funding were on balance sheet, total non–retail funds would have represented 20% of total funding at the end of 2015. All Funding for Lending Scheme drawings remain off balance sheet unless used as collateral to support wholesale funding. As our balance sheet consists predominantly of long–term mortgage assets, we do not rely on short–term wholesale funding which can introduce refinancing risk. Funding provided by retail deposit customers represented 83.2 per cent of total liabilities and equity at the end of 2015. Given our successful participation in the wholesale markets, we have amended our risk appetite to accommodate a loan–to–deposit ratio of up to 115 per cent over time. This will support our aim of increasing balance sheet efficiency and funding diversification. During 2015, the loan–to–deposit ratio increased to 107.5 per cent from 102.8 per cent at the end of 2014. We maintain a portfolio of High Quality Liquid Assets which consists mainly of deposits held at the Bank of England and UK Government bonds and is available to meet cash and collateral outflows. Our liquidity position remains strong, with High Quality Liquid Assets of £4,238.6 million at 31 December 2015 compared to £4,235.9 million at 31 December 2014. High Quality Liquid Assets represent approximately 3.3 times our wholesale funding with a maturity of less than one year, providing a substantial buffer in the event of an extended market dislocation. In addition, we undertake regular stress tests of our liquidity position against a range of stress scenarios which further ensure that a robust level of High Quality Liquid Assets is maintained at all times. The Liquidity Coverage Ratio (LCR) became the Pillar 1 standard for liquidity in the UK from October 2015. Our LCR at 31 December 2015 was 202 per cent. This compares to the requirement of 80 per cent set by the PRA which took effect from 1 October 2015. The requirement will increase to 100 per cent from 1 January 2018. Income benefited from growth and margin development
2015 2014 Change
£ million £ million
Net interest income 456.1 366.1 25%
Other income 67 72.1 (7)%
Total income 523.1 438.2 19%
Net interest margin 1.65% 1.50% 15 bps
Average interest earning assets 27,577 24,475 13%
Net interest income increased by 25% in 2015, to £456.1 million. Just over half of this growth was driven by strong balance growth across mortgages and cards, the rest being a consequence of margin improvements. The improvement in net interest margin (NIM) to 1.65% in 2015 was mainly driven by management of the retail cost of funds, against a background of falling deposit interest rates across the market. Increasing the use of cost effective wholesale funding also contributed to NIM improvement. This was partially offset by pressure on mortgage pricing across that market, mitigated by our focus on higher yielding segments within our risk appetite. Lastly, although the margin on our credit card book reduced (as expected given the growth in the number of front book customers), at a group level having proportionately more credit cards drives a higher NIM.
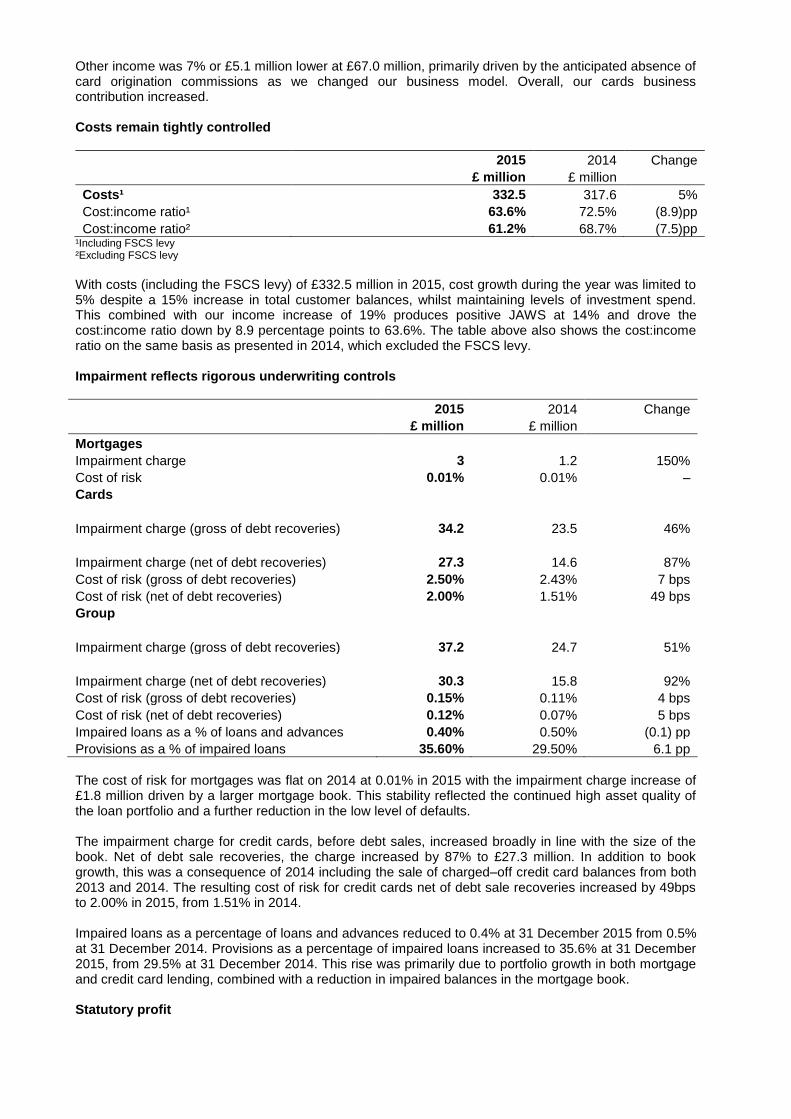
Other income was 7% or £5.1 million lower at £67.0 million, primarily driven by the anticipated absence of card origination commissions as we changed our business model. Overall, our cards business contribution increased. Costs remain tightly controlled
2015 2014 Change
£ million £ million
Costs¹ 332.5 317.6 5%
Cost:income ratio¹ 63.6% 72.5% (8.9)pp
Cost:income ratio² 61.2% 68.7% (7.5)pp ¹Including FSCS levy ²Excluding FSCS levy
With costs (including the FSCS levy) of £332.5 million in 2015, cost growth during the year was limited to 5% despite a 15% increase in total customer balances, whilst maintaining levels of investment spend. This combined with our income increase of 19% produces positive JAWS at 14% and drove the cost:income ratio down by 8.9 percentage points to 63.6%. The table above also shows the cost:income ratio on the same basis as presented in 2014, which excluded the FSCS levy. Impairment reflects rigorous underwriting controls
2015 2014 Change
£ million £ million
Mortgages Impairment charge 3 1.2 150%
Cost of risk 0.01% 0.01% –
Cards
Impairment charge (gross of debt recoveries) 34.2 23.5 46%
Impairment charge (net of debt recoveries) 27.3 14.6 87%
Cost of risk (gross of debt recoveries) 2.50% 2.43% 7 bps
Cost of risk (net of debt recoveries) 2.00% 1.51% 49 bps
Group
Impairment charge (gross of debt recoveries) 37.2 24.7 51%
Impairment charge (net of debt recoveries) 30.3 15.8 92%
Cost of risk (gross of debt recoveries) 0.15% 0.11% 4 bps
Cost of risk (net of debt recoveries) 0.12% 0.07% 5 bps
Impaired loans as a % of loans and advances 0.40% 0.50% (0.1) pp
Provisions as a % of impaired loans 35.60% 29.50% 6.1 pp
The cost of risk for mortgages was flat on 2014 at 0.01% in 2015 with the impairment charge increase of £1.8 million driven by a larger mortgage book. This stability reflected the continued high asset quality of the loan portfolio and a further reduction in the low level of defaults. The impairment charge for credit cards, before debt sales, increased broadly in line with the size of the book. Net of debt sale recoveries, the charge increased by 87% to £27.3 million. In addition to book growth, this was a consequence of 2014 including the sale of charged–off credit card balances from both 2013 and 2014. The resulting cost of risk for credit cards net of debt sale recoveries increased by 49bps to 2.00% in 2015, from 1.51% in 2014. Impaired loans as a percentage of loans and advances reduced to 0.4% at 31 December 2015 from 0.5% at 31 December 2014. Provisions as a percentage of impaired loans increased to 35.6% at 31 December 2015, from 29.5% at 31 December 2014. This rise was primarily due to portfolio growth in both mortgage and credit card lending, combined with a reduction in impaired balances in the mortgage book. Statutory profit
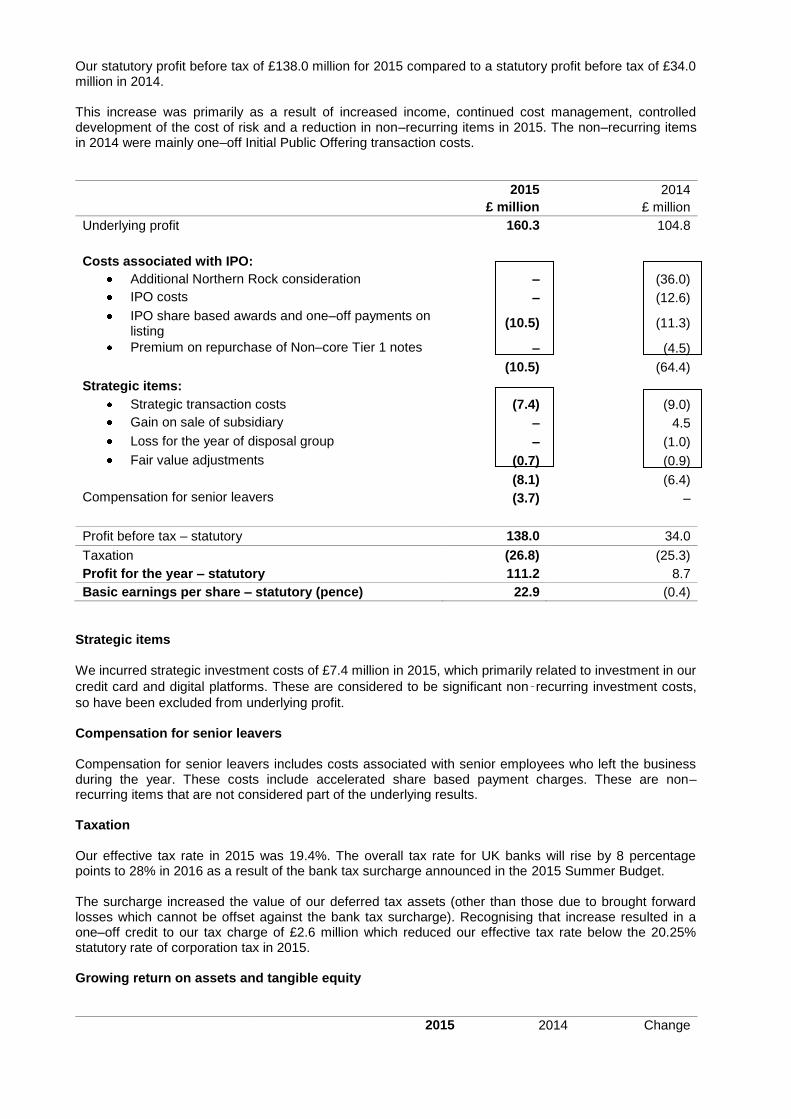
Our statutory profit before tax of £138.0 million for 2015 compared to a statutory profit before tax of £34.0 million in 2014. This increase was primarily as a result of increased income, continued cost management, controlled development of the cost of risk and a reduction in non–recurring items in 2015. The non–recurring items in 2014 were mainly one–off Initial Public Offering transaction costs.
2015 2014
£ million £ million
Underlying profit 160.3 104.8
Costs associated with IPO:
Additional Northern Rock consideration – (36.0)
IPO costs – (12.6)
IPO share based awards and one–off payments on listing
(10.5) (11.3)
Premium on repurchase of Non–core Tier 1 notes – (4.5)
(10.5) (64.4)
Strategic items:
Strategic transaction costs (7.4) (9.0)
Gain on sale of subsidiary – 4.5
Loss for the year of disposal group – (1.0)
Fair value adjustments (0.7) (0.9)
(8.1) (6.4)
Compensation for senior leavers (3.7) –
Profit before tax – statutory 138.0 34.0
Taxation (26.8) (25.3)
Profit for the year – statutory 111.2 8.7
Basic earnings per share – statutory (pence) 22.9 (0.4)
Strategic items We incurred strategic investment costs of £7.4 million in 2015, which primarily related to investment in our
credit card and digital platforms. These are considered to be significant non‑recurring investment costs,
so have been excluded from underlying profit. Compensation for senior leavers Compensation for senior leavers includes costs associated with senior employees who left the business during the year. These costs include accelerated share based payment charges. These are non–recurring items that are not considered part of the underlying results. Taxation Our effective tax rate in 2015 was 19.4%. The overall tax rate for UK banks will rise by 8 percentage points to 28% in 2016 as a result of the bank tax surcharge announced in the 2015 Summer Budget. The surcharge increased the value of our deferred tax assets (other than those due to brought forward losses which cannot be offset against the bank tax surcharge). Recognising that increase resulted in a one–off credit to our tax charge of £2.6 million which reduced our effective tax rate below the 20.25% statutory rate of corporation tax in 2015. Growing return on assets and tangible equity
2015 2014 Change
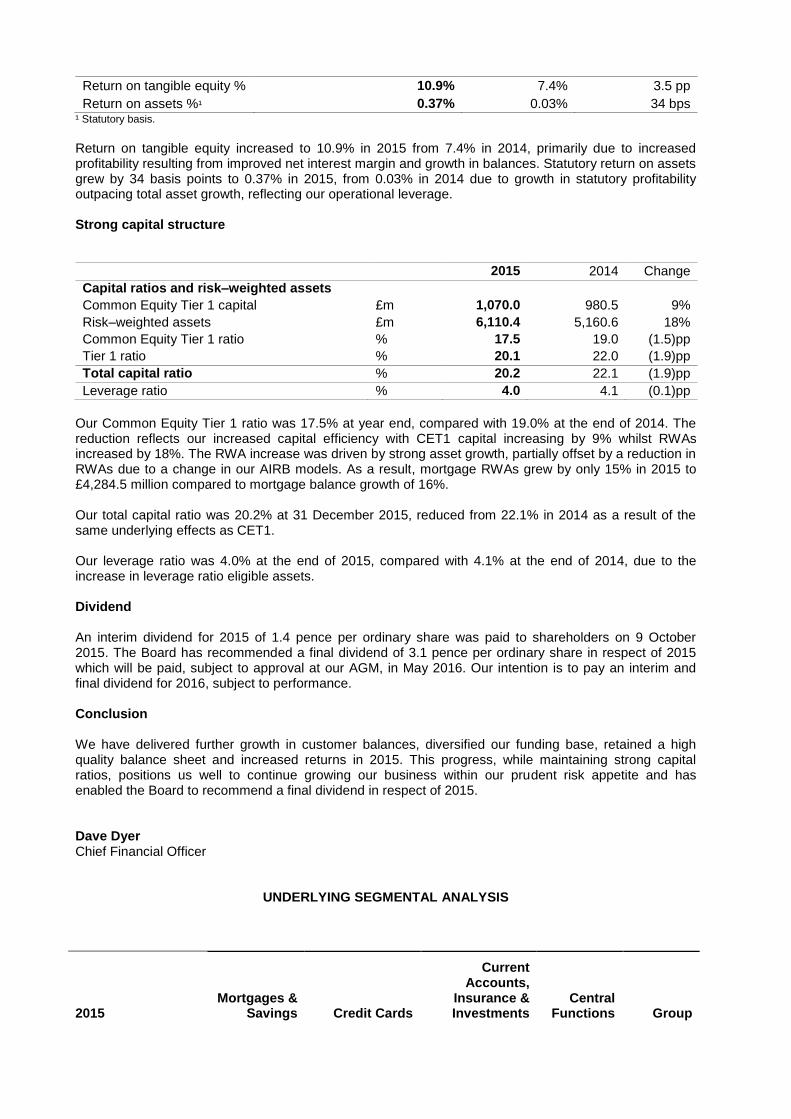
Return on tangible equity % 10.9% 7.4% 3.5 pp
Return on assets %¹ 0.37% 0.03% 34 bps ¹ Statutory basis. Return on tangible equity increased to 10.9% in 2015 from 7.4% in 2014, primarily due to increased profitability resulting from improved net interest margin and growth in balances. Statutory return on assets grew by 34 basis points to 0.37% in 2015, from 0.03% in 2014 due to growth in statutory profitability outpacing total asset growth, reflecting our operational leverage. Strong capital structure 2015 2014 Change
Capital ratios and risk–weighted assets
Common Equity Tier 1 capital £m 1,070.0 980.5 9%
Risk–weighted assets £m 6,110.4 5,160.6 18%
Common Equity Tier 1 ratio % 17.5 19.0 (1.5)pp
Tier 1 ratio % 20.1 22.0 (1.9)pp
Total capital ratio % 20.2 22.1 (1.9)pp
Leverage ratio % 4.0 4.1 (0.1)pp
Our Common Equity Tier 1 ratio was 17.5% at year end, compared with 19.0% at the end of 2014. The reduction reflects our increased capital efficiency with CET1 capital increasing by 9% whilst RWAs increased by 18%. The RWA increase was driven by strong asset growth, partially offset by a reduction in RWAs due to a change in our AIRB models. As a result, mortgage RWAs grew by only 15% in 2015 to £4,284.5 million compared to mortgage balance growth of 16%. Our total capital ratio was 20.2% at 31 December 2015, reduced from 22.1% in 2014 as a result of the same underlying effects as CET1. Our leverage ratio was 4.0% at the end of 2015, compared with 4.1% at the end of 2014, due to the increase in leverage ratio eligible assets. Dividend An interim dividend for 2015 of 1.4 pence per ordinary share was paid to shareholders on 9 October 2015. The Board has recommended a final dividend of 3.1 pence per ordinary share in respect of 2015 which will be paid, subject to approval at our AGM, in May 2016. Our intention is to pay an interim and final dividend for 2016, subject to performance. Conclusion We have delivered further growth in customer balances, diversified our funding base, retained a high quality balance sheet and increased returns in 2015. This progress, while maintaining strong capital ratios, positions us well to continue growing our business within our prudent risk appetite and has enabled the Board to recommend a final dividend in respect of 2015. Dave Dyer Chief Financial Officer
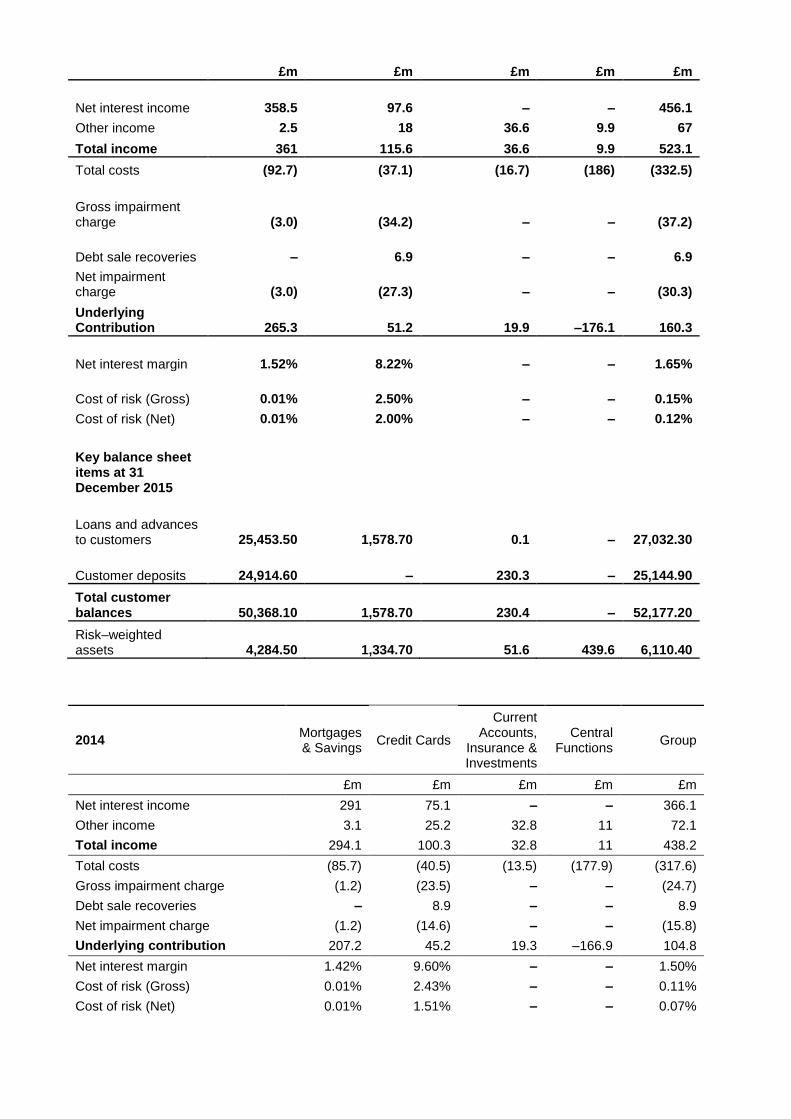
UNDERLYING SEGMENTAL ANALYSIS
2015 Mortgages &
Savings Credit Cards
Current Accounts,
Insurance & Investments
Central Functions Group
£m £m £m £m £m
Net interest income 358.5 97.6 – – 456.1
Other income 2.5 18 36.6 9.9 67
Total income 361 115.6 36.6 9.9 523.1
Total costs (92.7) (37.1) (16.7) (186) (332.5)
Gross impairment charge (3.0) (34.2) – – (37.2)
Debt sale recoveries – 6.9 – – 6.9
Net impairment charge (3.0) (27.3) – – (30.3)
Underlying Contribution 265.3 51.2 19.9 –176.1 160.3
Net interest margin 1.52% 8.22% – – 1.65%
Cost of risk (Gross) 0.01% 2.50% – – 0.15%
Cost of risk (Net) 0.01% 2.00% – – 0.12%
Key balance sheet items at 31 December 2015
Loans and advances to customers 25,453.50 1,578.70 0.1 – 27,032.30
Customer deposits 24,914.60 – 230.3 – 25,144.90
Total customer balances 50,368.10 1,578.70 230.4 – 52,177.20
Risk–weighted assets 4,284.50 1,334.70 51.6 439.6 6,110.40
2014 Mortgages & Savings
Credit Cards
Current Accounts,
Insurance & Investments
Central Functions
Group
£m £m £m £m £m
Net interest income 291 75.1 – – 366.1
Other income 3.1 25.2 32.8 11 72.1
Total income 294.1 100.3 32.8 11 438.2
Total costs (85.7) (40.5) (13.5) (177.9) (317.6)
Gross impairment charge (1.2) (23.5) – – (24.7)
Debt sale recoveries – 8.9 – – 8.9
Net impairment charge (1.2) (14.6) – – (15.8)
Underlying contribution 207.2 45.2 19.3 –166.9 104.8
Net interest margin 1.42% 9.60% – – 1.50%
Cost of risk (Gross) 0.01% 2.43% – – 0.11%
Cost of risk (Net) 0.01% 1.51% – – 0.07%
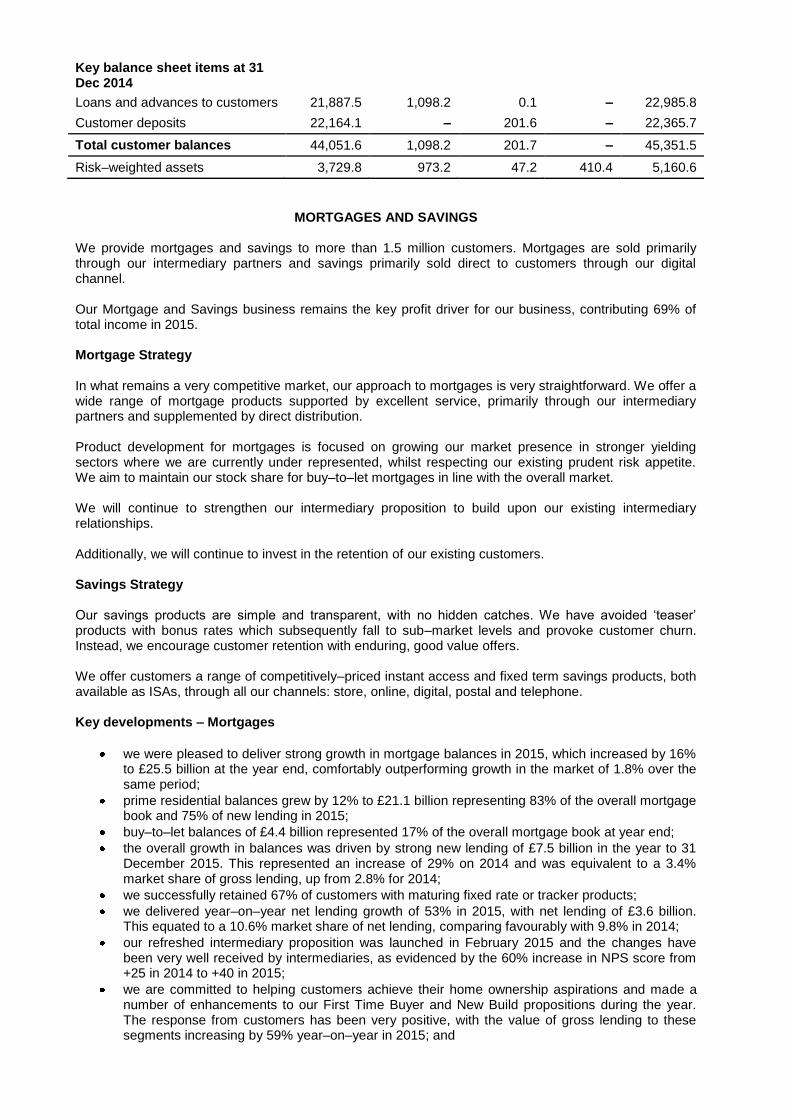
Key balance sheet items at 31 Dec 2014
Loans and advances to customers 21,887.5 1,098.2 0.1 – 22,985.8
Customer deposits 22,164.1 – 201.6 – 22,365.7
Total customer balances 44,051.6 1,098.2 201.7 – 45,351.5
Risk–weighted assets 3,729.8 973.2 47.2 410.4 5,160.6
MORTGAGES AND SAVINGS We provide mortgages and savings to more than 1.5 million customers. Mortgages are sold primarily through our intermediary partners and savings primarily sold direct to customers through our digital channel. Our Mortgage and Savings business remains the key profit driver for our business, contributing 69% of total income in 2015. Mortgage Strategy In what remains a very competitive market, our approach to mortgages is very straightforward. We offer a wide range of mortgage products supported by excellent service, primarily through our intermediary partners and supplemented by direct distribution. Product development for mortgages is focused on growing our market presence in stronger yielding sectors where we are currently under represented, whilst respecting our existing prudent risk appetite. We aim to maintain our stock share for buy–to–let mortgages in line with the overall market. We will continue to strengthen our intermediary proposition to build upon our existing intermediary relationships. Additionally, we will continue to invest in the retention of our existing customers. Savings Strategy Our savings products are simple and transparent, with no hidden catches. We have avoided „teaser‟ products with bonus rates which subsequently fall to sub–market levels and provoke customer churn. Instead, we encourage customer retention with enduring, good value offers. We offer customers a range of competitively–priced instant access and fixed term savings products, both available as ISAs, through all our channels: store, online, digital, postal and telephone. Key developments – Mortgages
we were pleased to deliver strong growth in mortgage balances in 2015, which increased by 16% to £25.5 billion at the year end, comfortably outperforming growth in the market of 1.8% over the same period;
prime residential balances grew by 12% to £21.1 billion representing 83% of the overall mortgage book and 75% of new lending in 2015;
buy–to–let balances of £4.4 billion represented 17% of the overall mortgage book at year end;
the overall growth in balances was driven by strong new lending of £7.5 billion in the year to 31 December 2015. This represented an increase of 29% on 2014 and was equivalent to a 3.4% market share of gross lending, up from 2.8% for 2014;
we successfully retained 67% of customers with maturing fixed rate or tracker products;
we delivered year–on–year net lending growth of 53% in 2015, with net lending of £3.6 billion. This equated to a 10.6% market share of net lending, comparing favourably with 9.8% in 2014;
our refreshed intermediary proposition was launched in February 2015 and the changes have been very well received by intermediaries, as evidenced by the 60% increase in NPS score from +25 in 2014 to +40 in 2015;
we are committed to helping customers achieve their home ownership aspirations and made a number of enhancements to our First Time Buyer and New Build propositions during the year. The response from customers has been very positive, with the value of gross lending to these segments increasing by 59% year–on–year in 2015; and
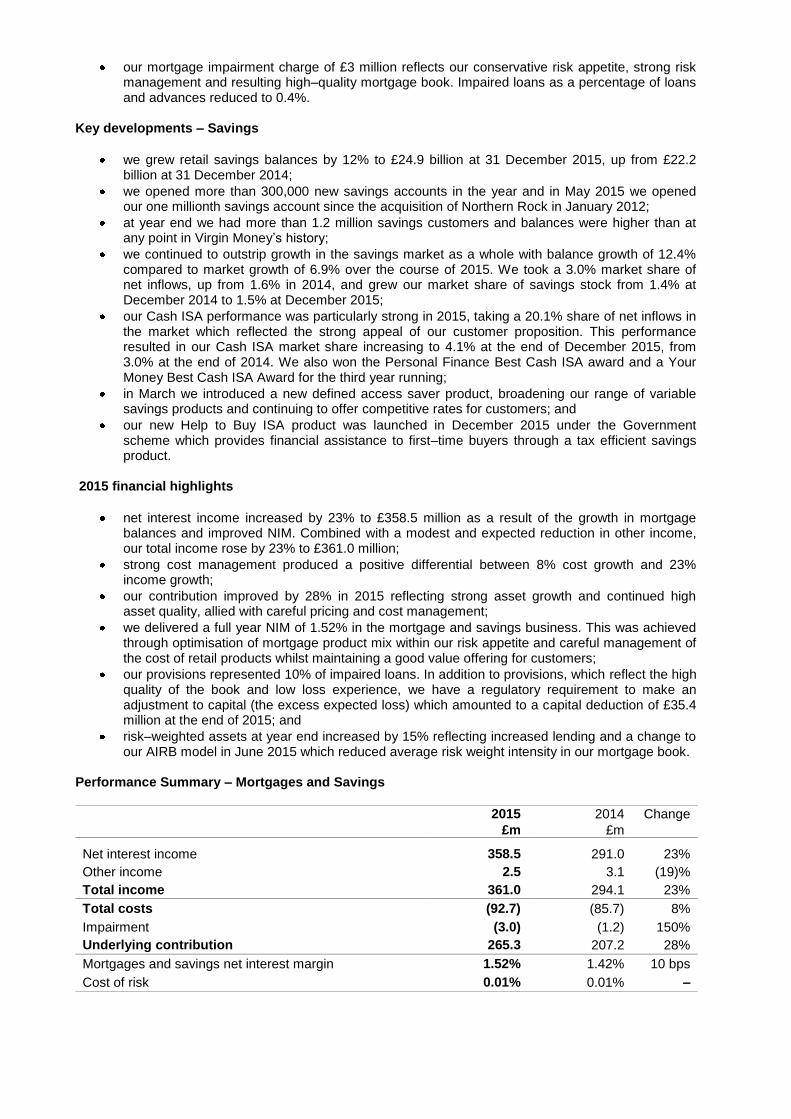
our mortgage impairment charge of £3 million reflects our conservative risk appetite, strong risk management and resulting high–quality mortgage book. Impaired loans as a percentage of loans and advances reduced to 0.4%.
Key developments – Savings
we grew retail savings balances by 12% to £24.9 billion at 31 December 2015, up from £22.2 billion at 31 December 2014;
we opened more than 300,000 new savings accounts in the year and in May 2015 we opened our one millionth savings account since the acquisition of Northern Rock in January 2012;
at year end we had more than 1.2 million savings customers and balances were higher than at any point in Virgin Money‟s history;
we continued to outstrip growth in the savings market as a whole with balance growth of 12.4% compared to market growth of 6.9% over the course of 2015. We took a 3.0% market share of net inflows, up from 1.6% in 2014, and grew our market share of savings stock from 1.4% at December 2014 to 1.5% at December 2015;
our Cash ISA performance was particularly strong in 2015, taking a 20.1% share of net inflows in the market which reflected the strong appeal of our customer proposition. This performance resulted in our Cash ISA market share increasing to 4.1% at the end of December 2015, from 3.0% at the end of 2014. We also won the Personal Finance Best Cash ISA award and a Your Money Best Cash ISA Award for the third year running;
in March we introduced a new defined access saver product, broadening our range of variable savings products and continuing to offer competitive rates for customers; and
our new Help to Buy ISA product was launched in December 2015 under the Government scheme which provides financial assistance to first–time buyers through a tax efficient savings product.
2015 financial highlights
net interest income increased by 23% to £358.5 million as a result of the growth in mortgage balances and improved NIM. Combined with a modest and expected reduction in other income, our total income rose by 23% to £361.0 million;
strong cost management produced a positive differential between 8% cost growth and 23% income growth;
our contribution improved by 28% in 2015 reflecting strong asset growth and continued high asset quality, allied with careful pricing and cost management;
we delivered a full year NIM of 1.52% in the mortgage and savings business. This was achieved through optimisation of mortgage product mix within our risk appetite and careful management of the cost of retail products whilst maintaining a good value offering for customers;
our provisions represented 10% of impaired loans. In addition to provisions, which reflect the high quality of the book and low loss experience, we have a regulatory requirement to make an adjustment to capital (the excess expected loss) which amounted to a capital deduction of £35.4 million at the end of 2015; and
risk–weighted assets at year end increased by 15% reflecting increased lending and a change to our AIRB model in June 2015 which reduced average risk weight intensity in our mortgage book.
Performance Summary – Mortgages and Savings
2015 2014 Change
£m £m
Net interest income 358.5 291.0 23%
Other income 2.5 3.1 (19)%
Total income 361.0 294.1 23%
Total costs (92.7) (85.7) 8%
Impairment (3.0) (1.2) 150%
Underlying contribution 265.3 207.2 28%
Mortgages and savings net interest margin 1.52% 1.42% 10 bps
Cost of risk 0.01% 0.01% –
2015 2014 Change
£m £m
Key balance sheet items at 31 December
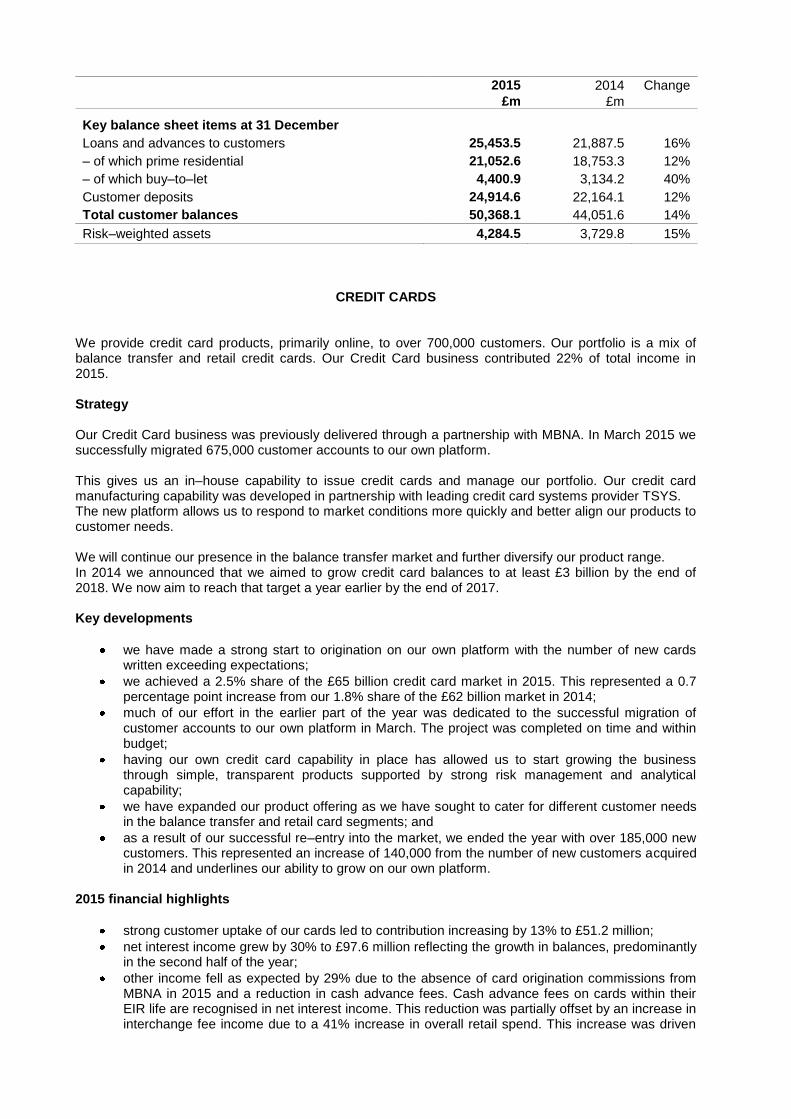
Loans and advances to customers 25,453.5 21,887.5 16%
– of which prime residential 21,052.6 18,753.3 12%
– of which buy–to–let 4,400.9 3,134.2 40%
Customer deposits 24,914.6 22,164.1 12%
Total customer balances 50,368.1 44,051.6 14%
Risk–weighted assets 4,284.5 3,729.8 15%
CREDIT CARDS
We provide credit card products, primarily online, to over 700,000 customers. Our portfolio is a mix of balance transfer and retail credit cards. Our Credit Card business contributed 22% of total income in 2015. Strategy Our Credit Card business was previously delivered through a partnership with MBNA. In March 2015 we successfully migrated 675,000 customer accounts to our own platform. This gives us an in–house capability to issue credit cards and manage our portfolio. Our credit card manufacturing capability was developed in partnership with leading credit card systems provider TSYS. The new platform allows us to respond to market conditions more quickly and better align our products to customer needs. We will continue our presence in the balance transfer market and further diversify our product range. In 2014 we announced that we aimed to grow credit card balances to at least £3 billion by the end of 2018. We now aim to reach that target a year earlier by the end of 2017. Key developments
we have made a strong start to origination on our own platform with the number of new cards written exceeding expectations;
we achieved a 2.5% share of the £65 billion credit card market in 2015. This represented a 0.7 percentage point increase from our 1.8% share of the £62 billion market in 2014;
much of our effort in the earlier part of the year was dedicated to the successful migration of customer accounts to our own platform in March. The project was completed on time and within budget;
having our own credit card capability in place has allowed us to start growing the business through simple, transparent products supported by strong risk management and analytical capability;
we have expanded our product offering as we have sought to cater for different customer needs in the balance transfer and retail card segments; and
as a result of our successful re–entry into the market, we ended the year with over 185,000 new customers. This represented an increase of 140,000 from the number of new customers acquired in 2014 and underlines our ability to grow on our own platform.
2015 financial highlights
strong customer uptake of our cards led to contribution increasing by 13% to £51.2 million;
net interest income grew by 30% to £97.6 million reflecting the growth in balances, predominantly in the second half of the year;
other income fell as expected by 29% due to the absence of card origination commissions from MBNA in 2015 and a reduction in cash advance fees. Cash advance fees on cards within their EIR life are recognised in net interest income. This reduction was partially offset by an increase in interchange fee income due to a 41% increase in overall retail spend. This increase was driven
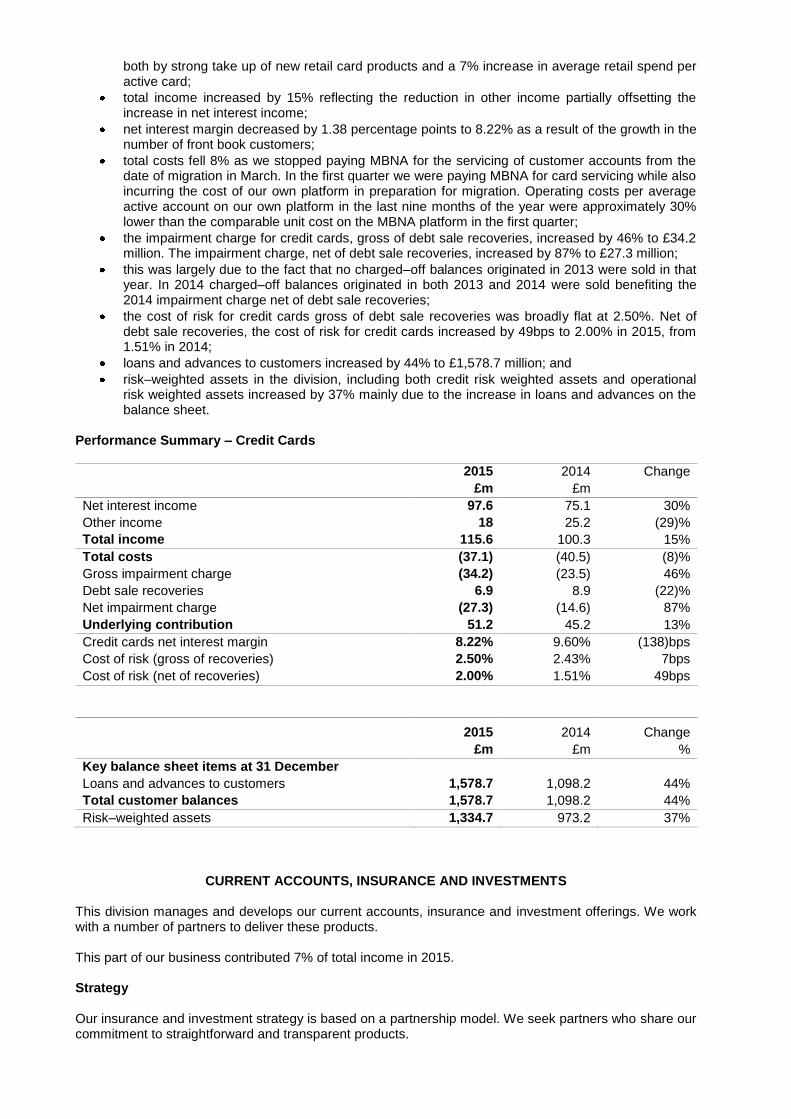
both by strong take up of new retail card products and a 7% increase in average retail spend per active card;
total income increased by 15% reflecting the reduction in other income partially offsetting the increase in net interest income;
net interest margin decreased by 1.38 percentage points to 8.22% as a result of the growth in the number of front book customers;
total costs fell 8% as we stopped paying MBNA for the servicing of customer accounts from the date of migration in March. In the first quarter we were paying MBNA for card servicing while also incurring the cost of our own platform in preparation for migration. Operating costs per average active account on our own platform in the last nine months of the year were approximately 30% lower than the comparable unit cost on the MBNA platform in the first quarter;
the impairment charge for credit cards, gross of debt sale recoveries, increased by 46% to £34.2 million. The impairment charge, net of debt sale recoveries, increased by 87% to £27.3 million;
this was largely due to the fact that no charged–off balances originated in 2013 were sold in that year. In 2014 charged–off balances originated in both 2013 and 2014 were sold benefiting the 2014 impairment charge net of debt sale recoveries;
the cost of risk for credit cards gross of debt sale recoveries was broadly flat at 2.50%. Net of debt sale recoveries, the cost of risk for credit cards increased by 49bps to 2.00% in 2015, from 1.51% in 2014;
loans and advances to customers increased by 44% to £1,578.7 million; and
risk–weighted assets in the division, including both credit risk weighted assets and operational risk weighted assets increased by 37% mainly due to the increase in loans and advances on the balance sheet.
Performance Summary – Credit Cards
2015 2014 Change
£m £m
Net interest income 97.6 75.1 30%
Other income 18 25.2 (29)%
Total income 115.6 100.3 15%
Total costs (37.1) (40.5) (8)%
Gross impairment charge (34.2) (23.5) 46%
Debt sale recoveries 6.9 8.9 (22)%
Net impairment charge (27.3) (14.6) 87%
Underlying contribution 51.2 45.2 13%
Credit cards net interest margin 8.22% 9.60% (138)bps
Cost of risk (gross of recoveries) 2.50% 2.43% 7bps
Cost of risk (net of recoveries) 2.00% 1.51% 49bps
2015 2014 Change
£m £m %
Key balance sheet items at 31 December
Loans and advances to customers 1,578.7 1,098.2 44%
Total customer balances 1,578.7 1,098.2 44%
Risk–weighted assets 1,334.7 973.2 37%
CURRENT ACCOUNTS, INSURANCE AND INVESTMENTS This division manages and develops our current accounts, insurance and investment offerings. We work with a number of partners to deliver these products. This part of our business contributed 7% of total income in 2015. Strategy Our insurance and investment strategy is based on a partnership model. We seek partners who share our commitment to straightforward and transparent products.
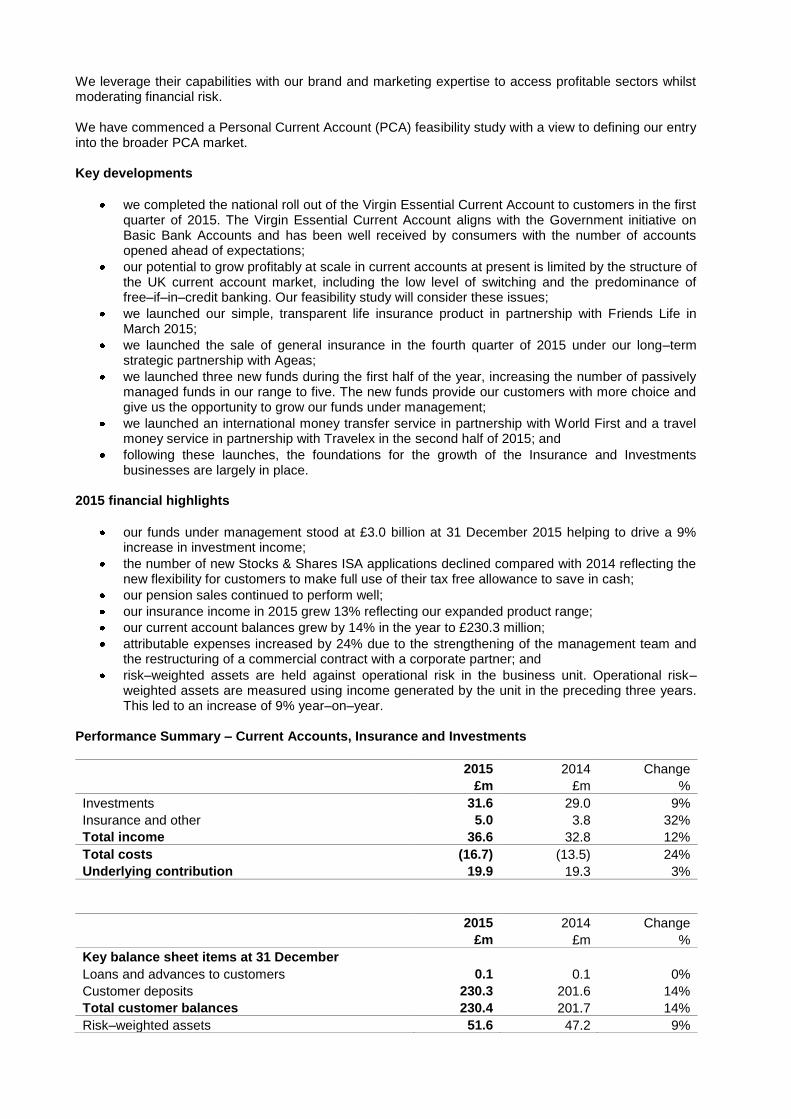
We leverage their capabilities with our brand and marketing expertise to access profitable sectors whilst moderating financial risk. We have commenced a Personal Current Account (PCA) feasibility study with a view to defining our entry into the broader PCA market. Key developments
we completed the national roll out of the Virgin Essential Current Account to customers in the first quarter of 2015. The Virgin Essential Current Account aligns with the Government initiative on Basic Bank Accounts and has been well received by consumers with the number of accounts opened ahead of expectations;
our potential to grow profitably at scale in current accounts at present is limited by the structure of the UK current account market, including the low level of switching and the predominance of free–if–in–credit banking. Our feasibility study will consider these issues;
we launched our simple, transparent life insurance product in partnership with Friends Life in March 2015;
we launched the sale of general insurance in the fourth quarter of 2015 under our long–term strategic partnership with Ageas;
we launched three new funds during the first half of the year, increasing the number of passively managed funds in our range to five. The new funds provide our customers with more choice and give us the opportunity to grow our funds under management;
we launched an international money transfer service in partnership with World First and a travel money service in partnership with Travelex in the second half of 2015; and
following these launches, the foundations for the growth of the Insurance and Investments businesses are largely in place.
2015 financial highlights
our funds under management stood at £3.0 billion at 31 December 2015 helping to drive a 9% increase in investment income;
the number of new Stocks & Shares ISA applications declined compared with 2014 reflecting the new flexibility for customers to make full use of their tax free allowance to save in cash;
our pension sales continued to perform well;
our insurance income in 2015 grew 13% reflecting our expanded product range;
our current account balances grew by 14% in the year to £230.3 million;
attributable expenses increased by 24% due to the strengthening of the management team and the restructuring of a commercial contract with a corporate partner; and
risk–weighted assets are held against operational risk in the business unit. Operational risk–weighted assets are measured using income generated by the unit in the preceding three years. This led to an increase of 9% year–on–year.
Performance Summary – Current Accounts, Insurance and Investments
2015 2014 Change
£m £m %
Investments 31.6 29.0 9%
Insurance and other 5.0 3.8 32%
Total income 36.6 32.8 12%
Total costs (16.7) (13.5) 24%
Underlying contribution 19.9 19.3 3%
2015 2014 Change
£m £m %
Key balance sheet items at 31 December
Loans and advances to customers 0.1 0.1 0%
Customer deposits 230.3 201.6 14%
Total customer balances 230.4 201.7 14%
Risk–weighted assets 51.6 47.2 9%
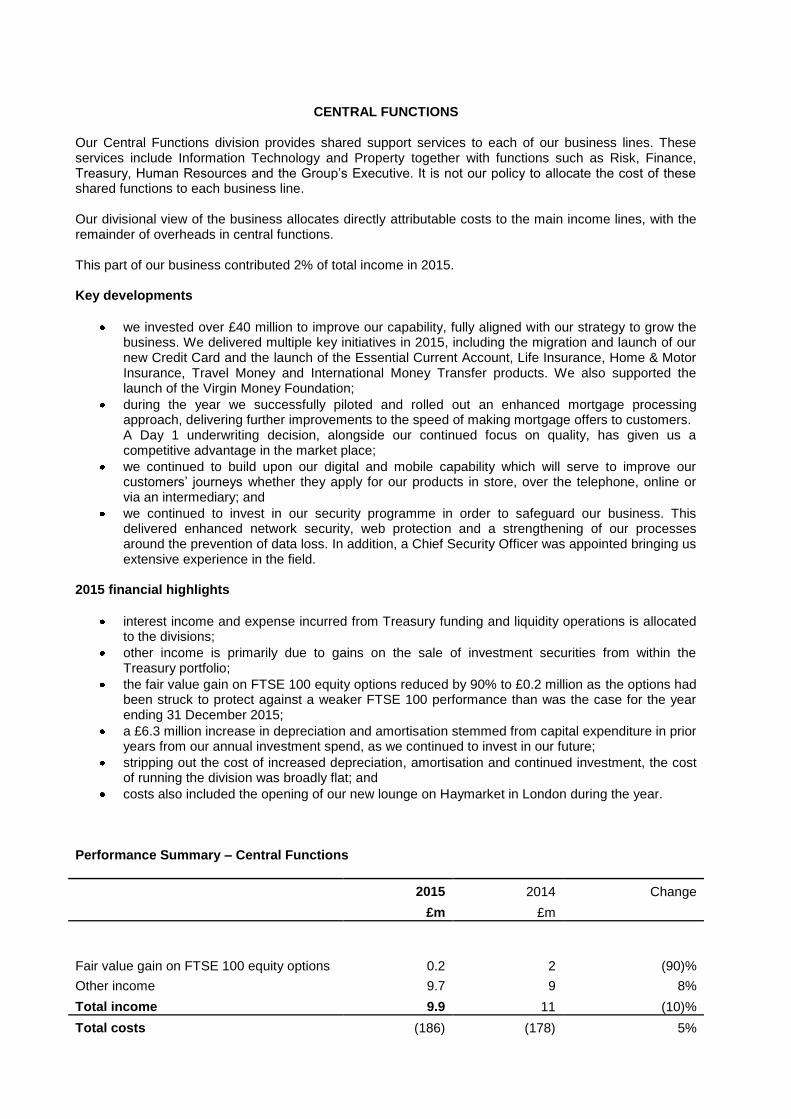
CENTRAL FUNCTIONS Our Central Functions division provides shared support services to each of our business lines. These services include Information Technology and Property together with functions such as Risk, Finance, Treasury, Human Resources and the Group‟s Executive. It is not our policy to allocate the cost of these shared functions to each business line. Our divisional view of the business allocates directly attributable costs to the main income lines, with the remainder of overheads in central functions. This part of our business contributed 2% of total income in 2015. Key developments
we invested over £40 million to improve our capability, fully aligned with our strategy to grow the business. We delivered multiple key initiatives in 2015, including the migration and launch of our new Credit Card and the launch of the Essential Current Account, Life Insurance, Home & Motor Insurance, Travel Money and International Money Transfer products. We also supported the launch of the Virgin Money Foundation;
during the year we successfully piloted and rolled out an enhanced mortgage processing approach, delivering further improvements to the speed of making mortgage offers to customers. A Day 1 underwriting decision, alongside our continued focus on quality, has given us a competitive advantage in the market place;
we continued to build upon our digital and mobile capability which will serve to improve our customers‟ journeys whether they apply for our products in store, over the telephone, online or via an intermediary; and
we continued to invest in our security programme in order to safeguard our business. This delivered enhanced network security, web protection and a strengthening of our processes around the prevention of data loss. In addition, a Chief Security Officer was appointed bringing us extensive experience in the field.
2015 financial highlights
interest income and expense incurred from Treasury funding and liquidity operations is allocated to the divisions;
other income is primarily due to gains on the sale of investment securities from within the Treasury portfolio;
the fair value gain on FTSE 100 equity options reduced by 90% to £0.2 million as the options had been struck to protect against a weaker FTSE 100 performance than was the case for the year ending 31 December 2015;
a £6.3 million increase in depreciation and amortisation stemmed from capital expenditure in prior years from our annual investment spend, as we continued to invest in our future;
stripping out the cost of increased depreciation, amortisation and continued investment, the cost of running the division was broadly flat; and
costs also included the opening of our new lounge on Haymarket in London during the year. Performance Summary – Central Functions
2015 2014 Change
£m £m
Fair value gain on FTSE 100 equity options 0.2 2 (90)%
Other income 9.7 9 8%
Total income 9.9 11 (10)%
Total costs (186) (178) 5%
Loss (176) (167) 6%
2015 2014 Change
£m £m
Risk–weighted assets 439.6 410.4 0.07
RESPONSIBILITY STATEMENT OF THE DIRECTORS IN RESPECT OF THE ANNUAL FINANCIAL REPORT
The responsibility statement below has been prepared in connection with the Company's full annual report for the year ending 31 December 2015. Certain parts thereof are not included within this announcement. We confirm to the best of our knowledge:
The financial statements, prepared in accordance with the applicable set of accounting standards, give a true and fair view of the assets, liabilities, financial position and profit or loss of the Company and the undertakings included in the consolidation taken as a whole; and
the Strategic Report and Directors‟ Report include a fair review of the development and performance of the business and the position of the Company and Group together with a description of the principal risks and uncertainties that they face.
This responsibility statement was approved by the board of directors on 1 March 2015 and is signed on its behalf by: Jayne–Anne Gadhia, Chief Executive Glen Moreno, Chairman of the Board
PRINCIPAL RISKS AND UNCERTAINTIES Effective risk management is a core part of our strategy. Virgin Money is a strong, customer–focused, low risk retail bank, unburdened by legacy issues. Our focus on maintaining a high–quality balance sheet is supported by our prudent risk appetite, our strong risk culture and our robust approach to risk management. The amount and type of risk that we target and tolerate (our „risk appetite‟) is reflected in our strategy and is designed to achieve an appropriate balance between risk and reward. Risk as an enabler of growth, quality and returns Our business strategy and risk appetite is focused on creating a business that can continue to grow strongly, maintain a high–quality balance sheet and deliver sustainable shareholder returns. Risks are identified, managed and mitigated using our Risk Management Framework (see page 148). The principal risks which could impact the delivery of our strategy, are outlined on pages 50 to 53. Commitment to balance sheet strength We place great importance on maintaining a well capitalized business with a strong liquidity position. Our approach supports stable balance sheet growth, our credit rating, and Basel III requirements. The business plan is designed to mitigate the impacts of a range of stress tests including the UK variant stress, severe idiosyncratic stresses, liquidity stress tests and key sensitivities, while exceeding regulatory requirements. Delivering asset quality
We maintain high–quality mortgage, credit card and wholesale portfolios. We continue to deliver strong asset quality as we grow our retail portfolios. Our lending meets performance targets which include asset quality guardrails. 95% of our wholesale portfolio is rated AA+ or above. Funding and liquidity management Our loan origination grows in line with available funding and we fund before we lend. Our funding plan is retail deposit led with diversification into wholesale funding. Our minimum level of High Quality Liquid Assets is calibrated to our view of liquidity risks reflected in the Board approved minimum liquidity requirement. Market risk management We do not operate a trading book and we have a limited appetite for market risk. Our Group Treasury Function ensures full measurement, management and control of interest rate risks, hedging all key exposures. Risk decision making Our approach to managing risk is designed to support the business in delivering sustainable growth. We have an integrated approach to business planning and combine achievable market share targets with prudent macroeconomic forecasts to ensure realistic growth targets. Board risk appetite is embedded in the activities of Risk teams, Commercial functions, Finance and Treasury. Our business plans are designed to generate a balanced mix of fee and interest income. Risk culture Our risk culture is aligned to our EBO philosophy and encourages accountability from each business area. A strong and independent Risk Function helps to ensure adherence to our risk management framework. We are committed to nurturing a consistent risk culture throughout the business to support transparency and trust. Our risk culture is founded on a clear articulation of risk appetite, an effective governance structure and risk management framework, committed leadership, rapid escalation of threats or concerns and the sharing of information across the organisation. Monitoring against risk appetite Our risk analysis, management and reporting allow for opportunities as well as risks to be identified and ensure that they are managed in line with our appetite. Our principal risks and performance are monitored and reported regularly and are subject to appropriate stress testing. This allows for the risk at both an individual risk class and aggregate portfolio level to be assessed. Robust risk management framework Our approach to risk is fundamentally about a strong risk culture and clearly defined risk appetite and is reflected in the risk management framework. Our risk framework allows us to benefit from full engagement throughout the business in developing controls to ensure that the business operates within approved risk appetite and limits.
Achievements in 2015 Credit ratings In November 2015, rating agency Fitch revised Virgin Money plc‟s outlook to positive from stable and affirmed our long term rating as BBB+. Wholesale funding Our funding position remains strong with a loan–to–deposit ratio of 107.5%. During 2015 we saw an increase in our retail lending, the successful release of our £750 million Retail Mortgage Backed
Securities (RMBS) programme, Gosforth Funding 2015–1, and the first issuance of £300 million Medium Term Notes. Retail funding During 2015, our deposits franchise continued to flourish. Deposit balances grew by 12% to £25.1 billion in 2015, a market share of 1.5%. Our deposit balances provide a strong and stable funding mix. Credit card migration During 2015 we completed the migration of over 675,000 customer records onto our newly built credit card infrastructure, completing our program to transfer our cards business from MBNA. Regulatory change Resolution and Recovery Plans were updated to reflect the requirements of the EU Bank Recovery and Resolution Directive, ahead of new rules coming into effect in January 2016. We have implemented the new Basel III Liquidity Coverage Ratio and applied for full regulatory permissions under the FCA Consumer Credit Sourcebook (CONC). We have made changes to our Advanced Internal Ratings Based capital models and refined our Pillar 2 approaches in the light of regulatory guidance. Investment in infrastructure Enhancements have been made to the Group‟s financial crime and information security systems to reflect the external threat landscape and evolving business strategy. In addition, a Chief Security Officer was appointed bringing us extensive experience in the field.
Priorities for 2016
Macro environment As a UK retail bank we are focused on serving domestic customers and continue to support and benefit from the resilient UK economy and housing market. We are however, very aware of the downside risks related to the impending UK referendum on EU membership, the uncertain outlook for interest rates, and the recent market turbulence caused by the slowdown in emerging markets and falling commodity prices. All of these have the potential to adversely impact the UK economy. A lower for longer forecast interest rate puts pressure on net interest margins and therefore business and financial performance. Wholesale funding Our funding strategy is to access wholesale funding to supplement our core retail deposit base in order to optimise funding costs, extend tenor and ensure we have appropriate diversification in the funding base. As we develop our wholesale funding programmes, our mix of wholesale may rise, however, will remain relatively low as a proportion of overall funding. We have amended our risk appetite to accommodate a loan–to–deposit ratio of up to 115%, over time from 110%, as a result of our successful participation in the wholesale markets. In January 2016, Gosforth 2016–1 raised a further £803 million of funding across three tranches denominated in Sterling, Euros and U.S. Dollars. We plan to further improve wholesale diversification by issuing covered bonds in 2016. Stable balance sheet growth Our focus on asset quality and balance sheet efficiency continues as the business grows. Credit policy and decisioning systems are regularly reviewed and tested to ensure they develop in response to changes in customer and competitor behaviours, maintaining the quality of the portfolios. This work will continue throughout 2016. Development of new product lines and delivery channels Risk will continue to support the business in its strategic initiatives, including the development of our SME strategy and the enhancement of our digital capability, to ensure they are delivered within our risk appetite.
Buy–to–let In December 2015, the BoE Financial Stability Report cited concerns over the growth in buy–to–let (BTL) lending and the impact that a structural shift to the private rental sector may have on market stability. In addition, there have been several tax and regulatory changes that may collectively weaken the attractiveness of BTL to an investor. These changes have added uncertainty to the outlook of BTL for both landlords and lenders, particularly over the medium to long–term. Our mortgage business remains high–quality and is comprised of 83% residential and 17% BTL mortgages. We focus on BTL for retail customers, rather than portfolio landlords, and our affordability and rental cover requirements are prudent. Continued investment in infrastructure We recognise the pace of change in the external threat environment and as such will continue to focus on development of capability to protect against cybercrime and invest in risk systems and frameworks to enable the further development of our digital offering. Third party administration We have a mature control environment regarding the oversight of key outsourcers and will continue to refine our operating model. As the number of business partnerships grows, our reliance on excellent execution from third parties necessitates more sophisticated approaches. Regulatory change Delivery of regulatory change programmes will be a core focus in 2016: Regulation
Ring–fencing: The Financial Services (Banking Reform) Act 2013 will result in the ring–fencing of retail and commercial banking operations to separate them from investment banking activities. Given that we are a UK focused retail bank, we expect our entire business will be within the ring–fence when it comes into effect at the beginning of 2019; and
The Mortgage Credit Directive (MCD): The MCD aims to create an EU wide mortgage credit market with a high level of consumer protection. This includes new requirements for disclosure, foreign currency loans, training and competence, binding offers, APRs and cooling–off periods to be in force from March 2016.
Market Studies
FCA Credit Card Market Study: Over the previous two years, the FCA has consulted firms as part of their Credit Card Market Study, investigating consumer driven competition, cost recovery and unaffordable credit card debt. The final outcomes of the study are expected to be reported in Spring 2016;
FCA Cash Savings Market Study: Findings published in December 2015 propose remedies to improve disclosure, switching and convenience for customers in the retail savings market; and
Competition Markets Authority (CMA) investigation into current account and business banking sectors: Provisional findings published in October 2015 proposed remedies focused heavily on switching, transparency and comparability. We will continue to engage with the CMA ahead of publishing its final report in May 2016.
Capital Consultations We are fully engaged in the Bank of England‟s consultation on minimum requirements for own funds and eligible liabilities (MREL) and regulatory buffers. Our capital planning assesses a range of outcomes from these consultations and the impact on our business plans. This allows for well informed capital planning. IFRS 9 We will develop new models and practices to meet the requirements of this new accounting standard in time for its application in 2018.
Risk Governance
We manage risk strategy and appetite in tandem with overall strategy and use a comprehensive risk management framework tailored for each risk class. Mapping the risks that could affect the business both today and in the future allows a comprehensive and consistent approach across all business areas. Effective governance is maintained through delegation of authority from the Board to the Executive, with committees designed to ensure our risk management approach is fully aligned with regulatory requirements and good industry practice. The Board approved risk appetite incorporates the Board‟s tolerance for risk in pursuit of achieving our strategic objectives. Executive committees manage the business within the defined risk appetite and associated limits. We use a „Three Lines of Defence‟ model which defines clear responsibilities and accountabilities and ensures appropriate segregation of duties and effective independent assurance. Credit Risk Principal risks We provide residential and BTL mortgages and credit cards to customers across the UK. There is a risk that any adverse changes in the economic and market environment and/or the credit quality or behaviour of borrowers results in additional impairment losses thereby reducing profitability. Wholesale exposures arise through the use of derivative instruments to manage interest rate risk and the liquid asset portfolio. Mitigating actions
credit risk is managed through risk appetite and risk limits reflected in approved credit policy;
a robust credit risk framework helps ensure that the credit quality and composition of the portfolios remain within risk appetite limits. This is monitored and reported through governance committees regularly;
stress and scenario testing allows us to confirm portfolio resilience;
credit risk metrics are benchmarked against competitors and industry averages; and
credit risk arising from derivative and from securities financing transactions is mitigated by collateralising exposures on a daily basis.
Commentary
2015 has seen improved arrears performance and favourable HPI movements. Wholesale credit performance remains stable with 95% of counterparties rated AA+ or above. Future Focus Continued delivery of strong asset quality aligned to growth of the mortgage and cards books. Maintain our „no loss‟ position for the wholesale credit portfolio. Market Risk Principal risks Market risk is the risk that unfavourable market moves lead to a reduction in earnings or value. We do not trade or make markets. Interest rate risk is the only material category of market risk for the Group. Mitigating actions
market risk is managed through Board approved risk appetite limits and policy;
we mitigate exposures through the use of natural offsets and derivatives; and
stress and scenario testing focuses on the impacts of differing interest rate environments. Commentary Capital at Risk has increased in a positive rate shock scenario following growth in fixed rate assets and liabilities, reflecting the risk that they terminate their contract prior to the end of the fixed rate period. This remains within risk appetite. Future Focus Refine our interest rate risk management systems and approaches. Operational Risk
Principal risks Operational risk is the risk of loss resulting from inadequate or failed internal processes, people and systems or from external events, including legal risk. The management of third party relationships, cybercrime and information security remain a key focus for us. Mitigating actions
risk appetite is focused on maturing the control environment and therefore managing operational risk;
a programme of investment in security infrastructure is in place to mitigate threats including cyber attack;
we continue to invest in and develop risk management frameworks, systems and processes; and
we monitor external events impacting other financial services companies to inform stress testing. Commentary As expected, following the set–up of the cards business, the absolute amount of losses increased, but is low and remains within risk appetite. Future Focus Continued investment in cybercrime defence, along with fraud and anti–money laundering infrastructure. Conduct Risk and Compliance Principal risks Conduct and compliance risk is defined as the risk that the Group‟s operating model, culture or actions result in unfair outcomes for customers, and the risk of regulatory sanction, material financial loss or reputational damage if the Group fails to design and implement operational processes, systems and controls and maintain compliance with all applicable regulatory requirements. Mitigating actions
compliance is maintained through an effective and timely response to changes in the regulatory environment;
the customer is placed at the heart of decision–making by ensuring fair outcomes through comprehensive risk assessment and testing;
we continue to invest in and develop risk management frameworks, systems and processes; and
we focus on training to ensure colleague performance aligns with customer accountabilities and provides awareness of vulnerable customers‟ needs.
Commentary The increase in total complaints is due to the migration of the credit card portfolio which has a complaints rate of 6.09 per 1,000 accounts. Future Focus Continue to protect the Group‟s position with limited exposure to conduct risk. Strategic and Financial Risk Principal risks Strategic risk is the risk of significant loss or damage arising from business decisions that impact the long–term interests of stakeholders or from an inability to adapt to external developments. Financial risk is focused primarily on concentration risk. Credit concentration risk is managed for retail and wholesale credit exposures at portfolio, product and counterparty levels. Mitigating actions
Board focus is on ensuring alignment of business development and planning with risk appetite;
we invest in processes, systems, recruitment and training to support new business developments;
we use robust risk and project management disciplines to ensure that implementation is delivered safely;
active focus is on asset origination and portfolio management to eliminate inappropriate concentration risk; and
regular validation and review of models is performed.
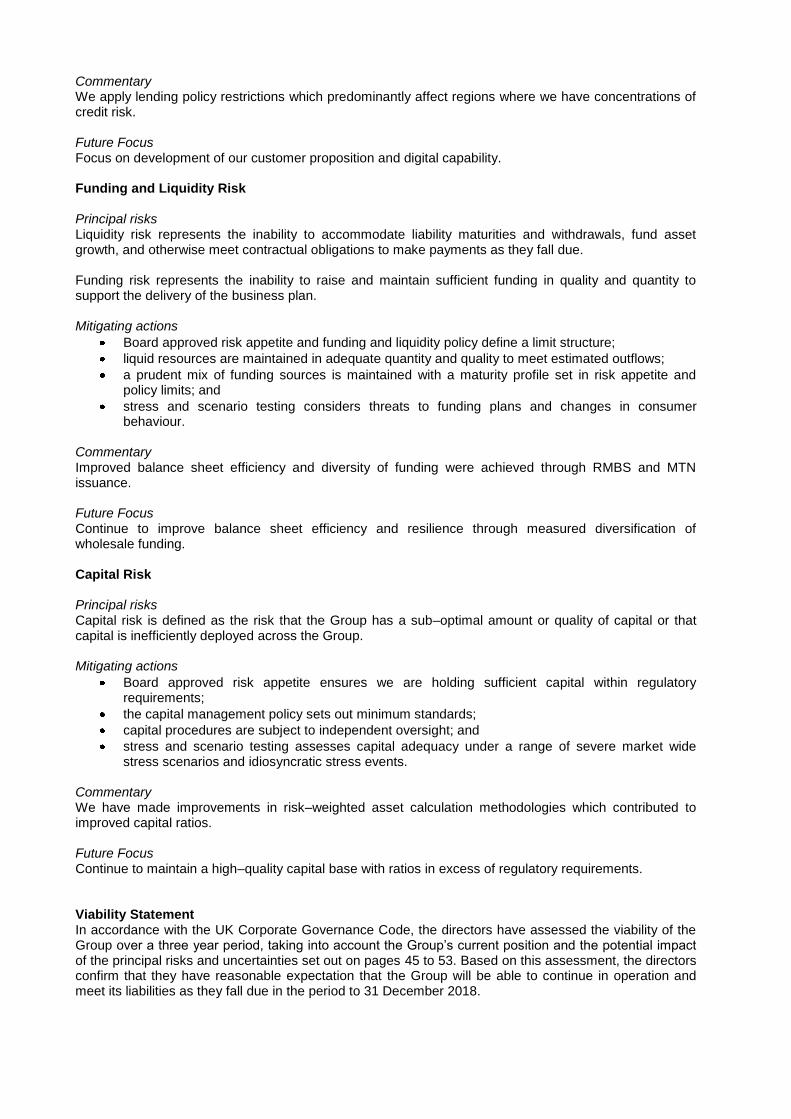
Commentary We apply lending policy restrictions which predominantly affect regions where we have concentrations of credit risk. Future Focus Focus on development of our customer proposition and digital capability. Funding and Liquidity Risk Principal risks Liquidity risk represents the inability to accommodate liability maturities and withdrawals, fund asset growth, and otherwise meet contractual obligations to make payments as they fall due. Funding risk represents the inability to raise and maintain sufficient funding in quality and quantity to support the delivery of the business plan. Mitigating actions
Board approved risk appetite and funding and liquidity policy define a limit structure;
liquid resources are maintained in adequate quantity and quality to meet estimated outflows;
a prudent mix of funding sources is maintained with a maturity profile set in risk appetite and policy limits; and
stress and scenario testing considers threats to funding plans and changes in consumer behaviour.
Commentary Improved balance sheet efficiency and diversity of funding were achieved through RMBS and MTN issuance. Future Focus Continue to improve balance sheet efficiency and resilience through measured diversification of wholesale funding. Capital Risk Principal risks Capital risk is defined as the risk that the Group has a sub–optimal amount or quality of capital or that capital is inefficiently deployed across the Group. Mitigating actions
Board approved risk appetite ensures we are holding sufficient capital within regulatory requirements;
the capital management policy sets out minimum standards;
capital procedures are subject to independent oversight; and
stress and scenario testing assesses capital adequacy under a range of severe market wide stress scenarios and idiosyncratic stress events.
Commentary We have made improvements in risk–weighted asset calculation methodologies which contributed to improved capital ratios. Future Focus Continue to maintain a high–quality capital base with ratios in excess of regulatory requirements. Viability Statement In accordance with the UK Corporate Governance Code, the directors have assessed the viability of the Group over a three year period, taking into account the Group‟s current position and the potential impact of the principal risks and uncertainties set out on pages 45 to 53. Based on this assessment, the directors confirm that they have reasonable expectation that the Group will be able to continue in operation and meet its liabilities as they fall due in the period to 31 December 2018.
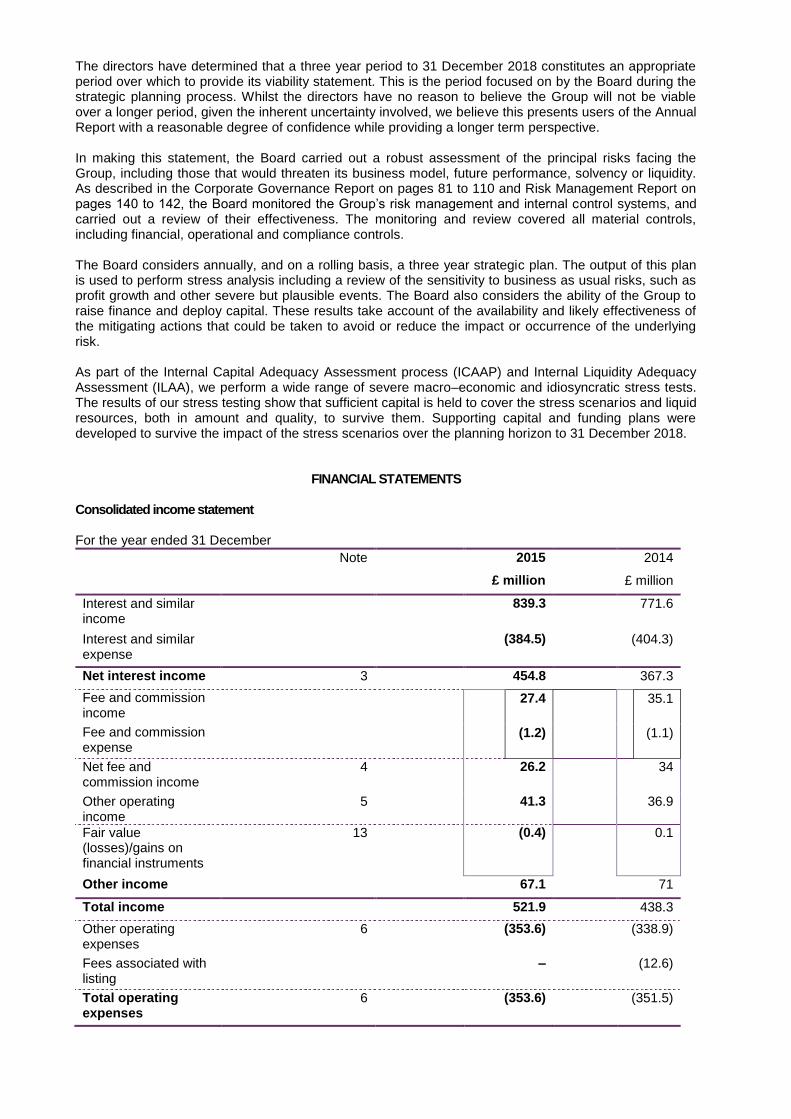
The directors have determined that a three year period to 31 December 2018 constitutes an appropriate period over which to provide its viability statement. This is the period focused on by the Board during the strategic planning process. Whilst the directors have no reason to believe the Group will not be viable over a longer period, given the inherent uncertainty involved, we believe this presents users of the Annual Report with a reasonable degree of confidence while providing a longer term perspective. In making this statement, the Board carried out a robust assessment of the principal risks facing the Group, including those that would threaten its business model, future performance, solvency or liquidity. As described in the Corporate Governance Report on pages 81 to 110 and Risk Management Report on pages 140 to 142, the Board monitored the Group‟s risk management and internal control systems, and carried out a review of their effectiveness. The monitoring and review covered all material controls, including financial, operational and compliance controls. The Board considers annually, and on a rolling basis, a three year strategic plan. The output of this plan is used to perform stress analysis including a review of the sensitivity to business as usual risks, such as profit growth and other severe but plausible events. The Board also considers the ability of the Group to raise finance and deploy capital. These results take account of the availability and likely effectiveness of the mitigating actions that could be taken to avoid or reduce the impact or occurrence of the underlying risk. As part of the Internal Capital Adequacy Assessment process (ICAAP) and Internal Liquidity Adequacy Assessment (ILAA), we perform a wide range of severe macro–economic and idiosyncratic stress tests. The results of our stress testing show that sufficient capital is held to cover the stress scenarios and liquid resources, both in amount and quality, to survive them. Supporting capital and funding plans were developed to survive the impact of the stress scenarios over the planning horizon to 31 December 2018.
FINANCIAL STATEMENTS Consolidated income statement For the year ended 31 December
Note 2015 2014
£ million £ million
Interest and similar income
839.3 771.6
Interest and similar expense
(384.5) (404.3)
Net interest income 3 454.8 367.3
Fee and commission income
27.4 35.1
Fee and commission expense
(1.2) (1.1)
Net fee and commission income
4 26.2 34
Other operating income
5 41.3 36.9
Fair value (losses)/gains on financial instruments
13 (0.4) 0.1
Other income 67.1 71
Total income 521.9 438.3
Other operating expenses
6 (353.6) (338.9)
Fees associated with listing
– (12.6)
Total operating expenses
6 (353.6) (351.5)
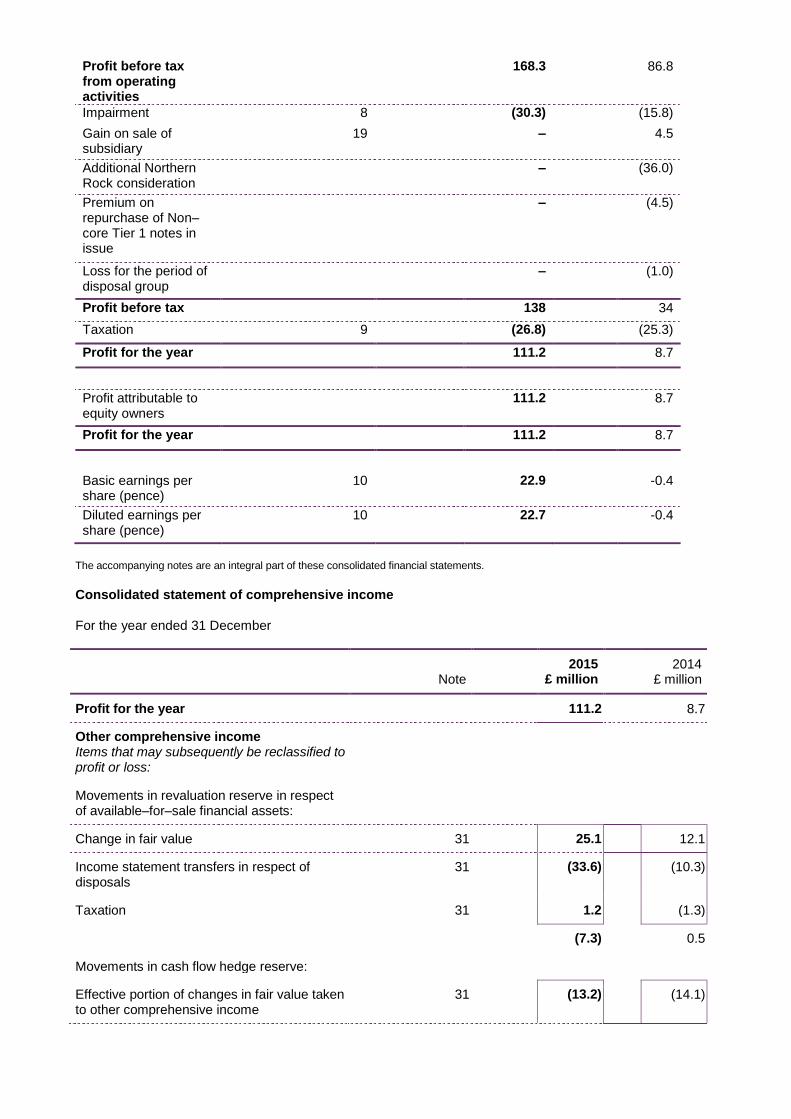
Profit before tax from operating activities
168.3 86.8
Impairment 8 (30.3) (15.8)
Gain on sale of subsidiary
19 – 4.5
Additional Northern Rock consideration
– (36.0)
Premium on repurchase of Non–core Tier 1 notes in issue
– (4.5)
Loss for the period of disposal group
– (1.0)
Profit before tax 138 34
Taxation 9 (26.8) (25.3)
Profit for the year 111.2 8.7
Profit attributable to equity owners
111.2 8.7
Profit for the year 111.2 8.7
Basic earnings per share (pence)
10 22.9 -0.4
Diluted earnings per share (pence)
10 22.7 -0.4
The accompanying notes are an integral part of these consolidated financial statements.
Consolidated statement of comprehensive income For the year ended 31 December
Note 2015
£ million 2014
£ million
Profit for the year 111.2 8.7
Other comprehensive income Items that may subsequently be reclassified to profit or loss:
Movements in revaluation reserve in respect of available–for–sale financial assets:
Change in fair value 31 25.1 12.1
Income statement transfers in respect of disposals
31 (33.6) (10.3)
Taxation 31 1.2 (1.3)
(7.3) 0.5
Movements in cash flow hedge reserve:
Effective portion of changes in fair value taken to other comprehensive income
31 (13.2) (14.1)
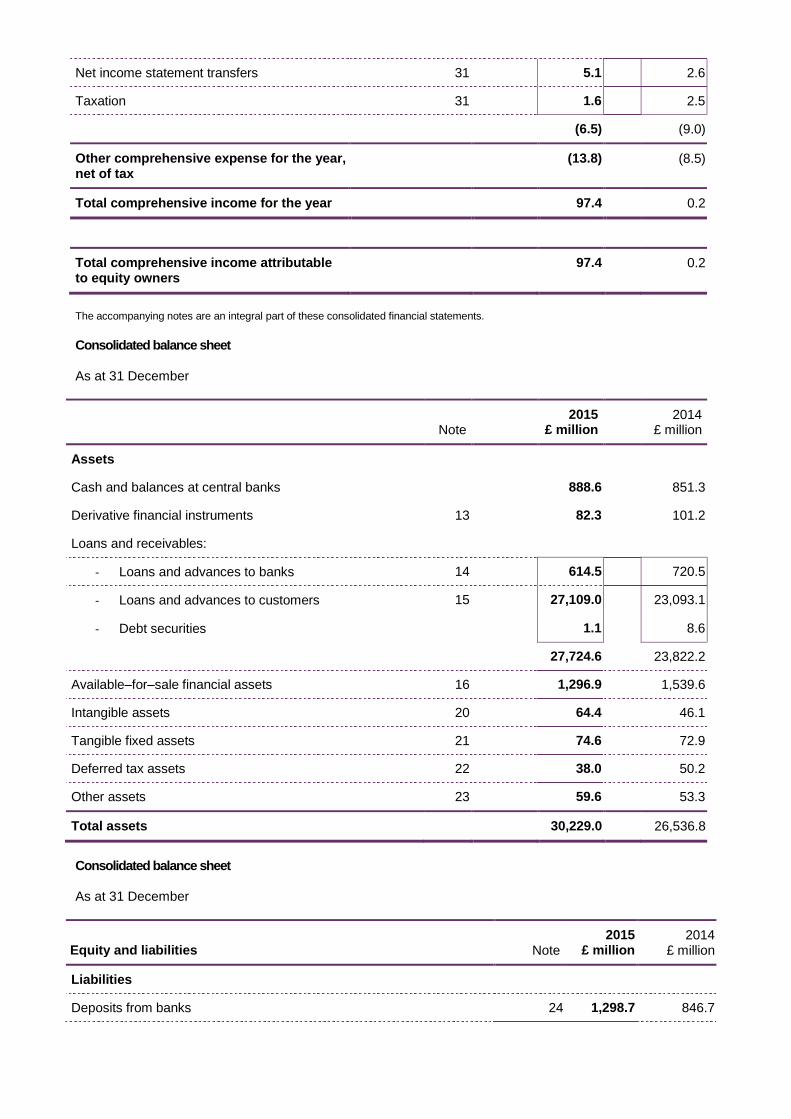
Net income statement transfers 31 5.1 2.6
Taxation 31 1.6 2.5
(6.5) (9.0)
Other comprehensive expense for the year, net of tax
(13.8) (8.5)
Total comprehensive income for the year 97.4 0.2
Total comprehensive income attributable to equity owners
97.4 0.2
The accompanying notes are an integral part of these consolidated financial statements.
Consolidated balance sheet As at 31 December
Note 2015
£ million 2014
£ million
Assets
Cash and balances at central banks 888.6 851.3
Derivative financial instruments 13 82.3 101.2
Loans and receivables:
- Loans and advances to banks 14 614.5 720.5
- Loans and advances to customers 15 27,109.0 23,093.1
- Debt securities 1.1 8.6
27,724.6 23,822.2
Available–for–sale financial assets 16 1,296.9 1,539.6
Intangible assets 20 64.4 46.1
Tangible fixed assets 21 74.6 72.9
Deferred tax assets 22 38.0 50.2
Other assets 23 59.6 53.3
Total assets 30,229.0 26,536.8
Consolidated balance sheet As at 31 December
Equity and liabilities Note
2015 £ million
2014
£ million
Liabilities
Deposits from banks 24 1,298.7 846.7
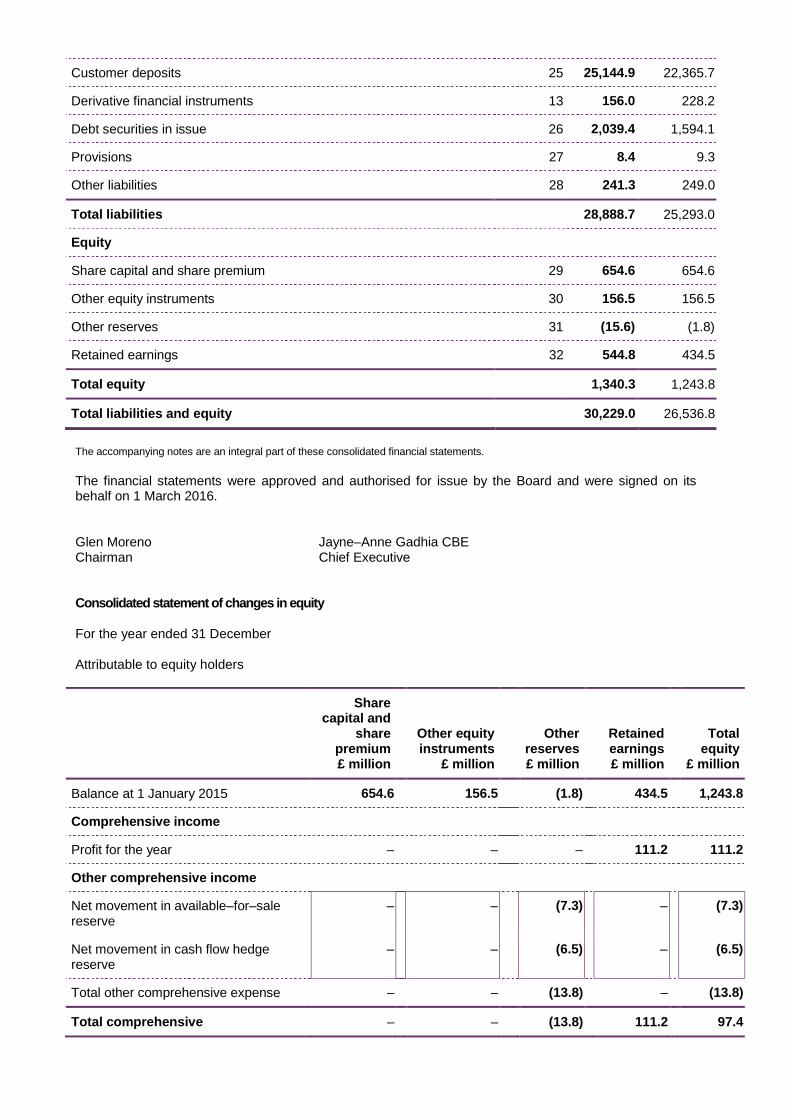
Customer deposits 25 25,144.9 22,365.7
Derivative financial instruments 13 156.0 228.2
Debt securities in issue 26 2,039.4 1,594.1
Provisions 27 8.4 9.3
Other liabilities 28 241.3 249.0
Total liabilities 28,888.7 25,293.0
Equity
Share capital and share premium 29 654.6 654.6
Other equity instruments 30 156.5 156.5
Other reserves 31 (15.6) (1.8)
Retained earnings 32 544.8 434.5
Total equity 1,340.3 1,243.8
Total liabilities and equity 30,229.0 26,536.8
The accompanying notes are an integral part of these consolidated financial statements.
The financial statements were approved and authorised for issue by the Board and were signed on its behalf on 1 March 2016. Glen Moreno Jayne–Anne Gadhia CBE Chairman Chief Executive Consolidated statement of changes in equity For the year ended 31 December Attributable to equity holders
Share capital and
share premium £ million
Other equity instruments
£ million
Other reserves £ million
Retained earnings
£ million
Total equity
£ million
Balance at 1 January 2015 654.6 156.5 (1.8) 434.5 1,243.8
Comprehensive income
Profit for the year – – – 111.2 111.2
Other comprehensive income
Net movement in available–for–sale reserve
– – (7.3) – (7.3)
Net movement in cash flow hedge reserve
– – (6.5) – (6.5)
Total other comprehensive expense – – (13.8) – (13.8)
Total comprehensive – – (13.8) 111.2 97.4
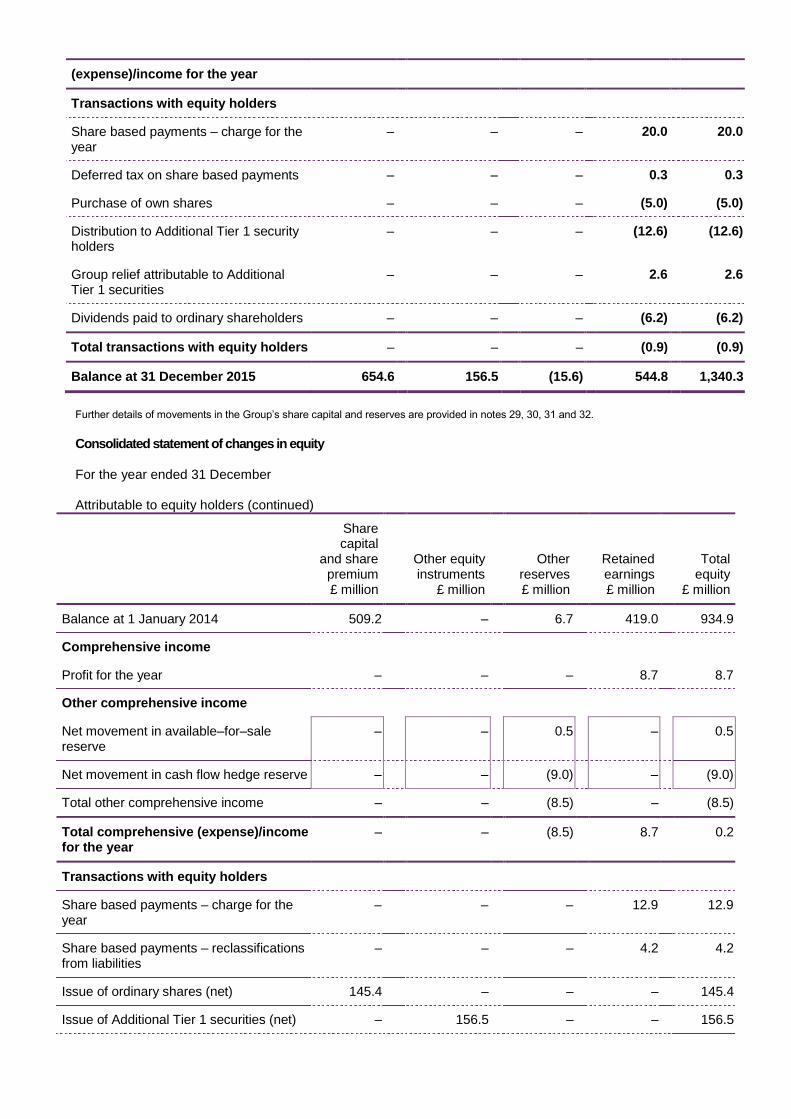
(expense)/income for the year
Transactions with equity holders
Share based payments – charge for the year
– – – 20.0 20.0
Deferred tax on share based payments – – – 0.3 0.3
Purchase of own shares – – – (5.0) (5.0)
Distribution to Additional Tier 1 security holders
– – – (12.6) (12.6)
Group relief attributable to Additional Tier 1 securities
– – – 2.6 2.6
Dividends paid to ordinary shareholders – – – (6.2) (6.2)
Total transactions with equity holders – – – (0.9) (0.9)
Balance at 31 December 2015 654.6 156.5 (15.6) 544.8 1,340.3
Further details of movements in the Group‟s share capital and reserves are provided in notes 29, 30, 31 and 32.
Consolidated statement of changes in equity For the year ended 31 December Attributable to equity holders (continued)
Share capital
and share premium £ million
Other equity instruments
£ million
Other reserves £ million
Retained earnings
£ million
Total equity
£ million
Balance at 1 January 2014 509.2 – 6.7 419.0 934.9
Comprehensive income
Profit for the year – – – 8.7 8.7
Other comprehensive income
Net movement in available–for–sale reserve
– – 0.5 – 0.5
Net movement in cash flow hedge reserve – – (9.0) – (9.0)
Total other comprehensive income – – (8.5) – (8.5)
Total comprehensive (expense)/income for the year
– – (8.5) 8.7 0.2
Transactions with equity holders
Share based payments – charge for the year
– – – 12.9 12.9
Share based payments – reclassifications from liabilities
– – – 4.2 4.2
Issue of ordinary shares (net) 145.4 – – – 145.4
Issue of Additional Tier 1 securities (net) – 156.5 – – 156.5
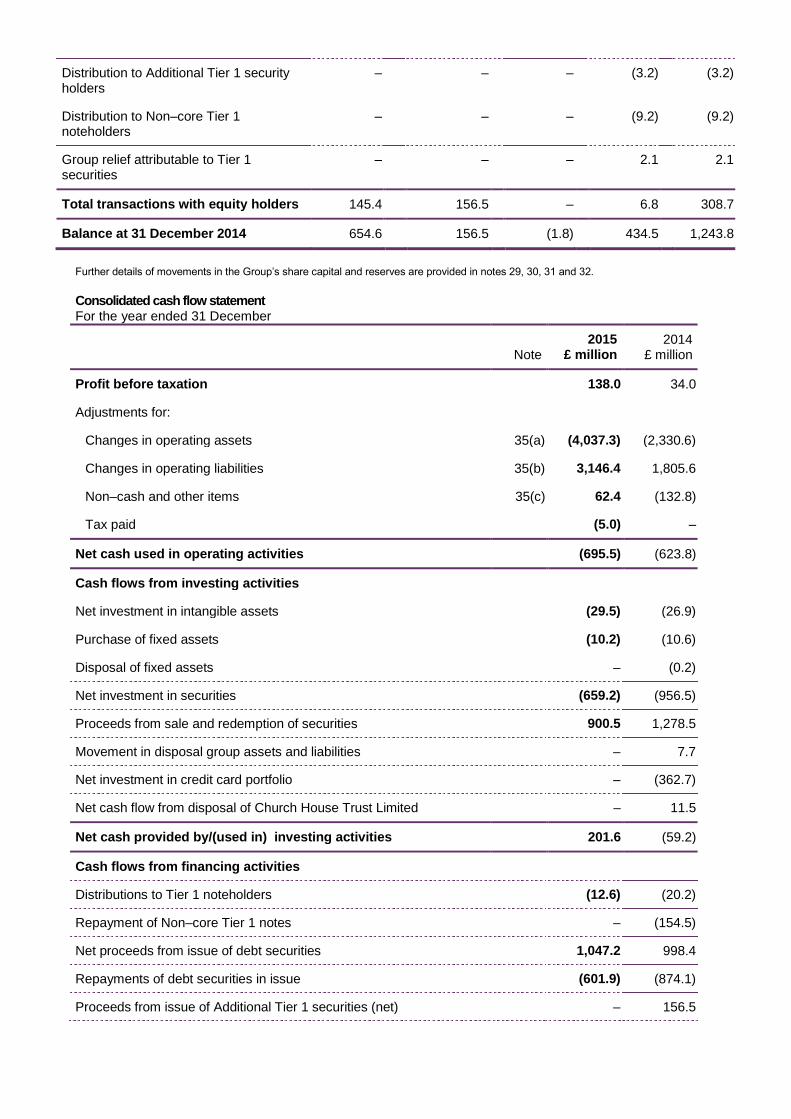
Distribution to Additional Tier 1 security holders
– – – (3.2) (3.2)
Distribution to Non–core Tier 1 noteholders
– – – (9.2) (9.2)
Group relief attributable to Tier 1 securities
– – – 2.1 2.1
Total transactions with equity holders 145.4 156.5 – 6.8 308.7
Balance at 31 December 2014 654.6 156.5 (1.8) 434.5 1,243.8
Further details of movements in the Group‟s share capital and reserves are provided in notes 29, 30, 31 and 32.
Consolidated cash flow statement For the year ended 31 December
Note
2015 £ million
2014
£ million
Profit before taxation 138.0 34.0
Adjustments for:
Changes in operating assets 35(a) (4,037.3) (2,330.6)
Changes in operating liabilities 35(b) 3,146.4 1,805.6
Non–cash and other items 35(c) 62.4 (132.8)
Tax paid (5.0) –
Net cash used in operating activities (695.5) (623.8)
Cash flows from investing activities
Net investment in intangible assets (29.5) (26.9)
Purchase of fixed assets (10.2) (10.6)
Disposal of fixed assets – (0.2)
Net investment in securities (659.2) (956.5)
Proceeds from sale and redemption of securities 900.5 1,278.5
Movement in disposal group assets and liabilities – 7.7
Net investment in credit card portfolio – (362.7)
Net cash flow from disposal of Church House Trust Limited – 11.5
Net cash provided by/(used in) investing activities 201.6 (59.2)
Cash flows from financing activities
Distributions to Tier 1 noteholders (12.6) (20.2)
Repayment of Non–core Tier 1 notes – (154.5)
Net proceeds from issue of debt securities 1,047.2 998.4
Repayments of debt securities in issue (601.9) (874.1)
Proceeds from issue of Additional Tier 1 securities (net) – 156.5
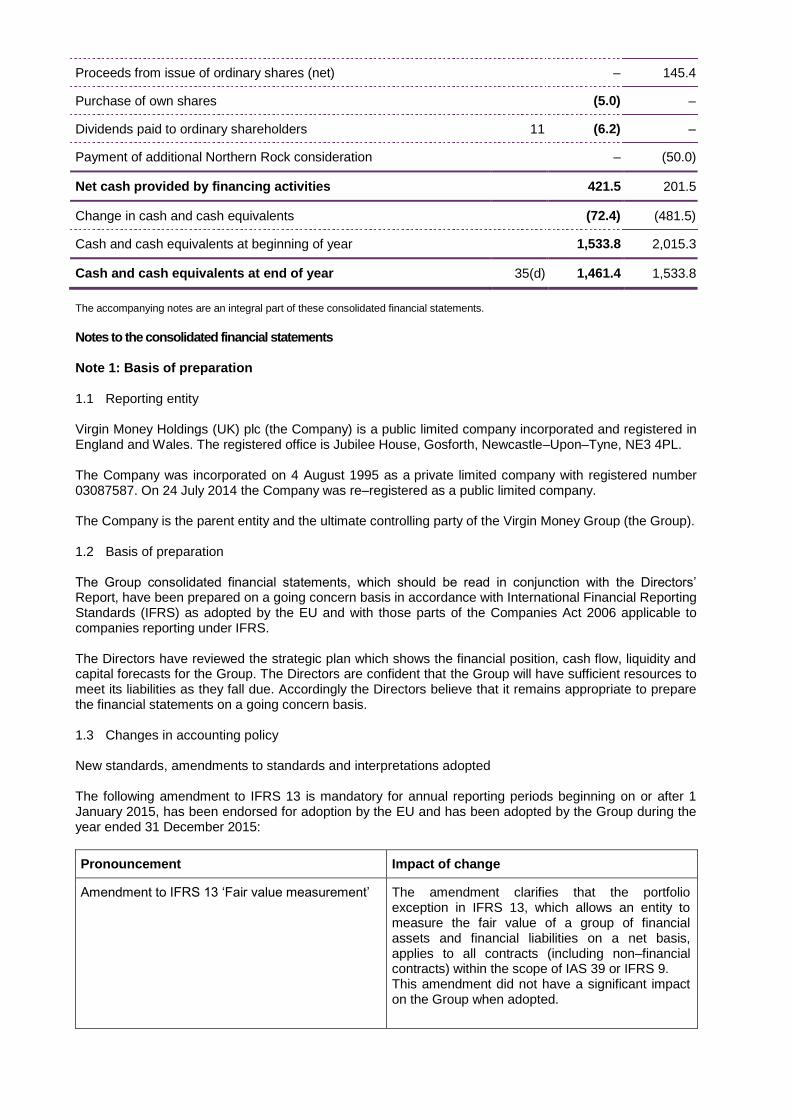
Proceeds from issue of ordinary shares (net) – 145.4
Purchase of own shares (5.0) –
Dividends paid to ordinary shareholders 11 (6.2) –
Payment of additional Northern Rock consideration – (50.0)
Net cash provided by financing activities 421.5 201.5
Change in cash and cash equivalents (72.4) (481.5)
Cash and cash equivalents at beginning of year 1,533.8 2,015.3
Cash and cash equivalents at end of year 35(d) 1,461.4 1,533.8
The accompanying notes are an integral part of these consolidated financial statements.
Notes to the consolidated financial statements Note 1: Basis of preparation 1.1 Reporting entity Virgin Money Holdings (UK) plc (the Company) is a public limited company incorporated and registered in England and Wales. The registered office is Jubilee House, Gosforth, Newcastle–Upon–Tyne, NE3 4PL. The Company was incorporated on 4 August 1995 as a private limited company with registered number 03087587. On 24 July 2014 the Company was re–registered as a public limited company. The Company is the parent entity and the ultimate controlling party of the Virgin Money Group (the Group). 1.2 Basis of preparation The Group consolidated financial statements, which should be read in conjunction with the Directors‟ Report, have been prepared on a going concern basis in accordance with International Financial Reporting Standards (IFRS) as adopted by the EU and with those parts of the Companies Act 2006 applicable to companies reporting under IFRS. The Directors have reviewed the strategic plan which shows the financial position, cash flow, liquidity and capital forecasts for the Group. The Directors are confident that the Group will have sufficient resources to meet its liabilities as they fall due. Accordingly the Directors believe that it remains appropriate to prepare the financial statements on a going concern basis. 1.3 Changes in accounting policy New standards, amendments to standards and interpretations adopted The following amendment to IFRS 13 is mandatory for annual reporting periods beginning on or after 1 January 2015, has been endorsed for adoption by the EU and has been adopted by the Group during the year ended 31 December 2015:
Pronouncement Impact of change
Amendment to IFRS 13 „Fair value measurement‟ The amendment clarifies that the portfolio exception in IFRS 13, which allows an entity to measure the fair value of a group of financial assets and financial liabilities on a net basis, applies to all contracts (including non–financial contracts) within the scope of IAS 39 or IFRS 9. This amendment did not have a significant impact on the Group when adopted.
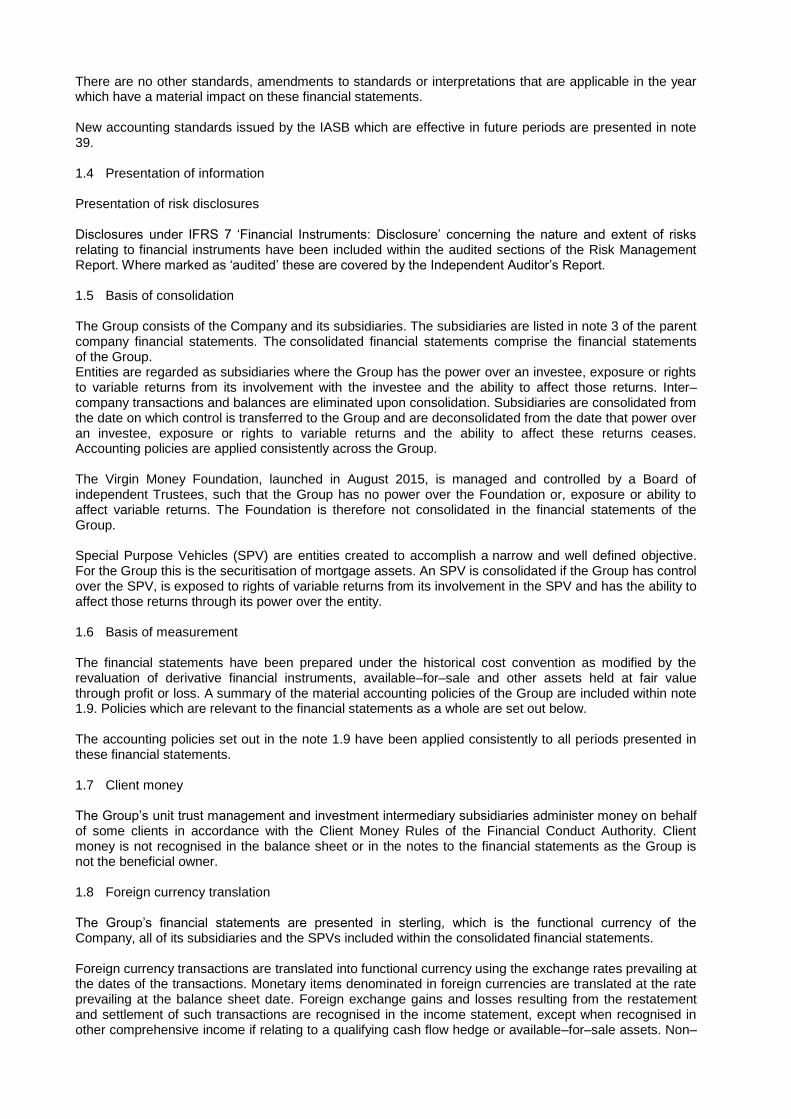
There are no other standards, amendments to standards or interpretations that are applicable in the year which have a material impact on these financial statements. New accounting standards issued by the IASB which are effective in future periods are presented in note 39. 1.4 Presentation of information Presentation of risk disclosures Disclosures under IFRS 7 „Financial Instruments: Disclosure‟ concerning the nature and extent of risks relating to financial instruments have been included within the audited sections of the Risk Management Report. Where marked as „audited‟ these are covered by the Independent Auditor‟s Report. 1.5 Basis of consolidation The Group consists of the Company and its subsidiaries. The subsidiaries are listed in note 3 of the parent company financial statements. The consolidated financial statements comprise the financial statements of the Group. Entities are regarded as subsidiaries where the Group has the power over an investee, exposure or rights to variable returns from its involvement with the investee and the ability to affect those returns. Inter–company transactions and balances are eliminated upon consolidation. Subsidiaries are consolidated from the date on which control is transferred to the Group and are deconsolidated from the date that power over an investee, exposure or rights to variable returns and the ability to affect these returns ceases. Accounting policies are applied consistently across the Group. The Virgin Money Foundation, launched in August 2015, is managed and controlled by a Board of independent Trustees, such that the Group has no power over the Foundation or, exposure or ability to affect variable returns. The Foundation is therefore not consolidated in the financial statements of the Group. Special Purpose Vehicles (SPV) are entities created to accomplish a narrow and well defined objective. For the Group this is the securitisation of mortgage assets. An SPV is consolidated if the Group has control over the SPV, is exposed to rights of variable returns from its involvement in the SPV and has the ability to affect those returns through its power over the entity. 1.6 Basis of measurement The financial statements have been prepared under the historical cost convention as modified by the revaluation of derivative financial instruments, available–for–sale and other assets held at fair value through profit or loss. A summary of the material accounting policies of the Group are included within note 1.9. Policies which are relevant to the financial statements as a whole are set out below. The accounting policies set out in the note 1.9 have been applied consistently to all periods presented in these financial statements. 1.7 Client money The Group‟s unit trust management and investment intermediary subsidiaries administer money on behalf of some clients in accordance with the Client Money Rules of the Financial Conduct Authority. Client money is not recognised in the balance sheet or in the notes to the financial statements as the Group is not the beneficial owner. 1.8 Foreign currency translation The Group‟s financial statements are presented in sterling, which is the functional currency of the Company, all of its subsidiaries and the SPVs included within the consolidated financial statements. Foreign currency transactions are translated into functional currency using the exchange rates prevailing at the dates of the transactions. Monetary items denominated in foreign currencies are translated at the rate prevailing at the balance sheet date. Foreign exchange gains and losses resulting from the restatement and settlement of such transactions are recognised in the income statement, except when recognised in other comprehensive income if relating to a qualifying cash flow hedge or available–for–sale assets. Non–
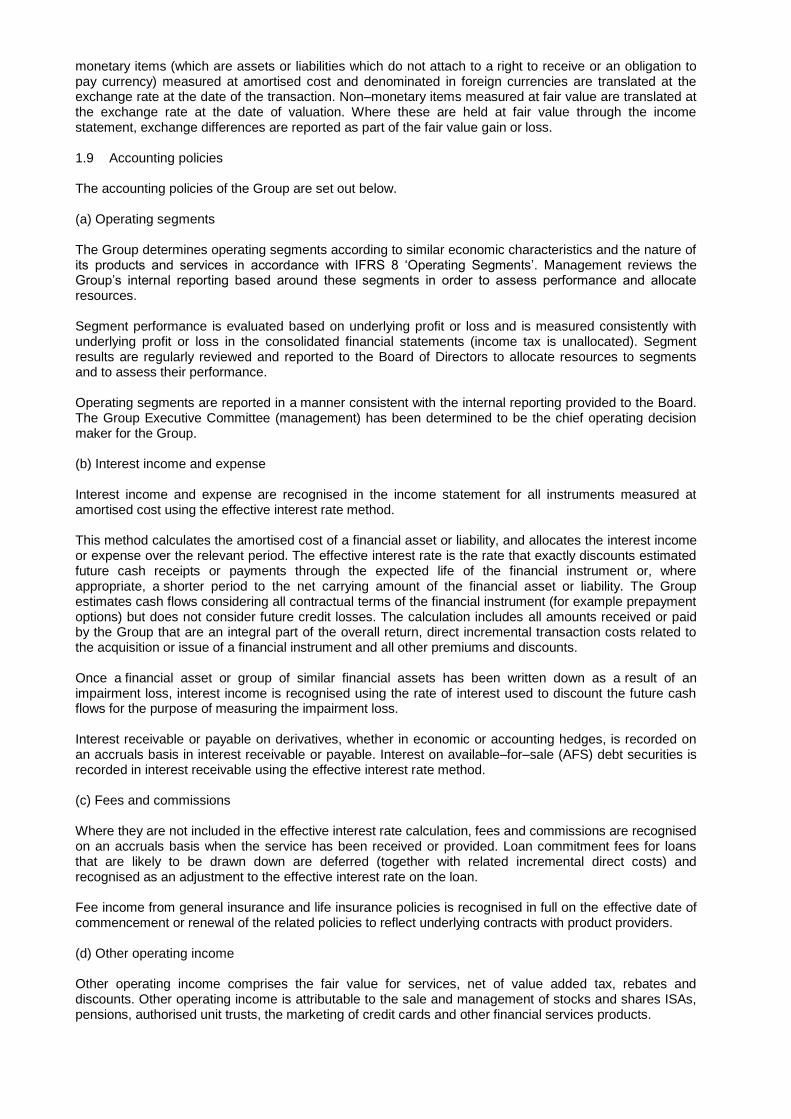
monetary items (which are assets or liabilities which do not attach to a right to receive or an obligation to pay currency) measured at amortised cost and denominated in foreign currencies are translated at the exchange rate at the date of the transaction. Non–monetary items measured at fair value are translated at the exchange rate at the date of valuation. Where these are held at fair value through the income statement, exchange differences are reported as part of the fair value gain or loss. 1.9 Accounting policies The accounting policies of the Group are set out below. (a) Operating segments The Group determines operating segments according to similar economic characteristics and the nature of its products and services in accordance with IFRS 8 „Operating Segments‟. Management reviews the Group‟s internal reporting based around these segments in order to assess performance and allocate resources. Segment performance is evaluated based on underlying profit or loss and is measured consistently with underlying profit or loss in the consolidated financial statements (income tax is unallocated). Segment results are regularly reviewed and reported to the Board of Directors to allocate resources to segments and to assess their performance. Operating segments are reported in a manner consistent with the internal reporting provided to the Board. The Group Executive Committee (management) has been determined to be the chief operating decision maker for the Group. (b) Interest income and expense Interest income and expense are recognised in the income statement for all instruments measured at amortised cost using the effective interest rate method. This method calculates the amortised cost of a financial asset or liability, and allocates the interest income or expense over the relevant period. The effective interest rate is the rate that exactly discounts estimated future cash receipts or payments through the expected life of the financial instrument or, where appropriate, a shorter period to the net carrying amount of the financial asset or liability. The Group estimates cash flows considering all contractual terms of the financial instrument (for example prepayment options) but does not consider future credit losses. The calculation includes all amounts received or paid by the Group that are an integral part of the overall return, direct incremental transaction costs related to the acquisition or issue of a financial instrument and all other premiums and discounts. Once a financial asset or group of similar financial assets has been written down as a result of an impairment loss, interest income is recognised using the rate of interest used to discount the future cash flows for the purpose of measuring the impairment loss. Interest receivable or payable on derivatives, whether in economic or accounting hedges, is recorded on an accruals basis in interest receivable or payable. Interest on available–for–sale (AFS) debt securities is recorded in interest receivable using the effective interest rate method. (c) Fees and commissions Where they are not included in the effective interest rate calculation, fees and commissions are recognised on an accruals basis when the service has been received or provided. Loan commitment fees for loans that are likely to be drawn down are deferred (together with related incremental direct costs) and recognised as an adjustment to the effective interest rate on the loan. Fee income from general insurance and life insurance policies is recognised in full on the effective date of commencement or renewal of the related policies to reflect underlying contracts with product providers. (d) Other operating income Other operating income comprises the fair value for services, net of value added tax, rebates and discounts. Other operating income is attributable to the sale and management of stocks and shares ISAs, pensions, authorised unit trusts, the marketing of credit cards and other financial services products.
Other operating income from sales of units in managed funds is recognised daily based on the average volume of funds under management. Fees charged to charities for registering with Virgin Money Giving are recognised from the date on which recovery is reasonably certain. The commission charged on donations and event fees is recognised from the date donations and event fees are transacted on the website. Both of these income streams contribute towards costs incurred by Virgin Money Giving. Other income includes commission on donations, interest received from related parties and other sundry income. The Group recognises ongoing credit card income from strategic partners as other income. (e) Total operating expenses Operating expenses are recognised on an accruals basis as services are provided. Included within the employee benefits expense are employee share based payments. The accounting policy in relation to share based payments is set out in policy (f). Staff costs The Group accounts for components of employee costs on the following bases: Short–term employee benefits Short term employee benefits include salaries and social security costs and are recognised over the period in which the employees provide the services to which the payments relate. Cash bonus awards are recognised to the extent that the Group has a present obligation to its employees that can be measured reliably and are recognised over the period of service that employees are required to work to qualify for the payment. Other long–term employee benefits Other long–term employee benefits include deferred cash bonus awards. Deferred cash bonus awards are recognised at the present value of the obligation at the reporting date. These costs are recognised over the period of service that employees are required to work to qualify for the payment. Retirement benefit obligations A defined contribution plan is a post–employment benefit plan into which the Group pays fixed contributions and has no legal or constructive obligation to pay further amounts. Contributions are recognised as staff expenses in profit or loss in the periods during which related employee services are fulfilled. The Group operates defined contribution pension schemes for its Directors and employees. The assets of the schemes are held separately from those of the Group in independently administered funds. The accounting policies for employee share based payments are set out in policy (f). Leases If the lease agreement in which the Group is a lessee transfers the risks and rewards of the asset, the lease is recorded as a finance lease and the related asset is capitalised. At inception, the asset is recorded at the lower of the present value of the minimum lease payments or fair value and is depreciated over the estimated useful life. The lease obligations are recorded as borrowings. If the lease does not transfer the risks and rewards of the asset, the lease is recorded as an operating lease. Operating lease payments are charged to profit or loss on a straight line basis over the lease term unless a different systematic basis is more appropriate. Where an operating lease is terminated before the lease period has expired, any payment required to be made to the lessor in compensation is charged to profit or loss in the period in which termination is made. (f) Share based payments
The Group puts in place share schemes for employees to reward strong long–term business performance and to incentivise growth for the future. The Group engages in equity and cash settled share based payment transactions in respect of services received from certain of its employees. For equity settled share based payment transactions the grant date fair value of the award is recognised as an employee expense with a corresponding increase in equity over the period that the employees become unconditionally entitled to the awards. The grant date fair value of the award is determined using valuation models which take into account the terms and conditions attached to the awards. Inputs into valuation models may include the exercise price, the risk–free interest rate, the expected volatility of the Company‟s share price and other various factors which relate to performance conditions attached to the awards. The amount recognised as an expense is adjusted to reflect the actual number of awards for which the related service and non–market vesting conditions are expected to be met such that the amount ultimately recognised as an expense is based on the number of awards that do meet the related service and non–market performance conditions at the vesting date. For share based payment awards with market performance conditions or non–vesting conditions the grant date fair value of the award is measured to reflect such conditions and there is no true–up for differences between expected and actual outcomes. For cash settled share based payment transactions the fair value of the amount payable to the employee is recognised as an expense with a corresponding increase in liabilities. The fair value is initially measured at grant date and spread over the period during which the employees become unconditionally entitled to payment. The fair value is measured based on a valuation model taking into account the terms and conditions of the grant. The liability is revalued at each balance sheet date and settlement date with any changes to fair value being recognised in profit or loss. (g) Impairment losses The Group assesses its financial assets or groups of financial assets for objective evidence of impairment at each balance sheet date. An impairment loss is recognised if a loss event (or events) has occurred after initial recognition, and on or before the balance sheet date, that has a reliably measurable impact on the estimated future cash flows of the financial assets or groups of financial assets. Losses incurred as a result of events occurring after the balance sheet date are not recognised in these financial statements. Assets held at amortised cost The Group first assesses whether objective evidence of impairment exists individually for financial assets that are individually significant, and individually or collectively for financial assets that are not individually significant. Objective evidence that a financial asset is impaired includes observable data that comes to the attention of the Group about the following loss events:
there is evidence of the customer or issuer experiencing financial difficulty; there is a breach of contract, such as a default or delinquency in repayments;
the customer is granted a concession that would otherwise not be considered; the borrower will enter bankruptcy or other financial reorganisation;
the disappearance of an active market for that financial asset because of financial difficulties; and observable data indicating that there is a measurable decrease in the estimated future cash flows
from a portfolio of assets since the initial recognition of those assets, although the decrease cannot yet be identified with the individual financial assets in the portfolio, including:
there are adverse changes in the payment status of borrowers in the portfolio; and economic conditions that correlate with defaults on the assets in the portfolio.
If the Group determines that no objective evidence of impairment exists for an individually assessed financial asset, whether significant or not, it includes the asset in a group of financial assets with similar credit risk characteristics and collectively assesses them for impairment. In assessing collective impairment the Group uses statistical modelling of historic trends to assess the probability of a group of financial assets going into default and the subsequent loss incurred. Regular model monitoring is performed to ensure model assumptions remain appropriate.
Assets that are individually assessed and for which an impairment loss is or continues to be recognised are not included in a collective assessment of impairment. If there is objective evidence that an impairment loss on loans and receivables has been incurred, the amount of the loss is measured as the difference between the asset carrying amount and the present value of the estimated future cash flows (excluding future credit losses that have not been incurred) discounted at the financial asset‟s original effective interest rate. The carrying amount of the asset is reduced through the use of an impairment allowance and the amount of the loss is recognised in profit or loss. When a loan or receivable is uncollectible, it is written off against the related provision for loan impairment. Such loans are written off after all the necessary procedures have been completed and the amount of the loss has been determined. Subsequent recoveries of amounts previously written off are recognised directly in the income statement. If, in a subsequent period, the amount of the impairment loss decreases and the decrease can be related objectively to an event occurring after the impairment was recognised (such as an improvement in the customer‟s credit rating), the previously recognised impairment loss is reversed by adjusting the impairment allowance. The amount of the reversal is recognised in profit or loss. A provision is also made in the case of accounts, which may not currently be in arrears, where losses may have been incurred but not yet recognised. An increased level of provision is held for accounts where an impairment trigger event has occurred which includes accounts benefiting from forbearance and those in arrears. Refer to page 156 of the Risk Management Report for details of the forbearance policy. (h) Taxation Taxation comprises current tax and deferred tax. Current tax and deferred tax are recognised in profit or loss except to the extent that they relate to items recognised directly in equity or other comprehensive income. Current tax is based on the taxable income or loss for the year, using tax rates enacted or substantively enacted at the reporting date, and any adjustment to tax payable in respect of previous years. The Group has adopted the Code of Practice on Taxation for Banks issued by HM Revenue and Customs. Further disclosures relating to deferred tax are included in policy (s). (i) Earnings per share Basic earnings per share is calculated by dividing the profit attributable to ordinary shareholders of the parent company by the weighted–average number of ordinary shares outstanding during the period excluding own shares held in employee benefit trusts or held for trading. The diluted earnings per share is calculated by adjusting the profit or loss that is attributable to ordinary shareholders and the weighted–average number of ordinary shares outstanding for the effects of all dilutive potential ordinary shares, which comprise share options granted to employees. For the calculation of diluted earnings per share the weighted–average number of ordinary shares in issue is adjusted to assume conversion of all dilutive potential ordinary shares, if any, that arise in respect of share options and rewards granted to employees. The number of shares that could have been acquired at the average annual share price of the Company‟s shares based on the monetary value of the subscription rights attached to outstanding share options and awards is determined. This is deducted from the number of shares issuable under such options and awards to leave a residual bonus amount of shares which are added to the weighted–average number of ordinary shares in issue, but no adjustment is made to the profit attributable to equity shareholders. (j) Financial instruments Financial assets Financial assets can be classified in the following categories:
loans and receivables;
available–for–sale; held to maturity; or
financial assets at fair value through profit or loss.
Management determines the classification of its financial instruments at initial recognition. The Group measures all of its financial liabilities at amortised cost, other than derivatives and those instruments which have been designated as part of a hedging relationship (refer policy (n)). Purchases and sales of financial assets at fair value through profit or loss, held to maturity and available–for–sale are recognised on the trade date, the date on which the Group commits to purchase or sell the asset. Loans and receivables at amortised cost The Group‟s loans and advances to banks and customers and some investment securities are classified as loans and receivables. Loans and receivables are non–derivative financial assets with fixed or determinable payments that are not quoted in an active market, whose recoverability is based solely on the credit risk of the customer and where the Group has no intention of trading the loan or receivable. Loans and receivables are initially recognised at fair value including direct and incremental transaction costs. Subsequent recognition is at amortised cost using the effective interest rate method, less any provision for impairment. Available–for–sale financial assets Available–for–sale financial assets are non–derivative assets that are either designated as available–for–sale or are assets that do not meet the definition of loans and receivables and are not derivatives or assets held at fair value through profit or loss. These are principally but not exclusively investment securities intended to be held for an indefinite period of time which may be sold in response to a need for liquidity or changes in interest rates, exchange rates or equity prices. They are initially measured at fair value including direct and incremental transaction costs. Fair values are obtained from quoted market prices in active markets and, where these are not available, from valuation techniques including discounted cash flow models (refer to policy (m)). With the exception of unquoted equity instruments measured at cost less impairment because their fair value cannot be measured reliably, subsequent measurement is at fair value, with changes in fair value being recognised in other comprehensive income except for impairment losses and translation differences, which are recognised in profit or loss. Upon derecognition of the asset, or where there is objective evidence that the investment security is impaired, the cumulative gains and losses recognised in other comprehensive income are removed from other comprehensive income and recycled to profit or loss. Held to maturity financial assets Held to maturity financial assets are non–derivative financial assets with fixed or determinable payments that the Group has the ability and intention to hold to maturity. They are initially measured at fair value including direct and incremental transaction costs. Subsequent measurement is at amortised cost using the effective interest rate method. No financial assets were classified as held to maturity during either the current or prior year. Financial assets at fair value through profit or loss This category consists of derivative financial assets. Assets in this category are carried at fair value. The fair values of derivative instruments are calculated by discounted cash flow models using yield curves that are based on observable market data or are based on valuations obtained from counterparties. Gains and losses arising from the changes in the fair values are recognised in profit or loss. The fair values of quoted investments in active markets are based on current bid prices. If the market for a financial asset is not active (and for unlisted securities), the Group establishes fair value using valuation techniques. These include the use of recent arm‟s length transactions, discounted cash flow analysis, option pricing models and other valuation techniques commonly used by market participants. Financial liabilities Borrowings, including deposits and debt securities in issue are recognised initially at fair value, being the issue proceeds net of premiums, discounts and transaction costs incurred. All borrowings are subsequently measured at amortised cost using the effective interest rate method. Amortised cost is adjusted for the amortisation of any premiums, discounts and transaction costs. The amortisation is recognised in interest expense and similar charges using the effective interest rate method. The Group does not hold any financial liabilities classified as held for trading. Offsetting financial instruments
Financial assets and liabilities are offset and the net amount reported in the balance sheet when there is a legally enforceable right to offset the recognised amounts and there is an intention to settle on a net basis, or realise the asset and settle the liability simultaneously. Sale and repurchase agreements
Securities sold subject to repurchase agreements (repos) are reclassified in the financial statements as assets pledged when the transferee has the right by contract or custom to sell or repledge the collateral. The counterparty liability is included in amounts due to other banks, deposits from banks, other deposits or deposits due to customers, as appropriate. Securities purchased under agreements to resell (reverse repos) are recorded as loans and advances to banks or customers as appropriate. The difference between sale and repurchase price is treated as interest and accrued over the life of the agreements using the effective interest rate method. Securities lent to counterparties are also retained in the financial statements. Derecognition of financial assets and liabilities Derecognition is the point at which the Group removes an asset or liability from its balance sheet. The Group‟s policy is to derecognise financial assets only when the contractual right to the cash flows from the financial asset expires or when the Group transfers the financial assets to another party provided the transfer of the asset also transfers the right to receive the cash flows of the financial asset or where the Group has transferred substantially all the risks and rewards of ownership. Where the transfer does not result in the Group transferring the right to receive the cash flows of the financial assets, but it does result in the Group assuming a corresponding obligation to pay the cash flows to another recipient, the financial assets are also accordingly derecognised. The Group derecognises financial liabilities only when the obligation specified in the contract is discharged, converted to shares, cancelled or has expired or is transferred to a third party. There were no transactions in the year where the Group transferred financial assets that should have been derecognised in their entirety. (k) Loans and advances to banks The Group‟s loans and advances to banks are classified as loans and receivables. (l) Loans and advances to customers The Group‟s loans and advances to customers are classified as loans and receivables. Further details of the application of the effective interest rate method are included in policy (b) and provision for impairment in policy (g). (m) Available–for–sale financial assets Debt securities are designated as either available–for–sale or loans and receivables. Debt securities are principally available–for–sale as they are intended to be held for an indefinite period of time but may be sold in response to a need for liquidity or changes in interest rates, exchange rates or equity prices. Debt securities classified as loans and receivables are asset backed securities for which there is no active market. The Group‟s debt securities, treasury bills and equity instruments are classified as available–for–sale assets. For available–for–sale financial assets, the Group assesses at each balance sheet date whether there is objective evidence that a financial asset or group of financial assets are impaired. The amount of the loss is measured as the difference between the asset‟s acquisition cost less principal repayments and amortisation and the current fair value. The amount of the impairment loss is recognised in profit or loss. This includes cumulative gains and losses previously recognised in other comprehensive income which are recycled from other comprehensive income to the income statement. If, in a subsequent period, the fair value of an instrument classified as available–for–sale increases and the increase can be objectively related to an event occurring after the impairment loss was recognised in profit or loss, the impairment loss is reversed through profit or loss. (n) Derivative financial instruments and hedge accounting The Group is authorised to undertake the following types of derivative financial instrument transactions for non–trading purposes: cross currency swaps, interest rate swaps, equity swaps, interest rate caps, forward rate agreements, options, foreign exchange contracts and similar instruments.
The Group‟s derivative activities are entered into for the purpose of matching or eliminating risk from potential movements in interest rates, foreign exchange rates and equity exposures inherent in the Group‟s assets, liabilities and positions. All derivative transactions are for economic hedging purposes and it is decided at the outset which position the derivative will be hedging. Derivatives are reviewed regularly for their effectiveness as hedges and corrective action taken, if appropriate. Derivatives are measured initially at fair value and subsequently remeasured to fair value. Fair values are obtained from quoted market prices in active markets and, where these are not available, from valuation techniques including discounted cash flow models and option pricing models. Where derivatives are not designated as part of a hedging relationship, changes in fair value are recorded in the income statement. Where derivatives are designated within hedging relationships, the treatment of the changes in fair value depends on the nature of the hedging relationship as explained below. Hedge accounting is used for derivatives designated in this way provided certain criteria are met. The Group documents at the inception of the hedge relationship the link between the hedging instrument and the hedged item as well as its risk management objective and strategy for undertaking various hedge transactions. The Group also documents its assessment both at hedge inception and on an ongoing basis of whether the derivatives used in hedging transactions are highly effective in offsetting changes in the fair values or cash flows of hedged items. The Group designates certain derivatives as either: Cash flow hedges A cash flow hedge is used to hedge exposures to variability in cash flows, such as variable rate financial assets and liabilities. The effective portion of changes in the derivative fair value is recognised in other comprehensive income, and recycled to the income statement in the periods when the hedged item will affect profit and loss. Interest rate derivatives designated as cash flow hedges primarily hedge the exposure to cash flow vulnerability from forecast loans and advances to customers. The fair value gain or loss relating to the ineffective portion is recognised immediately in profit or loss. Fair value hedges A fair value hedge is used to hedge exposures to variability in the fair value of financial assets and liabilities, such as fixed rate loans. Changes in fair value of derivatives that are designated and qualify as fair value hedges are recorded in the income statement, together with any changes in the fair value of the hedged asset or liability that are attributable to the hedged risk. If the hedge no longer meets the criteria for hedge accounting, the adjustment to the carrying amount of the hedged item is amortised to the income statement over the period to maturity. The most frequently used fair value hedges are:
hedging the interest rate risk of a portfolio of prepayable fixed rate assets with interest rate derivatives. This solution is used to establish a macro fair value hedge for derivatives hedging fixed rate mortgages;
hedging the interest rate risk of a portfolio of fixed rate liabilities with interest rate derivatives. This solution is used to establish a macro fair value hedge for derivatives hedging fixed rate savings;
hedging the interest rate risk of a portfolio of non–prepayable fixed rate assets with interest rate derivatives. This solution is used to establish a macro fair value hedge for fixed rate investments; and
hedging the interest rate and foreign currency exchange risk of non–prepayable, foreign currency denominated fixed rate assets or liabilities on a one–for–one basis with fixed/floating or floating/fixed cross currency interest rate swaps.
(o) Securitisation transactions Certain Group companies have issued debt securities in order to finance specific loans and advances to customers. Both the debt securities in issue and the loans and advances to customers remain on the Group balance sheet within the appropriate balance sheet headings unless:
a fully proportional share of all or of specifically identified cash flows have been transferred to the holders of the debt securities, in which case that proportion of the assets are derecognised;
substantially all the risks and rewards associated with the assets have been transferred, in which case the assets are fully derecognised; and
a significant proportion of the risks and rewards have been transferred, in which case the assets are recognised only to the extent of the Group‟s continuing involvement.
The Group has also entered into self–issuance of securitised debt which may be used as collateral for repurchase or similar transactions. Investments in self–issued debt and the equivalent deemed loan, together with the related income, expense and cash flows, are eliminated on consolidation in the financial statements. Debt securities in issue Issued securities are classified as liabilities where the contractual arrangements result in the Group having an obligation to deliver either cash or another financial asset to the security holder, or to exchange financial instruments under conditions that are potentially unfavourable to the Group. Issued securities are classified as equity where they meet the definition of equity and confer a residual interest in the Group‟s assets on the holder of the securities. Financial liabilities are carried at amortised cost using the effective interest rate method (see policy (j)). Equity instruments are initially recognised at net proceeds, after deducting transaction costs and any related income tax. Appropriations to holders of equity securities are deducted from equity, net of any related income tax, as they become irrevocably due to the holders of the securities. Securitisation is a means used by the Group to fund an element of its mortgage portfolio. These securitised advances are subject to non–recourse finance arrangements. These advances have been transferred at their principal value to Special Purpose Vehicles (SPV) and have been funded through the issue of amortising mortgage backed securities to investors. As discussed in note 1.5, the Group controls the securitisation SPVs and therefore consolidates the assets and liabilities of the securitisation SPVs, on a line by line basis. (p) Business combinations Business combinations are accounted for using the acquisition method as at the acquisition date, being when control is transferred to the Group. Control is having the power over an investee, exposure or rights to variable returns from its involvement with the investee and the ability to use its power to affect those returns. The Group measures goodwill at the acquisition date as the fair value of the consideration transferred less the fair value of the net identifiable assets acquired and liabilities assumed. When the excess is negative, the negative goodwill is recognised immediately in profit or loss. The consideration transferred does not include amounts related to the settlement of pre–existing relationships. Such amounts are generally recognised in profit or loss. Transaction costs, other than those associated with the issue of debt or equity securities, that the Group incurs in connection with a business combination are expensed as incurred. Any contingent consideration payable is measured at fair value at the acquisition date. If the contingent consideration is classified as equity, then it is not remeasured and settlement is accounted within equity. Otherwise, subsequent changes in the fair value of the contingent consideration are recognised in profit or loss. (q) Intangible assets and amortisation Intangible assets purchased separately from a business combination are capitalised at their cost and amortised from the date from which they become available for use over their useful economic life which is generally 3 to 10 years. Intangible assets acquired as part of an acquisition are capitalised at their fair value where this can be measured reliably in accordance with IFRS 13 „Fair Value Measurement‟. Expenditure incurred in relation to scoping, planning and researching the build of an asset as part of a project is expensed as incurred. Development expenditure incurred on a project is capitalised only if the following criteria are met:
an asset is created that can be identified;
it is probable that the asset created will generate future economic benefits; and the development cost of the asset can be measured reliably.
Following the initial recognition of development expenditure, the cost is amortised over the estimated useful lives of the assets created. Amortisation commences on the date that the asset is brought into use. Internally generated intangible assets relate to computer software and core banking platforms. Computer software Costs incurred in acquiring and developing computer software for internal use are capitalised as intangible assets where the software leads to the creation of an identifiable non–monetary asset and it is probable that the expected future economic benefits that are attributable to the asset will flow to the Group from its use for a period of over one year. The software is classified as an intangible asset where it is not an integral part of the related hardware and amortised over its estimated useful life on a straight line basis which is generally 3 to 10 years. Costs associated with maintaining software are expensed as they are incurred. Core deposit intangible The core deposit intangible was recognised on acquisition of Northern Rock plc (now renamed Virgin Money plc). It was recognised in respect of the intrinsic value of the retail savings book acquired. This will be amortised over its remaining useful life of one year. Goodwill Purchased goodwill (representing the excess of the fair value of the consideration given over the fair value of the separable net assets acquired) arising on business combinations in respect of acquisitions since 1 January 1998 is capitalised. Positive goodwill is held on the balance sheet and tested for impairment annually. Core banking platforms Core banking platforms primarily represent the construction of core operating platforms, which are internally generated. Core banking platforms are amortised on a straight line basis over 3 to 10 years. Impairment of intangible assets Intangible assets are assessed for indications of impairment at each balance sheet date, or more frequently where required by events or changes in circumstances. If indications of impairment are found, these assets are subject to an impairment review. The impairment review compares the carrying value of the assets with their recoverable amounts, which are defined as the higher of the fair value less costs to sell and their value in use. Fair value less costs to sell is the amount at which the asset could be sold in a binding agreement in an arm‟s length transaction. Value in use is calculated as the discounted cash flows generated as a result of the asset‟s continued use including those generated by its ultimate disposal, discounted at a market rate of interest on a pre–tax basis. Where impairments are indicated, the carrying values of intangible assets are written down by the amount of the impairment and the charge is recognised in the income statement in the period in which it occurs. A previously recognised impairment charge on a fixed asset may be reversed in full or in part where a change in circumstances leads to a change in the estimates used to determine its recoverable amount. The carrying value of the intangible asset will only be increased to the carrying value at which it would have been held had the impairment not been recognised. (r) Tangible fixed assets and depreciation Tangible fixed assets are stated at cost less accumulated depreciation and provision for impairment, as appropriate. Cost includes the original purchase price of the asset and the costs attributable to bringing the asset to its working condition for its intended use. Additions and subsequent expenditure are included in the asset‟s carrying value or are recognised as a separate asset only when they improve the expected future economic benefits to be derived from the asset. All other repairs and maintenance are charged to the income statement in the period in which they are incurred. Depreciation is provided using the straight line method to allocate costs less residual values over estimated useful lives, as follows:
Freehold property 50–100 years
Leasehold property Unexpired period of the lease
Plant and leasehold improvements 5–30 years
Computer equipment 3–5 years
Office equipment 3–10 years
Motor vehicles 4 years
The residual values and useful lives of assets are reviewed, and adjusted if appropriate, at each balance sheet date. Where the cost of freehold land can be identified separately from buildings, the land is not depreciated. Tangible fixed assets are subject to impairment testing, as appropriate. Impairment of tangible fixed assets Tangible fixed assets are assessed for indications of impairment at each balance sheet date, or more frequently where required by events or changes in circumstances. If indications of impairment are found, these assets are subject to an impairment review. The impairment review compares the carrying value of the assets with their recoverable amount, which are defined as the higher of the fair value less costs to sell and their value in use. Fair value less costs to sell is the amount at which the asset could be sold in a binding agreement in an arm‟s length transaction. Value in use is calculated as the discounted cash flows generated as a result of the asset‟s continued use including those generated by its ultimate disposal, discounted at a market rate of interest on a pre–tax basis. Where impairments are indicated, the carrying values of fixed assets are written down by the amount of the impairment and the charge is recognised in the income statement in the period in which it occurs. A previously recognised impairment charge on a fixed asset may be reversed in full or in part where a change in circumstances leads to a change in the estimates used to determine its recoverable amount. The carrying value of the fixed asset will only be increased to the carrying value at which it would have been held had the impairment not been recognised. (s) Deferred tax Deferred tax is recognised in respect of temporary differences between the carrying amounts of assets and liabilities for financial reporting purposes and the amounts used for taxation purposes. Deferred tax is measured at the tax rates that are expected to be applied to temporary differences when they reverse, based on the laws that have been enacted or substantively enacted by the reporting date. Deferred tax assets are recognised for unused tax losses, tax credits and deductible temporary differences, to the extent that it is probable that future taxable profits will be available against which they can be utilised. Deferred tax assets are reviewed at each reporting date and are reduced to the extent that it is no longer probable that the related tax benefit will be realised. (t) Other assets Other assets include prepayments and other amounts the Group is due to receive from third parties in the normal course of business. (u) Deposits from banks Deposits by banks are initially measured at fair value, which is normally the proceeds received net of any directly attributable transaction costs incurred. Subsequent measurement is at amortised cost, using the effective interest rate method. (v) Customer deposits Customer deposits are initially measured at fair value, which is normally the proceeds received. Subsequent measurement is at amortised cost, using the effective interest rate method. (w) Provisions
Provisions are recognised for present obligations arising from past events where it is more likely than not that an outflow of resources will be required to settle the obligations and they can be estimated reliably. A provision for bank levies is recognised when the condition that triggers the payment of the levy is met. If a levy obligation is subject to a minimum activity threshold so that the obligating event is reaching a minimum activity, then a provision is recognised when that minimum activity threshold is reached. (x) Other liabilities Deferred income represents amounts received in advance of the Group providing services, and will be recognised as income in profit or loss when the services have been provided. Other creditors represent amounts the Group is due to pay to third parties in the normal course of business. These include expense accruals, which have been incurred, but not yet billed. Accrued expenses are amounts that the Group is due to pay to third parties in the normal course of business. (y) Share capital and share premium Share capital The financial instruments issued by the Company are treated as equity (i.e. forming part of shareholders‟ funds) only to the extent that they meet the following two conditions:
they include no contractual obligations upon the Company to deliver cash or other financial assets or to exchange financial assets or financial liabilities with another party under conditions that are potentially unfavourable to the Group; and
where the instrument will or may be settled in the Company‟s own equity instruments, it is either a non–derivative that includes no obligation to deliver a variable number of the Company‟s own equity instruments or is a derivative that will be settled by the Company exchanging a fixed amount of cash or other financial assets for a fixed number of its own equity instruments.
To the extent that this definition is not met, the proceeds of issue are classified as a financial liability. Share issue costs Incremental costs directly attributable to the issue of new shares or options are shown in equity as a deduction, net of tax, from the proceeds. Dividends and appropriations Dividends are recognised in equity in the period in which they are approved by the Company‟s shareholders or paid. Share premium Share premium substantially represents the aggregate of all amounts that have ever been paid above par value to the Company when it has issued ordinary and non–voting Ordinary Shares. Certain expenses in relation to the issue of share capital can be offset against the share premium account. These expenses must be the incremental expenses arising on issue of the shares. (z) Other equity instruments Issued financial instruments are recognised as equity where there is no contractual obligation to deliver either cash or another financial asset. The proceeds are included in equity, net of transaction costs. Dividends and other returns to equity holders are treated as a deduction from equity. (aa) Other reserves Available–for–sale reserve The available–for–sale reserve represents the unrealised change in the fair value of available–for–sale
investments since initial recognition. Cash flow hedge reserve For derivatives designated in a cash flow hedge, the effective portion of changes in fair value is recognised in the cash flow hedge reserve and recycled to profit or loss in the periods when the hedged item will affect profit or loss. (ab) Contingent liabilities Contingent liabilities are possible obligations whose existence depends upon the outcome of uncertain future events or are present obligations where the outflows of resources are uncertain or cannot be reliably measured. Contingent liabilities are not recognised in the financial statements but are disclosed unless they are remote. (ac) Fair value of financial assets and liabilities Fair value is defined as the price that would be received to sell an asset or paid to transfer a liability in an orderly transaction between market participants at the measurement date in the principal, or in its absence, the most advantageous market to which the Group has access at that date. The fair value of a liability reflects its non–performance risk. For the majority of instruments, fair value is determined with reference to quoted prices in an active market. A market is regarded as active if transactions for the asset or liability take place with sufficient frequency and volume to provide pricing information on an ongoing basis. Refer to note 34 for a description of different levels within the fair value hierarchy. Levels are reviewed at each balance sheet date and this determines where transfers between levels are required. Where quoted prices are not available, fair value is based upon cash flow models, which use wherever possible independently sourced observable market parameters such as interest rate yield curves, currency rates and option volatilities. The chosen valuation technique incorporates all the factors that market participants would take into account in pricing a transaction and is discounted at a risk free rate. The best evidence of the fair value of a financial instrument at initial recognition is normally the transaction price – i.e. the fair value of consideration given or received. The Group does not apply a credit valuation adjustment (CVA) or debit valuation adjustment (DVA) to reflect the credit risk of its derivative exposures as the Group‟s portfolio is fully collateralised. If an asset or a liability measured at fair value has a bid price and an ask price, the Group measures assets and long positions at bid price and liabilities and short positions at an ask price. Portfolios of financial assets and financial liabilities that are exposed to market risk and credit risk that are managed by the Group on the basis of the net exposure to either market or credit risk, are measured on the basis of a price that would be received to sell a net long position (or transferred to sell a net short position) for a particular risk exposure. Those portfolio risk adjustments are allocated to the individual assets and liabilities on the basis of the relative risk adjustment of each of the individual instruments in the portfolio. 1.10 Critical estimates and judgements The preparation of financial statements in conformity with IFRS requires management to make judgements, estimates and assumptions that affect the application of accounting policies and the reported amounts of assets and liabilities at the date of the financial statements and the reported amounts of income and expenses during the reporting period. Although these estimates are based on management‟s best knowledge of the amount, actual results ultimately may differ from those estimates. The areas involving a higher degree of judgement or complexity, or where assumptions and estimates are significant to the 2015 financial statements were as follows: (a) Effective interest rates IAS 39 requires interest earned from mortgages and credit cards to be measured under the effective interest rate method. Management must therefore use judgement to estimate the expected life of each
instrument and hence the expected future cash flows relating to it. The accuracy of the effective interest rate would therefore be affected by unexpected market movements resulting in altered customer behaviour, inaccuracies in the models or incorrect assumptions. If the estimated life of secured loans were increased or reduced by one month, the value of such loans on the balance sheet would be increased or decreased by £3.6 million (2014: £2.5 million) and £3.7 million (2014: £2.6 million) respectively. If the estimated life of credit cards were increased or reduced by one month, the value of such assets on the balance sheet would be increased or decreased by £1.1 million (2014: £0.6 million) and £1.1 million (2014: £0.5 million) respectively. (b) Impairment of loans and receivables Individual impairment losses on secured loans and advances are calculated based on an individual valuation of the underlying asset. Collective impairment losses on loans and advances are calculated using a statistical model. The key assumptions used in the model are the probability of default; the probability of this default resulting in possession and/or write off; and the subsequent loss incurred. These key assumptions are monitored regularly to ensure the impairment allowance is entirely reflective of the current portfolio. The accuracy of the impairment calculation would therefore be affected by unanticipated changes to the economic environment and assumptions which differ from actual outcomes. For mortgage loan receivables to the extent that:
the loss given default differs by +/– 10%, for example if the loss given default is 10% then it is increased to 11%, the impairment allowance would be an estimated £0.3 million (2014: £0.2 million) higher or £0.3 million (2014: £0.2 million) lower respectively;
the level of house prices differs by +/– 10%, for example a property value of £100,000 is increased to £110,000, the impairment allowance would be an estimated £1.3 million (2014: £0.7 million) lower or £3.0 million (2014: £3.4 million) higher respectively;
the emergence period of 6 months differs by +/– 3 months, the impairment allowance would be an estimated £0.2 million (2014: £0.1 million) higher or £0.2 million (2014: £0.1 million) lower respectively.
For credit card receivables, to the extent that the loss given default differs by +/– 10%, the impairment allowance would be an estimated £2.9 million (2014: £2.7 million) higher or £2.9 million (2014: £2.7 million) lower respectively, and to the extent the emergence period of 6 months differs by +/–3 months, the impairment allowance would be an estimated £3.8 million (2014: £2.0 million) higher or £3.8 million (2014: £2.0 million) lower respectively. (c) Capitalisation and impairment of intangibles Intangibles are initially recognised when they are separable or arise from contractual or other legal rights, the cost can be measured reliably and, in the case of intangible assets not acquired in a business combination, where it is probable that future economic benefits attributable to the assets will flow from their use. Management review and monitor the capitalisation of significant project development costs on a regular basis to ensure that they meet the recognition criteria for capitalisation of an intangible asset and to ensure the costs are directly attributable to the individual projects where an asset is under construction. A review of capitalisation of intangibles has been undertaken to ensure these conditions have been met. A review of intangible assets which are not yet in use for indications of impairment is undertaken at each reporting date. If there are indicators of impairment, an estimate of the recoverable amount is made. The recoverable amount of the asset is the higher of its fair value less costs to sell and its value in use. Value in use is calculated by discounting the future cash flows (both costs to complete and benefits post completion) generated from the continuing use of the asset. If the carrying value of the asset is less than the greater of the value in use and the fair value less costs to sell, an impairment charge is recognised. Through their assessment of intangible assets and review for impairment indicators Management have not identified any assets that have an impairment, therefore a £nil impairment charge has been recognised (2014: £nil). (d) Deferred tax
Taxation involves estimation techniques to assess the liability in terms of possible outcomes. The assessment of the recoverability or otherwise of deferred tax assets is based mainly on a determination of whether the relevant entity will generate sufficient profits within 5 years to realise the deferred tax assets. This is reviewed at each reporting date by the Directors with a detailed exercise conducted to establish the validity of profit forecasts and other relevant information including timescales over which the profits are expected to arise and the deferred tax assets will reverse. Deferred tax is determined using tax rates that have been enacted or substantially enacted by the balance sheet date and which are expected to apply when the related deferred tax assets are realised or the deferred tax liabilities are settled. The judgement required in the assessment of whether to recognise deferred tax assets is set out in policy (s). A deferred taxation asset in respect of the subsidiary Virgin Money plc was not recognised at acquisition on 1 January 2012 but subsequently recognised because in the period since acquisition, Management have taken certain actions to have greater certainty about the profitability going forward. Based on their interpretation of the timing and level of reversal of existing taxable temporary differences, in line with relevant accounting standards, the Directors conclude that a net deferred tax asset of £38.0 million (2014: £50.2 million) should be recognised at the balance sheet date. (e) Fair value of financial assets and liabilities Management must use judgement and estimates calculating fair value where not all necessary inputs are observable or where factors specific to the Group‟s holdings need to be considered. The accuracy of the fair value calculations would therefore be affected by unexpected market movements, inaccuracies within the models used compared to actual outcomes and incorrect assumptions. For example, if Management were to use a tightening in the credit spread of ten basis points, the fair values of liabilities (including derivatives) would increase from the reported fair values by £25.7 million (2014: £23.3 million). Estimates and judgements significant to the 2014 financial statements The following were considered as estimates and judgements significant to the financial statements for the year ended 31 December 2014: Fair value of share based payments The fair values of share awards granted in 2014 were calculated using statistical models, requiring application of management judgement on the inputs to these models. The nature of schemes with awards granted in 2015 are such that there is a reduced degree of judgement and complexity in calculations for the 2015 financial statements. Tax uncertainty The degree of judgement and uncertainty involved in determining the Group‟s provision for income taxation, deferred taxation assets and liabilities and potential taxation liabilities was more significant in 2014. The ultimate outcome of certain tax matters is considered more certain. Disposal group classification and measurement The Group fully disposed of its interests in Church House Trust (CHT) on 30 November 2014 and there are no disposal group assets or liabilities recognised at 31 December 2014 or 31 December 2015. Provisions and contingent liabilities Provision values and determining whether to recognise contingent liabilities are both based on the best information available at the reporting date, and the degree of judgement and uncertainty is not considered as significant as in 2014. Additional Northern Rock consideration The final payment to HM Treasury in respect of additional consideration of £50.0 million was made in 2014. With no further payments to come, no estimation uncertainty exists. Additional information on the above estimates and judgements is provided in the Virgin Money Group Annual Report and Accounts 2014. Note 2: Operating segments
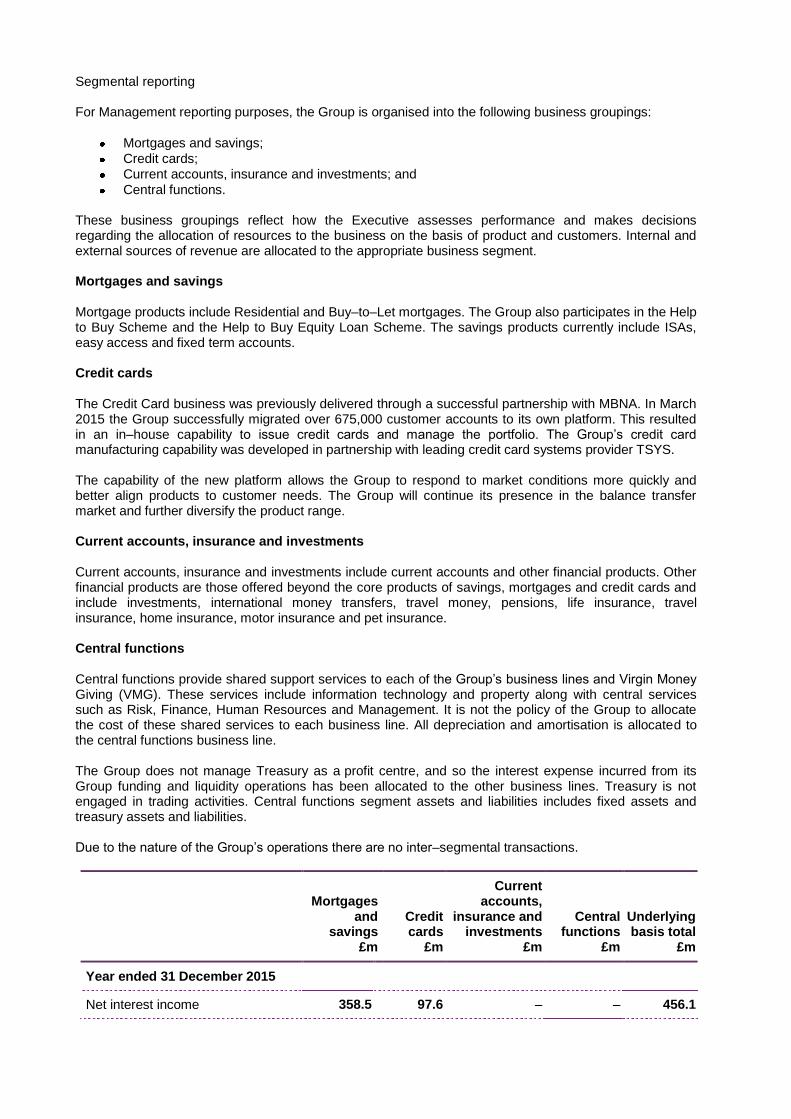
Segmental reporting For Management reporting purposes, the Group is organised into the following business groupings:
Mortgages and savings;
Credit cards; Current accounts, insurance and investments; and
Central functions.
These business groupings reflect how the Executive assesses performance and makes decisions regarding the allocation of resources to the business on the basis of product and customers. Internal and external sources of revenue are allocated to the appropriate business segment. Mortgages and savings Mortgage products include Residential and Buy–to–Let mortgages. The Group also participates in the Help to Buy Scheme and the Help to Buy Equity Loan Scheme. The savings products currently include ISAs, easy access and fixed term accounts. Credit cards The Credit Card business was previously delivered through a successful partnership with MBNA. In March 2015 the Group successfully migrated over 675,000 customer accounts to its own platform. This resulted in an in–house capability to issue credit cards and manage the portfolio. The Group‟s credit card manufacturing capability was developed in partnership with leading credit card systems provider TSYS. The capability of the new platform allows the Group to respond to market conditions more quickly and better align products to customer needs. The Group will continue its presence in the balance transfer market and further diversify the product range. Current accounts, insurance and investments Current accounts, insurance and investments include current accounts and other financial products. Other financial products are those offered beyond the core products of savings, mortgages and credit cards and include investments, international money transfers, travel money, pensions, life insurance, travel insurance, home insurance, motor insurance and pet insurance. Central functions Central functions provide shared support services to each of the Group‟s business lines and Virgin Money Giving (VMG). These services include information technology and property along with central services such as Risk, Finance, Human Resources and Management. It is not the policy of the Group to allocate the cost of these shared services to each business line. All depreciation and amortisation is allocated to the central functions business line. The Group does not manage Treasury as a profit centre, and so the interest expense incurred from its Group funding and liquidity operations has been allocated to the other business lines. Treasury is not engaged in trading activities. Central functions segment assets and liabilities includes fixed assets and treasury assets and liabilities. Due to the nature of the Group‟s operations there are no inter–segmental transactions.
Mortgages
and savings
£m
Credit cards
£m
Current accounts,
insurance and investments
£m
Central functions
£m
Underlying basis total
£m
Year ended 31 December 2015
Net interest income 358.5 97.6 – – 456.1
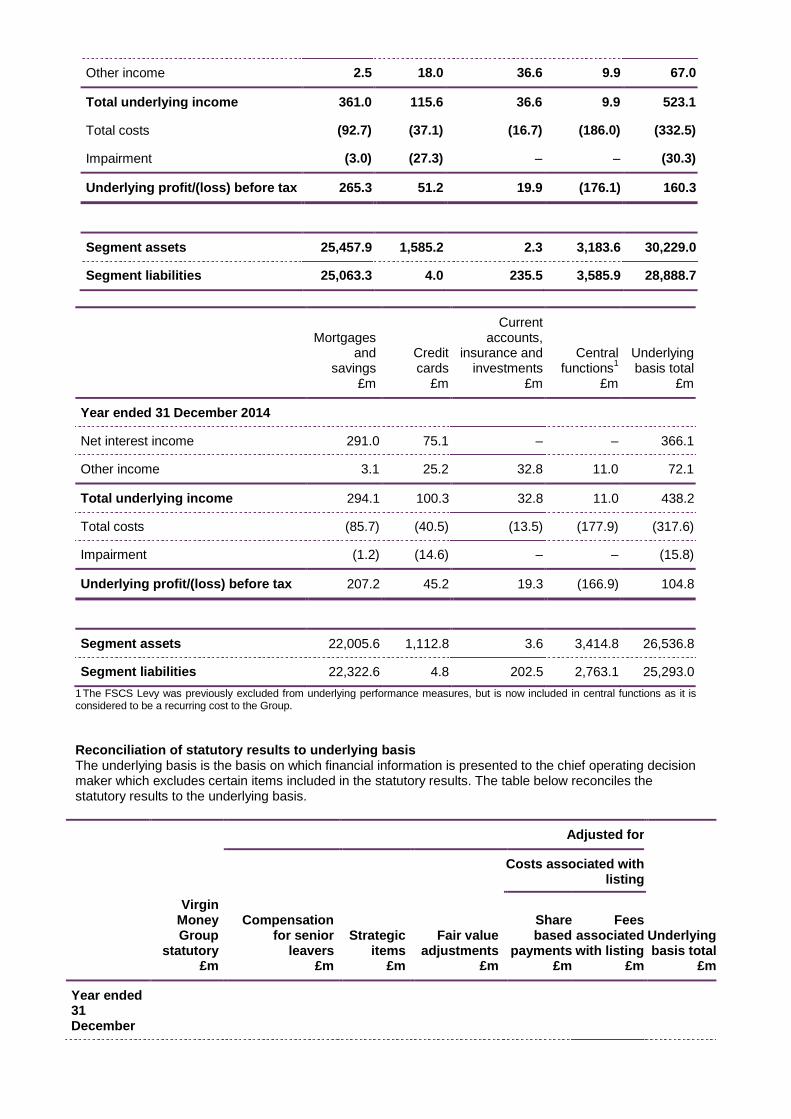
Other income 2.5 18.0 36.6 9.9 67.0
Total underlying income 361.0 115.6 36.6 9.9 523.1
Total costs (92.7) (37.1) (16.7) (186.0) (332.5)
Impairment (3.0) (27.3) – – (30.3)
Underlying profit/(loss) before tax 265.3 51.2 19.9 (176.1) 160.3
Segment assets 25,457.9 1,585.2 2.3 3,183.6 30,229.0
Segment liabilities 25,063.3 4.0 235.5 3,585.9 28,888.7
Mortgages
and savings
£m
Credit cards
£m
Current accounts,
insurance and investments
£m
Central functions
1
£m
Underlying basis total
£m
Year ended 31 December 2014
Net interest income 291.0 75.1 – – 366.1
Other income 3.1 25.2 32.8 11.0 72.1
Total underlying income 294.1 100.3 32.8 11.0 438.2
Total costs
(85.7) (40.5) (13.5) (177.9) (317.6)
Impairment (1.2) (14.6) – – (15.8)
Underlying profit/(loss) before tax 207.2 45.2 19.3 (166.9) 104.8
Segment assets 22,005.6 1,112.8 3.6 3,414.8 26,536.8
Segment liabilities 22,322.6 4.8 202.5 2,763.1 25,293.0
1 The FSCS Levy was previously excluded from underlying performance measures, but is now included in central functions as it is considered to be a recurring cost to the Group.
Reconciliation of statutory results to underlying basis The underlying basis is the basis on which financial information is presented to the chief operating decision maker which excludes certain items included in the statutory results. The table below reconciles the statutory results to the underlying basis.
Virgin Money Group
statutory £m
Adjusted for
Costs associated with
listing
Underlying basis total
£m
Compensation
for senior leavers
£m
Strategic items
£m
Fair value adjustments
£m
Share based
payments £m
Fees
associated with listing
£m
Year ended 31 December
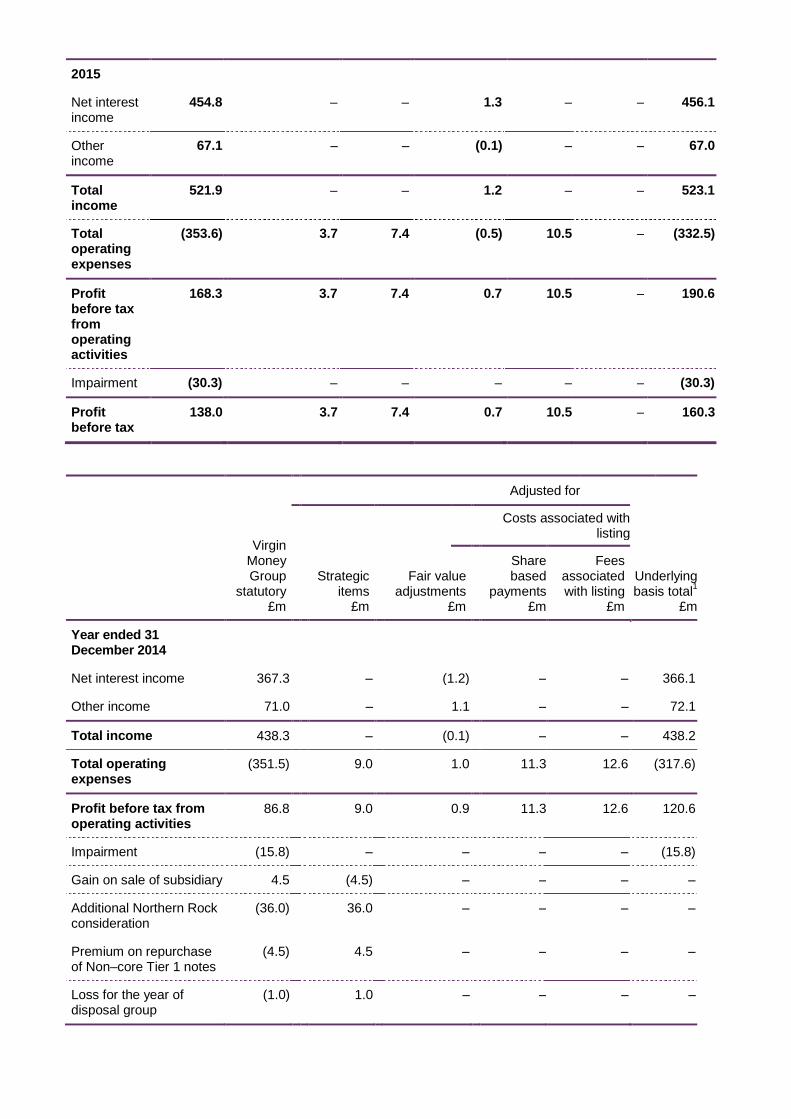
2015
Net interest income
454.8 – – 1.3 – – 456.1
Other income
67.1 – – (0.1) – – 67.0
Total income
521.9 – – 1.2 – – 523.1
Total operating expenses
(353.6) 3.7 7.4 (0.5) 10.5 – (332.5)
Profit before tax from operating activities
168.3 3.7 7.4 0.7 10.5 – 190.6
Impairment (30.3) – – – – – (30.3)
Profit before tax
138.0 3.7 7.4 0.7 10.5 – 160.3
Virgin Money Group
statutory £m
Adjusted for
Costs associated with
listing
Strategic
items £m
Fair value
adjustments £m
Share based
payments £m
Fees associated with listing
£m
Underlying basis total
1
£m
Year ended 31 December 2014
Net interest income 367.3 – (1.2) – – 366.1
Other income 71.0 – 1.1 – – 72.1
Total income 438.3 – (0.1) – – 438.2
Total operating expenses
(351.5) 9.0 1.0 11.3 12.6 (317.6)
Profit before tax from operating activities
86.8 9.0 0.9 11.3 12.6 120.6
Impairment (15.8) – – – – (15.8)
Gain on sale of subsidiary 4.5 (4.5) – – – –
Additional Northern Rock consideration
(36.0) 36.0 – – – –
Premium on repurchase of Non–core Tier 1 notes
(4.5) 4.5 – – – –
Loss for the year of disposal group
(1.0) 1.0 – – – –
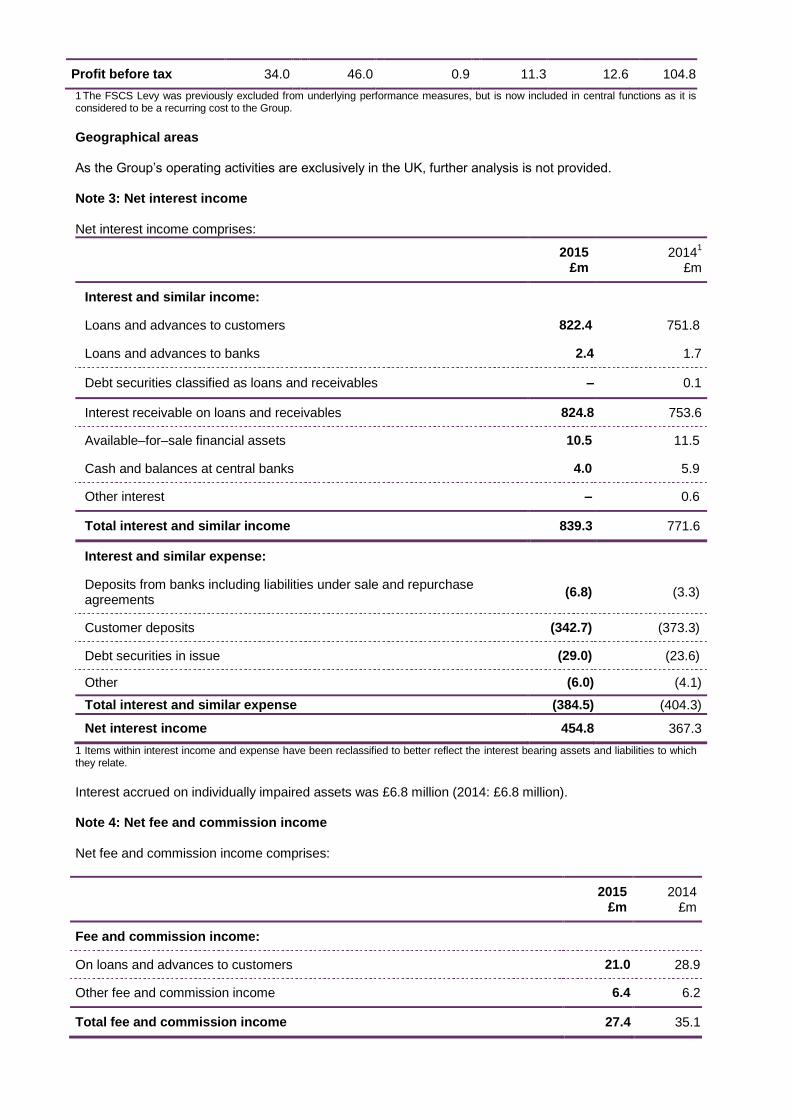
Profit before tax 34.0 46.0 0.9 11.3 12.6 104.8
1 The FSCS Levy was previously excluded from underlying performance measures, but is now included in central functions as it is considered to be a recurring cost to the Group.
Geographical areas As the Group‟s operating activities are exclusively in the UK, further analysis is not provided. Note 3: Net interest income Net interest income comprises:
2015
£m 2014
1
£m
Interest and similar income:
Loans and advances to customers 822.4 751.8
Loans and advances to banks 2.4 1.7
Debt securities classified as loans and receivables – 0.1
Interest receivable on loans and receivables 824.8 753.6
Available–for–sale financial assets 10.5 11.5
Cash and balances at central banks 4.0 5.9
Other interest – 0.6
Total interest and similar income 839.3 771.6
Interest and similar expense:
Deposits from banks including liabilities under sale and repurchase agreements
(6.8) (3.3)
Customer deposits (342.7) (373.3)
Debt securities in issue (29.0) (23.6)
Other (6.0) (4.1)
Total interest and similar expense (384.5) (404.3)
Net interest income 454.8 367.3
1 Items within interest income and expense have been reclassified to better reflect the interest bearing assets and liabilities to which they relate.
Interest accrued on individually impaired assets was £6.8 million (2014: £6.8 million). Note 4: Net fee and commission income Net fee and commission income comprises:
2015
£m 2014
£m
Fee and commission income:
On loans and advances to customers 21.0 28.9
Other fee and commission income 6.4 6.2
Total fee and commission income 27.4 35.1
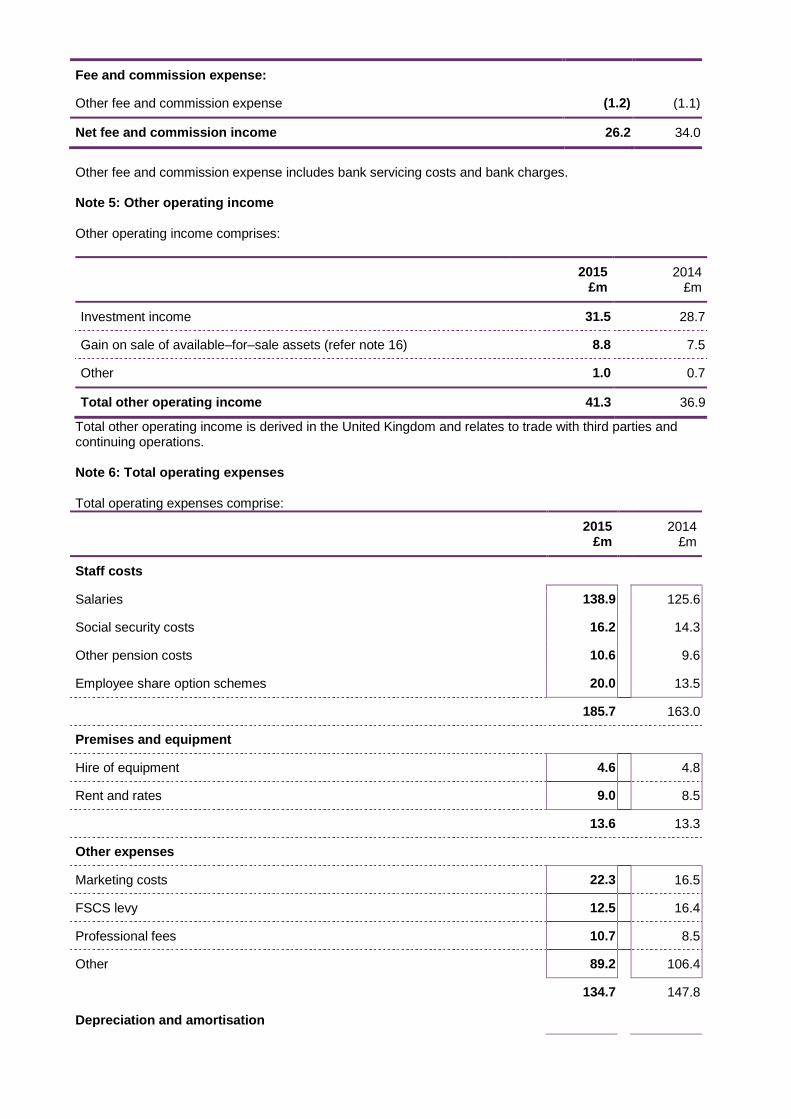
Fee and commission expense:
Other fee and commission expense (1.2) (1.1)
Net fee and commission income 26.2 34.0
Other fee and commission expense includes bank servicing costs and bank charges. Note 5: Other operating income Other operating income comprises:
2015
£m 2014
£m
Investment income 31.5 28.7
Gain on sale of available–for–sale assets (refer note 16) 8.8 7.5
Other 1.0 0.7
Total other operating income 41.3 36.9
Total other operating income is derived in the United Kingdom and relates to trade with third parties and continuing operations. Note 6: Total operating expenses Total operating expenses comprise:
2015
£m 2014
£m
Staff costs
Salaries 138.9 125.6
Social security costs 16.2 14.3
Other pension costs 10.6 9.6
Employee share option schemes 20.0 13.5
185.7 163.0
Premises and equipment
Hire of equipment 4.6 4.8
Rent and rates 9.0 8.5
13.6 13.3
Other expenses
Marketing costs 22.3 16.5
FSCS levy 12.5 16.4
Professional fees 10.7 8.5
Other 89.2 106.4
134.7 147.8
Depreciation and amortisation
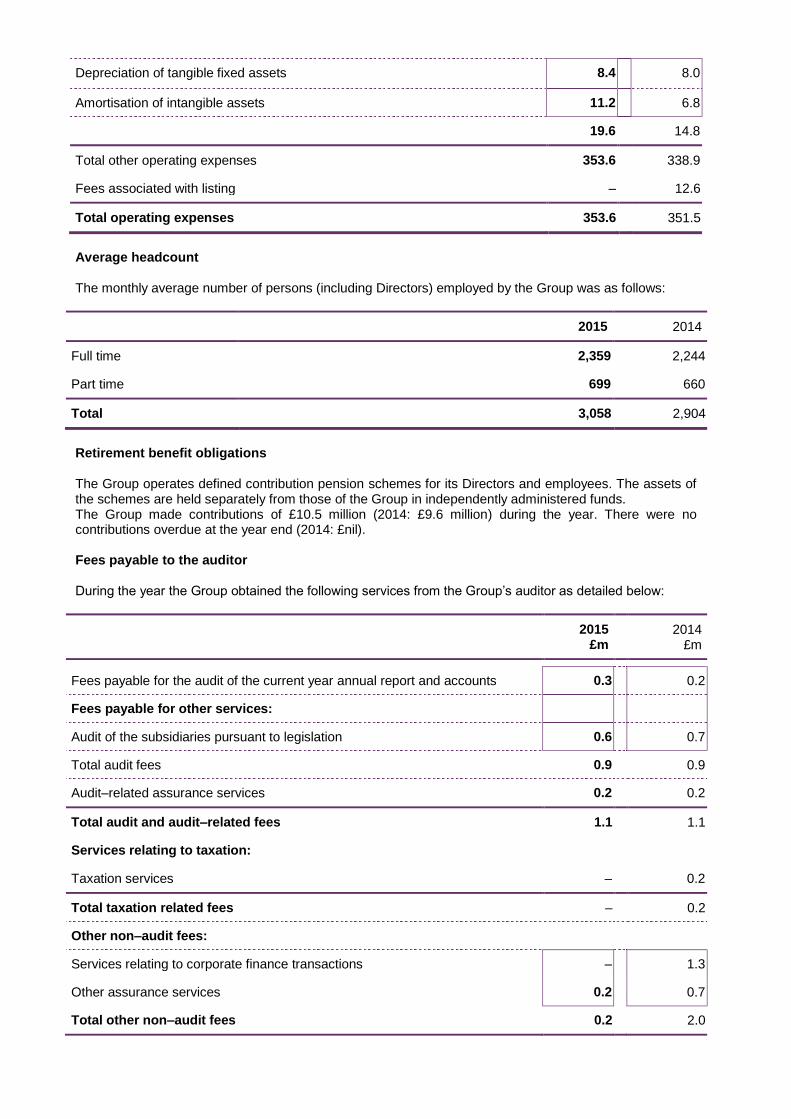
Depreciation of tangible fixed assets 8.4 8.0
Amortisation of intangible assets 11.2 6.8
19.6 14.8
Total other operating expenses 353.6 338.9
Fees associated with listing – 12.6
Total operating expenses 353.6 351.5
Average headcount The monthly average number of persons (including Directors) employed by the Group was as follows:
2015 2014
Full time 2,359 2,244
Part time 699 660
Total 3,058 2,904
Retirement benefit obligations The Group operates defined contribution pension schemes for its Directors and employees. The assets of the schemes are held separately from those of the Group in independently administered funds. The Group made contributions of £10.5 million (2014: £9.6 million) during the year. There were no contributions overdue at the year end (2014: £nil). Fees payable to the auditor During the year the Group obtained the following services from the Group‟s auditor as detailed below:
2015
£m 2014
£m
Fees payable for the audit of the current year annual report and accounts 0.3 0.2
Fees payable for other services:
Audit of the subsidiaries pursuant to legislation 0.6 0.7
Total audit fees 0.9 0.9
Audit–related assurance services 0.2 0.2
Total audit and audit–related fees 1.1 1.1
Services relating to taxation:
Taxation services – 0.2
Total taxation related fees – 0.2
Other non–audit fees:
Services relating to corporate finance transactions – 1.3
Other assurance services 0.2 0.7
Total other non–audit fees 0.2 2.0
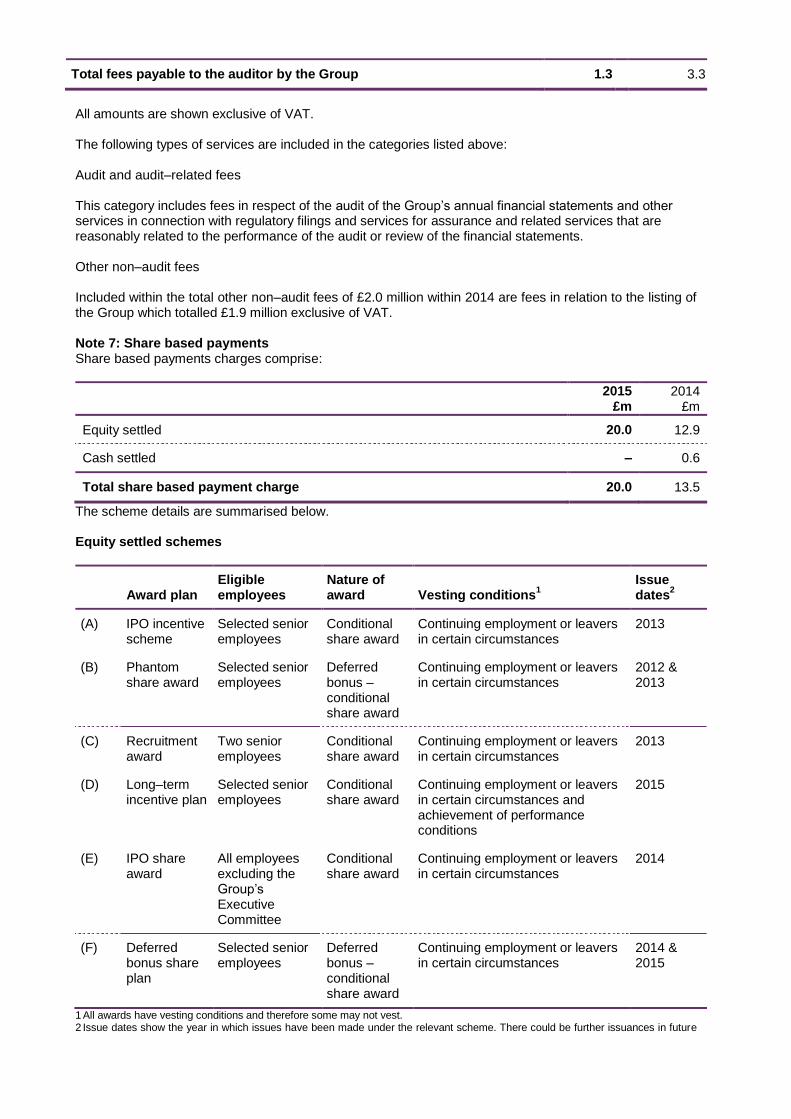
Total fees payable to the auditor by the Group 1.3 3.3
All amounts are shown exclusive of VAT. The following types of services are included in the categories listed above: Audit and audit–related fees This category includes fees in respect of the audit of the Group‟s annual financial statements and other services in connection with regulatory filings and services for assurance and related services that are reasonably related to the performance of the audit or review of the financial statements. Other non–audit fees Included within the total other non–audit fees of £2.0 million within 2014 are fees in relation to the listing of the Group which totalled £1.9 million exclusive of VAT. Note 7: Share based payments Share based payments charges comprise:
2015 £m
2014 £m
Equity settled 20.0 12.9
Cash settled – 0.6
Total share based payment charge 20.0 13.5
The scheme details are summarised below. Equity settled schemes
Award plan Eligible employees
Nature of award Vesting conditions
1
Issue dates
2
(A) IPO incentive scheme
Selected senior employees
Conditional share award
Continuing employment or leavers in certain circumstances
2013
(B) Phantom share award
Selected senior employees
Deferred bonus – conditional share award
Continuing employment or leavers in certain circumstances
2012 & 2013
(C) Recruitment award
Two senior employees
Conditional share award
Continuing employment or leavers in certain circumstances
2013
(D) Long–term incentive plan
Selected senior employees
Conditional share award
Continuing employment or leavers in certain circumstances and achievement of performance conditions
2015
(E) IPO share award
All employees excluding the Group‟s Executive Committee
Conditional share award
Continuing employment or leavers in certain circumstances
2014
(F) Deferred bonus share plan
Selected senior employees
Deferred bonus – conditional share award
Continuing employment or leavers in certain circumstances
2014 & 2015
1 All awards have vesting conditions and therefore some may not vest. 2 Issue dates show the year in which issues have been made under the relevant scheme. There could be further issuances in future
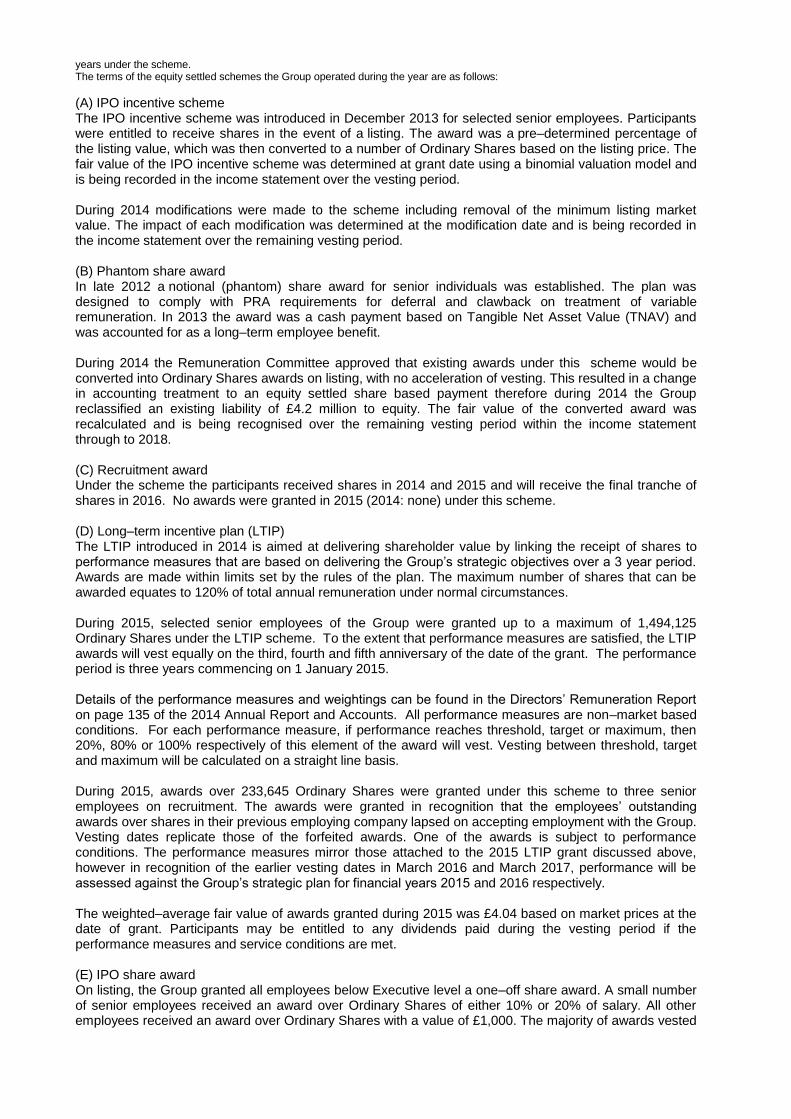
years under the scheme. The terms of the equity settled schemes the Group operated during the year are as follows:
(A) IPO incentive scheme The IPO incentive scheme was introduced in December 2013 for selected senior employees. Participants were entitled to receive shares in the event of a listing. The award was a pre–determined percentage of the listing value, which was then converted to a number of Ordinary Shares based on the listing price. The fair value of the IPO incentive scheme was determined at grant date using a binomial valuation model and is being recorded in the income statement over the vesting period. During 2014 modifications were made to the scheme including removal of the minimum listing market value. The impact of each modification was determined at the modification date and is being recorded in the income statement over the remaining vesting period. (B) Phantom share award In late 2012 a notional (phantom) share award for senior individuals was established. The plan was designed to comply with PRA requirements for deferral and clawback on treatment of variable remuneration. In 2013 the award was a cash payment based on Tangible Net Asset Value (TNAV) and was accounted for as a long–term employee benefit. During 2014 the Remuneration Committee approved that existing awards under this scheme would be converted into Ordinary Shares awards on listing, with no acceleration of vesting. This resulted in a change in accounting treatment to an equity settled share based payment therefore during 2014 the Group reclassified an existing liability of £4.2 million to equity. The fair value of the converted award was recalculated and is being recognised over the remaining vesting period within the income statement through to 2018. (C) Recruitment award Under the scheme the participants received shares in 2014 and 2015 and will receive the final tranche of shares in 2016. No awards were granted in 2015 (2014: none) under this scheme. (D) Long–term incentive plan (LTIP) The LTIP introduced in 2014 is aimed at delivering shareholder value by linking the receipt of shares to performance measures that are based on delivering the Group‟s strategic objectives over a 3 year period. Awards are made within limits set by the rules of the plan. The maximum number of shares that can be awarded equates to 120% of total annual remuneration under normal circumstances. During 2015, selected senior employees of the Group were granted up to a maximum of 1,494,125 Ordinary Shares under the LTIP scheme. To the extent that performance measures are satisfied, the LTIP awards will vest equally on the third, fourth and fifth anniversary of the date of the grant. The performance period is three years commencing on 1 January 2015. Details of the performance measures and weightings can be found in the Directors‟ Remuneration Report on page 135 of the 2014 Annual Report and Accounts. All performance measures are non–market based conditions. For each performance measure, if performance reaches threshold, target or maximum, then 20%, 80% or 100% respectively of this element of the award will vest. Vesting between threshold, target and maximum will be calculated on a straight line basis. During 2015, awards over 233,645 Ordinary Shares were granted under this scheme to three senior employees on recruitment. The awards were granted in recognition that the employees‟ outstanding awards over shares in their previous employing company lapsed on accepting employment with the Group. Vesting dates replicate those of the forfeited awards. One of the awards is subject to performance conditions. The performance measures mirror those attached to the 2015 LTIP grant discussed above, however in recognition of the earlier vesting dates in March 2016 and March 2017, performance will be assessed against the Group‟s strategic plan for financial years 2015 and 2016 respectively. The weighted–average fair value of awards granted during 2015 was £4.04 based on market prices at the date of grant. Participants may be entitled to any dividends paid during the vesting period if the performance measures and service conditions are met. (E) IPO share award On listing, the Group granted all employees below Executive level a one–off share award. A small number of senior employees received an award over Ordinary Shares of either 10% or 20% of salary. All other employees received an award over Ordinary Shares with a value of £1,000. The majority of awards vested
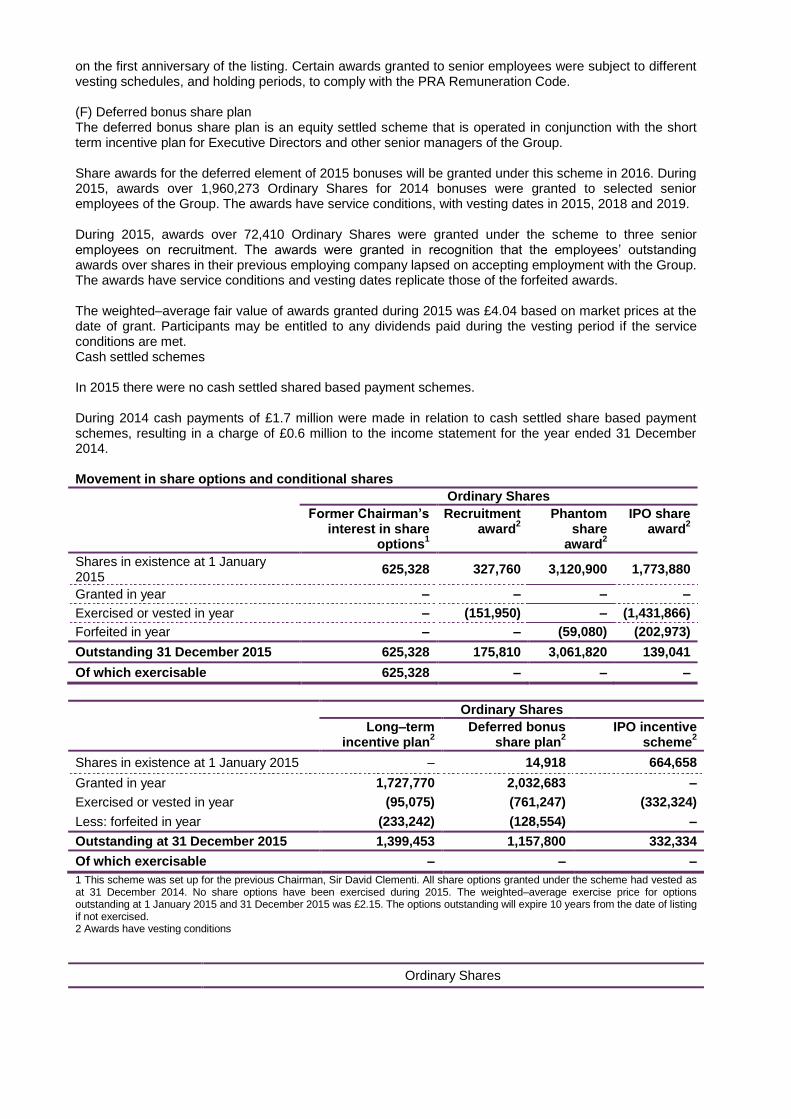
on the first anniversary of the listing. Certain awards granted to senior employees were subject to different vesting schedules, and holding periods, to comply with the PRA Remuneration Code. (F) Deferred bonus share plan The deferred bonus share plan is an equity settled scheme that is operated in conjunction with the short term incentive plan for Executive Directors and other senior managers of the Group. Share awards for the deferred element of 2015 bonuses will be granted under this scheme in 2016. During 2015, awards over 1,960,273 Ordinary Shares for 2014 bonuses were granted to selected senior employees of the Group. The awards have service conditions, with vesting dates in 2015, 2018 and 2019. During 2015, awards over 72,410 Ordinary Shares were granted under the scheme to three senior employees on recruitment. The awards were granted in recognition that the employees‟ outstanding awards over shares in their previous employing company lapsed on accepting employment with the Group. The awards have service conditions and vesting dates replicate those of the forfeited awards. The weighted–average fair value of awards granted during 2015 was £4.04 based on market prices at the date of grant. Participants may be entitled to any dividends paid during the vesting period if the service conditions are met. Cash settled schemes In 2015 there were no cash settled shared based payment schemes. During 2014 cash payments of £1.7 million were made in relation to cash settled share based payment schemes, resulting in a charge of £0.6 million to the income statement for the year ended 31 December 2014. Movement in share options and conditional shares
Ordinary Shares
Former Chairman’s interest in share
options1
Recruitment award
2
Phantom share
award2
IPO share award
2
Shares in existence at 1 January 2015
625,328 327,760 3,120,900 1,773,880
Granted in year – – – –
Exercised or vested in year – (151,950) – (1,431,866)
Forfeited in year – – (59,080) (202,973)
Outstanding 31 December 2015 625,328 175,810 3,061,820 139,041
Of which exercisable 625,328 – – –
Ordinary Shares
Long–term incentive plan
2
Deferred bonus share plan
2
IPO incentive scheme
2
Shares in existence at 1 January 2015 – 14,918 664,658
Granted in year 1,727,770 2,032,683 –
Exercised or vested in year (95,075) (761,247) (332,324)
Less: forfeited in year (233,242) (128,554) –
Outstanding at 31 December 2015 1,399,453 1,157,800 332,334
Of which exercisable – – –
1 This scheme was set up for the previous Chairman, Sir David Clementi. All share options granted under the scheme had vested as at 31 December 2014. No share options have been exercised during 2015. The weighted–average exercise price for options outstanding at 1 January 2015 and 31 December 2015 was £2.15. The options outstanding will expire 10 years from the date of listing if not exercised. 2 Awards have vesting conditions
Ordinary Shares
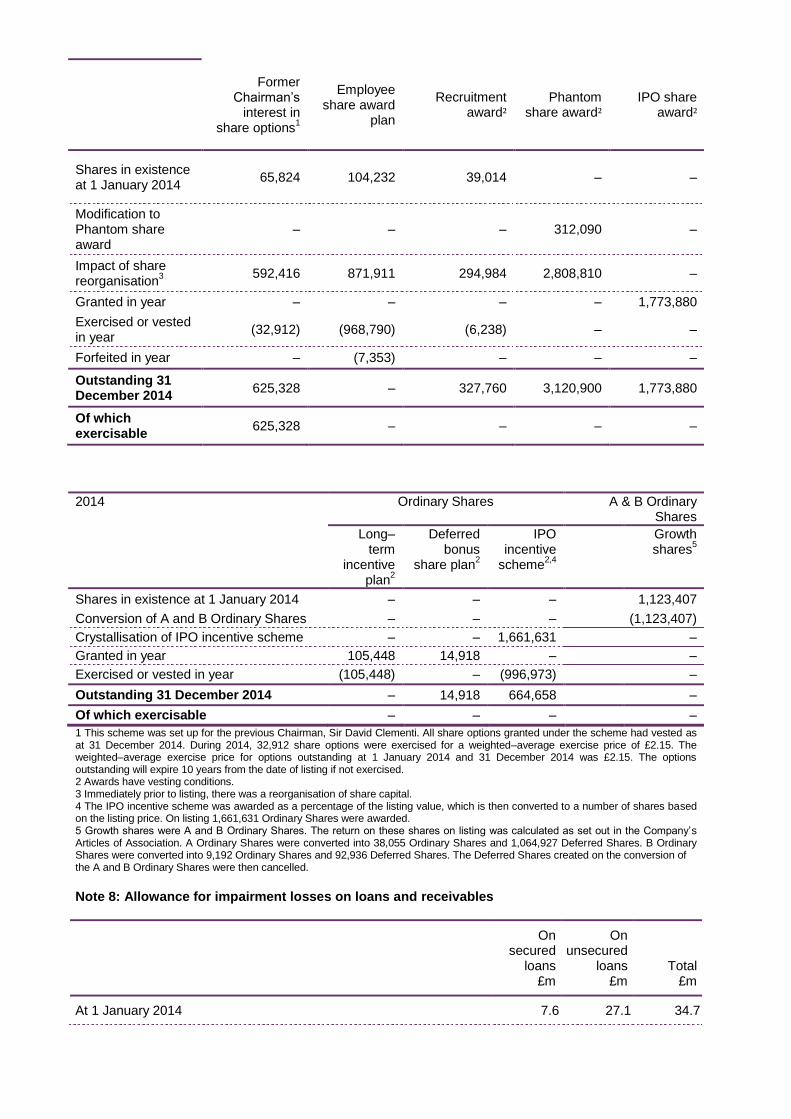
Former Chairman‟s
interest in share options
1
Employee share award
plan
Recruitment award²
Phantom share award²
IPO share award²
Shares in existence at 1 January 2014
65,824 104,232 39,014 – –
Modification to Phantom share award
– – – 312,090 –
Impact of share reorganisation
3
592,416 871,911 294,984 2,808,810 –
Granted in year – – – – 1,773,880
Exercised or vested in year
(32,912) (968,790) (6,238) – –
Forfeited in year – (7,353) – – –
Outstanding 31 December 2014
625,328 – 327,760 3,120,900 1,773,880
Of which exercisable
625,328 – – – –
2014 Ordinary Shares A & B Ordinary Shares
Long–term
incentive plan
2
Deferred bonus
share plan2
IPO incentive
scheme2,4
Growth shares
5
Shares in existence at 1 January 2014 – – – 1,123,407
Conversion of A and B Ordinary Shares – – – (1,123,407)
Crystallisation of IPO incentive scheme – – 1,661,631 –
Granted in year 105,448 14,918 – –
Exercised or vested in year (105,448) – (996,973) –
Outstanding 31 December 2014 – 14,918 664,658 –
Of which exercisable – – – –
1 This scheme was set up for the previous Chairman, Sir David Clementi. All share options granted under the scheme had vested as at 31 December 2014. During 2014, 32,912 share options were exercised for a weighted–average exercise price of £2.15. The weighted–average exercise price for options outstanding at 1 January 2014 and 31 December 2014 was £2.15. The options outstanding will expire 10 years from the date of listing if not exercised. 2 Awards have vesting conditions. 3 Immediately prior to listing, there was a reorganisation of share capital. 4 The IPO incentive scheme was awarded as a percentage of the listing value, which is then converted to a number of shares based on the listing price. On listing 1,661,631 Ordinary Shares were awarded. 5 Growth shares were A and B Ordinary Shares. The return on these shares on listing was calculated as set out in the Company‟s Articles of Association. A Ordinary Shares were converted into 38,055 Ordinary Shares and 1,064,927 Deferred Shares. B Ordinary Shares were converted into 9,192 Ordinary Shares and 92,936 Deferred Shares. The Deferred Shares created on the conversion of the A and B Ordinary Shares were then cancelled.
Note 8: Allowance for impairment losses on loans and receivables
On secured
loans £m
On unsecured
loans
£m Total
£m
At 1 January 2014 7.6 27.1 34.7
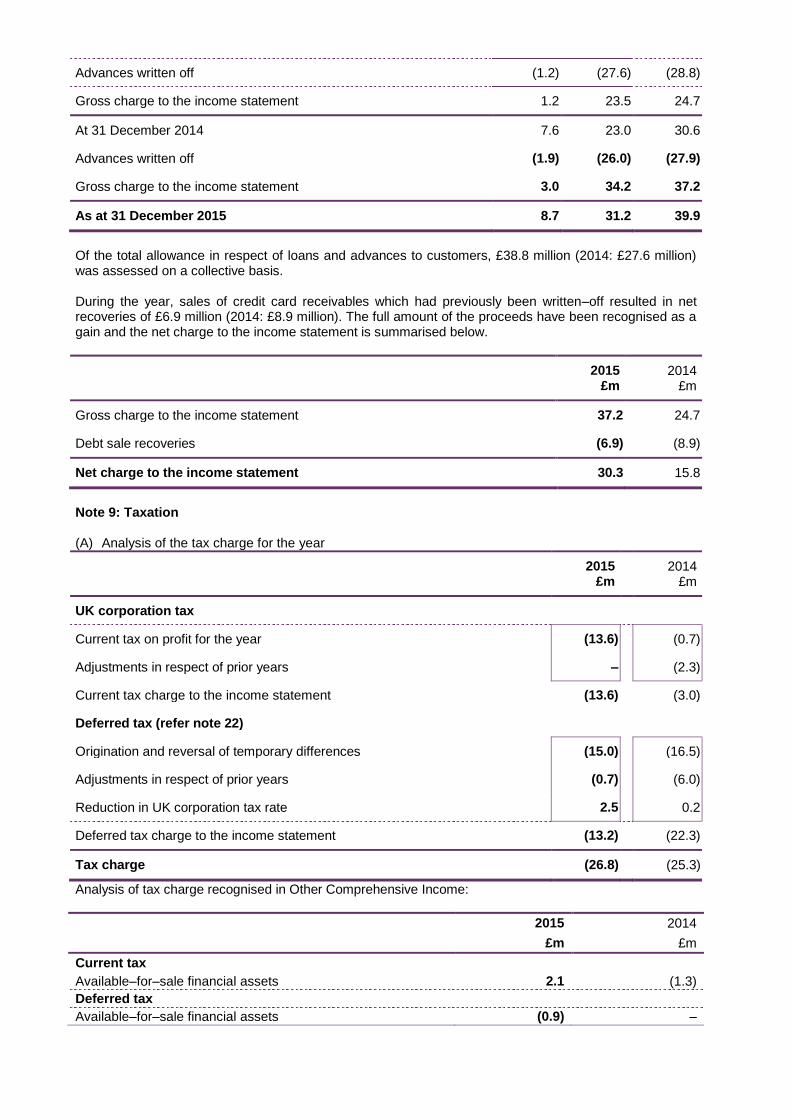
Advances written off (1.2) (27.6) (28.8)
Gross charge to the income statement 1.2 23.5 24.7
At 31 December 2014 7.6 23.0 30.6
Advances written off (1.9) (26.0) (27.9)
Gross charge to the income statement 3.0 34.2 37.2
As at 31 December 2015 8.7 31.2 39.9
Of the total allowance in respect of loans and advances to customers, £38.8 million (2014: £27.6 million) was assessed on a collective basis. During the year, sales of credit card receivables which had previously been written–off resulted in net recoveries of £6.9 million (2014: £8.9 million). The full amount of the proceeds have been recognised as a gain and the net charge to the income statement is summarised below.
2015
£m 2014
£m
Gross charge to the income statement 37.2 24.7
Debt sale recoveries (6.9) (8.9)
Net charge to the income statement 30.3 15.8
Note 9: Taxation (A) Analysis of the tax charge for the year
2015
£m 2014
£m
UK corporation tax
Current tax on profit for the year (13.6) (0.7)
Adjustments in respect of prior years – (2.3)
Current tax charge to the income statement (13.6) (3.0)
Deferred tax (refer note 22)
Origination and reversal of temporary differences (15.0) (16.5)
Adjustments in respect of prior years (0.7) (6.0)
Reduction in UK corporation tax rate 2.5 0.2
Deferred tax charge to the income statement (13.2) (22.3)
Tax charge (26.8) (25.3)
Analysis of tax charge recognised in Other Comprehensive Income:
2015 2014
£m £m
Current tax
Available–for–sale financial assets 2.1 (1.3)
Deferred tax
Available–for–sale financial assets (0.9) –
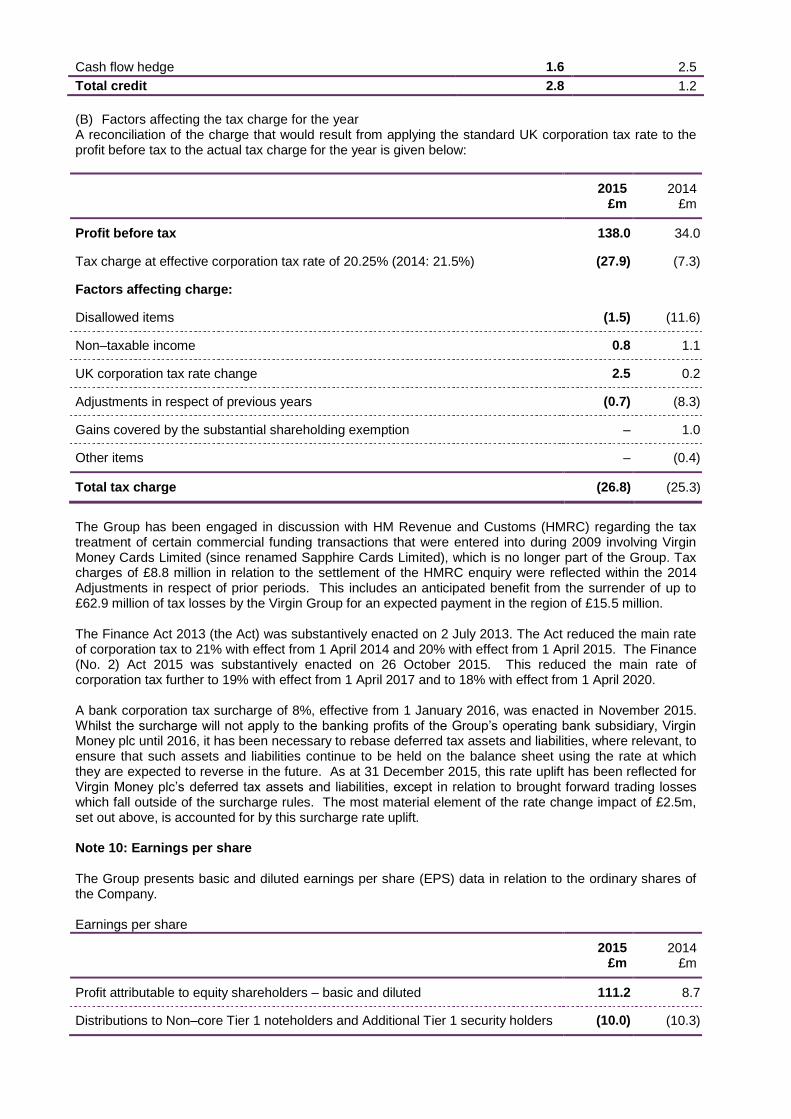
Cash flow hedge 1.6 2.5
Total credit 2.8 1.2
(B) Factors affecting the tax charge for the year A reconciliation of the charge that would result from applying the standard UK corporation tax rate to the profit before tax to the actual tax charge for the year is given below:
2015
£m 2014
£m
Profit before tax 138.0 34.0
Tax charge at effective corporation tax rate of 20.25% (2014: 21.5%) (27.9) (7.3)
Factors affecting charge:
Disallowed items (1.5) (11.6)
Non–taxable income 0.8 1.1
UK corporation tax rate change 2.5 0.2
Adjustments in respect of previous years (0.7) (8.3)
Gains covered by the substantial shareholding exemption – 1.0
Other items – (0.4)
Total tax charge (26.8) (25.3)
The Group has been engaged in discussion with HM Revenue and Customs (HMRC) regarding the tax treatment of certain commercial funding transactions that were entered into during 2009 involving Virgin Money Cards Limited (since renamed Sapphire Cards Limited), which is no longer part of the Group. Tax charges of £8.8 million in relation to the settlement of the HMRC enquiry were reflected within the 2014 Adjustments in respect of prior periods. This includes an anticipated benefit from the surrender of up to £62.9 million of tax losses by the Virgin Group for an expected payment in the region of £15.5 million. The Finance Act 2013 (the Act) was substantively enacted on 2 July 2013. The Act reduced the main rate of corporation tax to 21% with effect from 1 April 2014 and 20% with effect from 1 April 2015. The Finance (No. 2) Act 2015 was substantively enacted on 26 October 2015. This reduced the main rate of corporation tax further to 19% with effect from 1 April 2017 and to 18% with effect from 1 April 2020. A bank corporation tax surcharge of 8%, effective from 1 January 2016, was enacted in November 2015. Whilst the surcharge will not apply to the banking profits of the Group‟s operating bank subsidiary, Virgin Money plc until 2016, it has been necessary to rebase deferred tax assets and liabilities, where relevant, to ensure that such assets and liabilities continue to be held on the balance sheet using the rate at which they are expected to reverse in the future. As at 31 December 2015, this rate uplift has been reflected for Virgin Money plc‟s deferred tax assets and liabilities, except in relation to brought forward trading losses which fall outside of the surcharge rules. The most material element of the rate change impact of £2.5m, set out above, is accounted for by this surcharge rate uplift. Note 10: Earnings per share The Group presents basic and diluted earnings per share (EPS) data in relation to the ordinary shares of the Company. Earnings per share
2015
£m 2014
£m
Profit attributable to equity shareholders – basic and diluted 111.2 8.7
Distributions to Non–core Tier 1 noteholders and Additional Tier 1 security holders (10.0) (10.3)
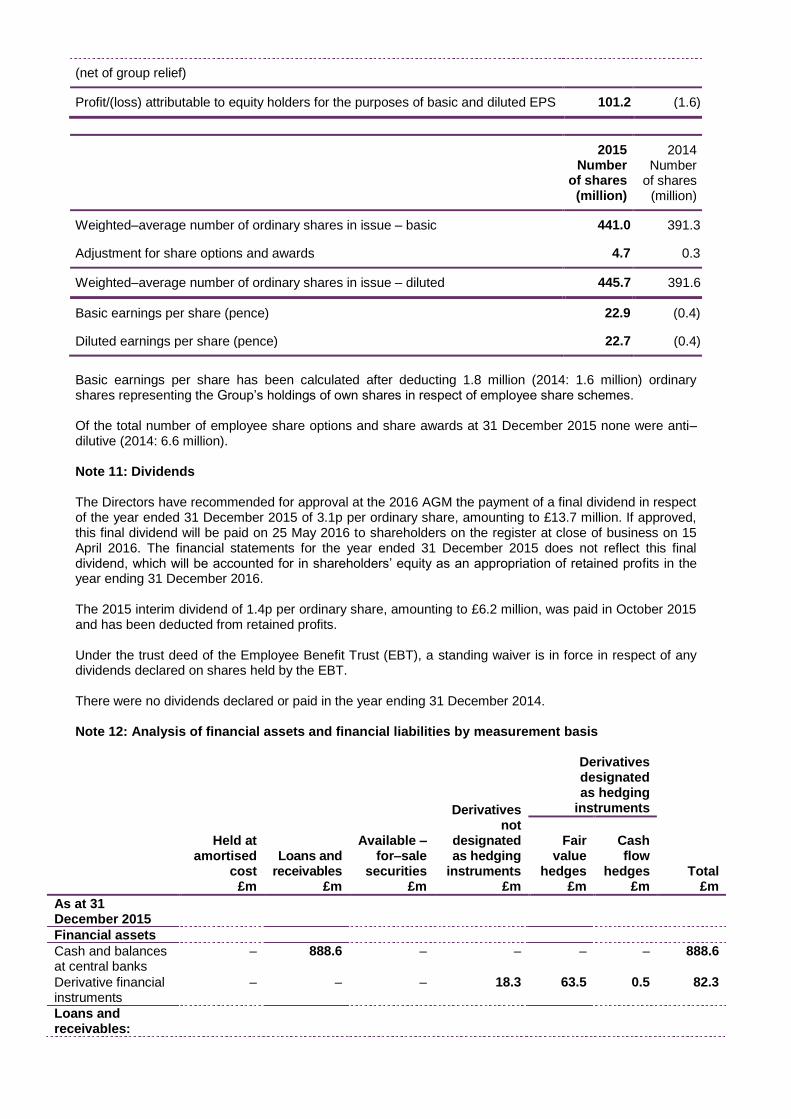
(net of group relief)
Profit/(loss) attributable to equity holders for the purposes of basic and diluted EPS 101.2 (1.6)
2015 Number
of shares (million)
2014
Number of shares
(million)
Weighted–average number of ordinary shares in issue – basic 441.0 391.3
Adjustment for share options and awards 4.7 0.3
Weighted–average number of ordinary shares in issue – diluted 445.7 391.6
Basic earnings per share (pence) 22.9 (0.4)
Diluted earnings per share (pence) 22.7 (0.4)
Basic earnings per share has been calculated after deducting 1.8 million (2014: 1.6 million) ordinary shares representing the Group‟s holdings of own shares in respect of employee share schemes. Of the total number of employee share options and share awards at 31 December 2015 none were anti–dilutive (2014: 6.6 million). Note 11: Dividends The Directors have recommended for approval at the 2016 AGM the payment of a final dividend in respect of the year ended 31 December 2015 of 3.1p per ordinary share, amounting to £13.7 million. If approved, this final dividend will be paid on 25 May 2016 to shareholders on the register at close of business on 15 April 2016. The financial statements for the year ended 31 December 2015 does not reflect this final dividend, which will be accounted for in shareholders‟ equity as an appropriation of retained profits in the year ending 31 December 2016. The 2015 interim dividend of 1.4p per ordinary share, amounting to £6.2 million, was paid in October 2015 and has been deducted from retained profits. Under the trust deed of the Employee Benefit Trust (EBT), a standing waiver is in force in respect of any dividends declared on shares held by the EBT. There were no dividends declared or paid in the year ending 31 December 2014. Note 12: Analysis of financial assets and financial liabilities by measurement basis
Held at amortised
cost £m
Loans and receivables
£m
Available –for–sale
securities £m
Derivatives not
designated as hedging
instruments £m
Derivatives designated as hedging
instruments
Total £m
Fair
value hedges
£m
Cash flow
hedges £m
As at 31 December 2015
Financial assets
Cash and balances at central banks
– 888.6 – – – – 888.6
Derivative financial instruments
– – – 18.3 63.5 0.5 82.3
Loans and receivables:
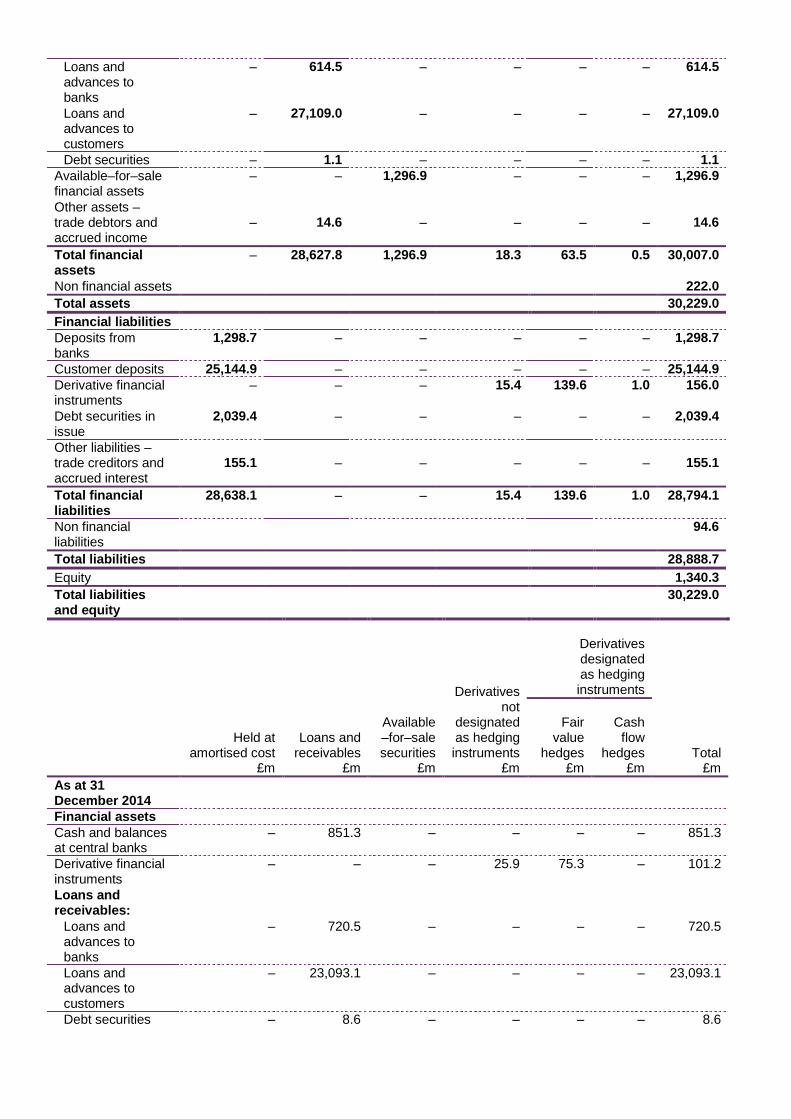
Loans and advances to banks
– 614.5 – – – – 614.5
Loans and advances to customers
– 27,109.0 – – – – 27,109.0
Debt securities – 1.1 – – – – 1.1
Available–for–sale financial assets
– – 1,296.9 – – – 1,296.9
Other assets – trade debtors and accrued income
–
14.6
–
–
–
–
14.6
Total financial assets
– 28,627.8 1,296.9 18.3 63.5 0.5 30,007.0
Non financial assets 222.0
Total assets 30,229.0
Financial liabilities
Deposits from banks
1,298.7 – – – – – 1,298.7
Customer deposits 25,144.9 – – – – – 25,144.9
Derivative financial instruments
– – – 15.4 139.6 1.0 156.0
Debt securities in issue
2,039.4 – – – – – 2,039.4
Other liabilities – trade creditors and accrued interest
155.1
–
–
–
–
–
155.1
Total financial liabilities
28,638.1 – – 15.4 139.6 1.0 28,794.1
Non financial liabilities
94.6
Total liabilities 28,888.7
Equity 1,340.3
Total liabilities and equity
30,229.0
Held at amortised cost
£m
Loans and receivables
£m
Available –for–sale securities
£m
Derivatives not
designated as hedging instruments
£m
Derivatives designated as hedging instruments
Total £m
Fair
value hedges
£m
Cash
flow hedges
£m
As at 31 December 2014
Financial assets
Cash and balances at central banks
– 851.3 – – – – 851.3
Derivative financial instruments
– – – 25.9 75.3 – 101.2
Loans and receivables:
Loans and advances to banks
– 720.5 – – – – 720.5
Loans and advances to customers
– 23,093.1 – – – – 23,093.1
Debt securities – 8.6 – – – – 8.6
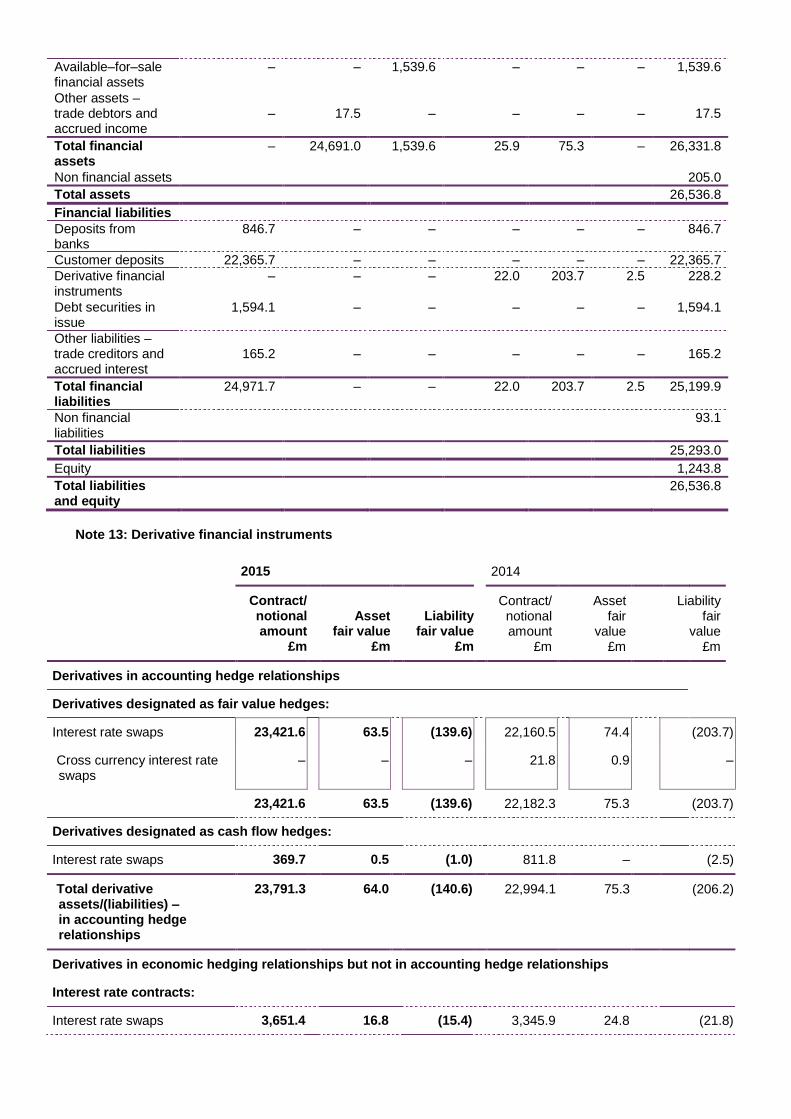
Available–for–sale financial assets
– – 1,539.6 – – – 1,539.6
Other assets – trade debtors and accrued income
–
17.5
–
–
–
–
17.5
Total financial assets
– 24,691.0 1,539.6 25.9 75.3 – 26,331.8
Non financial assets 205.0
Total assets 26,536.8
Financial liabilities
Deposits from banks
846.7 – – – – – 846.7
Customer deposits 22,365.7 – – – – – 22,365.7
Derivative financial instruments
– – – 22.0 203.7 2.5 228.2
Debt securities in issue
1,594.1 – – – – – 1,594.1
Other liabilities – trade creditors and accrued interest
165.2
–
–
–
–
–
165.2
Total financial liabilities
24,971.7 – – 22.0 203.7 2.5 25,199.9
Non financial liabilities
93.1
Total liabilities 25,293.0
Equity 1,243.8
Total liabilities and equity
26,536.8
Note 13: Derivative financial instruments
2015
2014
Contract/ notional amount
£m
Asset fair value
£m
Liability fair value
£m
Contract/ notional amount
£m
Asset fair
value £m
Liability fair
value £m
Derivatives in accounting hedge relationships
Derivatives designated as fair value hedges:
Interest rate swaps 23,421.6 63.5 (139.6) 22,160.5 74.4 (203.7)
Cross currency interest rate swaps
– – – 21.8 0.9 –
23,421.6 63.5 (139.6) 22,182.3 75.3 (203.7)
Derivatives designated as cash flow hedges:
Interest rate swaps 369.7 0.5 (1.0) 811.8 – (2.5)
Total derivative assets/(liabilities) – in accounting hedge relationships
23,791.3 64.0 (140.6) 22,994.1 75.3 (206.2)
Derivatives in economic hedging relationships but not in accounting hedge relationships
Interest rate contracts:
Interest rate swaps 3,651.4 16.8 (15.4) 3,345.9 24.8 (21.8)
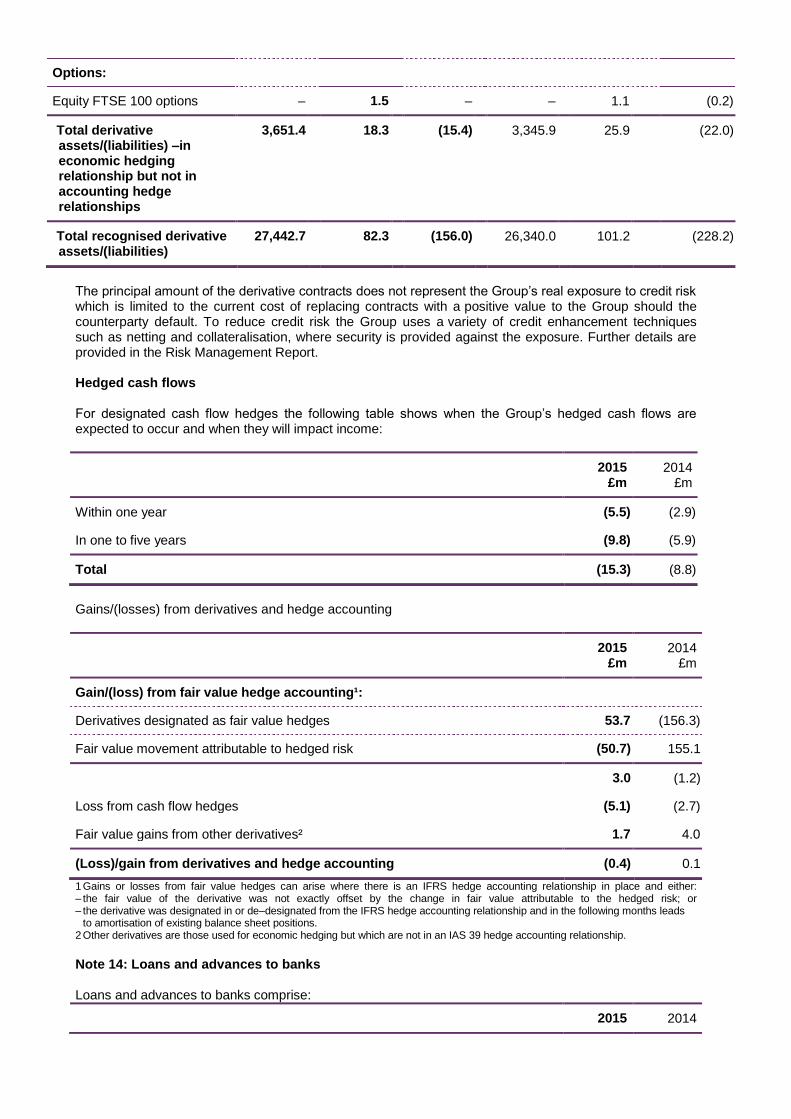
Options:
Equity FTSE 100 options – 1.5 – – 1.1 (0.2)
Total derivative assets/(liabilities) –in economic hedging relationship but not in accounting hedge relationships
3,651.4 18.3 (15.4) 3,345.9 25.9 (22.0)
Total recognised derivative assets/(liabilities)
27,442.7 82.3 (156.0) 26,340.0 101.2 (228.2)
The principal amount of the derivative contracts does not represent the Group‟s real exposure to credit risk which is limited to the current cost of replacing contracts with a positive value to the Group should the counterparty default. To reduce credit risk the Group uses a variety of credit enhancement techniques such as netting and collateralisation, where security is provided against the exposure. Further details are provided in the Risk Management Report. Hedged cash flows For designated cash flow hedges the following table shows when the Group‟s hedged cash flows are expected to occur and when they will impact income:
2015
£m 2014
£m
Within one year (5.5) (2.9)
In one to five years (9.8) (5.9)
Total (15.3) (8.8)
Gains/(losses) from derivatives and hedge accounting
2015
£m 2014
£m
Gain/(loss) from fair value hedge accounting¹:
Derivatives designated as fair value hedges 53.7 (156.3)
Fair value movement attributable to hedged risk (50.7) 155.1
3.0 (1.2)
Loss from cash flow hedges (5.1) (2.7)
Fair value gains from other derivatives² 1.7 4.0
(Loss)/gain from derivatives and hedge accounting (0.4) 0.1
1 Gains or losses from fair value hedges can arise where there is an IFRS hedge accounting relationship in place and either: – the fair value of the derivative was not exactly offset by the change in fair value attributable to the hedged risk; or – the derivative was designated in or de–designated from the IFRS hedge accounting relationship and in the following months leads to amortisation of existing balance sheet positions. 2 Other derivatives are those used for economic hedging but which are not in an IAS 39 hedge accounting relationship.
Note 14: Loans and advances to banks Loans and advances to banks comprise:
2015 2014
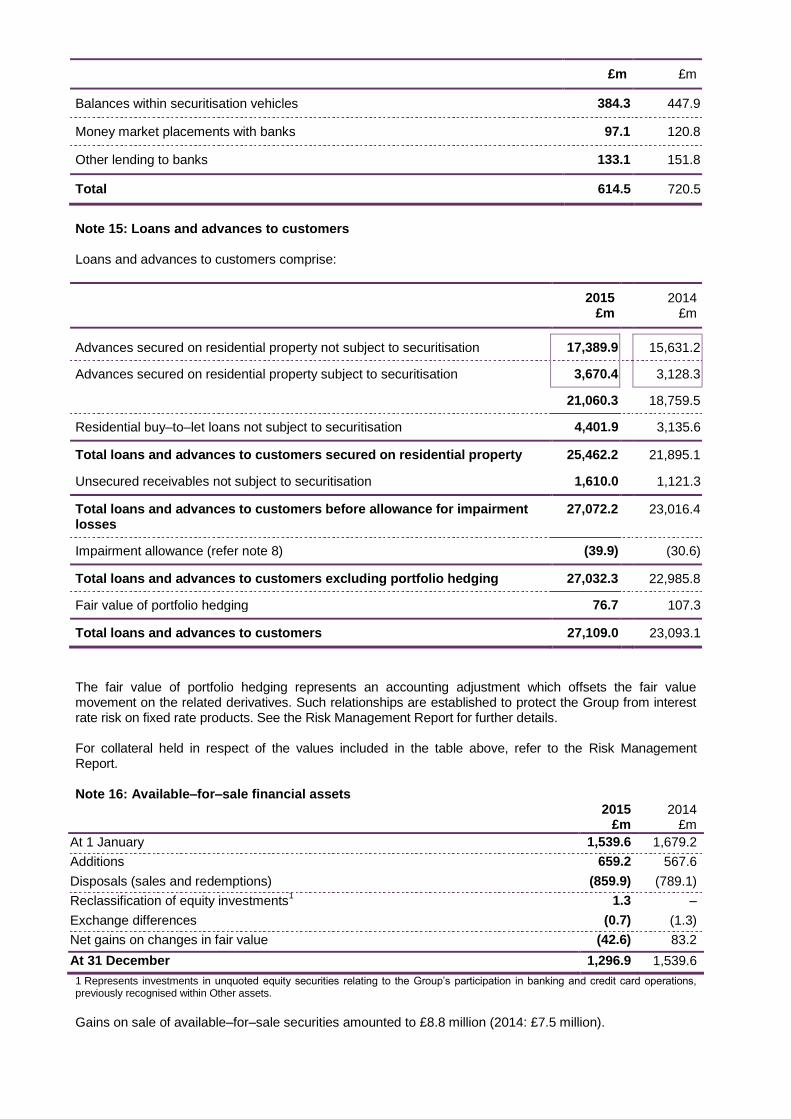
£m £m
Balances within securitisation vehicles 384.3 447.9
Money market placements with banks 97.1 120.8
Other lending to banks 133.1 151.8
Total 614.5 720.5
Note 15: Loans and advances to customers Loans and advances to customers comprise:
2015
£m 2014
£m
Advances secured on residential property not subject to securitisation 17,389.9 15,631.2
Advances secured on residential property subject to securitisation 3,670.4 3,128.3
21,060.3 18,759.5
Residential buy–to–let loans not subject to securitisation 4,401.9 3,135.6
Total loans and advances to customers secured on residential property 25,462.2 21,895.1
Unsecured receivables not subject to securitisation 1,610.0 1,121.3
Total loans and advances to customers before allowance for impairment losses
27,072.2 23,016.4
Impairment allowance (refer note 8) (39.9) (30.6)
Total loans and advances to customers excluding portfolio hedging 27,032.3 22,985.8
Fair value of portfolio hedging 76.7 107.3
Total loans and advances to customers 27,109.0 23,093.1
The fair value of portfolio hedging represents an accounting adjustment which offsets the fair value movement on the related derivatives. Such relationships are established to protect the Group from interest rate risk on fixed rate products. See the Risk Management Report for further details. For collateral held in respect of the values included in the table above, refer to the Risk Management Report. Note 16: Available–for–sale financial assets
2015 £m
2014
£m
At 1 January 1,539.6 1,679.2
Additions 659.2 567.6
Disposals (sales and redemptions) (859.9) (789.1)
Reclassification of equity investments1
1.3 –
Exchange differences (0.7) (1.3)
Net gains on changes in fair value (42.6) 83.2
At 31 December 1,296.9 1,539.6
1 Represents investments in unquoted equity securities relating to the Group‟s participation in banking and credit card operations,
previously recognised within Other assets.
Gains on sale of available–for–sale securities amounted to £8.8 million (2014: £7.5 million).
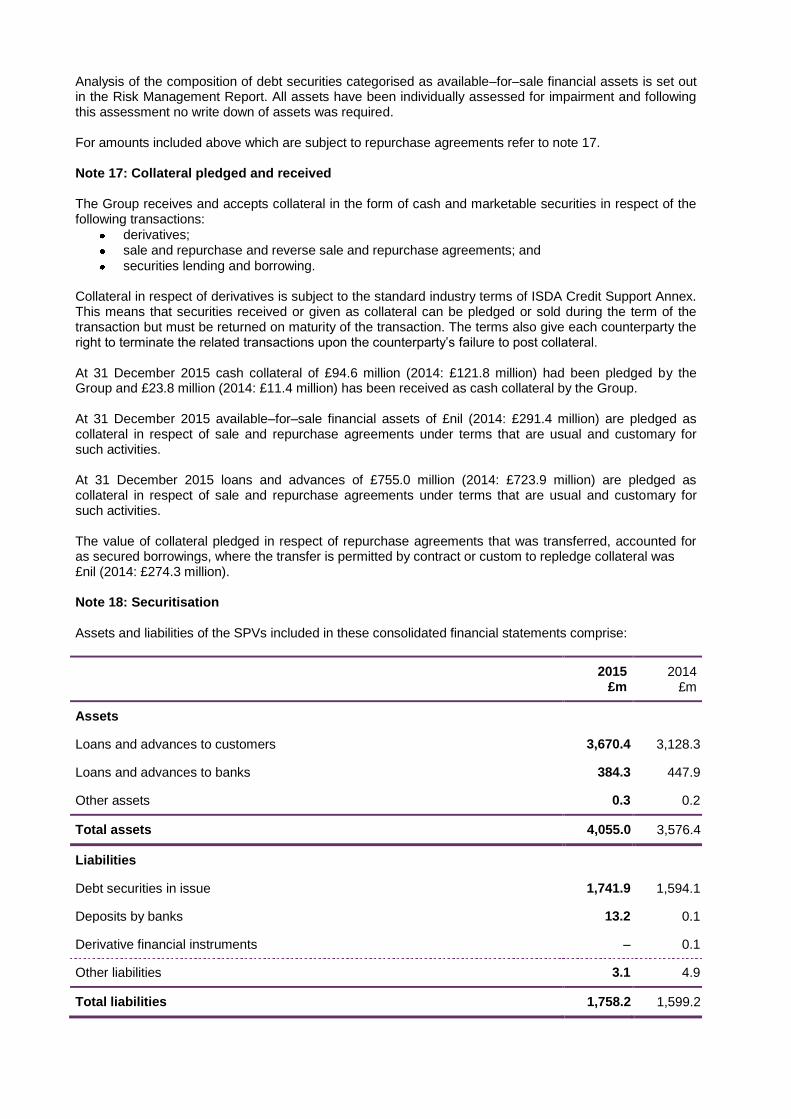
Analysis of the composition of debt securities categorised as available–for–sale financial assets is set out in the Risk Management Report. All assets have been individually assessed for impairment and following this assessment no write down of assets was required. For amounts included above which are subject to repurchase agreements refer to note 17. Note 17: Collateral pledged and received The Group receives and accepts collateral in the form of cash and marketable securities in respect of the following transactions:
derivatives; sale and repurchase and reverse sale and repurchase agreements; and
securities lending and borrowing. Collateral in respect of derivatives is subject to the standard industry terms of ISDA Credit Support Annex. This means that securities received or given as collateral can be pledged or sold during the term of the transaction but must be returned on maturity of the transaction. The terms also give each counterparty the right to terminate the related transactions upon the counterparty‟s failure to post collateral. At 31 December 2015 cash collateral of £94.6 million (2014: £121.8 million) had been pledged by the Group and £23.8 million (2014: £11.4 million) has been received as cash collateral by the Group. At 31 December 2015 available–for–sale financial assets of £nil (2014: £291.4 million) are pledged as collateral in respect of sale and repurchase agreements under terms that are usual and customary for such activities. At 31 December 2015 loans and advances of £755.0 million (2014: £723.9 million) are pledged as collateral in respect of sale and repurchase agreements under terms that are usual and customary for such activities. The value of collateral pledged in respect of repurchase agreements that was transferred, accounted for as secured borrowings, where the transfer is permitted by contract or custom to repledge collateral was £nil (2014: £274.3 million). Note 18: Securitisation Assets and liabilities of the SPVs included in these consolidated financial statements comprise:
2015
£m 2014
£m
Assets
Loans and advances to customers 3,670.4 3,128.3
Loans and advances to banks 384.3 447.9
Other assets 0.3 0.2
Total assets 4,055.0 3,576.4
Liabilities
Debt securities in issue 1,741.9 1,594.1
Deposits by banks 13.2 0.1
Derivative financial instruments – 0.1
Other liabilities 3.1 4.9
Total liabilities 1,758.2 1,599.2
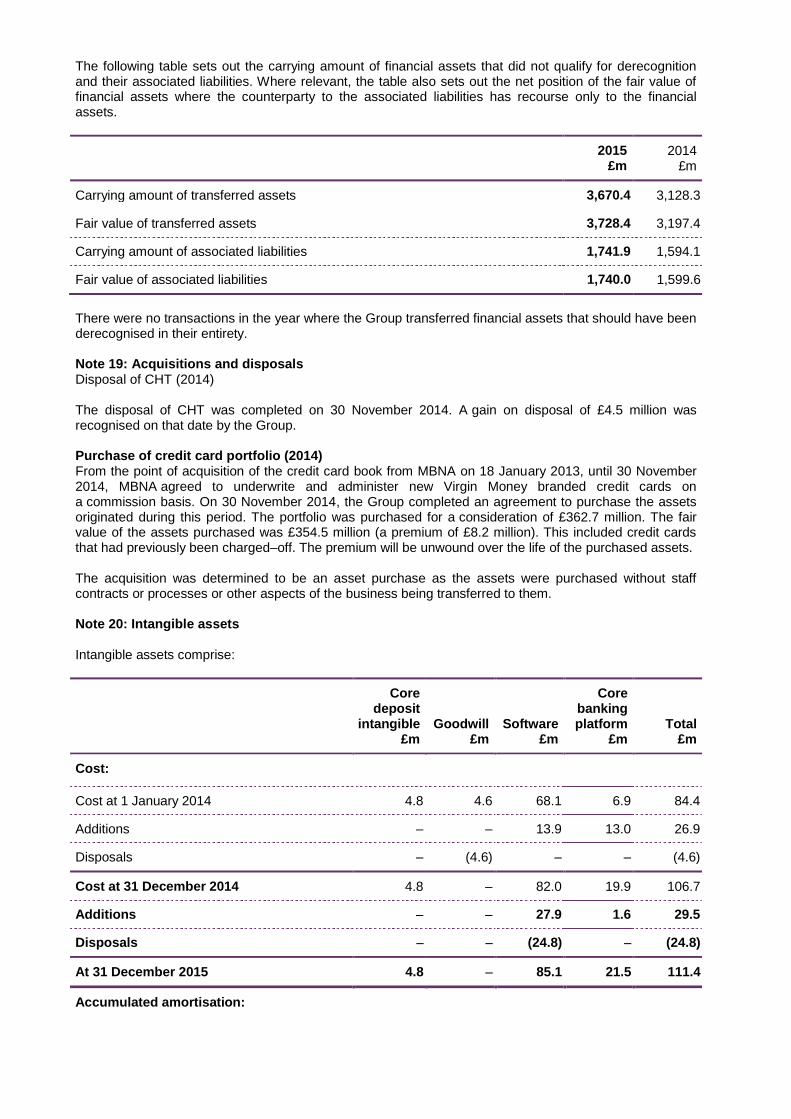
The following table sets out the carrying amount of financial assets that did not qualify for derecognition and their associated liabilities. Where relevant, the table also sets out the net position of the fair value of financial assets where the counterparty to the associated liabilities has recourse only to the financial assets.
2015
£m 2014
£m
Carrying amount of transferred assets 3,670.4 3,128.3
Fair value of transferred assets 3,728.4 3,197.4
Carrying amount of associated liabilities 1,741.9 1,594.1
Fair value of associated liabilities 1,740.0 1,599.6
There were no transactions in the year where the Group transferred financial assets that should have been derecognised in their entirety. Note 19: Acquisitions and disposals Disposal of CHT (2014) The disposal of CHT was completed on 30 November 2014. A gain on disposal of £4.5 million was recognised on that date by the Group. Purchase of credit card portfolio (2014) From the point of acquisition of the credit card book from MBNA on 18 January 2013, until 30 November 2014, MBNA agreed to underwrite and administer new Virgin Money branded credit cards on a commission basis. On 30 November 2014, the Group completed an agreement to purchase the assets originated during this period. The portfolio was purchased for a consideration of £362.7 million. The fair value of the assets purchased was £354.5 million (a premium of £8.2 million). This included credit cards that had previously been charged–off. The premium will be unwound over the life of the purchased assets. The acquisition was determined to be an asset purchase as the assets were purchased without staff contracts or processes or other aspects of the business being transferred to them. Note 20: Intangible assets Intangible assets comprise:
Core deposit
intangible £m
Goodwill £m
Software £m
Core banking platform
£m Total
£m
Cost:
Cost at 1 January 2014 4.8 4.6 68.1 6.9 84.4
Additions – – 13.9 13.0 26.9
Disposals – (4.6) – – (4.6)
Cost at 31 December 2014 4.8 – 82.0 19.9 106.7
Additions – – 27.9 1.6 29.5
Disposals – – (24.8) – (24.8)
At 31 December 2015 4.8 – 85.1 21.5 111.4
Accumulated amortisation:
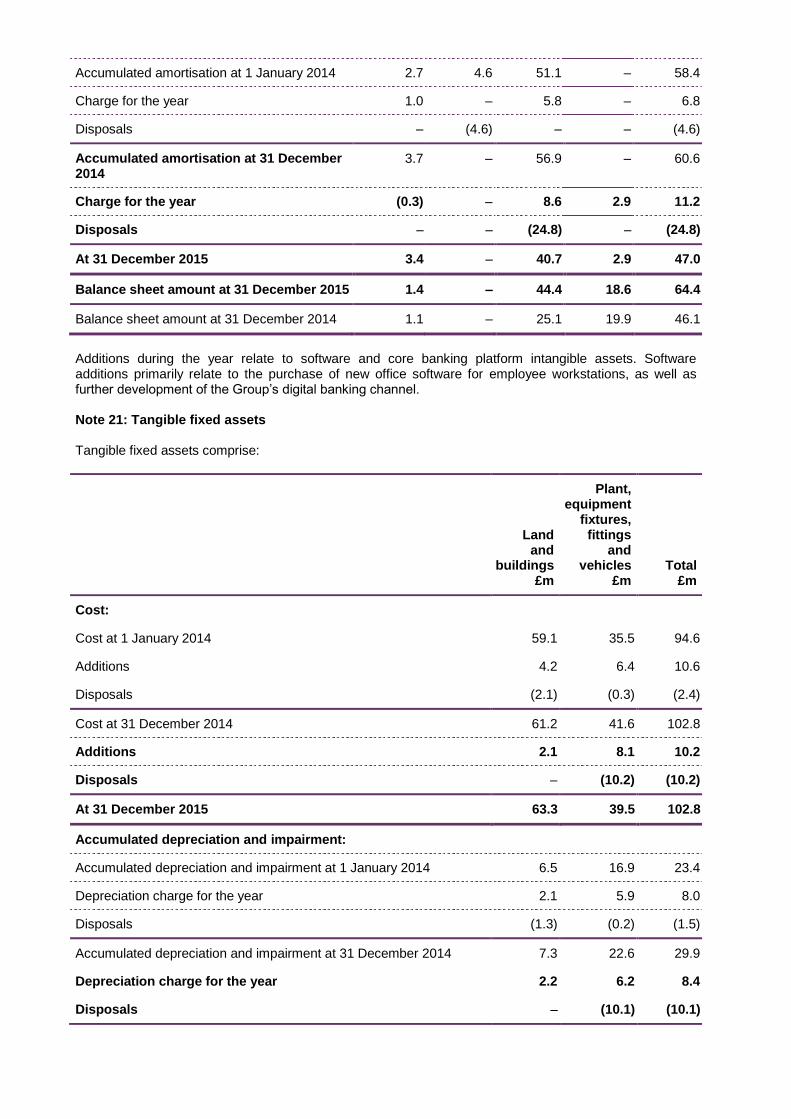
Accumulated amortisation at 1 January 2014 2.7 4.6 51.1 – 58.4
Charge for the year 1.0 – 5.8 – 6.8
Disposals – (4.6) – – (4.6)
Accumulated amortisation at 31 December 2014
3.7 – 56.9 – 60.6
Charge for the year (0.3) – 8.6 2.9 11.2
Disposals – – (24.8) – (24.8)
At 31 December 2015 3.4 – 40.7 2.9 47.0
Balance sheet amount at 31 December 2015 1.4 – 44.4 18.6 64.4
Balance sheet amount at 31 December 2014 1.1 – 25.1 19.9 46.1
Additions during the year relate to software and core banking platform intangible assets. Software additions primarily relate to the purchase of new office software for employee workstations, as well as further development of the Group‟s digital banking channel. Note 21: Tangible fixed assets Tangible fixed assets comprise:
Land and
buildings £m
Plant, equipment
fixtures, fittings
and vehicles
£m Total
£m
Cost:
Cost at 1 January 2014 59.1 35.5 94.6
Additions 4.2 6.4 10.6
Disposals (2.1) (0.3) (2.4)
Cost at 31 December 2014 61.2 41.6 102.8
Additions 2.1 8.1 10.2
Disposals – (10.2) (10.2)
At 31 December 2015 63.3 39.5 102.8
Accumulated depreciation and impairment:
Accumulated depreciation and impairment at 1 January 2014 6.5 16.9 23.4
Depreciation charge for the year 2.1 5.9 8.0
Disposals (1.3) (0.2) (1.5)
Accumulated depreciation and impairment at 31 December 2014 7.3 22.6 29.9
Depreciation charge for the year 2.2 6.2 8.4
Disposals – (10.1) (10.1)
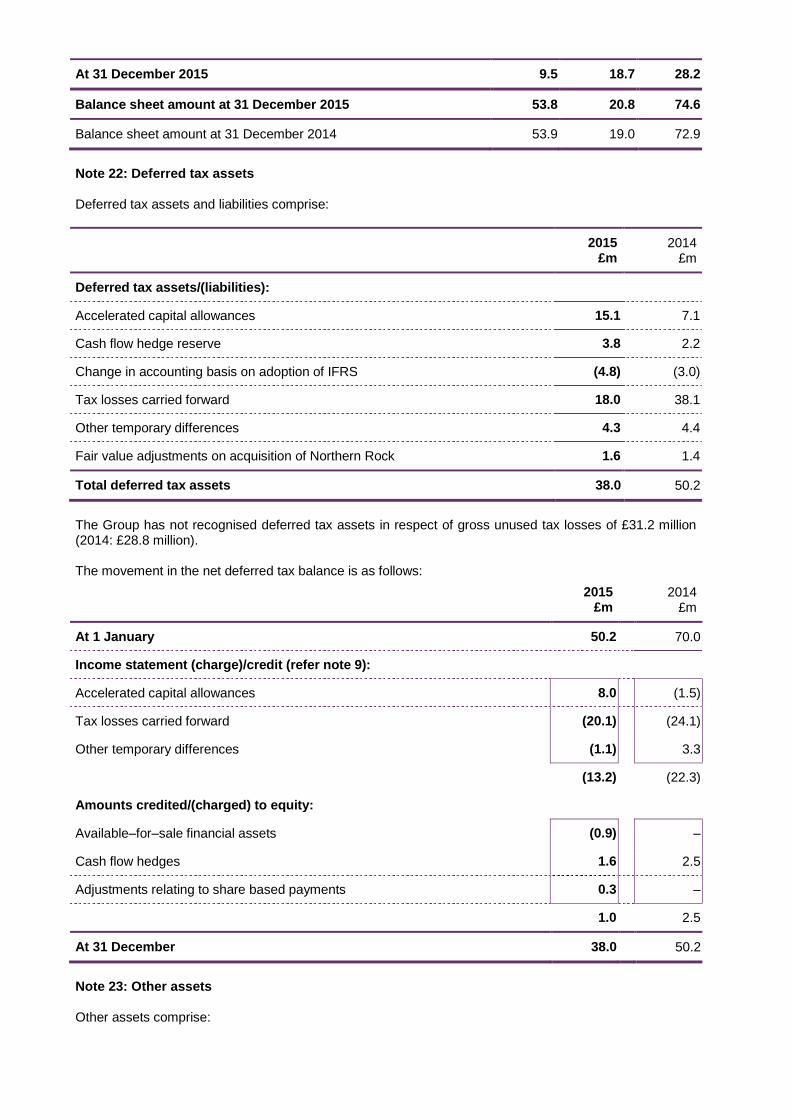
At 31 December 2015 9.5 18.7 28.2
Balance sheet amount at 31 December 2015 53.8 20.8 74.6
Balance sheet amount at 31 December 2014 53.9 19.0 72.9
Note 22: Deferred tax assets Deferred tax assets and liabilities comprise:
2015
£m 2014
£m
Deferred tax assets/(liabilities):
Accelerated capital allowances 15.1 7.1
Cash flow hedge reserve 3.8 2.2
Change in accounting basis on adoption of IFRS (4.8) (3.0)
Tax losses carried forward 18.0 38.1
Other temporary differences 4.3 4.4
Fair value adjustments on acquisition of Northern Rock 1.6 1.4
Total deferred tax assets 38.0 50.2
The Group has not recognised deferred tax assets in respect of gross unused tax losses of £31.2 million (2014: £28.8 million). The movement in the net deferred tax balance is as follows:
2015
£m 2014
£m
At 1 January 50.2 70.0
Income statement (charge)/credit (refer note 9):
Accelerated capital allowances 8.0 (1.5)
Tax losses carried forward (20.1) (24.1)
Other temporary differences (1.1) 3.3
(13.2) (22.3)
Amounts credited/(charged) to equity:
Available–for–sale financial assets (0.9) –
Cash flow hedges 1.6 2.5
Adjustments relating to share based payments 0.3 –
1.0 2.5
At 31 December 38.0 50.2
Note 23: Other assets Other assets comprise:
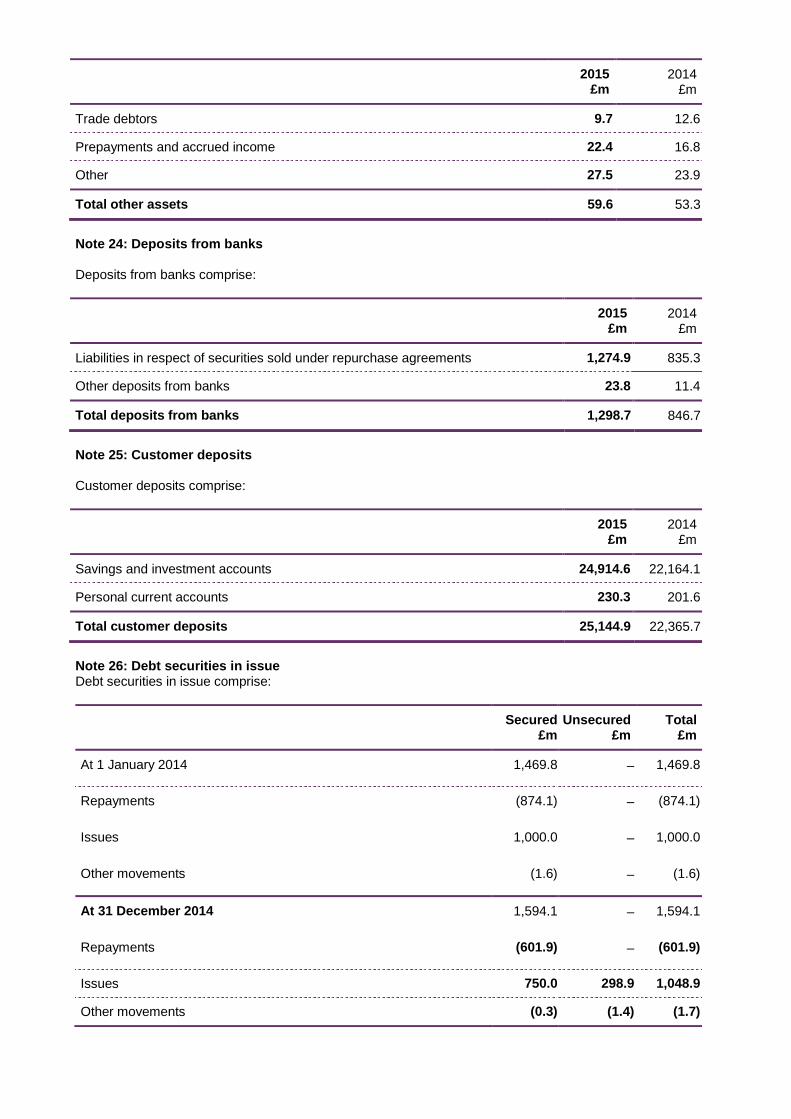
2015
£m 2014
£m
Trade debtors 9.7 12.6
Prepayments and accrued income 22.4 16.8
Other 27.5 23.9
Total other assets 59.6 53.3
Note 24: Deposits from banks Deposits from banks comprise:
2015
£m 2014
£m
Liabilities in respect of securities sold under repurchase agreements 1,274.9 835.3
Other deposits from banks 23.8 11.4
Total deposits from banks 1,298.7 846.7
Note 25: Customer deposits Customer deposits comprise:
2015
£m 2014
£m
Savings and investment accounts 24,914.6 22,164.1
Personal current accounts 230.3 201.6
Total customer deposits 25,144.9 22,365.7
Note 26: Debt securities in issue Debt securities in issue comprise:
Secured
£m Unsecured
£m Total
£m
At 1 January 2014 1,469.8 – 1,469.8
Repayments (874.1) – (874.1)
Issues 1,000.0 – 1,000.0
Other movements (1.6) – (1.6)
At 31 December 2014 1,594.1 – 1,594.1
Repayments (601.9) – (601.9)
Issues 750.0 298.9 1,048.9
Other movements (0.3) (1.4) (1.7)
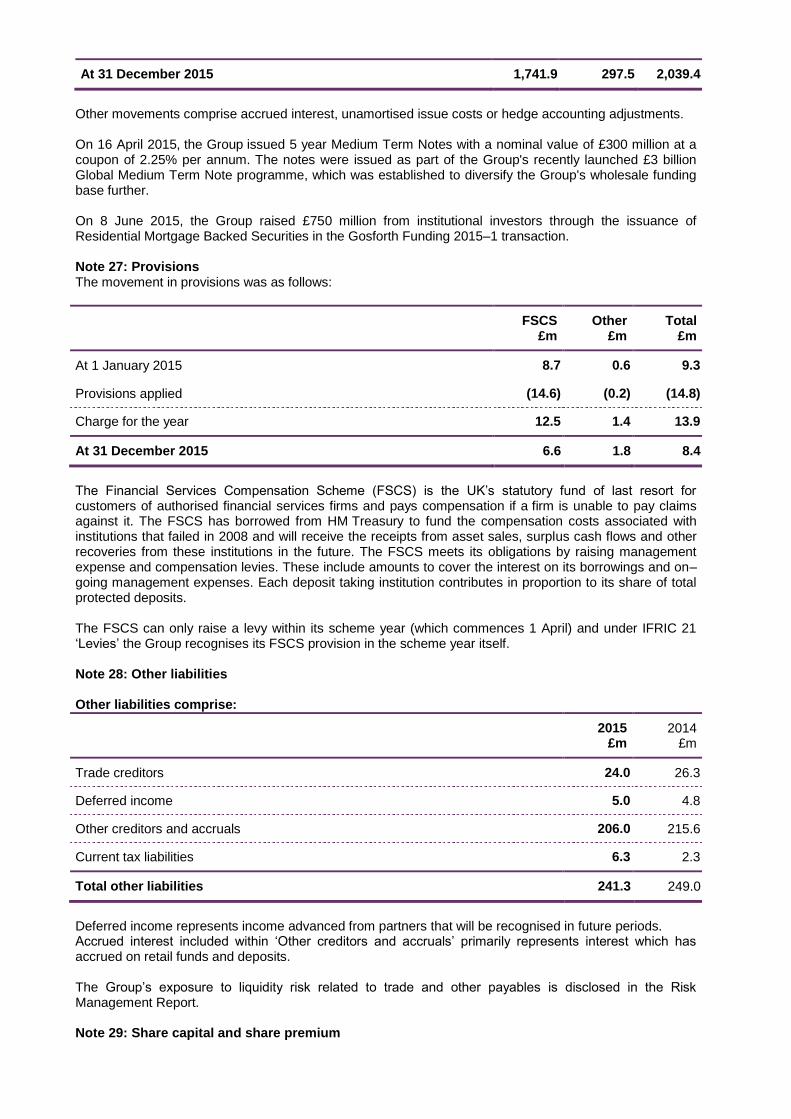
At 31 December 2015 1,741.9 297.5 2,039.4
Other movements comprise accrued interest, unamortised issue costs or hedge accounting adjustments. On 16 April 2015, the Group issued 5 year Medium Term Notes with a nominal value of £300 million at a coupon of 2.25% per annum. The notes were issued as part of the Group's recently launched £3 billion Global Medium Term Note programme, which was established to diversify the Group's wholesale funding base further. On 8 June 2015, the Group raised £750 million from institutional investors through the issuance of Residential Mortgage Backed Securities in the Gosforth Funding 2015–1 transaction. Note 27: Provisions The movement in provisions was as follows:
FSCS
£m Other
£m Total
£m
At 1 January 2015 8.7 0.6 9.3
Provisions applied (14.6) (0.2) (14.8)
Charge for the year 12.5 1.4 13.9
At 31 December 2015 6.6 1.8 8.4
The Financial Services Compensation Scheme (FSCS) is the UK‟s statutory fund of last resort for customers of authorised financial services firms and pays compensation if a firm is unable to pay claims against it. The FSCS has borrowed from HM Treasury to fund the compensation costs associated with institutions that failed in 2008 and will receive the receipts from asset sales, surplus cash flows and other recoveries from these institutions in the future. The FSCS meets its obligations by raising management expense and compensation levies. These include amounts to cover the interest on its borrowings and on–going management expenses. Each deposit taking institution contributes in proportion to its share of total protected deposits. The FSCS can only raise a levy within its scheme year (which commences 1 April) and under IFRIC 21 „Levies‟ the Group recognises its FSCS provision in the scheme year itself. Note 28: Other liabilities Other liabilities comprise:
2015
£m 2014
£m
Trade creditors 24.0 26.3
Deferred income 5.0 4.8
Other creditors and accruals 206.0 215.6
Current tax liabilities 6.3 2.3
Total other liabilities 241.3 249.0
Deferred income represents income advanced from partners that will be recognised in future periods. Accrued interest included within „Other creditors and accruals‟ primarily represents interest which has accrued on retail funds and deposits. The Group‟s exposure to liquidity risk related to trade and other payables is disclosed in the Risk Management Report. Note 29: Share capital and share premium
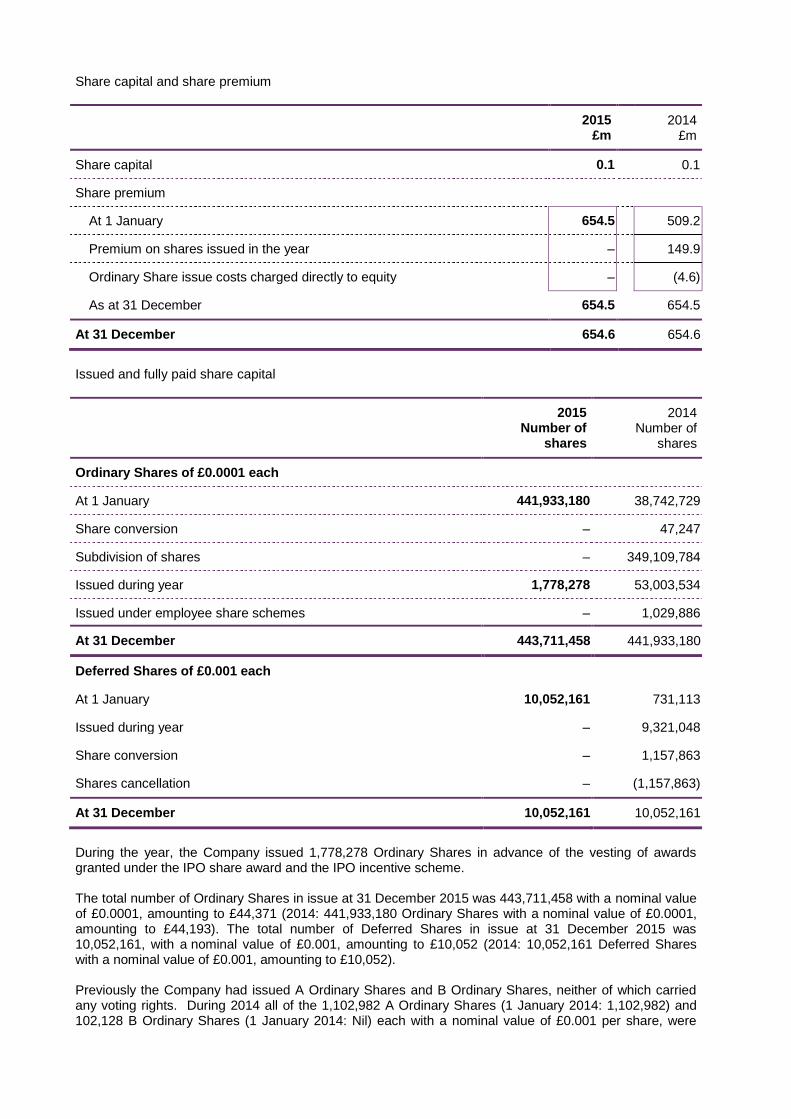
Share capital and share premium
2015
£m 2014
£m
Share capital 0.1 0.1
Share premium
At 1 January 654.5 509.2
Premium on shares issued in the year – 149.9
Ordinary Share issue costs charged directly to equity – (4.6)
As at 31 December 654.5 654.5
At 31 December 654.6 654.6
Issued and fully paid share capital
2015 Number of
shares
2014 Number of
shares
Ordinary Shares of £0.0001 each
At 1 January 441,933,180 38,742,729
Share conversion – 47,247
Subdivision of shares – 349,109,784
Issued during year 1,778,278 53,003,534
Issued under employee share schemes – 1,029,886
At 31 December 443,711,458 441,933,180
Deferred Shares of £0.001 each
At 1 January 10,052,161 731,113
Issued during year – 9,321,048
Share conversion – 1,157,863
Shares cancellation – (1,157,863)
At 31 December 10,052,161 10,052,161
During the year, the Company issued 1,778,278 Ordinary Shares in advance of the vesting of awards granted under the IPO share award and the IPO incentive scheme. The total number of Ordinary Shares in issue at 31 December 2015 was 443,711,458 with a nominal value of £0.0001, amounting to £44,371 (2014: 441,933,180 Ordinary Shares with a nominal value of £0.0001, amounting to £44,193). The total number of Deferred Shares in issue at 31 December 2015 was 10,052,161, with a nominal value of £0.001, amounting to £10,052 (2014: 10,052,161 Deferred Shares with a nominal value of £0.001, amounting to £10,052). Previously the Company had issued A Ordinary Shares and B Ordinary Shares, neither of which carried any voting rights. During 2014 all of the 1,102,982 A Ordinary Shares (1 January 2014: 1,102,982) and 102,128 B Ordinary Shares (1 January 2014: Nil) each with a nominal value of £0.001 per share, were
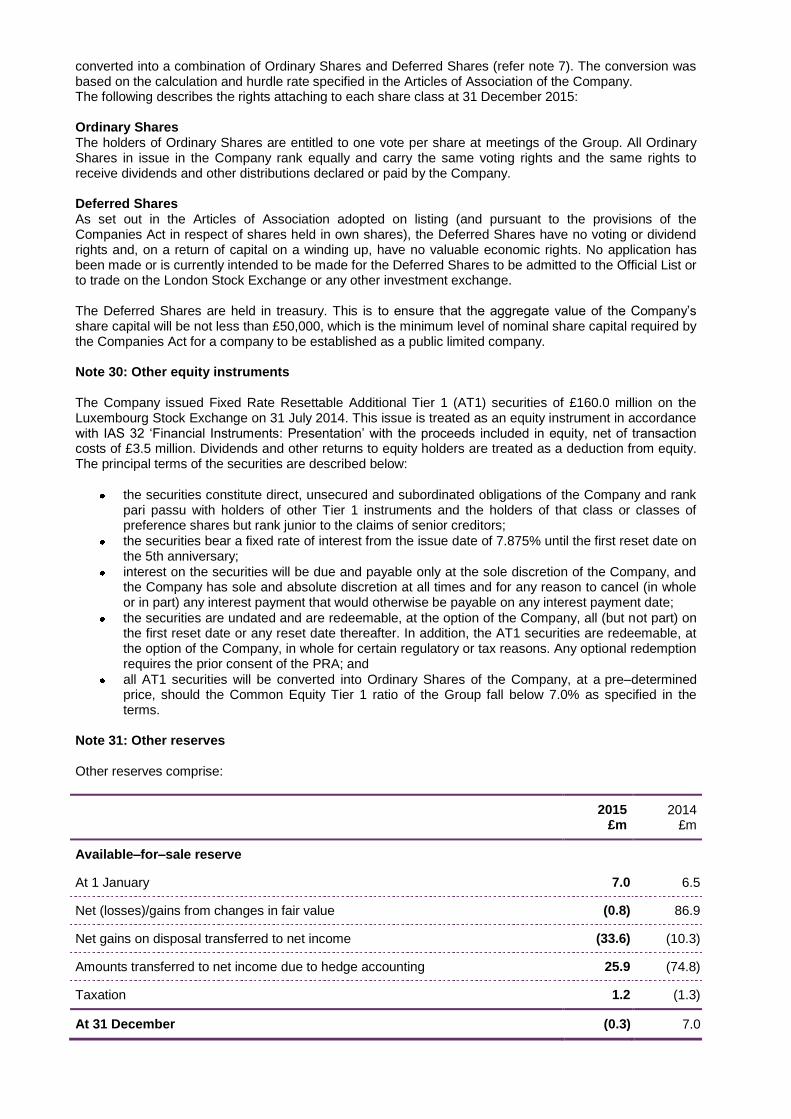
converted into a combination of Ordinary Shares and Deferred Shares (refer note 7). The conversion was based on the calculation and hurdle rate specified in the Articles of Association of the Company. The following describes the rights attaching to each share class at 31 December 2015: Ordinary Shares The holders of Ordinary Shares are entitled to one vote per share at meetings of the Group. All Ordinary Shares in issue in the Company rank equally and carry the same voting rights and the same rights to receive dividends and other distributions declared or paid by the Company. Deferred Shares As set out in the Articles of Association adopted on listing (and pursuant to the provisions of the Companies Act in respect of shares held in own shares), the Deferred Shares have no voting or dividend rights and, on a return of capital on a winding up, have no valuable economic rights. No application has been made or is currently intended to be made for the Deferred Shares to be admitted to the Official List or to trade on the London Stock Exchange or any other investment exchange. The Deferred Shares are held in treasury. This is to ensure that the aggregate value of the Company‟s share capital will be not less than £50,000, which is the minimum level of nominal share capital required by the Companies Act for a company to be established as a public limited company. Note 30: Other equity instruments The Company issued Fixed Rate Resettable Additional Tier 1 (AT1) securities of £160.0 million on the Luxembourg Stock Exchange on 31 July 2014. This issue is treated as an equity instrument in accordance with IAS 32 „Financial Instruments: Presentation‟ with the proceeds included in equity, net of transaction costs of £3.5 million. Dividends and other returns to equity holders are treated as a deduction from equity. The principal terms of the securities are described below:
the securities constitute direct, unsecured and subordinated obligations of the Company and rank pari passu with holders of other Tier 1 instruments and the holders of that class or classes of preference shares but rank junior to the claims of senior creditors;
the securities bear a fixed rate of interest from the issue date of 7.875% until the first reset date on the 5th anniversary;
interest on the securities will be due and payable only at the sole discretion of the Company, and the Company has sole and absolute discretion at all times and for any reason to cancel (in whole or in part) any interest payment that would otherwise be payable on any interest payment date;
the securities are undated and are redeemable, at the option of the Company, all (but not part) on the first reset date or any reset date thereafter. In addition, the AT1 securities are redeemable, at the option of the Company, in whole for certain regulatory or tax reasons. Any optional redemption requires the prior consent of the PRA; and
all AT1 securities will be converted into Ordinary Shares of the Company, at a pre–determined price, should the Common Equity Tier 1 ratio of the Group fall below 7.0% as specified in the terms.
Note 31: Other reserves Other reserves comprise:
2015
£m 2014
£m
Available–for–sale reserve
At 1 January 7.0 6.5
Net (losses)/gains from changes in fair value (0.8) 86.9
Net gains on disposal transferred to net income (33.6) (10.3)
Amounts transferred to net income due to hedge accounting 25.9 (74.8)
Taxation 1.2 (1.3)
At 31 December (0.3) 7.0
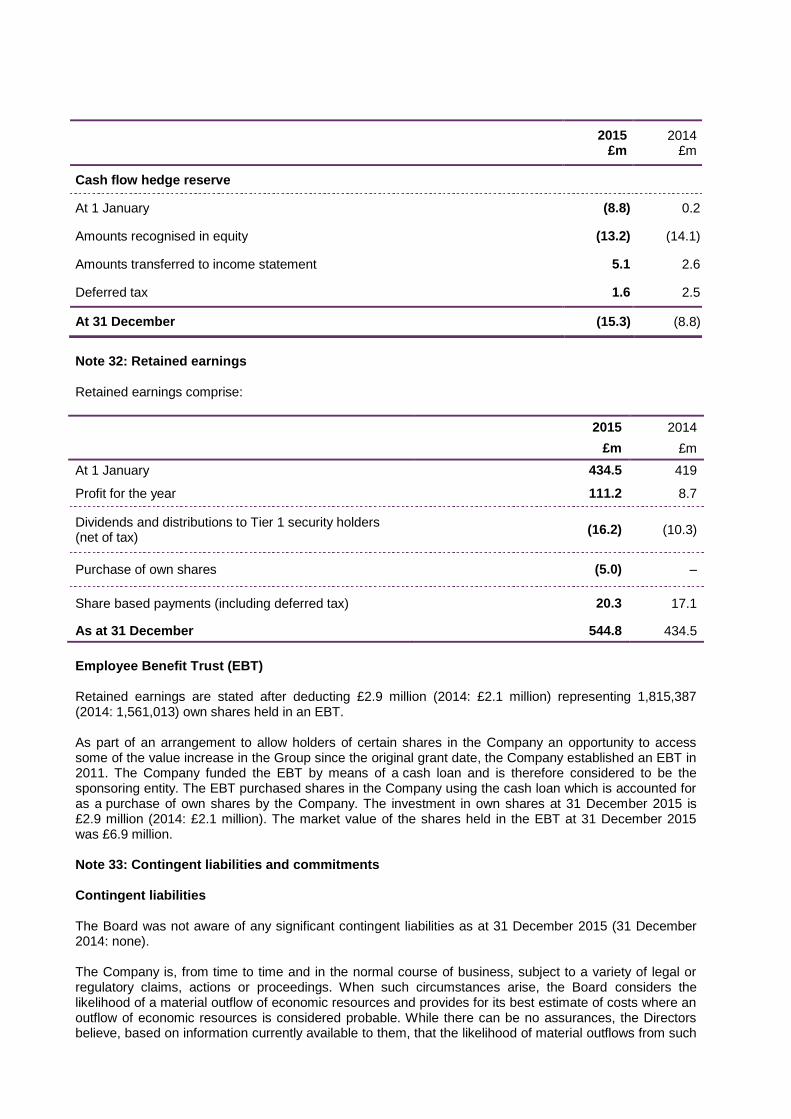
2015
£m 2014
£m
Cash flow hedge reserve
At 1 January (8.8) 0.2
Amounts recognised in equity (13.2) (14.1)
Amounts transferred to income statement 5.1 2.6
Deferred tax 1.6 2.5
At 31 December (15.3) (8.8)
Note 32: Retained earnings Retained earnings comprise:
2015 2014
£m £m
At 1 January 434.5 419
Profit for the year 111.2 8.7
Dividends and distributions to Tier 1 security holders (net of tax)
(16.2) (10.3)
Purchase of own shares (5.0) –
Share based payments (including deferred tax) 20.3 17.1
As at 31 December 544.8 434.5
Employee Benefit Trust (EBT) Retained earnings are stated after deducting £2.9 million (2014: £2.1 million) representing 1,815,387 (2014: 1,561,013) own shares held in an EBT. As part of an arrangement to allow holders of certain shares in the Company an opportunity to access some of the value increase in the Group since the original grant date, the Company established an EBT in 2011. The Company funded the EBT by means of a cash loan and is therefore considered to be the sponsoring entity. The EBT purchased shares in the Company using the cash loan which is accounted for as a purchase of own shares by the Company. The investment in own shares at 31 December 2015 is £2.9 million (2014: £2.1 million). The market value of the shares held in the EBT at 31 December 2015 was £6.9 million. Note 33: Contingent liabilities and commitments Contingent liabilities The Board was not aware of any significant contingent liabilities as at 31 December 2015 (31 December 2014: none). The Company is, from time to time and in the normal course of business, subject to a variety of legal or regulatory claims, actions or proceedings. When such circumstances arise, the Board considers the likelihood of a material outflow of economic resources and provides for its best estimate of costs where an outflow of economic resources is considered probable. While there can be no assurances, the Directors believe, based on information currently available to them, that the likelihood of material outflows from such
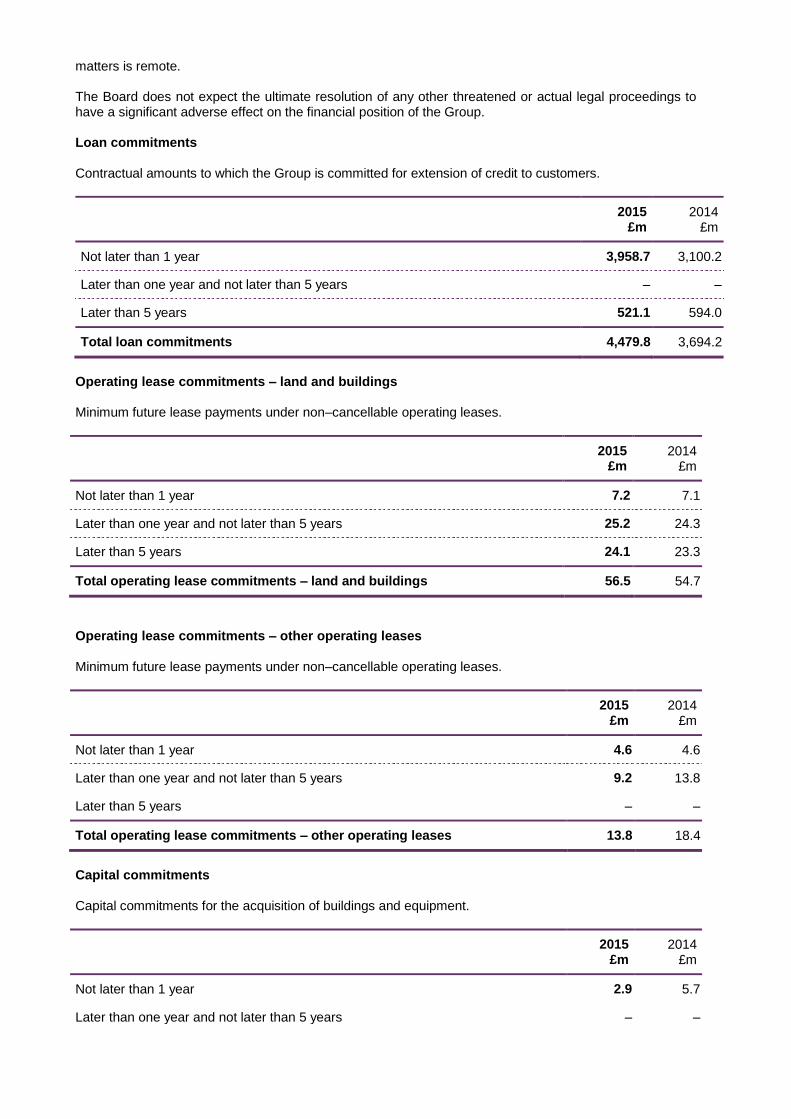
matters is remote. The Board does not expect the ultimate resolution of any other threatened or actual legal proceedings to have a significant adverse effect on the financial position of the Group. Loan commitments Contractual amounts to which the Group is committed for extension of credit to customers.
2015
£m 2014
£m
Not later than 1 year 3,958.7 3,100.2
Later than one year and not later than 5 years – –
Later than 5 years 521.1 594.0
Total loan commitments 4,479.8 3,694.2
Operating lease commitments – land and buildings Minimum future lease payments under non–cancellable operating leases.
2015
£m 2014
£m
Not later than 1 year 7.2 7.1
Later than one year and not later than 5 years 25.2 24.3
Later than 5 years 24.1 23.3
Total operating lease commitments – land and buildings 56.5 54.7
Operating lease commitments – other operating leases Minimum future lease payments under non–cancellable operating leases.
2015
£m 2014
£m
Not later than 1 year 4.6 4.6
Later than one year and not later than 5 years 9.2 13.8
Later than 5 years – –
Total operating lease commitments – other operating leases 13.8 18.4
Capital commitments Capital commitments for the acquisition of buildings and equipment.
2015
£m 2014
£m
Not later than 1 year 2.9 5.7
Later than one year and not later than 5 years – –
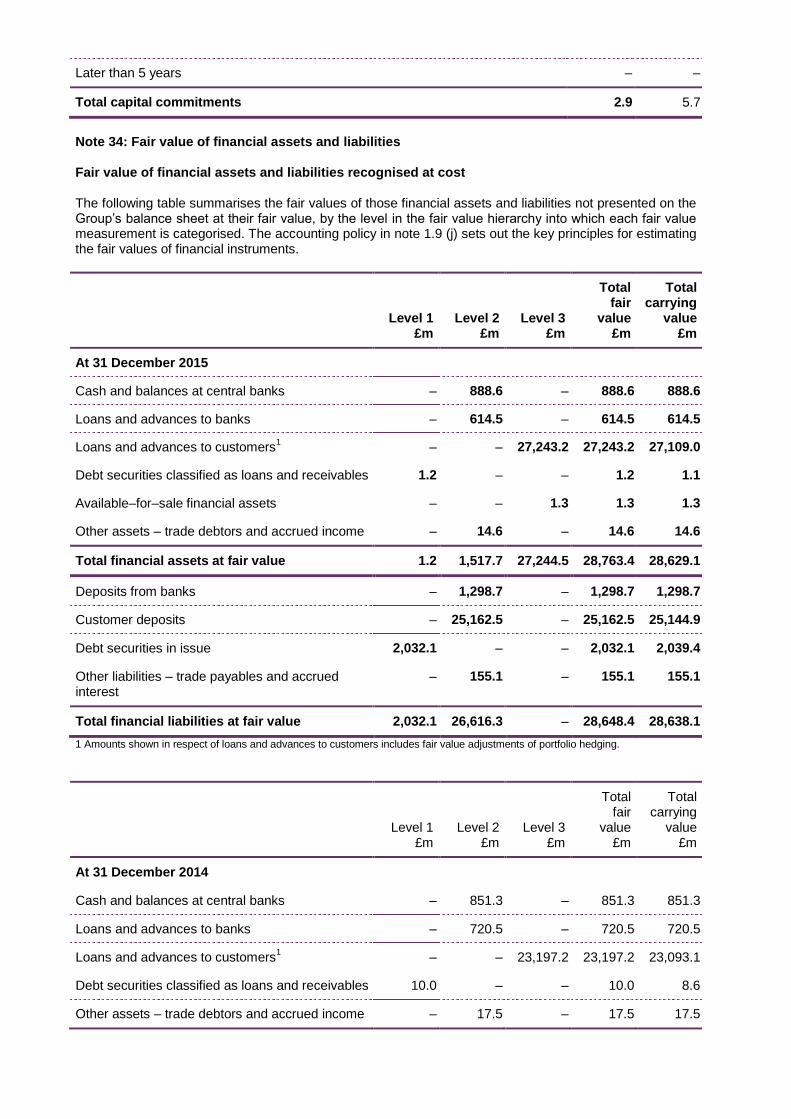
Later than 5 years – –
Total capital commitments 2.9 5.7
Note 34: Fair value of financial assets and liabilities Fair value of financial assets and liabilities recognised at cost The following table summarises the fair values of those financial assets and liabilities not presented on the Group‟s balance sheet at their fair value, by the level in the fair value hierarchy into which each fair value measurement is categorised. The accounting policy in note 1.9 (j) sets out the key principles for estimating the fair values of financial instruments.
Level 1
£m Level 2
£m Level 3
£m
Total fair
value £m
Total carrying
value £m
At 31 December 2015
Cash and balances at central banks – 888.6 – 888.6 888.6
Loans and advances to banks – 614.5 – 614.5 614.5
Loans and advances to customers1
– – 27,243.2 27,243.2 27,109.0
Debt securities classified as loans and receivables 1.2 – – 1.2 1.1
Available–for–sale financial assets – – 1.3 1.3 1.3
Other assets – trade debtors and accrued income – 14.6 – 14.6 14.6
Total financial assets at fair value 1.2 1,517.7 27,244.5 28,763.4 28,629.1
Deposits from banks – 1,298.7 – 1,298.7 1,298.7
Customer deposits – 25,162.5 – 25,162.5 25,144.9
Debt securities in issue 2,032.1 – – 2,032.1 2,039.4
Other liabilities – trade payables and accrued interest
– 155.1 – 155.1 155.1
Total financial liabilities at fair value 2,032.1 26,616.3 – 28,648.4 28,638.1
1 Amounts shown in respect of loans and advances to customers includes fair value adjustments of portfolio hedging.
Level 1
£m Level 2
£m Level 3
£m
Total fair
value £m
Total carrying
value £m
At 31 December 2014
Cash and balances at central banks – 851.3 – 851.3 851.3
Loans and advances to banks – 720.5 – 720.5 720.5
Loans and advances to customers1 – – 23,197.2 23,197.2 23,093.1
Debt securities classified as loans and receivables 10.0 – – 10.0 8.6
Other assets – trade debtors and accrued income – 17.5 – 17.5 17.5
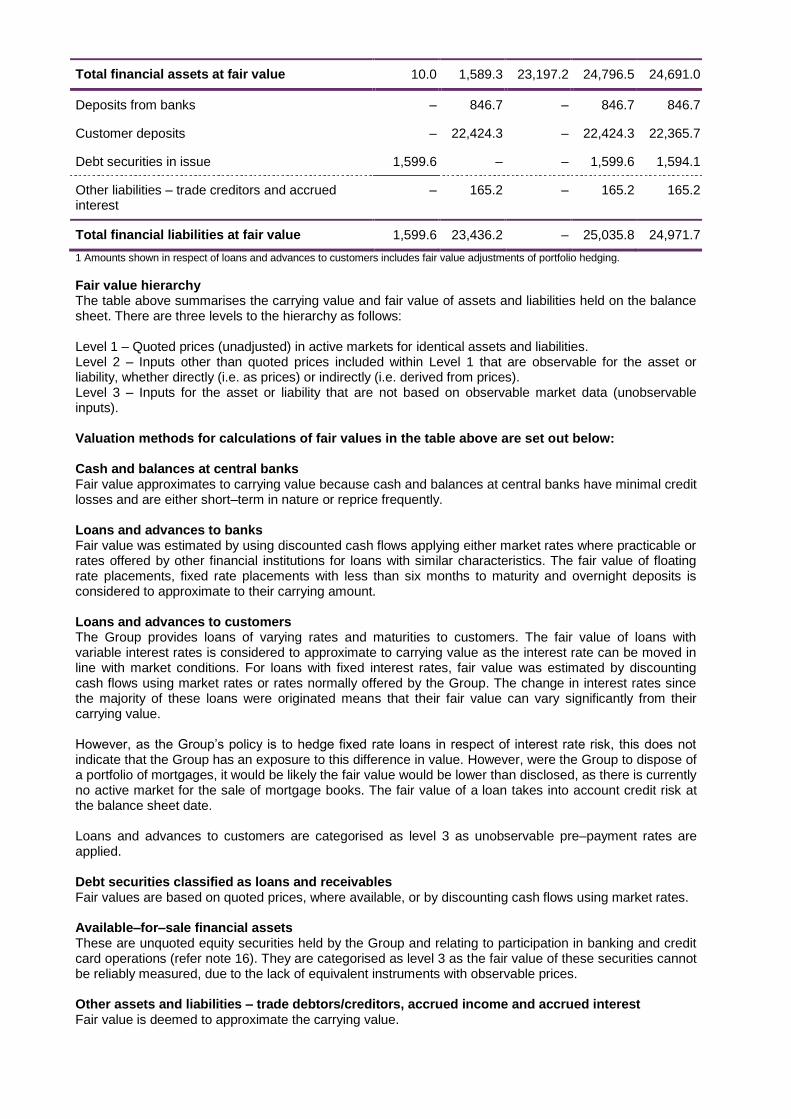
Total financial assets at fair value 10.0 1,589.3 23,197.2 24,796.5 24,691.0
Deposits from banks – 846.7 – 846.7 846.7
Customer deposits – 22,424.3 – 22,424.3 22,365.7
Debt securities in issue 1,599.6 – – 1,599.6 1,594.1
Other liabilities – trade creditors and accrued interest
– 165.2 – 165.2 165.2
Total financial liabilities at fair value 1,599.6 23,436.2 – 25,035.8 24,971.7
1 Amounts shown in respect of loans and advances to customers includes fair value adjustments of portfolio hedging.
Fair value hierarchy
The table above summarises the carrying value and fair value of assets and liabilities held on the balance sheet. There are three levels to the hierarchy as follows: Level 1 – Quoted prices (unadjusted) in active markets for identical assets and liabilities. Level 2 – Inputs other than quoted prices included within Level 1 that are observable for the asset or liability, whether directly (i.e. as prices) or indirectly (i.e. derived from prices). Level 3 – Inputs for the asset or liability that are not based on observable market data (unobservable inputs). Valuation methods for calculations of fair values in the table above are set out below: Cash and balances at central banks Fair value approximates to carrying value because cash and balances at central banks have minimal credit losses and are either short–term in nature or reprice frequently. Loans and advances to banks Fair value was estimated by using discounted cash flows applying either market rates where practicable or rates offered by other financial institutions for loans with similar characteristics. The fair value of floating rate placements, fixed rate placements with less than six months to maturity and overnight deposits is considered to approximate to their carrying amount. Loans and advances to customers The Group provides loans of varying rates and maturities to customers. The fair value of loans with variable interest rates is considered to approximate to carrying value as the interest rate can be moved in line with market conditions. For loans with fixed interest rates, fair value was estimated by discounting cash flows using market rates or rates normally offered by the Group. The change in interest rates since the majority of these loans were originated means that their fair value can vary significantly from their carrying value. However, as the Group‟s policy is to hedge fixed rate loans in respect of interest rate risk, this does not indicate that the Group has an exposure to this difference in value. However, were the Group to dispose of a portfolio of mortgages, it would be likely the fair value would be lower than disclosed, as there is currently no active market for the sale of mortgage books. The fair value of a loan takes into account credit risk at the balance sheet date. Loans and advances to customers are categorised as level 3 as unobservable pre–payment rates are applied. Debt securities classified as loans and receivables Fair values are based on quoted prices, where available, or by discounting cash flows using market rates. Available–for–sale financial assets These are unquoted equity securities held by the Group and relating to participation in banking and credit card operations (refer note 16). They are categorised as level 3 as the fair value of these securities cannot be reliably measured, due to the lack of equivalent instruments with observable prices. Other assets and liabilities – trade debtors/creditors, accrued income and accrued interest Fair value is deemed to approximate the carrying value.
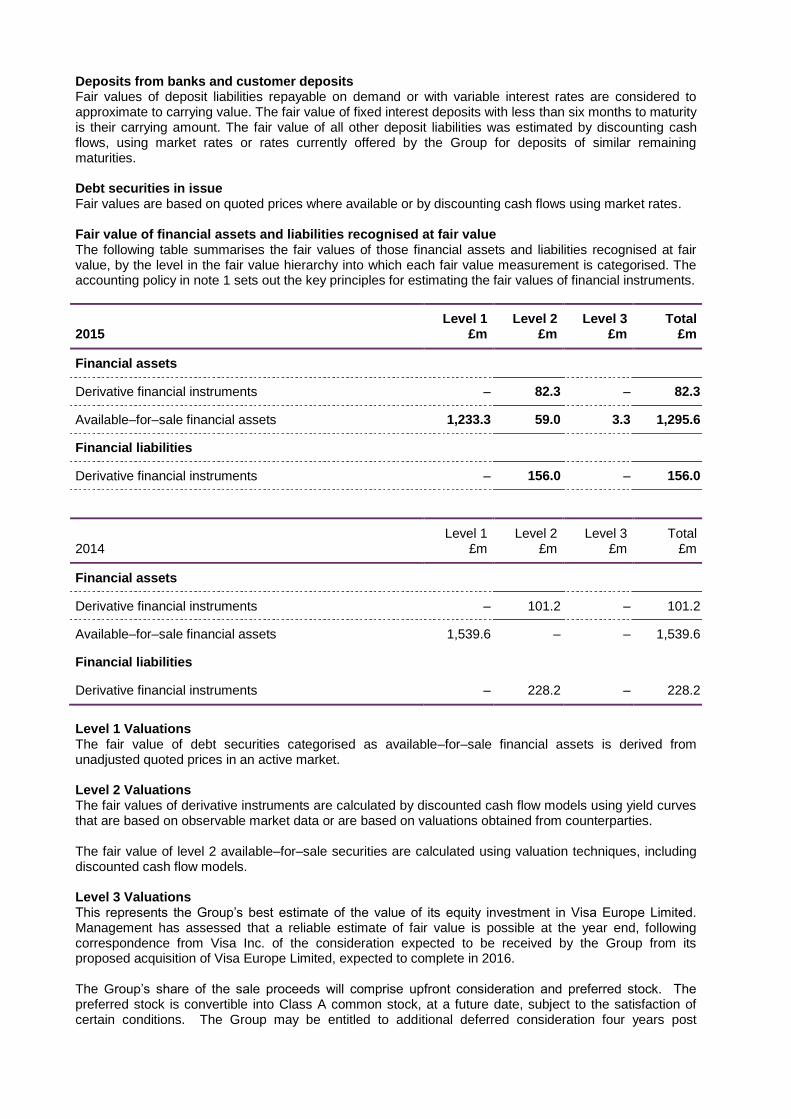
Deposits from banks and customer deposits Fair values of deposit liabilities repayable on demand or with variable interest rates are considered to approximate to carrying value. The fair value of fixed interest deposits with less than six months to maturity is their carrying amount. The fair value of all other deposit liabilities was estimated by discounting cash flows, using market rates or rates currently offered by the Group for deposits of similar remaining maturities. Debt securities in issue Fair values are based on quoted prices where available or by discounting cash flows using market rates. Fair value of financial assets and liabilities recognised at fair value The following table summarises the fair values of those financial assets and liabilities recognised at fair value, by the level in the fair value hierarchy into which each fair value measurement is categorised. The accounting policy in note 1 sets out the key principles for estimating the fair values of financial instruments.
2015 Level 1
£m Level 2
£m Level 3
£m Total
£m
Financial assets
Derivative financial instruments – 82.3 – 82.3
Available–for–sale financial assets 1,233.3 59.0 3.3 1,295.6
Financial liabilities
Derivative financial instruments – 156.0 – 156.0
2014 Level 1
£m Level 2
£m Level 3
£m Total
£m
Financial assets
Derivative financial instruments – 101.2 – 101.2
Available–for–sale financial assets 1,539.6 – – 1,539.6
Financial liabilities
Derivative financial instruments – 228.2 – 228.2
Level 1 Valuations The fair value of debt securities categorised as available–for–sale financial assets is derived from unadjusted quoted prices in an active market. Level 2 Valuations The fair values of derivative instruments are calculated by discounted cash flow models using yield curves that are based on observable market data or are based on valuations obtained from counterparties. The fair value of level 2 available–for–sale securities are calculated using valuation techniques, including discounted cash flow models. Level 3 Valuations This represents the Group‟s best estimate of the value of its equity investment in Visa Europe Limited. Management has assessed that a reliable estimate of fair value is possible at the year end, following correspondence from Visa Inc. of the consideration expected to be received by the Group from its proposed acquisition of Visa Europe Limited, expected to complete in 2016. The Group‟s share of the sale proceeds will comprise upfront consideration and preferred stock. The preferred stock is convertible into Class A common stock, at a future date, subject to the satisfaction of certain conditions. The Group may be entitled to additional deferred consideration four years post
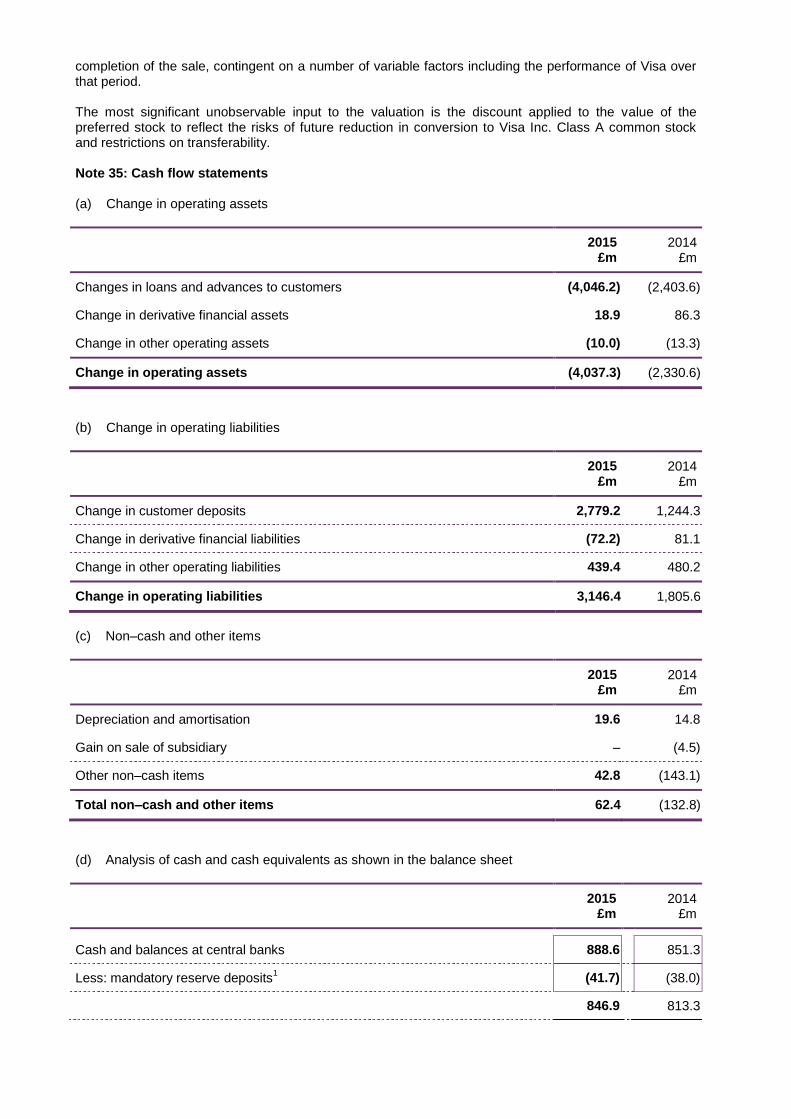
completion of the sale, contingent on a number of variable factors including the performance of Visa over that period. The most significant unobservable input to the valuation is the discount applied to the value of the preferred stock to reflect the risks of future reduction in conversion to Visa Inc. Class A common stock and restrictions on transferability. Note 35: Cash flow statements (a) Change in operating assets
2015
£m 2014
£m
Changes in loans and advances to customers (4,046.2) (2,403.6)
Change in derivative financial assets 18.9 86.3
Change in other operating assets (10.0) (13.3)
Change in operating assets (4,037.3) (2,330.6)
(b) Change in operating liabilities
2015
£m 2014
£m
Change in customer deposits 2,779.2 1,244.3
Change in derivative financial liabilities (72.2) 81.1
Change in other operating liabilities 439.4 480.2
Change in operating liabilities 3,146.4 1,805.6
(c) Non–cash and other items
2015
£m 2014
£m
Depreciation and amortisation 19.6 14.8
Gain on sale of subsidiary – (4.5)
Other non–cash items 42.8 (143.1)
Total non–cash and other items 62.4 (132.8)
(d) Analysis of cash and cash equivalents as shown in the balance sheet
2015
£m 2014
£m
Cash and balances at central banks 888.6 851.3
Less: mandatory reserve deposits1 (41.7) (38.0)
846.9 813.3
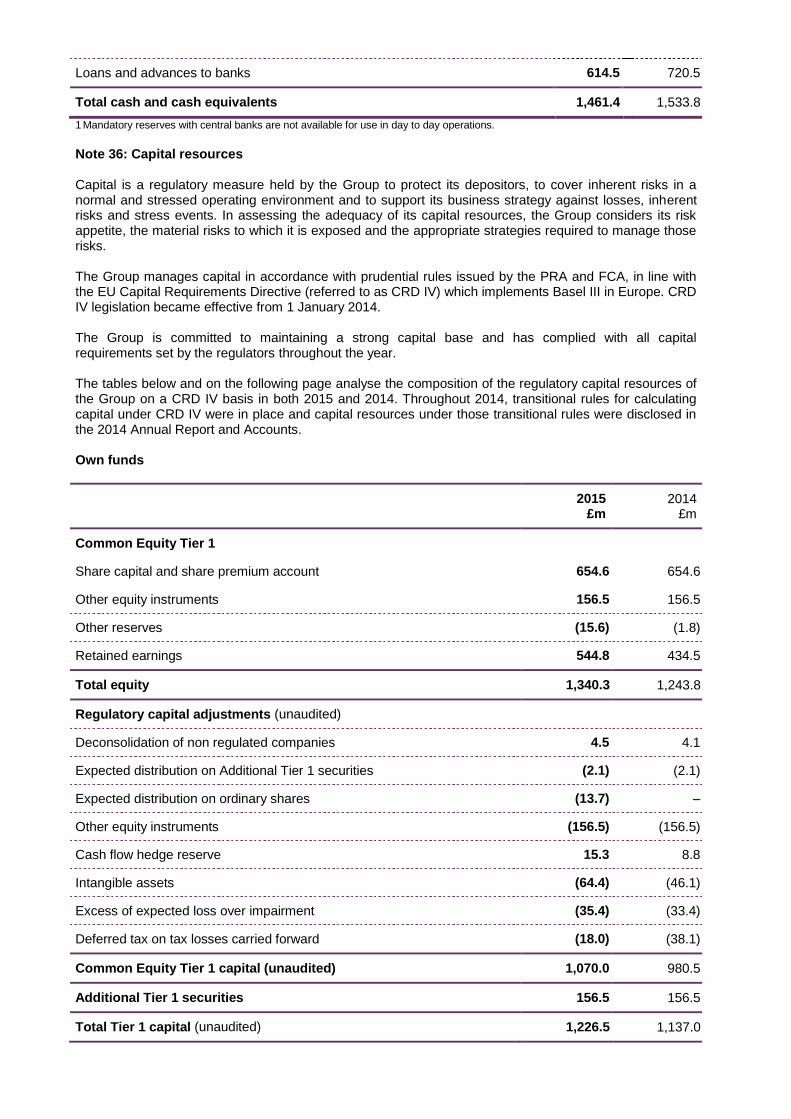
Loans and advances to banks 614.5 720.5
Total cash and cash equivalents 1,461.4 1,533.8
1 Mandatory reserves with central banks are not available for use in day to day operations.
Note 36: Capital resources Capital is a regulatory measure held by the Group to protect its depositors, to cover inherent risks in a normal and stressed operating environment and to support its business strategy against losses, inherent risks and stress events. In assessing the adequacy of its capital resources, the Group considers its risk appetite, the material risks to which it is exposed and the appropriate strategies required to manage those risks. The Group manages capital in accordance with prudential rules issued by the PRA and FCA, in line with the EU Capital Requirements Directive (referred to as CRD IV) which implements Basel III in Europe. CRD IV legislation became effective from 1 January 2014. The Group is committed to maintaining a strong capital base and has complied with all capital requirements set by the regulators throughout the year. The tables below and on the following page analyse the composition of the regulatory capital resources of the Group on a CRD IV basis in both 2015 and 2014. Throughout 2014, transitional rules for calculating capital under CRD IV were in place and capital resources under those transitional rules were disclosed in the 2014 Annual Report and Accounts. Own funds
2015
£m 2014
£m
Common Equity Tier 1
Share capital and share premium account 654.6 654.6
Other equity instruments 156.5 156.5
Other reserves (15.6) (1.8)
Retained earnings 544.8 434.5
Total equity 1,340.3 1,243.8
Regulatory capital adjustments (unaudited)
Deconsolidation of non regulated companies 4.5 4.1
Expected distribution on Additional Tier 1 securities (2.1) (2.1)
Expected distribution on ordinary shares (13.7) –
Other equity instruments (156.5) (156.5)
Cash flow hedge reserve 15.3 8.8
Intangible assets (64.4) (46.1)
Excess of expected loss over impairment (35.4) (33.4)
Deferred tax on tax losses carried forward (18.0) (38.1)
Common Equity Tier 1 capital (unaudited) 1,070.0 980.5
Additional Tier 1 securities 156.5 156.5
Total Tier 1 capital (unaudited) 1,226.5 1,137.0
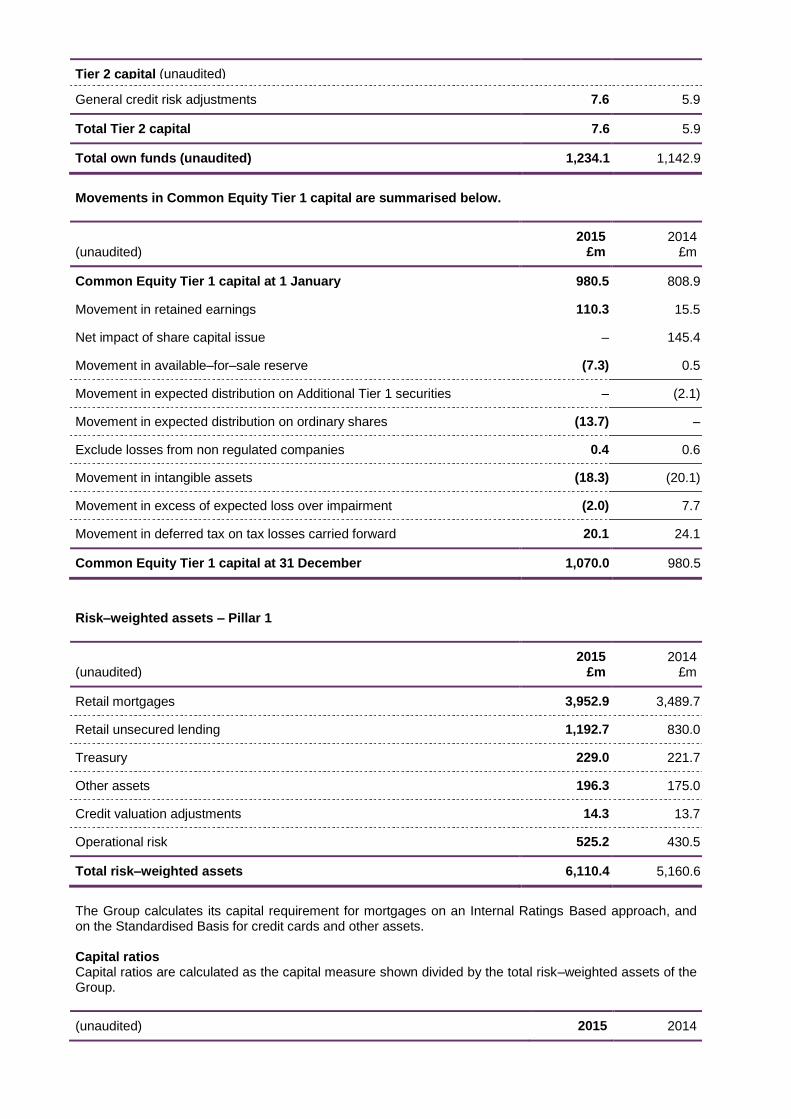
Tier 2 capital (unaudited)
General credit risk adjustments 7.6 5.9
Total Tier 2 capital 7.6 5.9
Total own funds (unaudited) 1,234.1 1,142.9
Movements in Common Equity Tier 1 capital are summarised below.
(unaudited) 2015
£m 2014
£m
Common Equity Tier 1 capital at 1 January 980.5 808.9
Movement in retained earnings 110.3 15.5
Net impact of share capital issue – 145.4
Movement in available–for–sale reserve (7.3) 0.5
Movement in expected distribution on Additional Tier 1 securities – (2.1)
Movement in expected distribution on ordinary shares (13.7) –
Exclude losses from non regulated companies 0.4 0.6
Movement in intangible assets (18.3) (20.1)
Movement in excess of expected loss over impairment (2.0) 7.7
Movement in deferred tax on tax losses carried forward 20.1 24.1
Common Equity Tier 1 capital at 31 December 1,070.0 980.5
Risk–weighted assets – Pillar 1
(unaudited) 2015
£m 2014
£m
Retail mortgages 3,952.9 3,489.7
Retail unsecured lending 1,192.7 830.0
Treasury 229.0 221.7
Other assets 196.3 175.0
Credit valuation adjustments 14.3 13.7
Operational risk 525.2 430.5
Total risk–weighted assets 6,110.4 5,160.6
The Group calculates its capital requirement for mortgages on an Internal Ratings Based approach, and on the Standardised Basis for credit cards and other assets. Capital ratios Capital ratios are calculated as the capital measure shown divided by the total risk–weighted assets of the Group.
(unaudited) 2015 2014
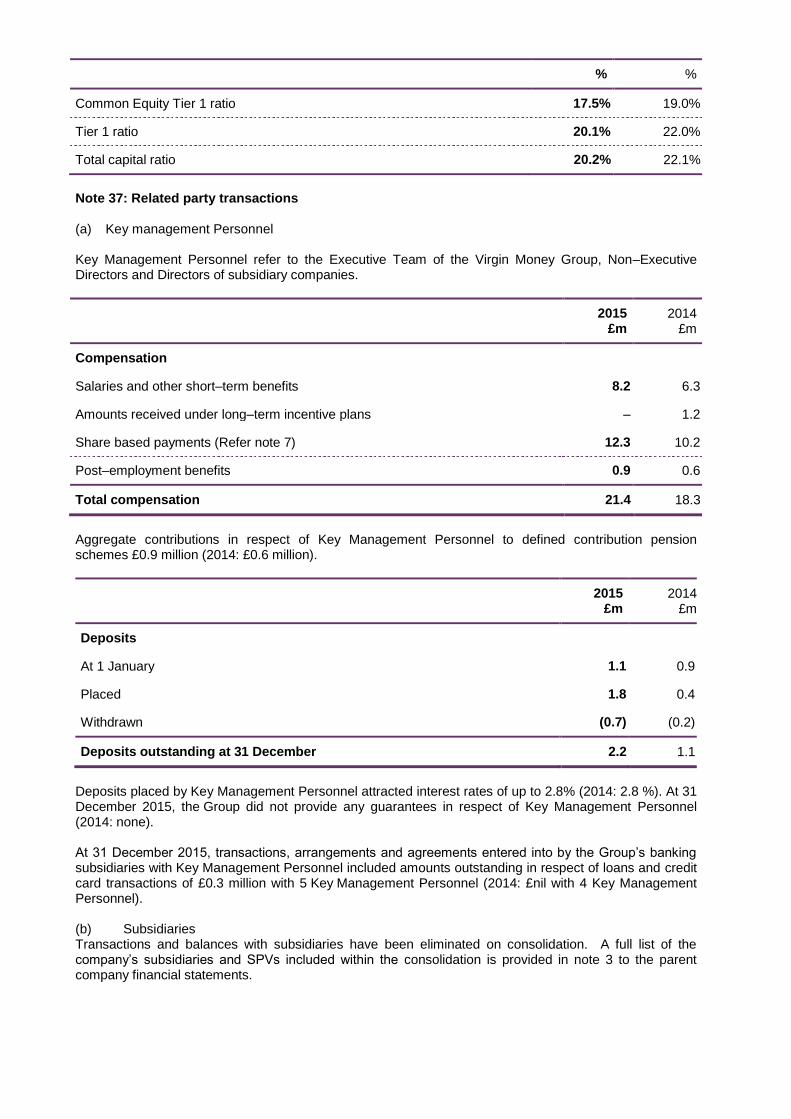
% %
Common Equity Tier 1 ratio 17.5% 19.0%
Tier 1 ratio 20.1% 22.0%
Total capital ratio 20.2% 22.1%
Note 37: Related party transactions (a) Key management Personnel Key Management Personnel refer to the Executive Team of the Virgin Money Group, Non–Executive Directors and Directors of subsidiary companies.
2015
£m 2014
£m
Compensation
Salaries and other short–term benefits 8.2 6.3
Amounts received under long–term incentive plans – 1.2
Share based payments (Refer note 7) 12.3 10.2
Post–employment benefits 0.9 0.6
Total compensation 21.4 18.3
Aggregate contributions in respect of Key Management Personnel to defined contribution pension schemes £0.9 million (2014: £0.6 million).
2015 £m
2014 £m
Deposits
At 1 January 1.1 0.9
Placed 1.8 0.4
Withdrawn (0.7) (0.2)
Deposits outstanding at 31 December 2.2 1.1
Deposits placed by Key Management Personnel attracted interest rates of up to 2.8% (2014: 2.8 %). At 31 December 2015, the Group did not provide any guarantees in respect of Key Management Personnel (2014: none). At 31 December 2015, transactions, arrangements and agreements entered into by the Group‟s banking subsidiaries with Key Management Personnel included amounts outstanding in respect of loans and credit card transactions of £0.3 million with 5 Key Management Personnel (2014: £nil with 4 Key Management Personnel). (b) Subsidiaries Transactions and balances with subsidiaries have been eliminated on consolidation. A full list of the company‟s subsidiaries and SPVs included within the consolidation is provided in note 3 to the parent company financial statements.
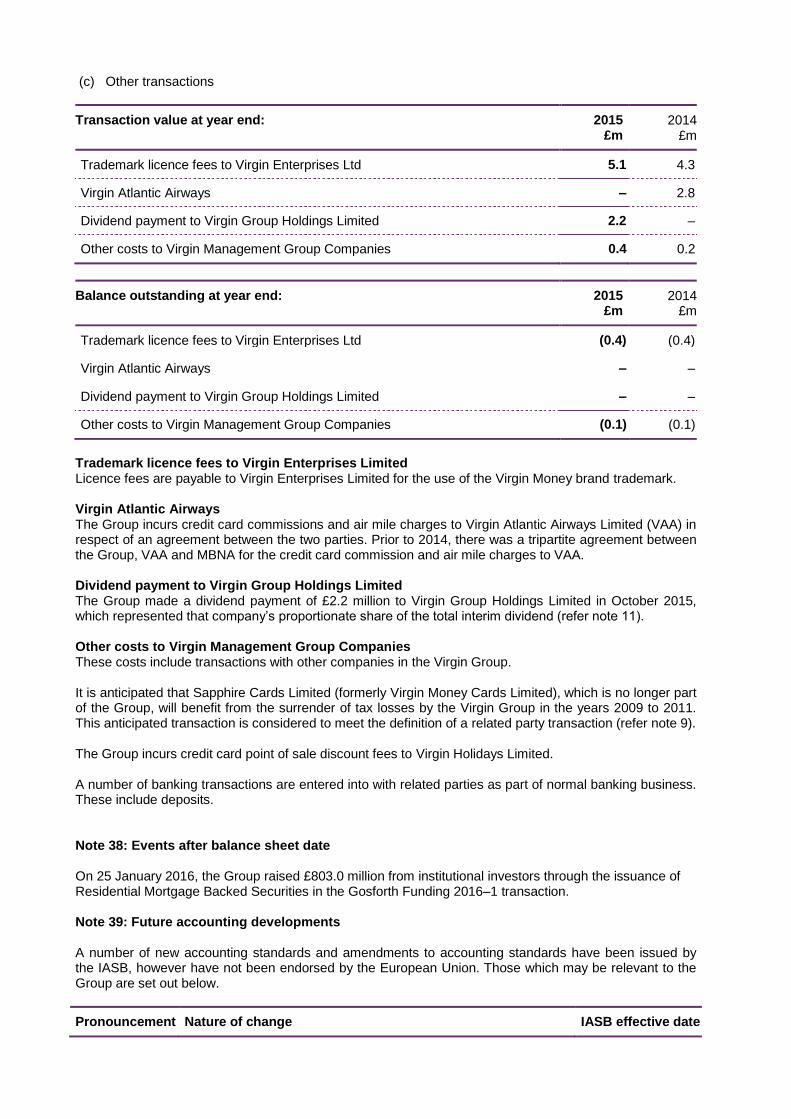
(c) Other transactions
Transaction value at year end: 2015 £m
2014 £m
Trademark licence fees to Virgin Enterprises Ltd 5.1 4.3
Virgin Atlantic Airways – 2.8
Dividend payment to Virgin Group Holdings Limited 2.2 –
Other costs to Virgin Management Group Companies 0.4 0.2
Balance outstanding at year end: 2015 £m
2014 £m
Trademark licence fees to Virgin Enterprises Ltd (0.4) (0.4)
Virgin Atlantic Airways – –
Dividend payment to Virgin Group Holdings Limited – –
Other costs to Virgin Management Group Companies (0.1) (0.1)
Trademark licence fees to Virgin Enterprises Limited Licence fees are payable to Virgin Enterprises Limited for the use of the Virgin Money brand trademark. Virgin Atlantic Airways The Group incurs credit card commissions and air mile charges to Virgin Atlantic Airways Limited (VAA) in respect of an agreement between the two parties. Prior to 2014, there was a tripartite agreement between the Group, VAA and MBNA for the credit card commission and air mile charges to VAA. Dividend payment to Virgin Group Holdings Limited The Group made a dividend payment of £2.2 million to Virgin Group Holdings Limited in October 2015, which represented that company‟s proportionate share of the total interim dividend (refer note 11). Other costs to Virgin Management Group Companies These costs include transactions with other companies in the Virgin Group. It is anticipated that Sapphire Cards Limited (formerly Virgin Money Cards Limited), which is no longer part of the Group, will benefit from the surrender of tax losses by the Virgin Group in the years 2009 to 2011. This anticipated transaction is considered to meet the definition of a related party transaction (refer note 9). The Group incurs credit card point of sale discount fees to Virgin Holidays Limited. A number of banking transactions are entered into with related parties as part of normal banking business. These include deposits. Note 38: Events after balance sheet date On 25 January 2016, the Group raised £803.0 million from institutional investors through the issuance of Residential Mortgage Backed Securities in the Gosforth Funding 2016–1 transaction. Note 39: Future accounting developments A number of new accounting standards and amendments to accounting standards have been issued by the IASB, however have not been endorsed by the European Union. Those which may be relevant to the Group are set out below.
Pronouncement Nature of change IASB effective date
IFRS 9 „Financial Instruments‟
IFRS 9 „Financial Instruments‟, published in July 2014, replaces the existing guidance in IAS 39 „Financial Instruments: Recognition and Measurement‟. IFRS 9 is split over 3 phases: Phase 1 includes revised guidance on the classification and measurement of financial instruments. Financial assets will be classified and measured based on the business model under which they are held and the characteristics of their contractual cash flows. Financial liabilities designated under the fair value option will be required to generally present fair value changes that are attributable to the liability's credit risk in other comprehensive income rather than profit or loss. Phase 2 is a new expected credit loss model for calculating impairment on financial assets Under this approach, it is no longer necessary for a credit event to have occurred before credit losses are recognised. Instead, the Group will always account for expected credit losses and changes in those expected credit losses. Phase 3 is the new general hedge accounting requirements. These requirements aim to more closely align hedge accounting with the Group's risk management strategy. The work on macro hedging by the IASB is still at a preliminary stage and has not yet been issued as part of the finalised standard. A project team has been mobilised to begin work on assessing the impact of IFRS 9 across the Group, with particular emphasis on phase 2 – the new impairment expected credit loss model. At this stage a full assessment of the impact of IFRS 9 has not been made by the Group. The Group is on track to successfully deliver the changes required to adopt IFRS 9 on 1 January 2018 (subject to EU endorsement).
1 January 2018 (has not been EU endorsed)
IFRS 15 „Revenue from Contracts with Customers‟
Current revenue recognition accounting standards have led to inconsistencies in accounting for similar transactions and inadequate disclosures. IFRS 15 specifies comprehensive principles on whether, how much and when an entity should recognise revenue arising from customer contracts. In addition, extensive disclosure requirements have been introduced to provide more informative and relevant disclosures, particularly around estimates and judgements. The Group is reviewing the requirements of the new standard to determine its effect on its financial reporting.
1 January 2018 (has not been EU endorsed)
IFRS 16 „Leases‟ This standard replaces IAS 17 „Leases‟ and will result in most leases for lessees being brought on to the Balance Sheet under a single lease model, removing the distinction between finance and operating leases. It requires a lessee to recognise a „right–of–use‟ asset and a lease liability. Lessor accounting remains largely unchanged. The Group is reviewing the requirements of the new standard to determine its effect on its financial reporting.
1 January 2019 (has not been EU endorsed)
Note 40: Country by country reporting The Capital Requirements (Country by Country Reporting) Regulations came into effect on 1 January 2014 and place certain reporting obligations on financial institutions within CRD IV. All companies consolidated within the Group‟s financial statements are UK registered entities. The activities of the Group are described in the Strategic Report.
UK
Number of employees (average FTE) 2,824
Turnover (total income) £521.9m
Pre tax profit £138.0m
Corporation tax paid £5.0m
Public subsidies received £0.0m
The Group received no public subsidies during the year. Glossary Basel II The capital adequacy framework issued by the Basel Committee on Banking
Supervision in June 2006 in the form of the „International Convergence of Capital Measurement and capital standards‟
Basel III Global regulatory standard on Bank Capital Adequacy, Stress Testing and Market and Liquidity proposed by the Basel Committee on Banking Supervision in 2010. See also CRD IV.
Basis Point (bps) One hundredth of a per cent (0.01%). 100 basis points is 1%. Used when quoting movements in interest rates or yields.
Capital at Risk Approach set out for the quantification of interest rate risk expressed as present value of the impact of the sensitivity analysis on the Group‟s capital.
CASS Client Assets Sourcebook – included in the FCA Handbook and sets out the requirements with which firms must comply when holding or controlling client assets.
Certificates of Deposit
Bearer negotiable instruments acknowledging the receipt of a fixed term deposit at a specified interest rate.
Charge Off Charge off occurs on outstanding credit card balances which are deemed irrecoverable. This involves the removal of the balance and associated provision from the balance sheet with any remaining outstanding balance recognised as a loss.
Common Equity Tier 1 Capital
The highest quality form of capital under CRD IV that comprises common shares issued and related share premium, retained earnings and other reserves excluding the cash flow hedging reserve, less specified regulatory adjustments.
Cost of Capital The cost of funds used to finance the business including distributions to AT1 security holders.
Cost of Risk Cost of risk is defined as impairment charges divided by simple average gross loans for a given period.
Cost:Income Ratio Operating expenses compared to total income. The Group calculates this ratio using the „underlying basis‟ which is the basis on which financial information is reported internally to management.
CRD IV In June 2013, the European Commission published legislation for a Capital Requirements Directive (CRD) and Capital Requirements Regulation (CRR) which form the CRD IV package. The package implements the Basel III proposals in addition to the inclusion of new proposals on sanctions for non–compliance with prudential rules, corporate governance and remuneration. The rules are implemented in the UK via the PRA policy statement PS7/13 and came into force from 1 January 2014, with certain sections subject to transitional phase in.
Credit Default Swap A credit default swap is a type of credit derivative. It is an arrangement whereby the credit risk of an asset (the reference asset) is transferred from the buyer to the seller of protection. The entity selling protection receives premium or interest–related payments in return for contracting to make payments to the protection buyer upon a defined credit event. Credit events normally include bankruptcy, payment default on a reference asset or assets, or downgrades by a rating agency.
Credit Enhancements
Techniques that improve the credit standing of financial obligations; generally those issued by a structured entity in a securitisation.
Credit Spread The credit spread is the yield spread between the securities with the same currency and maturity structure but with different associated credit risks, with the yield spread rising as the credit rating worsens. It is the premium over the benchmark or risk–free rate required by the market to take on a lower credit quality.
Credit Valuation Adjustments
These are adjustments to the fair values of derivative assets to reflect the creditworthiness of the counterparty.
Cross–currency Swaps
An arrangement in which two parties exchange specific principal amounts in different currencies at inception and subsequently interest payments on the principal amounts.
Debt Securities Debt securities are assets held by the Group representing certificates of indebtedness of credit institutions, public bodies or other undertakings, excluding those issued by Central Banks.
Default Default occurs where a borrower has missed 6 months of mortgage repayments or 3 months of credit card repayments, or, the borrower is deemed to be unlikely to repay their loan. The definition of unlikely to repay includes those loans where: the property has been taken into possession; loans that have been modified in the form of a “Rescue Solution” debt management plan; loans where the customer is at least one month in arrears and they have active public information at the credit bureau.
Earnings at Risk Approach set out for the quantification of interest rate risk expressed as the impact of the sensitivity analysis on the change to net interest income.
Expected Loss This is the amount of loss that can be expected by the Group calculated in accordance with PRA rules. In broad terms it is calculated by multiplying the Probability of Default by the Loss Given Default by the Exposure at Default.
Exposure at Default (EAD)
An estimate of the amount expected to be owed by a customer at the time of a customer‟s default.
Forbearance Forbearance takes place when a concession is made on the contractual terms of a loan in response to borrowers‟ financial difficulties; or for where the contractual terms have been cancelled for credit cards. Forbearance options are determined by assessing the customer‟s personal circumstances.
Full Time Equivalent (FTE)
A full time employee is one that works a standard five day week. The hours worked by part time employees are measured against this standard and accumulated along with the number of full time employees and counted as full time equivalents.
Funding for Lending Scheme (FLS)
The Bank of England launched the Funding for Lending scheme in 2012 to allow banks and building societies to borrow from the Bank of England at cheaper than market rates for up to four years. This was designed to increase lending to businesses by lowering interest rates and increasing access to credit.
Funding Risk The inability to raise and maintain sufficient funding in quality and quantity to support the delivery of the business plan.
Help to Buy „Help to Buy‟ was formed as part of the 2013 budget announcement by the Government and is part of a package of measures designed to increase the availability of low–deposit mortgages for credit worthy households and to boost the supply of new housing.
Impaired Assets Loans that are in arrears, or where there is objective evidence of impairment, and where the carrying amount of the loan exceeds the expected recoverable amount.
Impairment Allowance
Impairment allowances are a provision held on the balance sheet as a result of the raising of a charge against profit for the incurred loss inherent in the lending book. An impairment allowance may either be individual or collective.
Impairment Losses An impairment loss is the reduction in value that arises following an impairment review of an asset that determined that the asset‟s value is lower than its carrying value. For impaired financial assets measured at amortised cost, impairment losses are the difference between the carrying value and the present value of estimated future cash flows, discounted at the asset‟s original effective interest rate.
Interest Rate Risk The risk of a reduction in the value of earnings or assets resulting from an adverse movement in interest rates.
Interest Rate Risk in the Banking Book (IRRBB)
The risk to interest income arising from a mismatch between the duration of assets and liabilities that arises in the normal course of business activities.
Internal Capital Adequacy Assessment Process (ICAAP)
The Group‟s own assessment of the levels of capital that it needs to hold in respect of its regulatory capital requirements (for credit, market and operational risks) and for other risks including stress events as they apply on a solo level and on a consolidated level.
Leverage Ratio Total Tier 1 Capital expressed as a percentage of Total assets (adjusted in accordance with CRD IV).
Liquidity Coverage Ratio (LCR)
Stock of high quality liquid assets as a percentage of expected net cash outflows over the following 30 days.
Liquidity Risk The inability to accommodate liability maturities and withdrawals, fund asset growth, and otherwise meet the Group‟s contractual obligations to make payments as they fall due.
Loan–to–Deposit Ratio
The ratio of loans and advances to customers net of allowance for impairment divided by customer deposits (each excluding repurchase agreements). Fair value of portfolio hedging is excluded from this calculation.
Loan–to–Value Ratio The amount of a secured loan as a percentage of the appraised value of the security e.g. the outstanding amount of mortgage loan as a percentage of the property‟s value.
Loss Emergence Period
The loss emergence period is the estimated period between impairment occurring and the loss specifically identified and evidenced by the establishment of an appropriate impairment allowance.
Loss Given Default (LGD)
The estimated loss that will arise if a customer defaults. It is calculated after taking account of credit risk mitigation and includes the cost of recovery.
Master Netting Agreement
An agreement between two counterparties that have multiple derivative contracts with each other that provides for the net settlement of all contracts through a single payment, in a single currency, in the event of default on, or termination of, any one contract.
Net Interest Income The difference between interest received on assets and interest paid on liabilities.
Net Interest Margin (NIM)
Net interest income as a percentage of average interest–earning assets.
Net Stable Funding Ratio (NSFR)
The ratio of available stable funding to required stable funding over a one year time horizon, assuming a stressed scenario. The ratio is required to be 100% with effect from 2018. Available stable funding would include such items as equity capital, preferred stock with a maturity of over 1 year, or liabilities with a maturity of over 1 year.
Option An option is a contract that gives the holder of the right but not the obligation to buy (or sell) a specified amount of the underlying physical or financial commodity, at a specified price, at an agreed date or over an agreed period.
Percentage Point (pp)
Unit for measuring the difference of two percentages. A change from 1% to 2% is 1 percentage point.
Pillar 1 The part of CRD IV that sets out the process by which regulatory capital requirements should be calculated for credit, market and operational risk.
Pillar 2 The part of CRD IV that sets out the process by which a bank should review its overall capital adequacy and the processes under which the supervisors evaluate how well financial institutions are assessing their risks and take appropriate actions in response to the assessments.
Pillar 3 The part of CRD IV that sets out the information banks must disclose in relation to their risks, the amount of capital required to absorb them, and their approach to risk management. The aim is to strengthen market discipline.
Probability of Default (PD)
The probability of a customer becoming six months or more past due on their mortgage obligations, or three month past due for credit cards, over a defined outcome period. The outcome period varies for assessment of capital requirements and for assessment of provisions.
Repurchase Agreements (Repos)
An agreement where one party, the seller, sells a financial asset to another party, the buyer, at the same time the seller agrees to reacquire and the buyer to resell the asset at a later date. From the seller‟s perspective such agreements are repurchase agreements (repos) and from the buyer‟s reverse repurchase agreements (reverse repos).
Retail Distribution Review
Consumer protection strategy of the FCA.
Return on Equity Profit attributable to ordinary shareholders divided by average shareholders‟ equity.
Return on tangible equity
Underlying profit before tax adjusted for distributions to Additional Tier 1 noteholders and tax divided by average tangible equity.
Risk Appetite The Variability in results or key outcomes that the board is willing to accept in support of the Group.
Risk–Weighted Assets
A measure of a bank‟s assets adjusted for their associated risks. Risk weightings are established in accordance with PRA rules.
Secured Lending Lending on which the borrower uses collateral such as equity in their home.
Securitisation Securitisation is a process by which a group of assets, usually loans, are aggregated into a pool, which is used to back the issuance of new securities through an SPV.
Sovereign Exposures
Exposures to central governments and central government departments, central banks and entities owned or guaranteed by the aforementioned.
Standardised Approach
In relation to credit risk, a method for calculating credit risk capital requirements using External Credit Assessment Institutions (ECAI) ratings of obligators (where available) and supervisory risk weights. In relation to operational risk, a method of calculating the operational risk capital requirement by the application of a supervisory defined percentage charge to the gross income of specified business lines.
Stress Testing Techniques where plausible events are considered as vulnerabilities to ascertain how this will impact the capital resources which are required to be held.
Tangible Equity A subset of shareholders equity that is not intangible assets.
Tier 1 Capital A measure of banks financial strength defined by the PRA. It captures Common Equity Tier 1 capital plus other Tier 1 securities in issue, but is subject to a deduction in respect of material holdings in financial companies.
Tier 1 Capital Ratio Tier 1 capital as a percentage of risk–weighted assets.
Tier 2 Capital A further component of regulatory capital defined by the PRA. It comprises eligible collective assessed impairment allowances under CRD IV.
Underlying EPS Underlying profit before tax adjusted for distributions to Additional Tier 1 noteholders and tax divided by the weighted–average number of Ordinary Shares outstanding during the period excluding own shares held in employee benefit trusts or held for trading.
Unsecured Lending Lending with no collateral held such as credit cards and current account overdrafts.
Virgin Virgin Group Holdings Limited
Virgin Money Foundation
A new charitable foundation established by Virgin Money to invest in projects designed to benefit communities in which Virgin Money works.
Virgin Money Trademark Licence Agreement
The agreement under which Virgin Enterprises Limited grants perpetual licence to Virgin Money to use the “Virgin” and “Virgin Money” trademarks.
WLR WLR IV VM LLC and WLR IV VM II LLC, together major shareholders of the Company.
Write Off Mortgages: may be written off where the outstanding balance or shortfall from sale of property is deemed irrecoverable. Assets written off will be deducted from the balance sheet. Credit cards: a write off occurs following charge off when all attempts to recover the outstanding balance is exhausted and the account is closed.
Yield Curve A line that plots the interest rates, at a set point in time, of an asset class or swap rate at varying maturities. This can be used as a gauge to evaluate the future of interest rates.
Abbreviations AGM Annual General Meeting
AIL Ageas Insurance Limited
AT1 Additional Tier 1
BBA British Bankers Association
BBR Bank Base Rate
BOE Bank of England
CET1 Common Equity Tier 1 Capital
CMA Competition and Markets Authority
CML Council of Mortgage Lenders
CONC Consumer Credit Sourcebook
CRD Capital Requirements Directive
CRR Capital Requirements Regulation
CVA Credit Valuation Adjustment
DTR Disclosure and Transparency Rules
EBO Everyone‟s better off
ECA Essential Current Account
EPS Earnings per share
FCA Financial Conduct Authority
FLS Funding for Lending Scheme
FPC Financial Policy Committee
FRC Financial Reporting Council
FSCS Financial Services Compensation Scheme
FTP Funds Transfer Pricing
GHG Greenhouse Gas
HMRC Her Majesty‟s Revenue and Customs
HPI House Pricing Index
IAS International Accounting Standards
IASB International Accounting Standards Board
ICAAP Internal Capital Adequacy Assessment Process
IFDS International Financial Data Services Limited
IFRS International Financial Reporting Standards
ILAA Individual Liquidity Adequacy Assessment
IPO Initial Public Offering
ISA Individual Savings Account
ISDA International Swaps and Derivatives Association
LIBOR London Inter–Bank Offered Rate
LTIP Long–Term Incentive Plan
MTN Medium Term Note
NPS Net Promoter Score
OTC Over the Counter
PCA Personal Current Account
PRA Prudential Regulation Authority
RMBS Residential Mortgage Backed Securities
SME Small or Medium–sized Enterprise
SPV Special Purpose Vehicle
TNAV Tangible net asset value
TSYS Total System Services, Inc
Enquiries: Virgin Money Press Office Brian Giles / Simon Hall 0191 279 4676 or [email protected] FTI Consulting John Waples / Laura Ewart 07717 814520 / 020 3727 1160 [email protected] / [email protected] Virgin Money Investor Relations Adam Key 020 7111 1311 or [email protected]

Ken Donald 020 7111 1308 or [email protected] Issued by Virgin Money Holdings (UK) plc Registered office: Jubilee House, Gosforth, Newcastle upon Tyne NE3 4PL Registered in England and Wales, Company No. 03087587