Embed Size (px)
Citation preview

VINCI AIRPORTS INVESTOR DAY
Lisbon, 14 November 2014

2
Disclaimer
This presentation may contain forward-looking objectives and statements about VINCI’s and VINCI Airport’s financial situations, operating results, business activities and expansion strategies.
These objectives and statements are based on assumptions that are dependent upon significant risk and uncertainty factors that may prove to be inexact. The information is valid only at the time of writing, and neither VINCI nor VINCI Airports not assume any obligation to update or revise the objectives on the basis of new information or future or other events, subject to applicable regulations.
Additional information on the factors that could have an impact on VINCI’s financial results is contained in the documents filed by the Group with the French securities regulator (AMF) and available on the Group’s website at www.vinci.com or on request from its head office.

3
Pierre ABIGNANO Commercial Director
VINCI Airports
Thierry LIGONNIERE COO ANA
VINCI Airports Investor Day Today’s speakers
Nicolas NOTEBAERT Chairman and CEO
VINCI Airports Jorge PONCE DE LEAO
Chairman ANA
Pierre GROSMAIRE Airline Marketing Dir.
VINCI Airports
Luis VAZ Marketing Director
ANA
Pierre COPPEY Chairman and CEO VINCI Concessions
Christian LABEYRIE Executive Vice-President
& CFO VINCI
Benoit TROCHU Business Development Dir.
VINCI Airports

Welcome & Introduction 1

5
8%
92%
VINCI Airports is now a more significant contributor to VINCI’s concession activities
EBIT Capital employed Revenue
€5.3 bn
EBITDA
€26.9 bn
€3.5 bn
(2013 data pro forma, including ANA on a full year basis and excluding VINCI Park)
€2.2 bn Total:
Other concessions VINCI Airports VINCI Autoroutes
12%
86%
2% 8%
92%
14%
85%
1%
Total VINCI Airports:
€0.6 bn €0.3 bn €0.2 bn €3.7 bn
Δ∆ Sept 14/ Sept 13: +11% (9M)
VINCI Airports 2014 revenue:

Presentation of VINCI Airports 2

7
23 airports
> 46 million passengers in 2014(e)
> €700m revenue in 2014(e)
100 regular airlines
450 destinations worldwide
10 airports in Portugal
10 airports in
France 3
airports in Cambodia
> 5,000 employees
VINCI Airports is a major international player
8% stake in

8
VINCI Airports is at the heart of VINCI’s strategy
! Take advantage of worldwide air traffic growth (~2x GDP growth) ! Contribute to VINCI’s international expansion ! Extract strong operational leverage ! Diversify revenue streams ! Extend maturity profile of VINCI Concessions’ portfolio
VINCI Airports: #1 strategic focus in the concession business
VINCI Airports benefits from the VINCI Group’s strengths
! Investment capability ! Financial capacity ! Synergies with the VINCI’s businesses

9
VINCI Airports’ investor / operator business model
Investor Operator /
! Seek out greenfield and brownfield opportunities
! Strong integration capability ! Financial capacity to support the
development of platforms
! Provide optimum management ! Develop all business streams
" Airport marketing, route expansion, non-æronautical activities
! Expertise of our multi-disciplinary teams " Operations, finance, legal affairs,
marketing " Management of long term relationship
with public grantors
Synergy creation with the rest of the Group

10
VINCI Airports’ value creation proposition
Increase revenue
Optimize opex and capex
! Develop traffic
! Maximize revenue per pax
! Cost-efficient management
! Engineering know-how

11
Main concessions maturities: up to 2065
Long term contracts visibility and stability
End of concession / public service delegation (PSD) contracts:
2014 Cambodia Airports
2040 ANA 2063
Aéroports du Grand Ouest
(Nantes, Saint-Nazaire) 2065
2016 2029
8 regional airports in France

12
A diversified portfolio of activities Profitability profile
PSD: Public service delegation GH: Ground handling
PSD contracts (France)
6%
Ground Handling (Portugal)
7%
Nantes Airport 9%
ANA excl. GH 64%
Cambodian Airports
14%
VINCI Airports 2014(e) revenue breakdown 2014(e) EBITDA margin by activity
EBITDA margin
0%
60%
PSD contracts France
Ground Handling Portugal
Cambodian Airports
ANA (ex-GH)
Nantes Airport VINCI Airports 2014(e) EBITDA margin > 45%

13
France: a network of 10 regional airports
Concession: Aéroports du Grand Ouest - Nantes/ Saint-Nazaire 4.2 mpax in 2014(e)
" Traffic growth: ~ 6% in 2014(e)
" Development of new Nantes airport: legal challenges not yet resolved
Public service delegation: 8 airports 1.8 mpax in 2014(e)
" Very limited capital employed
" No loss-making contract
" 100% renewal
10* airports
2 types of assets with different contractual frameworks and financial profiles
6.0 mpax in 2014(e)
> €100m Revenue in 2014(e)
! Nantes ! Rennes ! Clermont ! Grenoble ! Chambéry ! Dinard ! Poitiers ! Quimper ! Saint-Nazaire ! Ancenis
* Plus Toulon as of 1 January 2015 ** ATM: Air traffic movements
85,000 ATMs** in 2014(e)

14
3 airports
Strong development, self-financed
5.6 mpax in 2014(e)
€100m Revenue in 2014(e)
! Phnom Penh
! Siem Reap
! Sihanoukville
*ATM: Air traffic movements
64,000 ATMs*
in 2014(e)
Cambodia: a success story
" Dynamic emerging markets Strong growth in traffic
" EBITDA growth driven by a strong volume effect EBITDA: x3 between 2009 and 2014(e)
" Expansion: terminal capacities increased to 10 mpax; retail expansion
" Strong cash generation
2000
4000
6000
2009 2010 2011 2012 2013 2014(e)
Passenger traffic (kpax)
x2 in 5 years 2,800
5,600
VINCI Airports optimal management model in action

15
10 airports
High quality assets including a major European hub
35 mpax in 2014(e)
>€500m Revenue in 2014(e)
*ATM: Air traffic movements
300,000 ATMs*
in 2014(e)
! Lisbon
! Porto
! Faro
! Beja
! 2 in Madeira
! 4 in the Azores
ANA: flagship platform with high potential for development
" Strong traffic dynamics International traffic > 80% of total
" Sound financial track record 2009-2014(e) EBITDA CAGR: 10%
" Regulation offering long term visibility
ANA’s size and track record make it VINCI Airports’ flagship platform for international expansion

16
Underweight of Non-Aviation business upside
Diversity of revenue streams
Aviation 45%
Security/PRM 13%
Ground Handling
17%
Non-Aviation 25%
1
2
3
4
VINCI Airports revenue breakdown by activity (2013): Aviation ! Most of revenues are regulated: passenger & landing
fees Drivers: passenger traffic, ATMs*, regulatory framework
Non-Aviation ! Retail, real estate, car parks, car rental, advertising ! Strong potential upside
Drivers: traffic, surfaces, lay-out, contract management
Ground handling ! In Cambodia and France where integrated: directly
operated by airport manager ! In Portugal: Portway, 100% subsidiary of ANA
Drivers: ATMs, passenger traffic Security / PRM** ! Mandatory activities ! At cost activities
* ATMs: Air traffic movements ** PRM : Persons with reduced mobility
1
2
3
4

17
Dynamic traffic trend
2012* 2013* 2014(e)
40
VINCI Airports passenger traffic (in mpax):
43 >46
Pax traffic growth: (yoy at 31 Oct. 2014)
VINCI Airports: +9.1% ! Portugal: +9.4% ! Cambodia: +13.1% ! France: +4.2%
+7% +8%
* Pro forma with ANA on a full-year basis

18
VINCI Airports Key financials
* 2013 pro forma: with ANA consolidated on a full year basis. Provisional data (purchase accounting under course)
In €m 2013 Pro forma * 2014(e)
Passenger traffic (in mpax) 42.9 > 46
Revenue 629 > 700
Portugal 440 > 500
Cambodia 91 ~ 100
France 99 > 100
EBITDA 265
EBITDA margin 42% > 45%
EBIT 170
EBIT margin 27% > 30%
Capital employed (end of year) o/w ANA:
3,684 2,942

3 Focus on ANA

20
ANA
10 airports in 5 regions 35 million passengers (2014(e)) Strong traffic growth
A 50 year concession 100% owned by VINCI Airports

21
Dynamic traffic
Airport traffic: Portugal is the 3rd fastest growing country in Europe
Airport traffic growth in main European countries At the end of September 2014 vs. end of September 2013 (YTD)
France Germany Norway Finland Italy UK Spain Sweden Portugal Turkey Greece
2.1% 2.6% 3.2% 3.4% 4.1% 4.2% 4.6% 4.8%
9.4%
11.5%
15.1%

22
Main traffic growth levers
1
3
Develop Lisbon potential as the
leading hub between Europe and South
America/Africa
! The leading hub towards Brazil (25% of the total market share in Europe)
2
! Destination affordability ! Strong focus of Portuguese
tourism authorities on city-break development
! Geopolitical environment in North Africa
Develop short city-break concept for
European tourists
3
Benefit from increasing share
of VFR*
! One third of the Portuguese living outside Portugal
* VFR: Visiting friends and relatives

23
10M 2013 10M 2014
Azores Madeira Faro Porto Lisbon
1.1
13.7
5.5
5.6 2.1
15.5
Dynamic traffic as of October 2014
+13.4%
28.0 30.6 +9.4%
Lisbon is growing at 13% over 10 months
+8.2%
+3.4% 2.2 1.1
5.9
5.8
Lisbon: targeting 18m pax over full year 2014
2013 2014(e)
32.0 m 35 m
+5.0% +9%
284,000 300,000
+1.4% +5% !
ATMs
" PASSENGE
RS
ANA 2014(e) full year traffic expected +9%

24
Portugal 16%
Spain 8%
UK 18%
France 13%
Germany 9%
Brazil 5%
Other 31%
A diversified traffic
TAP 37%
Ryanair 15%
easyJet 12%
SATA 5%
Other 24%
Diversified geographical exposure Balanced mix between airlines
At end Sept. 2014
3%
4%
5%
12% 15%
37%

25
A dynamic aviation marketing
New international routes opened by TAP: ! Lisbon / Bogota ! Lisbon / Manaus ! Lisbon / Panama Between airports of VINCI Airports network: ! Nantes / Lisbon ! Nantes / Funchal ! Rennes / Porto ! Clermont-Ferrand / Porto ! Poitiers / Porto
74 routes opened in 2014 / 42 in 2013 2 new operational bases
RYANAIR in LISBON (end of 2014)
! 3 aircraft based ! > 1 mpax expected (coming from
based and non-based aircraft)
EASYJET in PORTO (mid 2015)
! 2 aircraft based ! 160 kpax expected in 2015

26
North America ! +18.3%
3.3%
LISBON AIRPORT Traffic breakdown by geographical area (9M 2014)
Africa
! +7.8%
6.7%
Middle East
! +32.0%
1.3%
South America
! +7.5%
9.3%
Europe
! +14.0%
79.4%
Yoy growth: +13.3%
!
Share of total Lisbon traffic

27
ANA regulatory framework
A transparent and incentivizing regulatory framework
Concession maturity 50 years
Aeronautical tariff increases Price cap applied to æronautical tariffs on an inflation-linked formula with no reference to a regulated asset base
Non-æronautical revenues Not regulated Non-æronautical revenue per pax below European average
Capex requirements (over the next 10 years) To be discussed with Grantor – already approved up to 2017
Investment protection Minimum IRR guaranteed in case of no agreement on the development of a new airport in Lisbon
ANA benefits from all upside on: traffic, non-æronautical activities, cost base control, capex management

28
Aviation tariffs increased according to regulation
! Aviation tariffs increased every year based on an inflation-linked formula
June 2013 Dec. 2013 April 2014
Lisbon +3.5% +3.6% +2.5%
Porto +1.7% - +2.7%
Faro +2.6% - +3.0%
Aviation tariff increases by airport:

29
Structure of revenues
Retail 58%
Car Parks 15%
Car rental 9%
Misc. 4%
Real estate 14%
Aviation 49%
Security & PRM* 11%
Non- Aviation
26%
Handling
14%
* PRM: Persons with Reduced Mobility
In % of ANA 2014(e) revenue

30
Operating costs
Cost structure
Effective and efficient cost management
! Slight increase (in line with business plan)
2
1 ! Stable
Staff costs
24%
24%
Nature % of 2013 rev.
Surveillance and security 5.5%
Subcontracting 3.9%
Utilities 3.8%
Maintenance & repair 3.5%
Specialised work 2.8%
Other operating costs 4.5%
3 Other 7%
% of 2013 PF Revenue 2014 Evolution
Total 2014 operating costs are lower than business plan
! Stable

31
Limited capex over the next 5 years 2013-2017 capex plan approved by the grantor
5-year capex plan: approx. €50m per year
Lisbon 45%
Faro 25%
Porto 10%
Faro 10%
! Terminal extension, mostly in 2015 & 2016
! Pavements of runway and aircraft parking stands
! Terminal 1: improvements of passengers flows, check-in area and immigration checkpoints, mainly in 2015
! Maintenance of runway and taxiway
! Pavement of runway and aircraft parking stands
! Strengthening and reshaping of runway
€53m in 2013
€38m in 2014(e)

32
New Lisbon Airport (NLA)
2014
Adjusted regulatory
framework for NLA*
Trigger for discussions on NLA
with grantor: Traffic = 22m pax
Initial estimate: 11 years
4-year period for discussion with grantor
* In case of disagreement on new NLA framework: indemnification of initial investment

33
ANA: outlook update
What we forecasted back in Sept. 2013 Where we stand today
Traffic +2% to +3%
2012-2022 CAGR CAGR 2012-2014: 7.2%
Non-æronautical revenue
> 5%
2012-2022 CAGR CAGR 2012-2014: 8.0%
EBITDA margin ~50% in 2018 2 - 3 years ahead of plan
Capex c. €50m / year
2013-2022
Forecast confirmed Capex plan approved up to 2017

Airline Marketing 4

35
! > 100 schedule airlines ! > 25 LCCs ! > 50 charter airlines ! > 200 tour operators / import & export ! > 250 business aviation airlines
! > 100 new routes; 74 for ANA
! 13 new airlines; 9 for ANA
VINCI Airports develops the full range of airlines on all the airports of its network
In 2013
In 2014 (YTD)

36
VINCI Airports has proven expertise in aviation marketing
Methodology Good understanding of market drivers
Relationships Strong with airlines and Tour Operators
Development Traffic and network

37
Airport marketing: ”PPP+1”
Product to attract airlines and Tour Operators generally not enough
Price key in some markets
Promotion important, especially for LCCs
Place constrained de facto

38
! Economy ! Population & propensity to fly ! Outbound and inbound* tourism ! Diaspora and student communities ! Business and international trade ! 2nd homes ! Competing airports ! Traffic rights
! Airport statistics ! Passenger profiles ! Alternative airports and modes of travel ! Surveys: passengers, travel agencies, main
local businesses ! “big data”
Methodology: good understanding of market drivers
Air travel demand drivers analysis and strategic positioning Airport market research
VINCI Airports has a good understanding of market conditions on its existing and future airport platforms
* Outbound = tourism from the considered area; inbound = tourism to the considered area

39
Ryanair Clermont-Ferrand: new route to Porto Analysis of the Portuguese community in France
187 – 1,263
1,264 – 2,405
2,406 – 5,305
5,306 – 43,455
Portuguese nationals by region:
Airports connected to Portugal VINCI Airports

40
Close relationships with airlines and Tour Operators (TOs)
Sometimes we play the role of broker: ! We gather TOs demands to reduce the airline risk ! Recent example of success: Vueling Barcelona – Funchal for summer 2015
We organize fame trips: ! We work with tourism authorities, airlines and TOs ! Recent example: new charter flights in Cambodia, in particular for the Chinese New Year and that
is how the China – Cambodia market started
We organize workshops and travel trade shows

41
Turkish Airlines in Porto: new route to Istanbul
EU Rank Airport Pax 2012 TK PGS
1 London 70,038,857
2 Paris CDG 61,556,202
3 Frankfurt 57,520,001
4 Amsterdam 51,035,590
28 Lisbon 15,301,236
37 Gran Canaria 9,882,063
49 Alicante 8,844,099
50 Tenerife 8,513,100
57 Glasgow 7,160,299
61 Catania 6,242,669
62 Porto 6,050,252
64 Bristol 5,921,515
66 Faro 5,672,536
68 Bergen 5,516,197
69 Bâle 5,349,872
70 Hanover 5,287,831
! Porto airport was one of the biggest EU airports to which Turkish Airlines was not flying
! Detailed study on potential traffic
beyond Istanbul: future potential connecting traffic
! Very positive impacts expected:
" 4 flights/week from Summer 2015 " A319 aircraft: 144 seats " 45,000 pax

42
Capacity to boost traffic VINCI Airports outperforms natural traffic growth
2014 data until September 2014 end of year assumed consistent with the past
Bordeaux
Toulouse
Marseille
Mulhouse
Nice
Lyon
Nantes
1.6%
0.2%
7.0%
5.7%
2.4% 3.6%
3.7%
7.2%
ADP
ANA
AENA
ADP
Frankfurt
ADR
1.6%
1.8%
- 2%
6%
-0.2%
2,0%
Heathrow
Singapore
Kuala Lumpur
Cambodia Airports Bangkok Suvarnabhumi
4.4%
11.5%
5.6%
10.4%
Traffic CAGR 2011-2014

43
Ability to do long-term forecasts
Drivers ! Analysis of demand drivers: GDP, tourism, population, ticket prices… ! Bottom-up forecast with airlines ! Mathematical forecast ! Analysis of infrastructure constraints (Air Traffic Control) and external constraints (access to tourist sites…) ! Confrontation with external data and propensity to fly ratios
Typical elasticities ! GDP 0.8 (for very mature markets) - 3 ! Per capita income 1.4 - 2.5 ! Imports or exports 0.8 - 1.0 ! Jobs 0.9 - 1.1 ! Prices -1.3 - 0.6
Key to business development

Non-Aviation Marketing 5
45
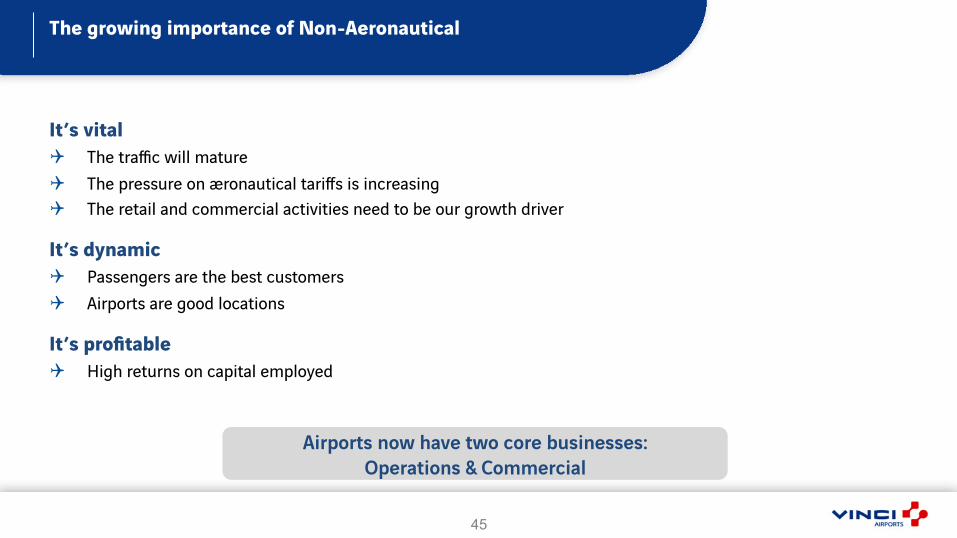
The growing importance of Non-Aeronautical
It’s vital ! The traffic will mature ! The pressure on æronautical tariffs is increasing ! The retail and commercial activities need to be our growth driver
It’s dynamic ! Passengers are the best customers ! Airports are good locations
It’s profitable ! High returns on capital employed Airports now have two core businesses:
Operations & Commercial

46
Unlocking Non-Aeronautical Value 4 steps to growth
INVESTIGATION & DISCOVERY
QUICK-WINS 0 – 18 MONTHS
STRATEGY DEVELOPMENT
MID / LONG TERM 0 – 5 YEARS
1
2 3
4

47
Investigation / Discovery Lisbon Airport
Duty Free
Food court
Passenger flows bypass product
Central Plaza – NOT central
Oversized areas for processing
Downstairs Security & Check-in undersized reducing dwell times
Premium offer

48
Retail revenue / pax 9M 2013 9M 2014 % change
Lisbon 2.29 2.59 +13.5% Porto 1.15 1.40 +21.7% Faro 1.55 1.87 +20.6% ANA 1.77 2.06 +16.4%
Strong impact on revenue / pax

49
Mid / Long Term Strategy Revision of Lisbon: +2,500 m² of retail space
Increased security capacity
High yield Allows check-in expansion
100% of Pax see 100% of
our offer
Central Plaza becomes truly
central
Enhanced concession
yields

50
FUNCHAL
! New walkthrough Duty Free store
! Increase operational efficiencies in constrained subsystems
! Better passenger experience
PORTO
! Increase in Duty Free mainshop area with new walkthrough format
! Retail offer centralization
! Food & Beverage mix review and area increase
FARO
! General revamp of the terminal
! Increase and review of commercial areas
! Increase in passenger processing capacity
+ 850 m2 + 1,200 m2 + 150 m2
Mid / Long Term Strategy Airport development

51
Mid / Long Term Strategy Phnom Penh terminal extension
! 80% increase in terminal area
! 100% increase in departures capacity
! 100% increase in commercial areas

Capex Management 6

53
Smart capex
1. Long term CAPEX planning
2. Defining initial requirements: functional programming
3. Efficient monitoring
4. Life-cycle costs and project value
VINCI Airports policy to optimize investments
1
2
4
3
One goal: deliver cost-effective projects

54
Long term capex planning
Planning investments creates value
! Anticipate the long run (masterplan)…
! …but remain flexible to adapt to actual evolution
! 5-year plan is the right medium term planning horizon
! Economical justification of investment projects
55
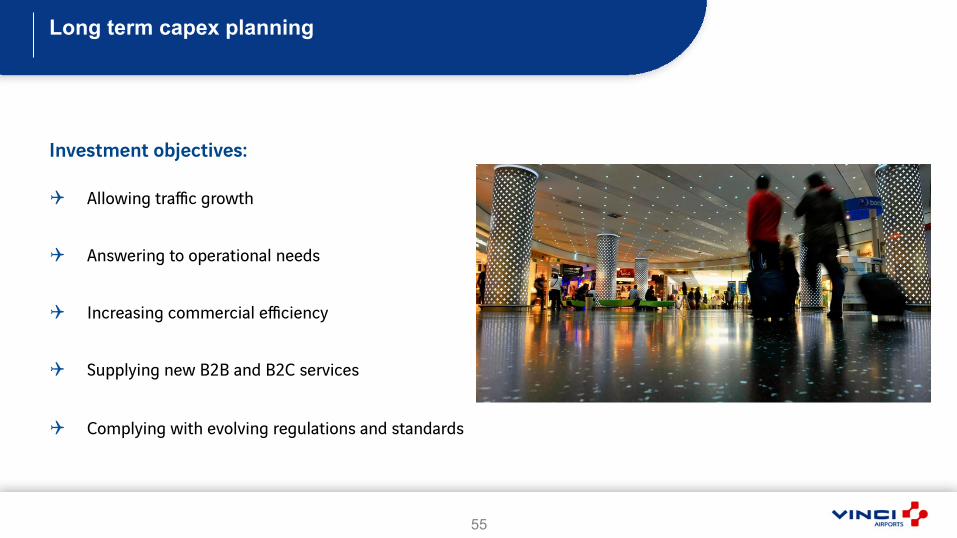
Long term capex planning
Investment objectives:
! Allowing traffic growth
! Answering to operational needs
! Increasing commercial efficiency
! Supplying new B2B and B2C services
! Complying with evolving regulations and standards

56
Life cycle cost
OPTIMIZING OPEX and REPEX requires:
! Smart definition of requirements: better balance CAPEX/
OPEX and major OPEX savings
! Infrastructure value management
! Feedback from extensive airport perimeter and history
! Implementation of specific tools : Pavement Management
System, Computerized Maintenance Management System…
Opex 55% Initial
Capex 30%
Capacity Capex
8% Repex 7%
Breakdown of the life cycle cost of an airport:

57
Construction projects Example of Cambodia
2016 2015 2011 2012 2014 2013
Contract negotiation
Phased entry into service
Functional program
Design phase Works
! New areas: 25,000 sqm
! Refurbished areas: 21,500 sqm
! Total EPC contract cost: USD 90m
! On schedule,
! On budget

58
Smart Capex
! Cost efficient facilities
! Value creation projects
! Optimized life cycle-cost
! Local responsibility and central
monitoring

What’s next? 7

60
VINCI Airports development approach (1/2)
VINCI Airports is looking for:
Long term maturities
Value creation potential
…in a wide array of geographies
Strong position in governance

61
VINCI Airports development approach (2/2)
VINCI Airports now has the right size to bid on major projects
VINCI Airports is able to position on different types of projects, all over the world from small platforms to large hub airports
Growth Seeds Optimization Greenfield
! Large projects
! Emerging countries
! Strong growth expectations
! Underdeveloped airports
! Limited investments
! Transformation of public assets and integration of public-sector companies
! Leverage with VINCI’s know-how

62
VINCI Airports’ strengths
! Commitment to develop traffic through relations with airlines and strong market understanding
! Development of non-aviation activities ! Capex optimization ! Cost control ! Financial strength of VINCI ! Synergies with other VINCI businesses ! Teams integration

Appendices Additional financial information VINCI Airports platforms

64
VINCI Airports Key figures
In € millions 2013 in VINCI’s accounts
2013 pro forma*
Revenue 315 629
EBITDA
% of revenue
102
33%
265
42%
EBIT
% of revenue
65
21%
170
27%
Net profit Group share 151** 178**
Capital employed (end-of-year) 3,684 3,684
* Provisional (purchase accounting under course) ** Including reevaluation of stake in ADP EBITDA: Cash flow from operations before tax and financing costs EBIT: Operating profit from ordinary activities Pro forma: including ANA on a full year basis and change in accounting method for renewal expense (Repex)

65
ANA key figures*
In € millions 2013 Pro forma
Revenue 440
EBITDA
% of revenue
200
45%
EBIT
% of revenue
142
32%
Net profit 40
* Contribution to VINCI’s accounts on a full-year basis – provisional data (purchase accounting under course) EBITDA: Cash flow from operations before tax and financing costs EBIT: Operating profit from ordinary activities

66
ANA – reconciliation between reported data and adjusted data
* Provisional data (purchase accounting under course)
In € millions 2013
reported
IFRIC 12 impacts on provisions
2013 excl. IFRIC 12
impacts
VINCI adjustments
2013 Pro forma*
Revenue 456 456 (17) 440
EBITDA
% of revenue
169
37%
+60
229
50%
(29)
200
45%
EBIT
% of revenue
111
24%
+60 171 (29)
142
32%
Net profit 19 +41 60 (20) 40

67
2013 key figures by country
* Contribution to VINCI’s accounts – provisional data (purchase accounting under course) ** Excluding central overheads and development costs EBITDA: Cash flow from operations before tax and financing costs
In € millions ANA pro forma* (12 months) France Cambodia
Revenue 440 99 91
EBITDA**
% of revenue
200
45%
28
28%
55
60%

68
VINCI Airports platforms
Country Name Type of contract End of concession
VINCI share
Traffic risk
Consoli-dation*
Cambodia Phnom Penh Concession
Siem Reap Concession 2040 70 % Yes FC
Sihanoukville Concession
France** Clermont-Ferrand Auvergne PSD (2013: 426 KPAX) 2026 100 % Yes FC
Quimper Cornouaille PSD (2013: 113 KPAX) 2016 100 % Yes FC
Poitiers-Biard PSD (2013: 108 KPAX) 2019 100% Yes FC
Grenoble-Isère PSD (2013: 337 KPAX) 2023 100 % Yes FC
Bretagne Rennes & Dinard PSD (2013: 611 KPAX) 2024 49 % Yes EM
Chambéry-Savoie PSD (2013: 222 KPAX) 2029 100 % Yes FC
Aéroports du Grand Ouest (Nantes Atlantique, Saint Nazaire)
Concession (2013: 3,956 KPAX) 2065 85 % Yes FC
Portugal ANA (10 airports in Lisbon, Porto, Faro, Madeira, Azores)
Concession (2013: 32,039 KPAX)
2063 100% Yes FC
* FC: full consolidation; EM: equity method ** + Toulon-Hyères airport starting 1 January 2015 PSD: public service delegation
2013: 5,077 KPAX