Embed Size (px)
Citation preview
Rancho Santiago Community College District
VII. Appendices
Page 1 of 43
VII. Appendices and References
LIST OF APPENDICES
The following Appendices are included in the Rancho Santiago Community College District
(RSCCD) plan to assist the reader in understanding the details of the plan. Every 5 years this
plan will be updated if RSCCD wishes to remain eligible for State and Federal hazard mitigation
grants. It is also necessary to document the details and track changes to understand the
progress the District makes from one year to the next and one planning cycle (5 years) to the
next. The Glossary and Acronyms will assist the reader in understanding terms and agencies
discussed in the plan
The References provide supporting data like Insurance Reports, Hazus studies the plan is
based on. They include contributory facts, specialized data and important information needed
to fully understand this plan. These References may be accessed at the RSCCD Risk Manager
Office.
Appendix A – Glossary
Appendix B - Acronyms
Appendix C – Economic Analysis of Mitigation Strategies
Appendix D - California Disasters
Appendix E - Resources
LIST OF REFERENCES ON FILE WITH RSCCD RISK MANAGEMENT OFFICE
References are kept in the RSCCD Risk Managers office an available upon request.
Reference A – RSCCD 2015 Insurance Property Evaluation Report (completed every 5 years)
Reference B – RSCCD Earthquake Hazus Study by MMI Engineering
Reference C – RSCCD Flood Hazus Study by MMI Engineering
Reference D – RSCCD Facilities Master Plan
Rancho Santiago Community College District
VII. Appendices
Page 2 of 43
APPENDIX A: GLOSSARY
Acceleration
The rate of change of velocity with respect to time. Acceleration due to
gravity at the earth's surface is 9.8 meters per second squared. That
means that every second that something falls toward the surface of earth
its velocity increases by 9.8 meters per second.
Asset
Any manmade or natural feature that has value, including, but not limited
to people; buildings; infrastructure like bridges, roads, and sewer and
water systems; lifelines like electricity and communication resources; or
environmental, cultural, or recreational features like parks, dunes,
wetlands, or landmarks.
Base Flood Flood that has a 1 percent probability of being equaled or exceeded in any
given year. Also known as the 100-year flood.
Base Flood Elevation
(BFE)
Elevation of the base flood in relation to a specified datum, such as the
National Geodetic Vertical Datum of 1929. The Base Flood Elevation is
used as the standard for the National Flood Insurance Program.
Bedrock The solid rock that underlies loose material, such as soil, sand, clay, or
gravel.
Building
A structure that is walled and roofed, principally above ground and
permanently affixed to a site. The term includes a manufactured home on
a permanent foundation on which the wheels and axles carry no weight.
Coastal High Hazard
Area
Area, usually along an open coast, bay, or inlet, that is subject to
inundation by storm surge and, in some instances, wave action caused by
storms or seismic sources.
Coastal Zones
The area along the shore where the ocean meets the land as the surface
of the land rises above the ocean. This land/water interface includes
barrier islands, estuaries, beaches, coastal wetlands, and land areas
having direct drainage to the ocean.
Community Rating
System (CRS)
An NFIP program that provides incentives for NFIP communities to
complete activities that reduce flood hazard risk. When the community
completes specified activities, the insurance premiums of policyholders in
these communities are reduced.
Computer-Aided
Design And Drafting
(CADD)
A computerized system enabling quick and accurate electronic 2-D and 3-
D drawings, topographic mapping, site plans, and profile/cross-section
drawings.
Contour A line of equal ground elevation on a topographic (contour) map.
Rancho Santiago Community College District
VII. Appendices
Page 3 of 43
Critical Facility
Facilities that are critical to the health and welfare of the population and
that are especially important following hazard events. Critical facilities
include, but are not limited to, shelters, police and fire stations, and
hospitals.
Debris
The scattered remains of assets broken or destroyed in a hazard event.
Debris caused by a wind or water hazard event can cause additional
damage to other assets.
Digitize
To convert electronically points, lines, and area boundaries shown on
maps into x, y coordinates (e.g., latitude and longitude, universal
transverse Mercator (UTM), or table coordinates) for use in computer
applications.
Displacement Time
The average time (in days) which the building's occupants typically must
operate from a temporary location while repairs are made to the original
building due to damages resulting from a hazard event.
Duration How long a hazard event lasts.
Earthquake A sudden motion or trembling that is caused by a release of strain
accumulated within or along the edge of earth's tectonic plates.
Erosion
Wearing away of the land surface by detachment and movement of soil
and rock fragments, during a flood or storm or over a period of years,
through the action of wind, water, or other geologic processes.
Erosion Hazard Area
Area anticipated to be lost to shoreline retreat over a given period of time.
The projected inland extent of the area is measured by multiplying the
average annual long-term recession rate by the number of years desired.
Essential Facility
Elements that are important to ensure a full recovery of a community or
state following a hazard event. These would include: government
functions, major employers, banks, schools, and certain commercial
establishments, such as grocery stores, hardware stores, and gas stations.
Extent The size of an area affected by a hazard or hazard event.
Extra tropical Cyclone
Cyclonic storm events like Nor'easters and severe winter low-pressure
systems. Both West and East coasts can experience these non-tropical
storms that produce gale-force winds and precipitation in the form of heavy
rain or snow. These cyclonic storms, commonly called Nor'easters on the
East Coast because of the direction of the storm winds, can last for several
days and can be very large – 1,000-mile wide storms are not uncommon.
Fault
A fracture in the continuity of a rock formation caused by a shifting or
dislodging of the earth's crust, in which adjacent surfaces are differentially
displaced parallel to the plane of fracture.
Rancho Santiago Community College District
VII. Appendices
Page 4 of 43
Federal Emergency
Management Agency
(FEMA)
Independent agency created in 1978 to provide a single point of
accountability for all Federal activities related to disaster mitigation and
emergency preparedness, response and recovery.
Fire Potential Index
(FPI)
Developed by USGS and USFS to assess and map fire hazard potential
over broad areas. Based on such geographic information, national policy
makers and on-the-ground fire managers established priorities for
prevention activities in the defined area to reduce the risk of managed and
wildfire ignition and spread. Prediction of fire hazard shortens the time
between fire ignition and initial attack by enabling fire managers to pre-
allocate and stage suppression forces to high fire risk areas.
Flash Flood A flood event occurring with little or no warning where water levels rise at
an extremely fast rate.
Flood
A general and temporary condition of partial or complete inundation of
normally dry land areas from (1) the overflow of inland or tidal waters, (2)
the unusual and rapid accumulation or runoff of surface waters from any
source, or (3) mudflows or the sudden collapse of shoreline land.
Flood Depth Height of the flood water surface above the ground surface.
Flood Elevation
Elevation of the water surface above an established datum, e.g. National
Geodetic Vertical Datum of 1929, North American Vertical Datum of 1988,
or Mean Sea Level.
Flood Hazard Area The area shown to be inundated by a flood of a given magnitude on a
map.
Flood Insurance Rate
Map (FIRM)
Map of a community, prepared by the FEMA that shows both the special
flood hazard areas and the risk premium zones applicable to the
community.
Flood Insurance Study
(FIS)
A study that provides an examination, evaluation, and determination of
flood hazards and, if appropriate, corresponding water surface elevations
in a community or communities.
Floodplain Any land area, including watercourse, susceptible to partial or complete
inundation by water from any source.
Frequency
A measure of how often events of a particular magnitude are expected to
occur. Frequency describes how often a hazard of a specific magnitude,
duration, and/or extent typically occurs, on average. Statistically, a hazard
with a 100-year recurrence interval is expected to occur once every 100
years on average, and would have a 1 percent chance – its probability – of
happening in any given year. The reliability of this information varies
depending on the kind of hazard being considered.
Rancho Santiago Community College District
VII. Appendices
Page 5 of 43
Fujita Scale of
Tornado Intensity
Rates tornadoes with numeric values from F0 to F5 based on tornado wind
speed and damage sustained. An F0 indicates minimal damage such as
broken tree limbs or signs, while and F5 indicated severe damage
sustained.
Functional Downtime The average time (in days) during which a function (business or service) is
unable to provide its services due to a hazard event.
Geographic Area
Impacted The physical area in which the effects of the hazard are experienced.
Geographic
Information Systems
(GIS)
A computer software application that relates physical features on the earth
to a database to be used for mapping and analysis.
Ground Motion
The vibration or shaking of the ground during an earthquake. When a fault
ruptures, seismic waves radiate, causing the ground to vibrate. The
severity of the vibration increases with the amount of energy released and
decreases with distance from the causative fault or epicenter, but soft soils
can further amplify ground motions
Hazard
A source of potential danger or adverse condition. Hazards in this how to
series will include naturally occurring events such as floods, earthquakes,
tornadoes, tsunami, coastal storms, landslides, and wildfires that strike
populated areas. A natural event is a hazard when it has the potential to
harm people or property.
Hazard Event A specific occurrence of a particular type of hazard.
Hazard Identification The process of identifying hazards that threaten an area.
Hazard Mitigation Sustained actions taken to reduce or eliminate long-term risk from hazards
and their effects.
Hazard Profile
A description of the physical characteristics of hazards and a
determination of various descriptors including magnitude, duration,
frequency, probability, and extent. In most cases, a community can most
easily use these descriptors when they are recorded and displayed as
maps.
HAZUS (Hazards U.S.)
A GIS-based nationally standardized earthquake loss estimation tool
developed by FEMA.
Rancho Santiago Community College District
VII. Appendices
Page 6 of 43
Hurricane
An intense tropical cyclone, formed in the atmosphere over warm ocean
areas, in which wind speeds reach 74-miles-per-hour or more and blow in
a large spiral around a relatively calm center or "eye." Hurricanes develop
over the north Atlantic Ocean, northeast Pacific Ocean, or the south
Pacific Ocean east of 160°E longitude. Hurricane circulation is counter-
clockwise in the Northern Hemisphere and clockwise in the Southern
Hemisphere.
Hydrology
The science of dealing with the waters of the earth. A flood discharge is
developed by a hydrologic study.
Infrastructure
Refers to the public services of a community that have a direct impact on
the quality of life. Infrastructure includes communication technology such
as phone lines or Internet access, vital services such as public water
supplies and sewer treatment facilities, and includes an area's
transportation system such as airports, heliports; highways, bridges,
tunnels, roadbeds, overpasses, railways, bridges, rail yards, depots; and
waterways, canals, locks, seaports, ferries, harbors, dry docks, piers and
regional dams.
Intensity A measure of the effects of a hazard event at a particular place.
Landslide Downward movement of a slope and materials under the force of gravity.
Lateral Spreads
Develop on gentle slopes and entail the sidelong movement of large
masses of soil as an underlying layer liquefies in a seismic event. The
phenomenon that occurs when ground shaking causes loose soils to lose
strength and act like viscous fluid. Liquefaction causes two types of ground
failure: lateral spread and loss of bearing strength.
Liquefaction
Results when the soil supporting structures liquefies. This can cause
structures to tip and topple.
Lowest Floor Under the NFIP, the lowest floor of the lowest enclosed area (including
basement) of a structure.
Magnitude
A measure of the strength of a hazard event. The magnitude (also referred
to as severity) of a given hazard event is usually determined using
technical measures specific to the hazard.
Mitigation Plan
A systematic evaluation of the nature and extent of vulnerability to the
effects of natural hazards typically present in the state and includes a
description of actions to minimize future vulnerability to hazards.
National Flood
Insurance Program
(NFIP)
Federal program created by Congress in 1968 that makes flood insurance
available in communities that enact minimum floodplain management
regulations in 44 CFR §60.3.
Rancho Santiago Community College District
VII. Appendices
Page 7 of 43
National Geodetic
Vertical Datum of 1929
(NGVD)
Datum established in 1929 and used in the NFIP as a basis for measuring
flood, ground, and structural elevations, previously referred to as Sea
Level Datum or Mean Sea Level. The Base Flood Elevations shown on
most of the Flood Insurance Rate Maps issued by the Federal Emergency
Management Agency are referenced to NGVD.
National Weather
Service (NWS)
Prepares and issues flood, severe weather, and coastal storm warnings
and can provide technical assistance to Federal and state entities in
preparing weather and flood warning plans.
Nor'easter An extra-tropical cyclone producing gale-force winds and precipitation in
the form of heavy snow or rain.
Outflow Follows water inundation creating strong currents that rip at structures and
pound them with debris, and erode beaches and coastal structures.
Planimetric Describes maps that indicate only man-made features like buildings.
Planning The act or process of making or carrying out plans; the establishment of
goals, policies and procedures for a social or economic unit.
Probability A statistical measure of the likelihood that a hazard event will occur.
Recurrence Interval
The time between hazard events of similar size in a given location. It is
based on the probability that the given event will be equaled or exceeded
in any given year.
Repetitive Loss
Property
A property that is currently insured for which two or more National Flood
Insurance Program losses (occurring more than ten days apart) of at least
$1000 each have been paid within any 10-year period since 1978.
Replacement Value
The cost of rebuilding a structure. This is usually expressed in terms of
cost per square foot, and reflects the present-day cost of labor and
materials to construct a building of a particular size, type and quality.
Richter Scale A numerical scale of earthquake magnitude devised by seismologist C.F.
Richter in 1935.
Risk
The estimated impact that a hazard would have on people, services,
facilities, and structures in a community; the likelihood of a hazard event
resulting in an adverse condition that causes injury or damage. Risk is
often expressed in relative terms such as a high, moderate or low
likelihood of sustaining damage above a particular threshold due to a
specific type of hazard event. It also can be expressed in terms of potential
monetary losses associated with the intensity of the hazard.
Riverine Of or produced by a river.
Scale
A proportion used in determining a dimensional relationship; the ratio of
the distance between two points on a map and the actual distance
between the two points on the earth's surface.
Rancho Santiago Community College District
VII. Appendices
Page 8 of 43
Scarp A steep slope.
Scour
Removal of soil or fill material by the flow of flood waters. The term is
frequently used to describe storm-induced, localized conical erosion
around pilings and other foundation supports where the obstruction of flow
increases turbulence.
Seismicity Describes the likelihood of an area being subject to earthquakes.
Special Flood Hazard
Area (SFHA)
An area within a floodplain having a 1 percent or greater chance of flood
occurrence in any given year (100-year floodplain); represented on Flood
Insurance Rate Maps by darkly shaded areas with zone designations that
include the letter A or V.
Stafford Act
The Robert T. Stafford Disaster Relief and Emergency Assistance Act, PL
100-107 was signed into law November 23, 1988 and amended the
Disaster Relief Act of 1974, PL 93-288. The Stafford Act is the statutory
authority for most Federal disaster response activities, especially as they
pertain to FEMA and its programs.
State Hazard
Mitigation Officer
(SHMO)
The representative of state government who is the primary point of contact
with FEMA, other state and Federal agencies, and local units of
government in the planning and implementation of pre- and post-disaster
mitigation activities.
Storm Surge
Rise in the water surface above normal water level on the open coast due
to the action of wind stress and atmospheric pressure on the water
surface.
Structure Something constructed. (See also Building)
Substantial Damage
Damage of any origin sustained by a structure in a Special Flood Hazard
Area whereby the cost of restoring the structure to its before-damaged
condition would equal or exceed 50 percent of the market value of the
structure before the damage.
Super Typhoon A typhoon with maximum sustained winds of 150 mph or more.
Surface Faulting
The differential movement of two sides of a fracture – in other words, the
location where the ground breaks apart. The length, width, and
displacement of the ground characterize surface faults.
Tectonic Plate
Torsionally rigid, thin segments of the earth's lithosphere that may be
assumed to move horizontally and adjoin other plates. It is the friction
between plate boundaries that cause seismic activity.
Topographic
Characterizes maps that show natural features and indicate the physical
shape of the land using contour lines. These maps may also include
manmade features.
Rancho Santiago Community College District
VII. Appendices
Page 9 of 43
Tornado A violently rotating column of air extending from a thunderstorm to the
ground.
Tropical Cyclone A generic term for a cyclonic, low-pressure system over tropical or
subtropical waters.
Tropical Depression A tropical cyclone with maximum sustained winds of less than 39 mph.
Tropical Storm A tropical cyclone with maximum sustained winds greater than 39 mph and
less than 74 mph.
Tsunami Great sea wave produced by submarine earth movement or volcanic
eruption.
Typhoon
A special category of tropical cyclone peculiar to the western North Pacific
Basin, frequently affecting areas in the vicinity of Guam and the North
Mariana Islands. Typhoons whose maximum sustained winds attain or
exceed 150 mph are called super typhoons.
Vulnerability
Describes how exposed or susceptible to damage an asset is. Vulnerability
depends on an asset's construction, contents, and the economic value of
its functions. Like indirect damages, the vulnerability of one element of the
community is often related to the vulnerability of another. For example,
many businesses depend on uninterrupted electrical power – if an electric
substation is flooded, it will affect not only the substation itself, but a
number of businesses as well. Often, indirect effects can be much more
widespread and damaging than direct ones.
Vulnerability
Assessment
The extent of injury and damage that may result from a hazard event of a
given intensity in a given area. The vulnerability assessment should
address impacts of hazard events on the existing and future built
environment.
Water Displacement
When a large mass of earth on the ocean bottom sinks or uplifts, the
column of water directly above it is displaced, forming the tsunami wave.
The rate of displacement, motion of the ocean floor at the epicenter, the
amount of displacement of the rupture zone, and the depth of water above
the rupture zone all contribute to the intensity of the tsunami.
Wave Run up
The height that the wave extends up to on steep shorelines, measured
above a reference level (the normal height of the sea, corrected to the
state of the tide at the time of wave arrival).
Wildfire An uncontrolled fire spreading through vegetative fuels, exposing and
possibly consuming structures.
Zone A geographical area shown on a Flood Insurance Rate Map (FIRM) that
reflects the severity or type of flooding in the area.
Rancho Santiago Community College District
VII. Appendices
Page 10 of 43
APPENDIX B: ACRONYMS
A. Federal Acronyms
AASHTO American Association of State Highway and Transportation Officials ATC Applied Technology Council B/CA Benefit/Cost Analysis
BFE Base Flood Elevation
BLM Bureau of Land Management
BSSC Building Seismic Safety Council
CDBG Community Development Block Grant
CFR Code of Federal Regulations
CRS Community Rating System
EDA Economic Development Administration
EPA Environmental Protection Agency
ER Emergency Relief
EWP Emergency Watershed Protection (NRCS Program)
FAS Federal Aid System
FEMA Federal Emergency Management Agency
FIRM Flood Insurance Rate Map
FMA Flood Mitigation Assistance (FEMA Program)
FTE Full Time Equivalent
GIS Geographic Information System
GNS Institute of Geological and Nuclear Sciences (International)
GSA General Services Administration
HAZUS Hazards U.S.
HMGP Hazard Mitigation Grant Program
HMST Hazard Mitigation Survey Team
HUD Housing and Urban Development (United States, Department of)
IBHS Institute for Business and Home Safety
ICC Increased Cost of Compliance
IHMT Interagency Hazard Mitigation Team
NCDC National Climate Data Center
NFIP National Flood Insurance Program
NFPA National Fire Protection Association
Rancho Santiago Community College District
VII. Appendices
Page 11 of 43
NHMP Natural Hazard Mitigation Plan (also known as "409 Plan")
NIBS National Institute of Building Sciences
NIFC National Interagency Fire Center
NMFS National Marine Fisheries Service
NOAA National Oceanic and Atmospheric Administration
NPS National Park Service
NRCS Natural Resources Conservation Service
NWS National Weather Service
SBA Small Business Administration
SEAO Structural Engineers Association of Oregon
SHMO State Hazard Mitigation Officer
TOR Transfer of Development Rights
UGB Urban Growth Boundary
URM Unreinforced Masonry
USACE United States Army Corps of Engineers
USBR United States Bureau of Reclamation
USDA United States Department of Agriculture
USFA United States Fire Administration
USFS United States Forest Service
USGS United States Geological Survey
WSSPC Western States Seismic Policy Council
B. California Acronyms A&W Alert and Warning
AA Administering Areas
AAR After Action Report
ARC American Red Cross
ARP Accidental Risk Prevention
ATC20 Applied Technology Council20
ATC21 Applied Technology Council21
BCP Budget Change Proposal
BSA California Bureau of State Audits
CAER Community Awareness & Emergency Response
Cal ARP California Accidental Release Prevention
Cal BO California Building Officials
CAL FIRE California Department of Forestry and Fire Protection
Ca lEPA California Environmental Protection Agency
Ca lOES California Office of Emergency Services
Cal REP California Radiological Emergency Plan
CAL STARS California State Accounting Reporting System
Rancho Santiago Community College District
VII. Appendices
Page 12 of 43
Cal TRANS California Department of Transportation
CGS California Geological Survey
CBO Community Based Organization
CD Civil Defense
CDMG California Division of Mines and Geology
CEC California Energy Commission
CEPEC California Earthquake Prediction Evaluation Council
CESRS California Emergency Services Radio System
CHIP California Hazardous Identification Program
CHMIRS California Hazardous Materials Incident Reporting System
CHP California Highway Patrol
CLETS California Law Enforcement Telecommunications System
CSTI California Specialized Training Institute
CUEA California Utilities Emergency Association
CUPA Certified Unified Program Agency
DAD Disaster Assistance Division (Cal OES)
DFO Disaster Field Office
DGS California Department of General Services
DHSRHB California Dept. of Health Services, Radiological Health Branch
DO Duty Officer
DOC Department Operations Center
DOE Department of Energy (U.S.)
DOF California Department of Finance
DOJ California Department of Justice
DPA California Department of Personnel Administration
DPIG Disaster Preparedness Improvement Grant
DR Disaster Response
DSA Division of the State Architect
DSR Damage Survey Report
DSW Disaster Service Worker
DWR California Department of Water Resources
EAS Emergency Alerting System
EDIS Emergency Digital Information System
EERI Earthquake Engineering Research Institute
EMA Emergency Management Assistance
EMI Emergency Management Institute
EMMA Emergency Managers Mutual Aid
EMS Emergency Medical Services
EOC Emergency Operations Center
EOP Emergency Operations Plan
EPA Environmental Protection Agency (U.S.)
EPEDAT Early Post Earthquake Damage Assessment Tool
EPI Emergency Public Information
EPIC Emergency Public Information Council
ESC Emergency Services Coordinator
Rancho Santiago Community College District
VII. Appendices
Page 13 of 43
FAY Federal Award Year
FDAA Federal Disaster Assistance Administration
FEAT Governor's Flood Emergency Action Team
FEMA Federal Emergency Management Agency
FFY Federal Fiscal Year
FIR Final Inspection Reports
FIRESCOPE Firefighting Resources of Southern California Organized for Potential
Emergencies
FMA Flood Management Assistance
FSR Feasibility Study Report
FY Fiscal Year
GIS Geographical Information System
HAZMAT Hazardous Materials
HAZMIT Hazardous Mitigation
HAZUS Hazards United States (a damage assessment prediction tool)
HAD Housing and Community Development
HEICS Hospital Emergency Incident Command System
HEPG Hospital Emergency Planning Guidance
HIA Hazard Identification and Analysis Unit
HMEP Hazardous Materials Emergency Preparedness
HMGP Hazard Mitigation Grant Program
IDE Initial Damage Estimate
IA Individual Assistance
IFG Individual & Family Grant (program)
IRG Incident Response Geographic Information System
IPA Information and Public Affairs (of Office of Emergency Services)
LAN Local Area Network
LEMMA Law Enforcement Master Mutual Aid
LEPC Local Emergency Planning Committee
MARAC Mutual Aid Regional Advisory Council
MHID Multi-hazard Identification
MOU Memorandum of Understanding
NBC Nuclear, Biological, Chemical
NEMA National Emergency Management Agency
NEMIS National Emergency Management Information System
NFIP National Flood Insurance Program
NOAA National Oceanic and Atmospheric Association
NPP Nuclear Power Plant
NSF National Science Foundation
Rancho Santiago Community College District
VII. Appendices
Page 14 of 43
NWS National Weather Service
OA Operational Area
OASIS Operational Area Satellite Information System
OCC Operations Coordination Center
OCD Office of Civil Defense
OEP Office of Emergency Planning
OES California Governor's Office of Emergency Services
OSHPD Office of Statewide Health Planning and Development
OSPR Oil Spill Prevention and Response
PA Public Assistance
PC Personal Computer
PDA Preliminary Damage Assessment
PIO Public Information Office
POST Police Officer Standards and Training
PPA/CA Performance Partnership Agreement/Cooperative Agreement (FEMA)
PSA Public Service Announcement
PTAB Planning and Technological Assistance Branch
PTR Project Time Report
RA Regional Administrator (OES)
RADEF Radiological Defense (program)
RAMP Regional Assessment of Mitigation Priorities
RAPID Railroad Accident Prevention & Immediate Deployment
RDO Radiological Defense Officer
RDMHC Regional Disaster Medical Health Coordinator
REOC Regional Emergency Operations Center
REPI Reserve Emergency Public Information
RES Regional Emergency Staff
RIMS Response Information Management System
RMP Risk Management Plan
RPU Radiological Preparedness Unit (OES)
RRT Regional Response Team
SAM State Administrative Manual
SARA Superfund Amendments & Reauthorization Act
SAVP Safety Assessment Volunteer Program
SBA Small Business Administration
SCO California State Controller's Office
SEMS Standardized Emergency Management System
SEPIC State Emergency Public Information Committee
SLA State and Local Assistance
SONGS San Onofre Nuclear Generating Station
SOP Standard Operating Procedure
SWEPC Statewide Emergency Planning Committee
Rancho Santiago Community College District
VII. Appendices
Page 15 of 43
TEC Travel Expense Claim
TRU Transuranic
TTT Train the Trainer
UPA Unified Program Account
UPS Uninterrupted Power Source
USAR Urban Search and Rescue
USGS United States Geological Survey
WC California State Warning Center
WAN Wide Area Network
WIPP Waste Isolation Pilot Project
Rancho Santiago Community College District
VII. Appendices
Page 16 of 43
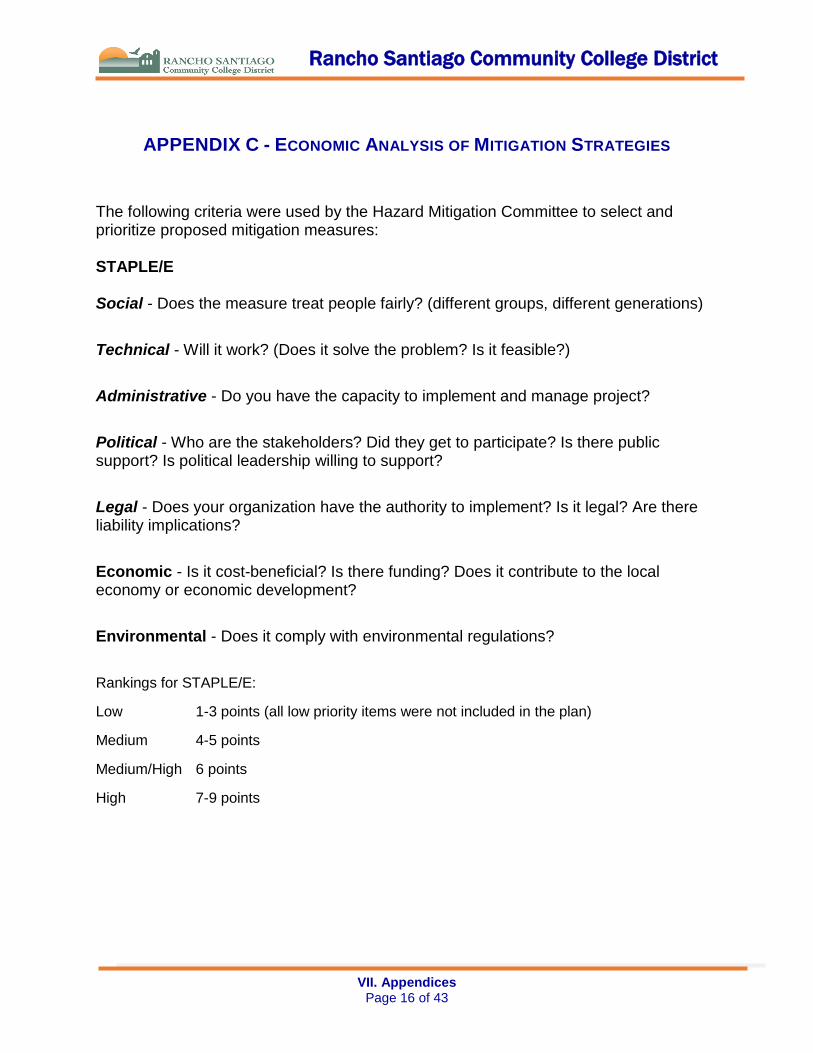
APPENDIX C - ECONOMIC ANALYSIS OF MITIGATION STRATEGIES
The following criteria were used by the Hazard Mitigation Committee to select and prioritize proposed mitigation measures: STAPLE/E Social - Does the measure treat people fairly? (different groups, different generations)
Technical - Will it work? (Does it solve the problem? Is it feasible?)
Administrative - Do you have the capacity to implement and manage project?
Political - Who are the stakeholders? Did they get to participate? Is there public support? Is political leadership willing to support?
Legal - Does your organization have the authority to implement? Is it legal? Are there liability implications?
Economic - Is it cost-beneficial? Is there funding? Does it contribute to the local economy or economic development?
Environmental - Does it comply with environmental regulations?
Rankings for STAPLE/E:
Low 1-3 points (all low priority items were not included in the plan)
Medium 4-5 points
Medium/High 6 points
High 7-9 points
Rancho Santiago Community College District
VII. Appendices
Page 17 of 43
ECONOMIC ANALYSIS OF MITIGATION PROJECTS
Benefit/cost analysis is a key mechanism used by the state Office of Emergency Services (OES), the Federal Emergency Management Agency (FEMA), and other state and federal agencies in evaluating hazard mitigation projects, and is required by the Robert T. Stafford Disaster Relief and Emergency Assistance Act, Public Law 93-288, as amended. This appendix outlines several approaches for conducting economic analysis of natural hazard mitigation projects. It describes the importance of implementing mitigation activities, different approaches to economic analysis of mitigation strategies, and methods to calculate costs and benefits associated with mitigation strategies. Information in this section is derived in part from The Interagency Hazards Mitigation Team, State Hazard Mitigation Plan, and Federal Emergency Management Agency Publication 331, Report on Costs and Benefits of Natural Hazard Mitigation. This section is not intended to provide a comprehensive description of benefit/cost analysis, nor is it intended to provide the details of economic analysis methods that can be used to evaluate local projects. It is intended to (1) raise benefit/cost analysis as an important issue, and (2) provide some background on how economic analysis can be used to evaluate mitigation projects.
A. Cost Benefit Analysis Constraints The City of Mission Viejo does not have the local expertise or the funds to hire a contractor to
conduct benefit/cost analysis or cost-effectiveness analysis for this plan. This will be done on a
project-by-project basis as the City moves forward on each project.
B. Mitigation Strategy Analysis Mitigation activities reduce the cost of disasters by minimizing property damage, injuries, and the potential for loss of life, and by reducing emergency response costs, which would otherwise be incurred. Evaluating natural hazard mitigation provides decision-makers with an understanding of the potential benefits and costs of an activity, as well as a basis upon which to compare alternative projects. Evaluating mitigation projects is a complex and difficult undertaking, which is influenced by many variables. First, natural disasters affect all segments of the communities they strike, including individuals, businesses, and public services such as fire, police, utilities, and schools. Second, while some of the direct and indirect costs of disaster damages are measurable, some of the costs are non-financial and difficult to quantify in dollars. Third, many of the
Rancho Santiago Community College District
VII. Appendices
Page 18 of 43
impacts of such events produce “ripple-effects” throughout the community, greatly increasing the disaster’s social and economic consequences. While not easily accomplished, there is value, from a public policy perspective, in assessing the positive and negative impacts from mitigation activities, and obtaining an instructive benefit/cost comparison. Otherwise, the decision to pursue or not pursue various mitigation options would not be based on an objective understanding of the net benefit or loss associated with these actions. C. Economic Analysis Approaches for Mitigation Strategies The approaches used to identify the costs and benefits associated with natural hazard mitigation strategies, measures, or projects fall into two general categories: benefit/cost analysis and cost-effectiveness analysis. The distinction between the two methods is the way in which the relative costs and benefits are measured. Additionally, there are varying approaches to assessing the value of mitigation for public sector and private sector activities. D. Benefit/Cost Analysis Benefit/cost analysis is used in natural hazards mitigation to show if the benefits to life and property protected through mitigation efforts exceed the cost of the mitigation activity. Conducting benefit/cost analysis for a mitigation activity can assist communities in determining whether a project is worth undertaking now, in order to avoid disaster related damages later. Benefit/cost analysis is based on calculating the frequency and severity of a hazard, avoided future damages, and risk. In benefit/cost analysis, all costs and benefits are evaluated in terms of dollars, and a net benefit/cost ratio is computed to determine whether a project should be implemented (i.e., if net benefits exceed net costs, the project is worth pursuing). A project must have a benefit/cost ratio greater than 1 in order to be funded.
E. Cost-Effectiveness Analysis Cost-effectiveness analysis evaluates how best to spend a given amount of money to achieve a specific goal. This type of analysis, however, does not necessarily measure costs and benefits in terms of dollars. Determining the economic feasibility of mitigating natural hazards can also be organized according to the perspective of those with an economic interest in the outcome. Hence, economic analysis approaches are covered for both public and private sectors as follows.
Investing in public sector mitigation activities:
Evaluating mitigation strategies in the public sector is complicated because it involves estimating all of the economic benefits and costs regardless of who realizes them, and potentially to a large number of people and economic entities. Some benefits cannot be
Rancho Santiago Community College District
VII. Appendices
Page 19 of 43
evaluated monetarily, but still affect the public in profound ways. Economists have developed methods to evaluate the economic feasibility of public decisions that involve a diverse set of beneficiaries and nonmarket benefits.
Investing in private sector mitigation activities:
Private sector mitigation projects may occur on the basis of one of two approaches: it may be mandated by a regulation or standard, or it may be economically justified on its own merits. A building or landowner, whether a private entity or a public agency, required to conform to a mandated standard may consider the following options: 1. Request cost sharing from public agencies; 2. Dispose of the building or land either by sale or demolition; 3. Change the designated use of the building or land and change the hazard
mitigation compliance requirement; or 4. Evaluate the most feasible alternatives and initiate the most cost effective hazard
mitigation alternative. The sale of a building or land triggers another set of concerns. For example, real estate disclosure laws can be developed which require sellers of real property to disclose known defects and deficiencies in the property, including earthquake weaknesses and hazards to prospective purchasers. Correcting deficiencies can be expensive and time consuming, but their existence can prevent the sale of the building. Conditions of a sale regarding the deficiencies and the price of the building can be negotiated between a buyer and seller.
F. How Economic Analysis are Conducted Benefit/cost analysis and cost-effectiveness analysis are important tools in evaluating whether or not to implement a mitigation activity. A framework for evaluating alternative mitigation activities is outlined below: G. Identify the Alternatives Alternatives for reducing risk from natural hazards can include structural projects to enhance disaster resistance, education and outreach, and acquisition or demolition of exposed properties, among others. Different mitigation project can assist in minimizing risk to natural hazards, but do so at varying economic costs. H. Calculate the Costs and Benefits Choosing economic criteria is essential to systematically calculating costs and benefits of mitigation projects and selecting the most appropriate alternative. Potential economic criteria to evaluate alternatives include:
Determine the project cost. This may include initial project development costs, and repair and operating costs of maintaining projects over time.
Rancho Santiago Community College District
VII. Appendices
Page 20 of 43
Estimate the benefits. Projecting the benefits, or cash flow resulting from a project can be difficult. Expected future returns from the mitigation effort depend on the correct specification of the risk and the effectiveness of the project, which may not be well known.
Expected future costs depend on the physical durability and potential economic obsolescence of the investment. This is difficult to project.
These considerations will also provide guidance in selecting an appropriate salvage value. Future tax structures and rates must be projected. Financing alternatives must be researched, and they may include retained earnings, bond and stock issues, and commercial loans.
I. Consider Costs and Benefits to Society and Environment These are not easily measured, but can be assessed through a variety of economic tools including existence value or contingent value theories. These theories provide quantitative data on the value people attribute to physical or social environments. Even without hard data, however, impacts of structural projects to the physical environment or to society should be considered when implementing mitigation projects.
Determine the correct discount rate. Determination of the discount rate can just be the risk-free cost of capital, but it may
include the decision maker’s time preference and also a risk premium. Including inflation
should also be considered.
J. Analyze and Rank the Alternatives Once costs and benefits have been quantified, economic analysis tools can rank the alternatives. Two methods for determining the best alternative given varying costs and benefits include net present value and internal rate of return.
Net present value. Net present value is the value of the expected future returns of an investment minus the value of expected future cost expressed in today’s dollars. If the net present value is greater than the project costs, the project may be determined feasible for implementation. Selecting the discount rate, and identifying the present and future costs and benefits of the project calculates the net present value of projects.
Internal Rate of Return. Using the internal rate of return method to evaluate mitigation projects provides the interest rate equivalent to the dollar returns expected from the project. Once the rate has been calculated, it can be compared to rates earned by investing in alternative projects. Projects may be feasible to implement when the internal rate of return is greater than the total costs of the project.
Once the mitigation projects are ranked on the basis of economic criteria, decision-
Rancho Santiago Community College District
VII. Appendices
Page 21 of 43
makers can consider other factors, such as risk; project effectiveness; and economic,
environmental, and social returns in choosing the appropriate project for implementation.
HOW ARE BENEFITS OF MITIGATION CALCULATED?
A. Economic Returns of Natural Hazard Mitigation The estimation of economic returns, which accrue to building or land owner as a result of natural hazard mitigation, is difficult. Owners evaluating the economic feasibility of mitigation should consider reductions in physical damages and financial losses. A partial list follows:
Building damages avoided
Content damages avoided
Inventory damages avoided
Rental income losses avoided
Relocation and disruption expenses avoided
Proprietor’s income losses avoided
These parameters can be estimated using observed prices, costs, and engineering data. The difficult part is to correctly determine the effectiveness of the hazard mitigation project and the resulting reduction in damages and losses. Equally as difficult is assessing the probability that an event will occur. The damages and losses should only include those that will be borne by the owner. The salvage value of the investment can be important in determining economic feasibility. Salvage value becomes more important as the time horizon of the owner declines. This is important because most businesses depreciate assets over a period of time.
B. Additional Costs from Natural Hazards Property owners should also assess changes in a broader set of factors that can change as a result of a large natural disaster. These are usually termed “indirect” effects, but they can have a very direct effect on the economic value of the owner’s building or land. They can be positive or negative, and include changes in the following:
Commodity and resource prices
Availability of resource supplies
Commodity and resource demand changes
Building and land values
Capital availability and interest rates
Availability of labor
Economic structure
Rancho Santiago Community College District
VII. Appendices
Page 22 of 43
Infrastructure
Regional exports and imports
Local, state, and national regulations and policies
Insurance availability and rates
Changes in the resources and industries listed above are more difficult to estimate and require models that are structured to estimate total economic impacts. Total economic impacts are the sum of direct and indirect economic impacts. Total economic impact models are usually not combined with economic feasibility models. Many models exist to estimate total economic impacts of changes in an economy. Decision makers should understand the total economic impacts of natural disasters in order to calculate the benefits of a mitigation activity. This suggests that understanding the local economy is an important first step in being able to understand the potential impacts of a disaster, and the benefits of mitigation activities.
C. Additional Considerations Conducting an economic analysis for potential mitigation activities can assist decision-makers in choosing the most appropriate strategy for their community to reduce risk and prevent loss from natural hazards. Economic analysis can also save time and resources from being spent on inappropriate or unfeasible projects. Several resources and models are listed on the following page that can assist in conducting an economic analysis for natural hazard mitigation activities. Benefit/cost analysis is complicated, and the numbers may divert attention from other important issues. It is important to consider the qualitative factors of a project associated with mitigation that cannot be evaluated economically. There are alternative approaches to implementing mitigation projects. Many communities are looking towards developing multi-objective projects. With this in mind, opportunity rises to develop strategies that integrate natural hazard mitigation with projects related to watersheds, environmental planning, community economic development, and small business development, among others. Incorporating natural hazard mitigation with other community projects can increase the viability of project implementation.
D. 2016 RSCCD Plan Due to District constraints: insufficient personnel local expertise as well as lack of funding to hire
a contractor to conduct benefit-cost analysis and cost-effectiveness analysis, these processes
will not take place during the development of this plan. Instead, benefit-cost analysis and/or
cost-effectiveness analysis will be done prior to applying for any federal grants.
Rancho Santiago Community College District
VII. Appendices
Page 23 of 43
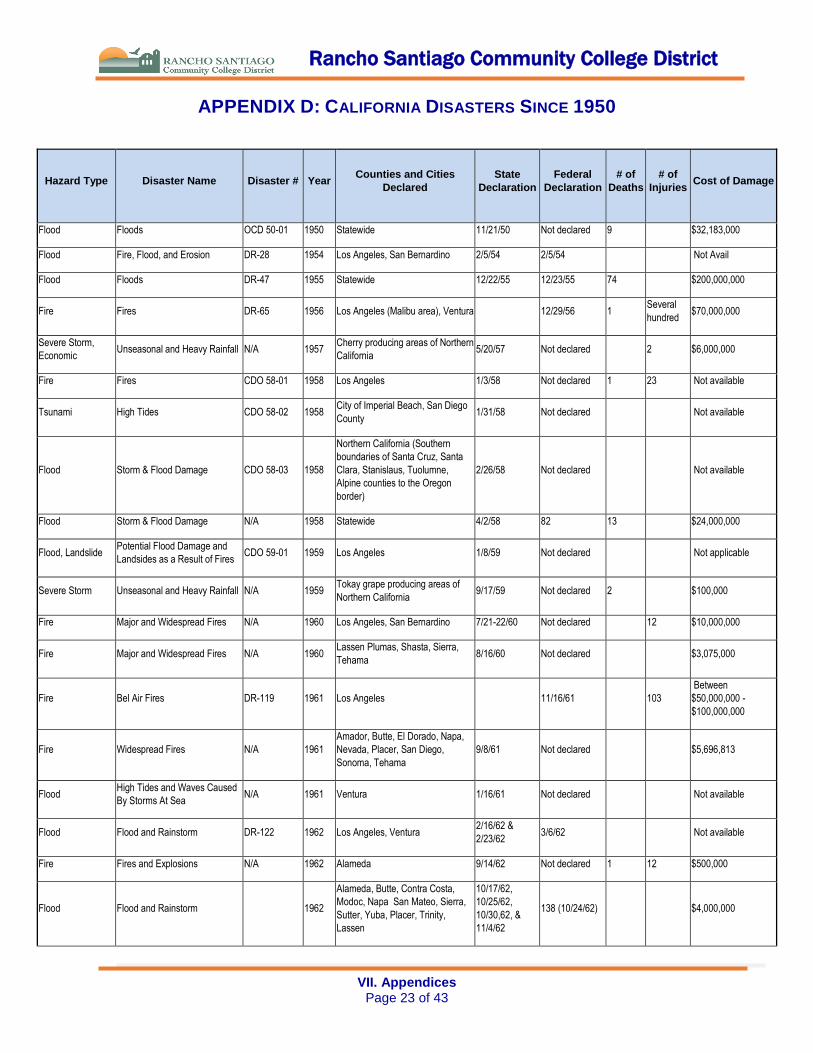
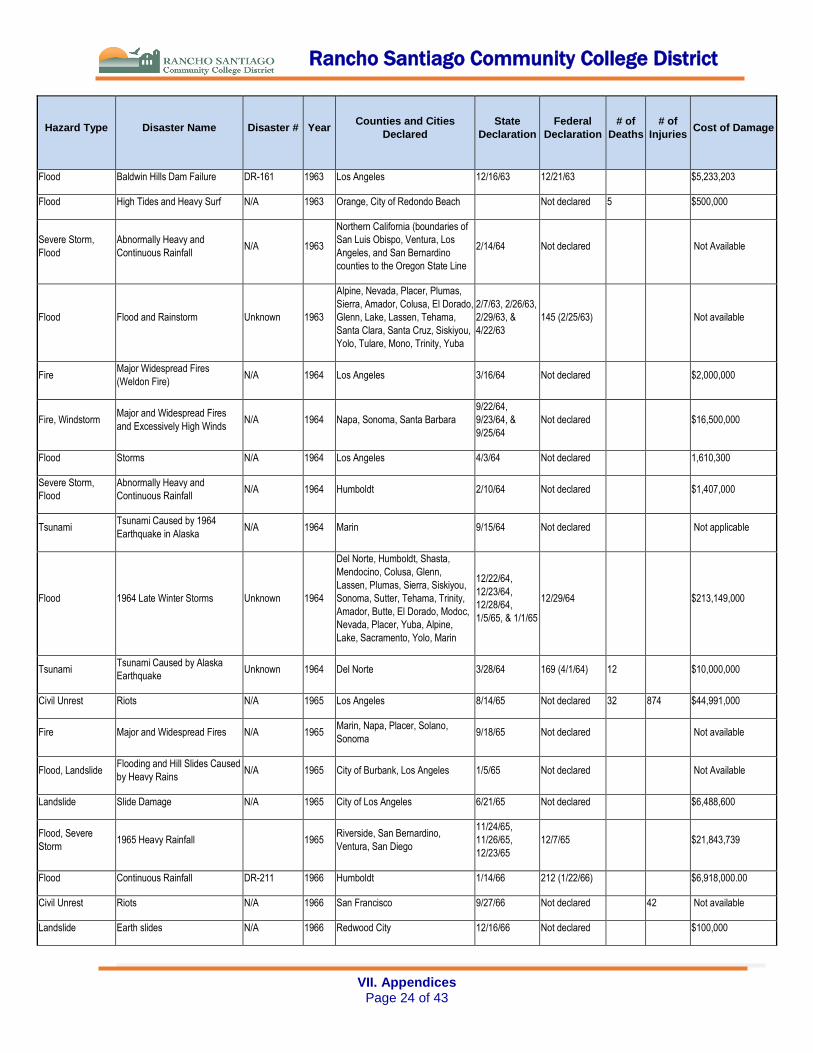
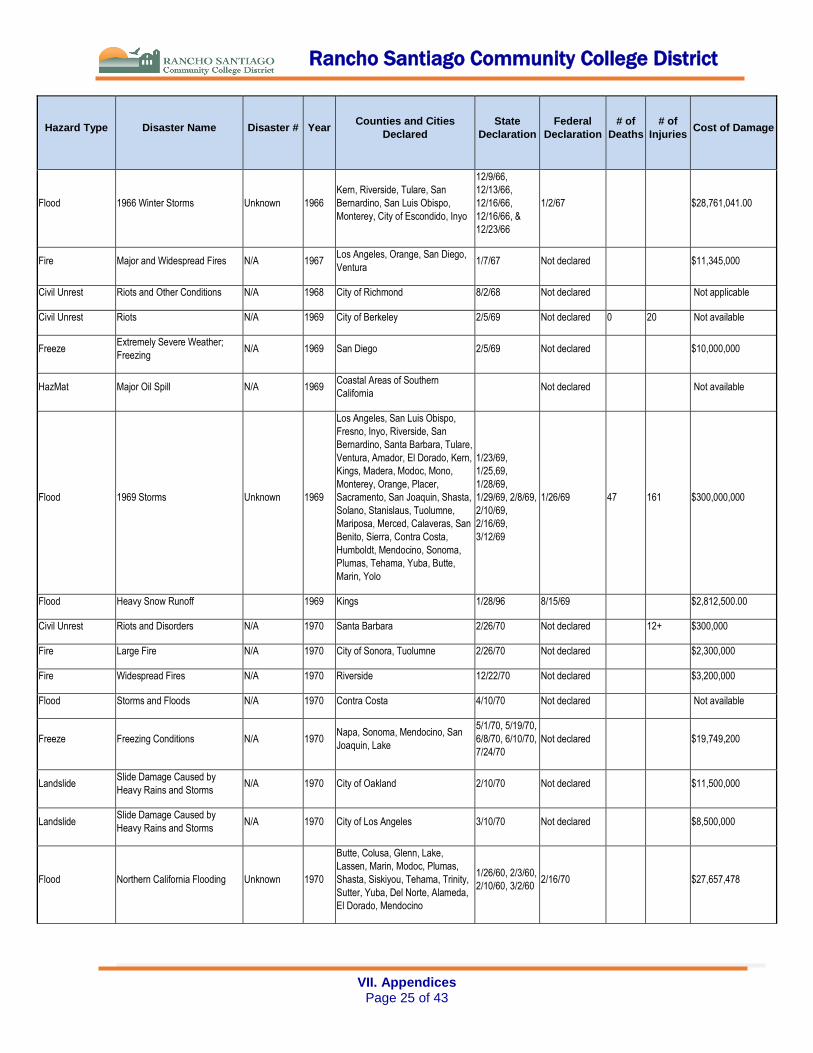
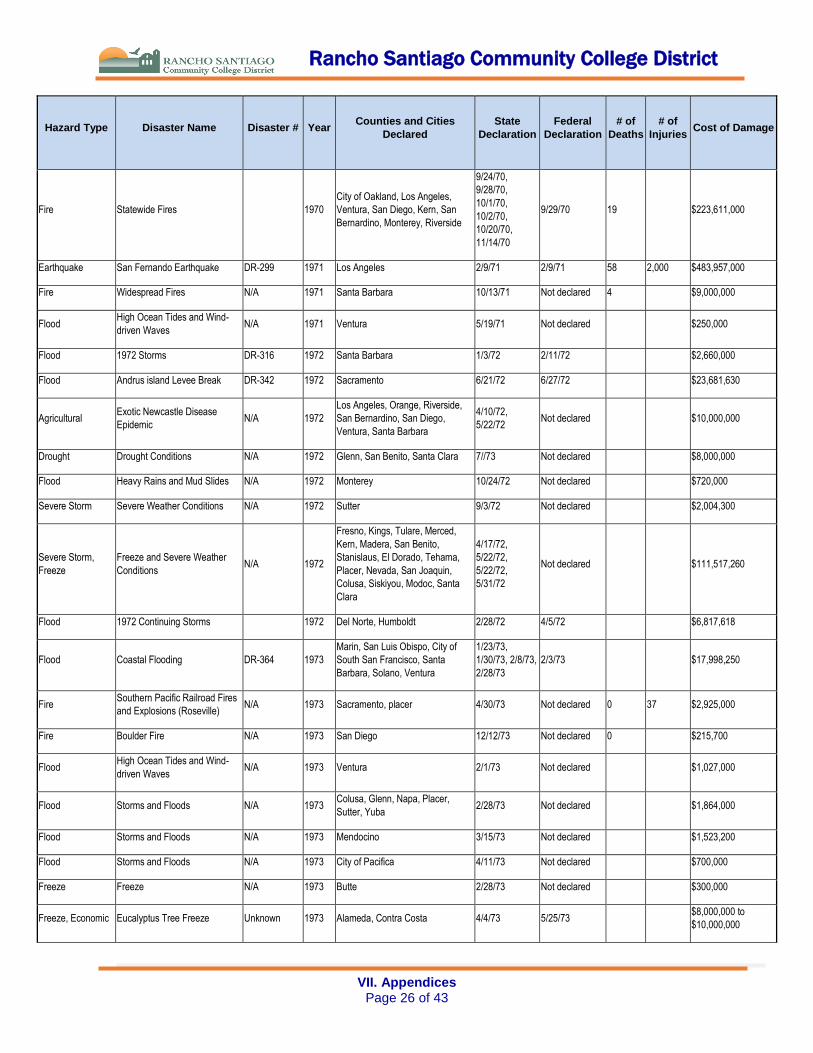
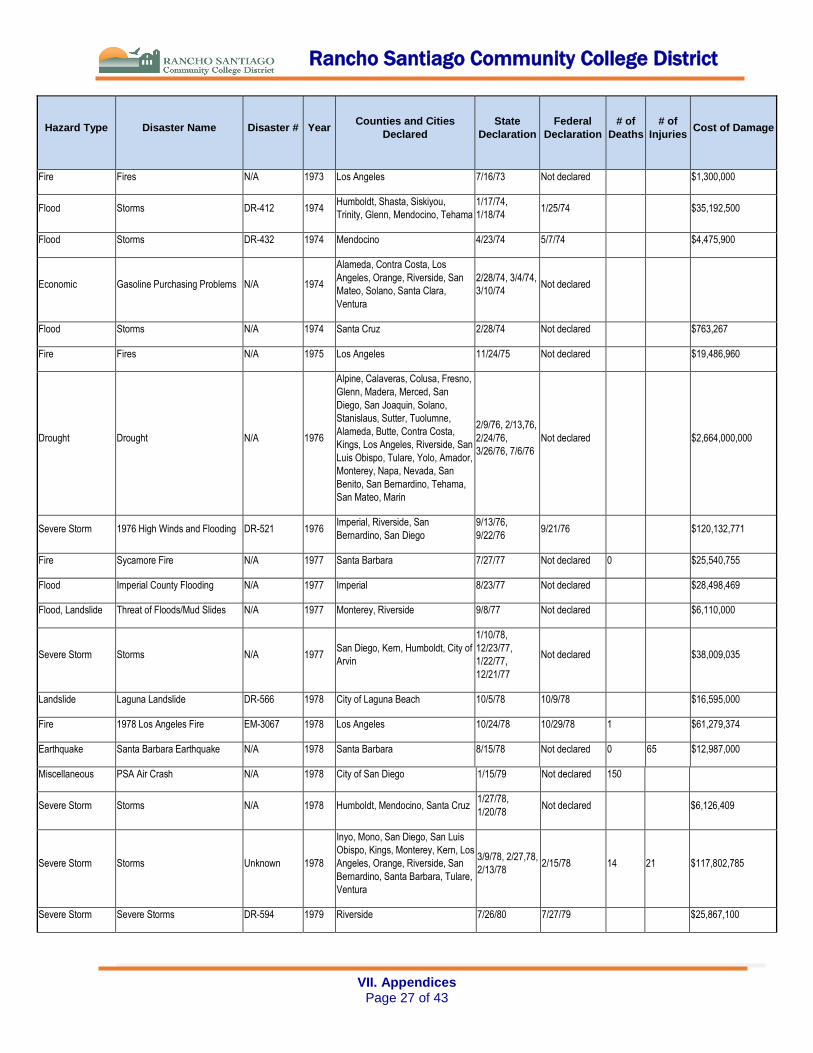
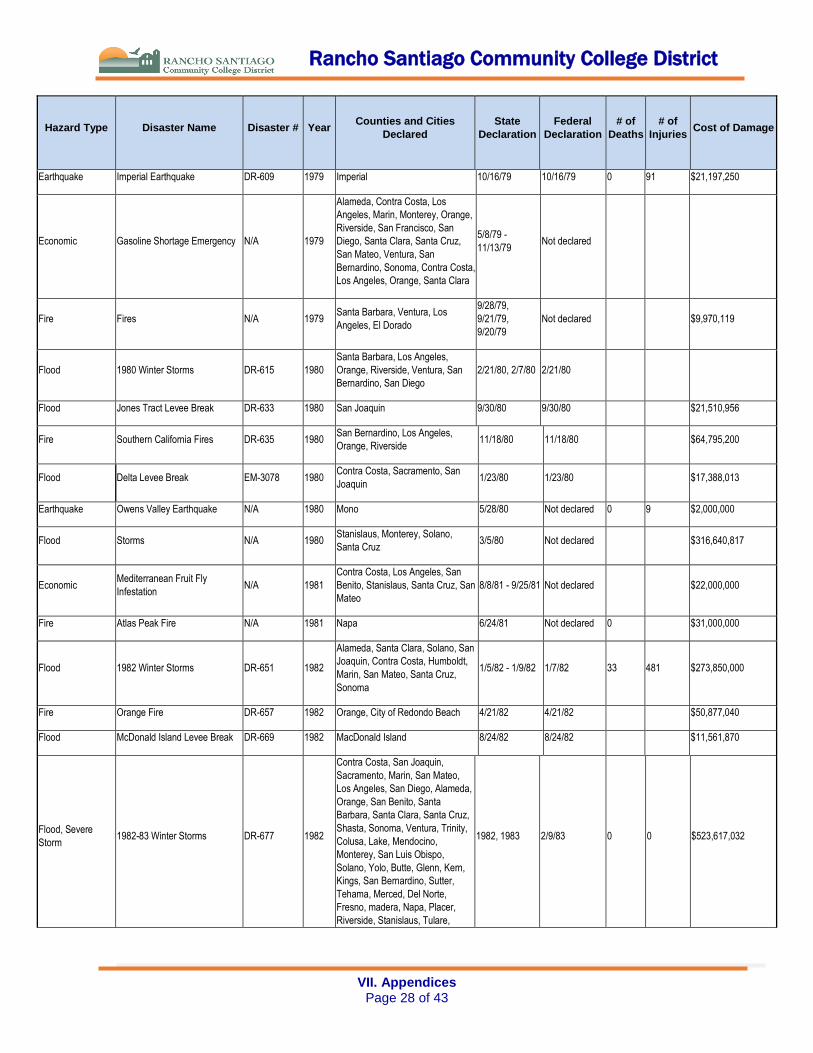
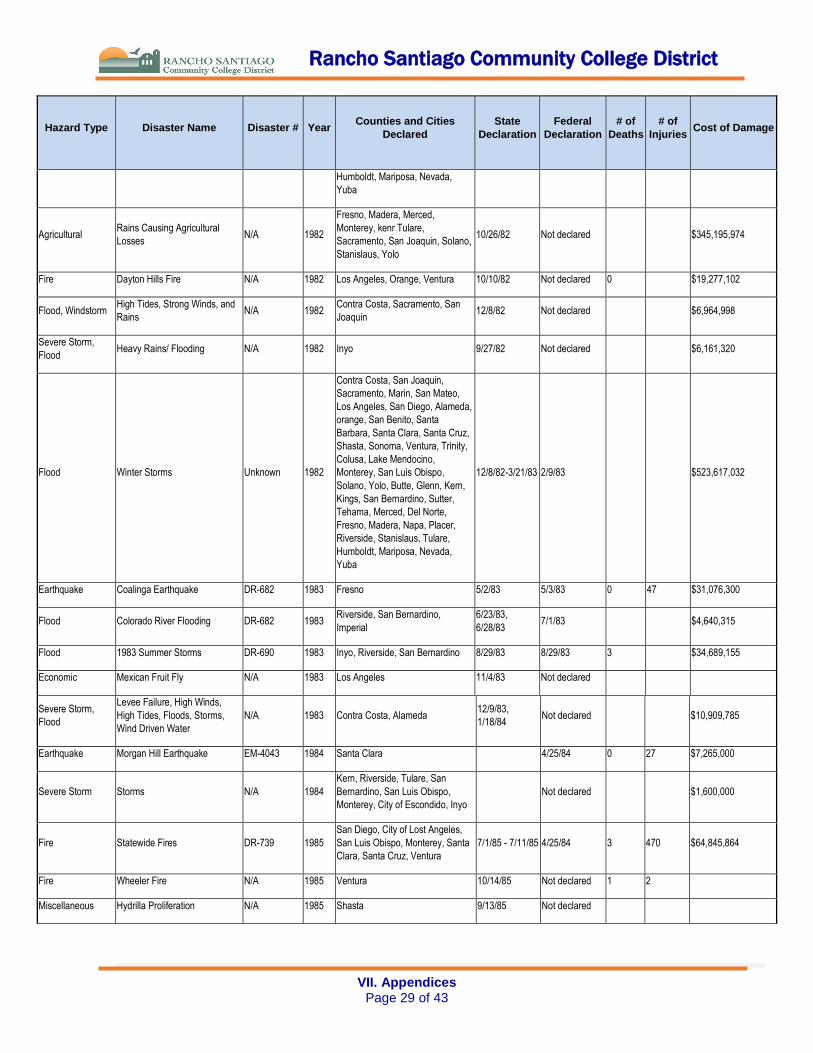
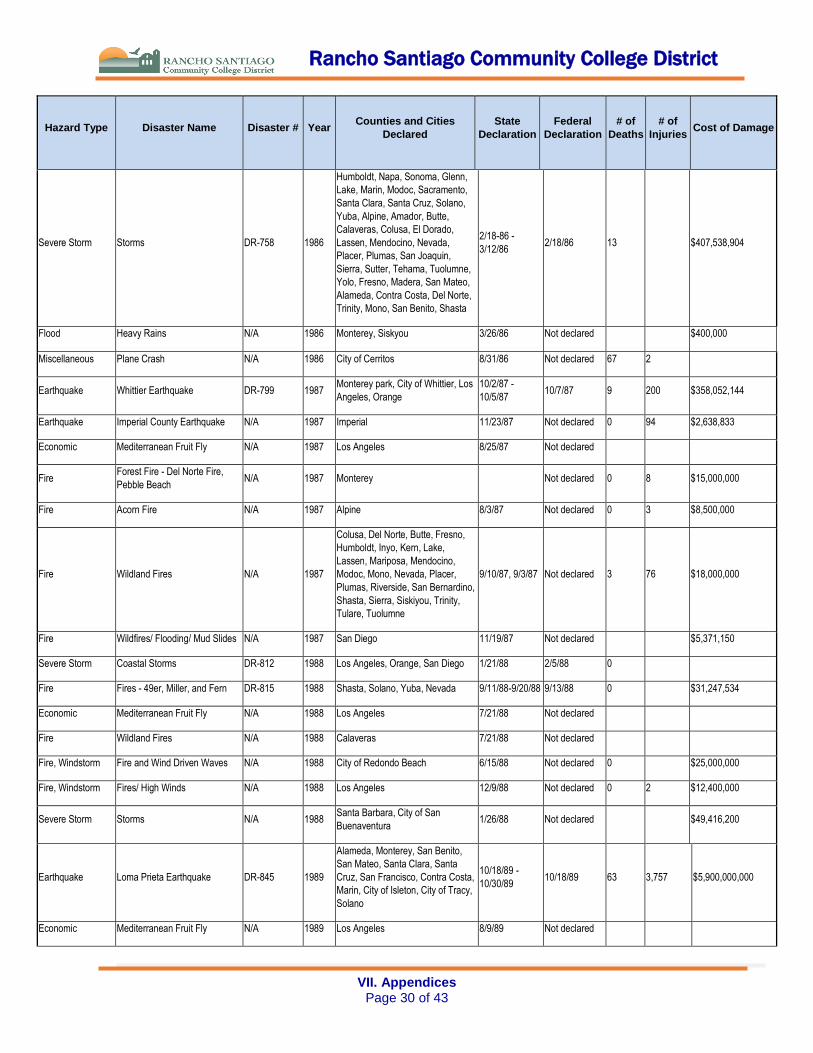
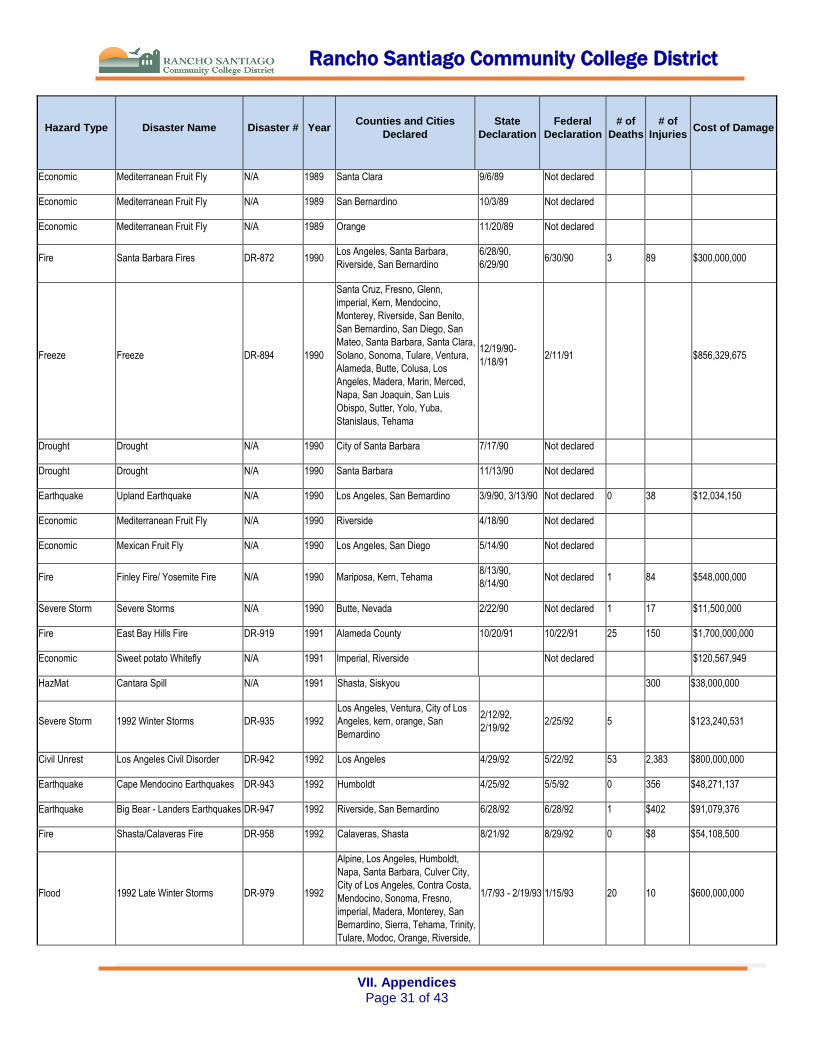
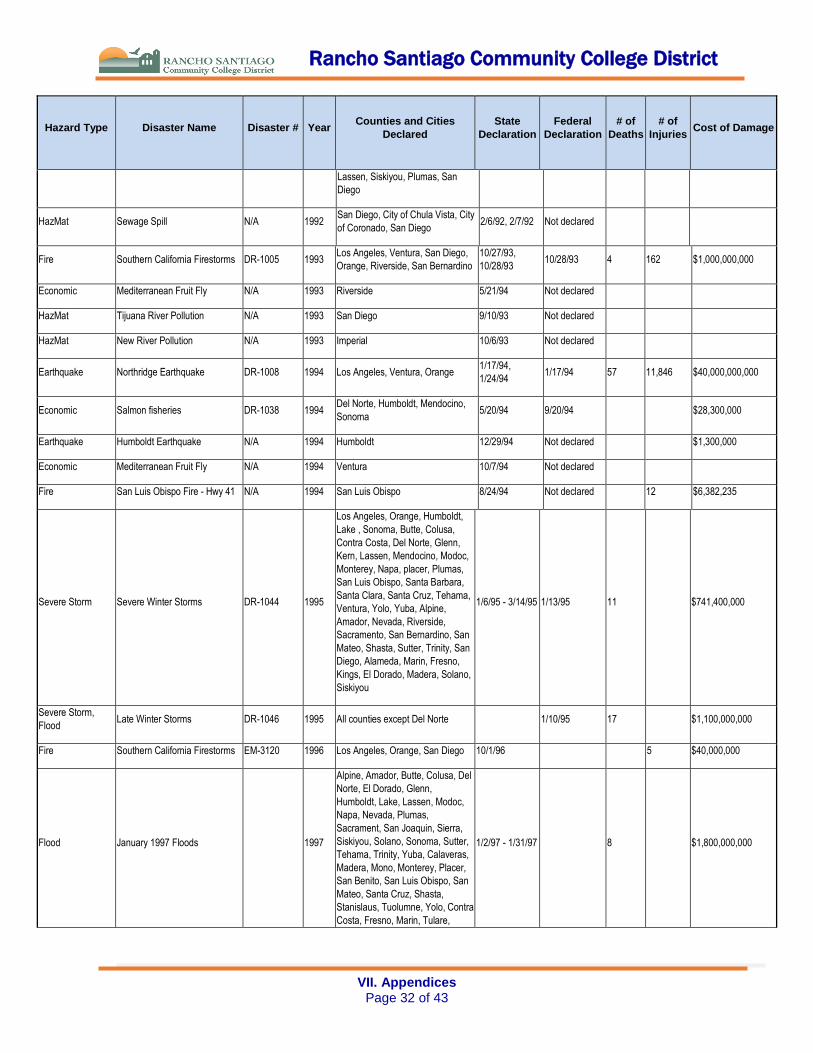
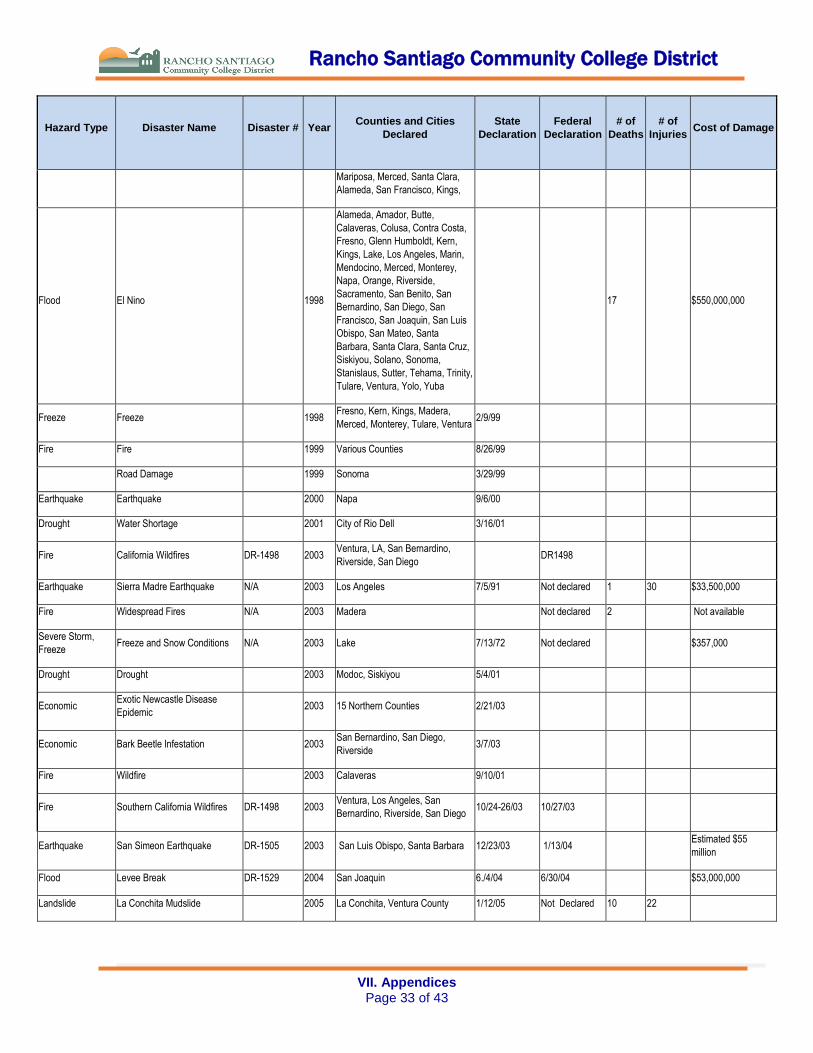
APPENDIX D: CALIFORNIA DISASTERS SINCE 1950
Hazard Type
Disaster Name Disaster # Year Counties and Cities
Declared
State
Declaration
Federal
Declaration
# of
Deaths
# of
Injuries Cost of Damage
Flood Floods OCD 50-01 1950 Statewide 11/21/50 Not declared 9 $32,183,000
Flood Fire, Flood, and Erosion DR-28 1954 Los Angeles, San Bernardino 2/5/54 2/5/54 Not Avail
Flood Floods DR-47 1955 Statewide 12/22/55 12/23/55 74 $200,000,000
Fire Fires DR-65 1956 Los Angeles (Malibu area), Ventura 12/29/56 1 Several
hundred $70,000,000
Severe Storm,
Economic Unseasonal and Heavy Rainfall N/A 1957
Cherry producing areas of Northern
California 5/20/57 Not declared 2 $6,000,000
Fire Fires CDO 58-01 1958 Los Angeles 1/3/58 Not declared 1 23 Not available
Tsunami High Tides CDO 58-02 1958 City of Imperial Beach, San Diego
County 1/31/58 Not declared Not available
Flood Storm & Flood Damage CDO 58-03 1958
Northern California (Southern
boundaries of Santa Cruz, Santa
Clara, Stanislaus, Tuolumne,
Alpine counties to the Oregon
border)
2/26/58 Not declared Not available
Flood Storm & Flood Damage N/A 1958 Statewide 4/2/58 82 13 $24,000,000
Flood, Landslide Potential Flood Damage and
Landsides as a Result of Fires CDO 59-01 1959 Los Angeles 1/8/59 Not declared Not applicable
Severe Storm Unseasonal and Heavy Rainfall N/A 1959 Tokay grape producing areas of
Northern California 9/17/59 Not declared 2 $100,000
Fire Major and Widespread Fires N/A 1960 Los Angeles, San Bernardino 7/21-22/60 Not declared 12 $10,000,000
Fire Major and Widespread Fires N/A 1960 Lassen Plumas, Shasta, Sierra,
Tehama 8/16/60 Not declared $3,075,000
Fire Bel Air Fires DR-119 1961 Los Angeles 11/16/61 103
Between
$50,000,000 -
$100,000,000
Fire Widespread Fires N/A 1961
Amador, Butte, El Dorado, Napa,
Nevada, Placer, San Diego,
Sonoma, Tehama
9/8/61 Not declared $5,696,813
Flood High Tides and Waves Caused
By Storms At Sea N/A 1961 Ventura 1/16/61 Not declared Not available
Flood Flood and Rainstorm DR-122 1962 Los Angeles, Ventura 2/16/62 &
2/23/62 3/6/62 Not available
Fire Fires and Explosions N/A 1962 Alameda 9/14/62 Not declared 1 12 $500,000
Flood Flood and Rainstorm 1962
Alameda, Butte, Contra Costa,
Modoc, Napa San Mateo, Sierra,
Sutter, Yuba, Placer, Trinity,
Lassen
10/17/62,
10/25/62,
10/30,62, &
11/4/62
138 (10/24/62) $4,000,000
Rancho Santiago Community College District
VII. Appendices
Page 24 of 43
Hazard Type
Disaster Name Disaster # Year Counties and Cities
Declared
State
Declaration
Federal
Declaration
# of
Deaths
# of
Injuries Cost of Damage
Flood Baldwin Hills Dam Failure DR-161 1963 Los Angeles 12/16/63 12/21/63 $5,233,203
Flood High Tides and Heavy Surf N/A 1963 Orange, City of Redondo Beach Not declared 5 $500,000
Severe Storm,
Flood
Abnormally Heavy and
Continuous Rainfall N/A 1963
Northern California (boundaries of
San Luis Obispo, Ventura, Los
Angeles, and San Bernardino
counties to the Oregon State Line
2/14/64 Not declared Not Available
Flood Flood and Rainstorm Unknown 1963
Alpine, Nevada, Placer, Plumas,
Sierra, Amador, Colusa, El Dorado,
Glenn, Lake, Lassen, Tehama,
Santa Clara, Santa Cruz, Siskiyou,
Yolo, Tulare, Mono, Trinity, Yuba
2/7/63, 2/26/63,
2/29/63, &
4/22/63
145 (2/25/63) Not available
Fire Major Widespread Fires
(Weldon Fire) N/A 1964 Los Angeles 3/16/64 Not declared $2,000,000
Fire, Windstorm Major and Widespread Fires
and Excessively High Winds N/A 1964 Napa, Sonoma, Santa Barbara
9/22/64,
9/23/64, &
9/25/64
Not declared $16,500,000
Flood Storms N/A 1964 Los Angeles 4/3/64 Not declared 1,610,300
Severe Storm,
Flood
Abnormally Heavy and
Continuous Rainfall N/A 1964 Humboldt 2/10/64 Not declared $1,407,000
Tsunami Tsunami Caused by 1964
Earthquake in Alaska N/A 1964 Marin 9/15/64 Not declared Not applicable
Flood 1964 Late Winter Storms Unknown 1964
Del Norte, Humboldt, Shasta,
Mendocino, Colusa, Glenn,
Lassen, Plumas, Sierra, Siskiyou,
Sonoma, Sutter, Tehama, Trinity,
Amador, Butte, El Dorado, Modoc,
Nevada, Placer, Yuba, Alpine,
Lake, Sacramento, Yolo, Marin
12/22/64,
12/23/64,
12/28/64,
1/5/65, & 1/1/65
12/29/64 $213,149,000
Tsunami Tsunami Caused by Alaska
Earthquake Unknown 1964 Del Norte 3/28/64 169 (4/1/64) 12 $10,000,000
Civil Unrest Riots N/A 1965 Los Angeles 8/14/65 Not declared 32 874 $44,991,000
Fire Major and Widespread Fires N/A 1965 Marin, Napa, Placer, Solano,
Sonoma 9/18/65 Not declared Not available
Flood, Landslide Flooding and Hill Slides Caused
by Heavy Rains N/A 1965 City of Burbank, Los Angeles 1/5/65 Not declared Not Available
Landslide Slide Damage N/A 1965 City of Los Angeles 6/21/65 Not declared $6,488,600
Flood, Severe
Storm 1965 Heavy Rainfall 1965
Riverside, San Bernardino,
Ventura, San Diego
11/24/65,
11/26/65,
12/23/65
12/7/65 $21,843,739
Flood Continuous Rainfall DR-211 1966 Humboldt 1/14/66 212 (1/22/66) $6,918,000.00
Civil Unrest Riots N/A 1966 San Francisco 9/27/66 Not declared 42 Not available
Landslide Earth slides N/A 1966 Redwood City 12/16/66 Not declared $100,000
Rancho Santiago Community College District
VII. Appendices
Page 25 of 43
Hazard Type
Disaster Name Disaster # Year Counties and Cities
Declared
State
Declaration
Federal
Declaration
# of
Deaths
# of
Injuries Cost of Damage
Flood 1966 Winter Storms Unknown 1966
Kern, Riverside, Tulare, San
Bernardino, San Luis Obispo,
Monterey, City of Escondido, Inyo
12/9/66,
12/13/66,
12/16/66,
12/16/66, &
12/23/66
1/2/67 $28,761,041.00
Fire Major and Widespread Fires N/A 1967 Los Angeles, Orange, San Diego,
Ventura 1/7/67 Not declared $11,345,000
Civil Unrest Riots and Other Conditions N/A 1968 City of Richmond 8/2/68 Not declared Not applicable
Civil Unrest Riots N/A 1969 City of Berkeley 2/5/69 Not declared 0 20 Not available
Freeze Extremely Severe Weather;
Freezing N/A 1969 San Diego 2/5/69 Not declared $10,000,000
HazMat Major Oil Spill N/A 1969 Coastal Areas of Southern
California Not declared Not available
Flood 1969 Storms Unknown 1969
Los Angeles, San Luis Obispo,
Fresno, Inyo, Riverside, San
Bernardino, Santa Barbara, Tulare,
Ventura, Amador, El Dorado, Kern,
Kings, Madera, Modoc, Mono,
Monterey, Orange, Placer,
Sacramento, San Joaquin, Shasta,
Solano, Stanislaus, Tuolumne,
Mariposa, Merced, Calaveras, San
Benito, Sierra, Contra Costa,
Humboldt, Mendocino, Sonoma,
Plumas, Tehama, Yuba, Butte,
Marin, Yolo
1/23/69,
1/25,69,
1/28/69,
1/29/69, 2/8/69,
2/10/69,
2/16/69,
3/12/69
1/26/69 47 161 $300,000,000
Flood Heavy Snow Runoff 1969 Kings 1/28/96 8/15/69 $2,812,500.00
Civil Unrest Riots and Disorders N/A 1970 Santa Barbara 2/26/70 Not declared 12+ $300,000
Fire Large Fire N/A 1970 City of Sonora, Tuolumne 2/26/70 Not declared $2,300,000
Fire Widespread Fires N/A 1970 Riverside 12/22/70 Not declared $3,200,000
Flood Storms and Floods N/A 1970 Contra Costa 4/10/70 Not declared Not available
Freeze Freezing Conditions N/A 1970 Napa, Sonoma, Mendocino, San
Joaquin, Lake
5/1/70, 5/19/70,
6/8/70, 6/10/70,
7/24/70
Not declared $19,749,200
Landslide Slide Damage Caused by
Heavy Rains and Storms N/A 1970 City of Oakland 2/10/70 Not declared $11,500,000
Landslide Slide Damage Caused by
Heavy Rains and Storms N/A 1970 City of Los Angeles 3/10/70 Not declared $8,500,000
Flood Northern California Flooding Unknown 1970
Butte, Colusa, Glenn, Lake,
Lassen, Marin, Modoc, Plumas,
Shasta, Siskiyou, Tehama, Trinity,
Sutter, Yuba, Del Norte, Alameda,
El Dorado, Mendocino
1/26/60, 2/3/60,
2/10/60, 3/2/60 2/16/70 $27,657,478
Rancho Santiago Community College District
VII. Appendices
Page 26 of 43
Hazard Type
Disaster Name Disaster # Year Counties and Cities
Declared
State
Declaration
Federal
Declaration
# of
Deaths
# of
Injuries Cost of Damage
Fire Statewide Fires 1970
City of Oakland, Los Angeles,
Ventura, San Diego, Kern, San
Bernardino, Monterey, Riverside
9/24/70,
9/28/70,
10/1/70,
10/2/70,
10/20/70,
11/14/70
9/29/70 19 $223,611,000
Earthquake San Fernando Earthquake DR-299 1971 Los Angeles 2/9/71 2/9/71 58 2,000 $483,957,000
Fire Widespread Fires N/A 1971 Santa Barbara 10/13/71 Not declared 4 $9,000,000
Flood High Ocean Tides and Wind-
driven Waves N/A 1971 Ventura 5/19/71 Not declared $250,000
Flood 1972 Storms DR-316 1972 Santa Barbara 1/3/72 2/11/72 $2,660,000
Flood Andrus island Levee Break DR-342 1972 Sacramento 6/21/72 6/27/72 $23,681,630
Agricultural Exotic Newcastle Disease
Epidemic N/A 1972
Los Angeles, Orange, Riverside,
San Bernardino, San Diego,
Ventura, Santa Barbara
4/10/72,
5/22/72 Not declared $10,000,000
Drought Drought Conditions N/A 1972 Glenn, San Benito, Santa Clara 7//73 Not declared $8,000,000
Flood Heavy Rains and Mud Slides N/A 1972 Monterey 10/24/72 Not declared $720,000
Severe Storm Severe Weather Conditions N/A 1972 Sutter 9/3/72 Not declared $2,004,300
Severe Storm,
Freeze
Freeze and Severe Weather
Conditions N/A 1972
Fresno, Kings, Tulare, Merced,
Kern, Madera, San Benito,
Stanislaus, El Dorado, Tehama,
Placer, Nevada, San Joaquin,
Colusa, Siskiyou, Modoc, Santa
Clara
4/17/72,
5/22/72,
5/22/72,
5/31/72
Not declared $111,517,260
Flood 1972 Continuing Storms 1972 Del Norte, Humboldt 2/28/72 4/5/72 $6,817,618
Flood Coastal Flooding DR-364 1973
Marin, San Luis Obispo, City of
South San Francisco, Santa
Barbara, Solano, Ventura
1/23/73,
1/30/73, 2/8/73,
2/28/73
2/3/73 $17,998,250
Fire Southern Pacific Railroad Fires
and Explosions (Roseville) N/A 1973 Sacramento, placer 4/30/73 Not declared 0 37 $2,925,000
Fire Boulder Fire N/A 1973 San Diego 12/12/73 Not declared 0 $215,700
Flood High Ocean Tides and Wind-
driven Waves N/A 1973 Ventura 2/1/73 Not declared $1,027,000
Flood Storms and Floods N/A 1973 Colusa, Glenn, Napa, Placer,
Sutter, Yuba 2/28/73 Not declared $1,864,000
Flood Storms and Floods N/A 1973 Mendocino 3/15/73 Not declared $1,523,200
Flood Storms and Floods N/A 1973 City of Pacifica 4/11/73 Not declared $700,000
Freeze Freeze N/A 1973 Butte 2/28/73 Not declared $300,000
Freeze, Economic Eucalyptus Tree Freeze Unknown 1973 Alameda, Contra Costa 4/4/73 5/25/73 $8,000,000 to
$10,000,000
Rancho Santiago Community College District
VII. Appendices
Page 27 of 43
Hazard Type
Disaster Name Disaster # Year Counties and Cities
Declared
State
Declaration
Federal
Declaration
# of
Deaths
# of
Injuries Cost of Damage
Fire Fires N/A 1973 Los Angeles 7/16/73 Not declared $1,300,000
Flood Storms DR-412 1974 Humboldt, Shasta, Siskiyou,
Trinity, Glenn, Mendocino, Tehama
1/17/74,
1/18/74 1/25/74 $35,192,500
Flood Storms DR-432 1974 Mendocino 4/23/74 5/7/74 $4,475,900
Economic Gasoline Purchasing Problems N/A 1974
Alameda, Contra Costa, Los
Angeles, Orange, Riverside, San
Mateo, Solano, Santa Clara,
Ventura
2/28/74, 3/4/74,
3/10/74 Not declared
Flood Storms N/A 1974 Santa Cruz 2/28/74 Not declared $763,267
Fire Fires N/A 1975 Los Angeles 11/24/75 Not declared $19,486,960
Drought Drought N/A 1976
Alpine, Calaveras, Colusa, Fresno,
Glenn, Madera, Merced, San
Diego, San Joaquin, Solano,
Stanislaus, Sutter, Tuolumne,
Alameda, Butte, Contra Costa,
Kings, Los Angeles, Riverside, San
Luis Obispo, Tulare, Yolo, Amador,
Monterey, Napa, Nevada, San
Benito, San Bernardino, Tehama,
San Mateo, Marin
2/9/76, 2/13,76,
2/24/76,
3/26/76, 7/6/76
Not declared $2,664,000,000
Severe Storm 1976 High Winds and Flooding DR-521 1976 Imperial, Riverside, San
Bernardino, San Diego
9/13/76,
9/22/76 9/21/76 $120,132,771
Fire Sycamore Fire N/A 1977 Santa Barbara 7/27/77 Not declared 0 $25,540,755
Flood Imperial County Flooding N/A 1977 Imperial 8/23/77 Not declared $28,498,469
Flood, Landslide Threat of Floods/Mud Slides N/A 1977 Monterey, Riverside 9/8/77 Not declared $6,110,000
Severe Storm Storms N/A 1977 San Diego, Kern, Humboldt, City of
Arvin
1/10/78,
12/23/77,
1/22/77,
12/21/77
Not declared $38,009,035
Landslide Laguna Landslide DR-566 1978 City of Laguna Beach 10/5/78 10/9/78 $16,595,000
Fire 1978 Los Angeles Fire EM-3067 1978 Los Angeles 10/24/78 10/29/78 1 $61,279,374
Earthquake Santa Barbara Earthquake N/A 1978 Santa Barbara 8/15/78 Not declared 0 65 $12,987,000
Miscellaneous PSA Air Crash N/A 1978 City of San Diego 1/15/79 Not declared 150
Severe Storm Storms N/A 1978 Humboldt, Mendocino, Santa Cruz 1/27/78,
1/20/78 Not declared $6,126,409
Severe Storm Storms Unknown 1978
Inyo, Mono, San Diego, San Luis
Obispo, Kings, Monterey, Kern, Los
Angeles, Orange, Riverside, San
Bernardino, Santa Barbara, Tulare,
Ventura
3/9/78, 2/27,78,
2/13/78 2/15/78 14 21 $117,802,785
Severe Storm Severe Storms DR-594 1979 Riverside 7/26/80 7/27/79 $25,867,100
Rancho Santiago Community College District
VII. Appendices
Page 28 of 43
Hazard Type
Disaster Name Disaster # Year Counties and Cities
Declared
State
Declaration
Federal
Declaration
# of
Deaths
# of
Injuries Cost of Damage
Earthquake Imperial Earthquake DR-609 1979 Imperial 10/16/79 10/16/79 0 91 $21,197,250
Economic Gasoline Shortage Emergency N/A 1979
Alameda, Contra Costa, Los
Angeles, Marin, Monterey, Orange,
Riverside, San Francisco, San
Diego, Santa Clara, Santa Cruz,
San Mateo, Ventura, San
Bernardino, Sonoma, Contra Costa,
Los Angeles, Orange, Santa Clara
5/8/79 -
11/13/79 Not declared
Fire Fires N/A 1979 Santa Barbara, Ventura, Los
Angeles, El Dorado
9/28/79,
9/21/79,
9/20/79
Not declared $9,970,119
Flood 1980 Winter Storms DR-615 1980
Santa Barbara, Los Angeles,
Orange, Riverside, Ventura, San
Bernardino, San Diego
2/21/80, 2/7/80 2/21/80
Flood Jones Tract Levee Break DR-633 1980 San Joaquin 9/30/80 9/30/80 $21,510,956
Fire Southern California Fires DR-635 1980 San Bernardino, Los Angeles,
Orange, Riverside 11/18/80 11/18/80 $64,795,200
Flood Delta Levee Break EM-3078 1980 Contra Costa, Sacramento, San
Joaquin 1/23/80 1/23/80 $17,388,013
Earthquake Owens Valley Earthquake N/A 1980 Mono 5/28/80 Not declared 0 9 $2,000,000
Flood Storms N/A 1980 Stanislaus, Monterey, Solano,
Santa Cruz 3/5/80 Not declared $316,640,817
Economic Mediterranean Fruit Fly
Infestation N/A 1981
Contra Costa, Los Angeles, San
Benito, Stanislaus, Santa Cruz, San
Mateo
8/8/81 - 9/25/81 Not declared $22,000,000
Fire Atlas Peak Fire N/A 1981 Napa 6/24/81 Not declared 0 $31,000,000
Flood 1982 Winter Storms DR-651 1982
Alameda, Santa Clara, Solano, San
Joaquin, Contra Costa, Humboldt,
Marin, San Mateo, Santa Cruz,
Sonoma
1/5/82 - 1/9/82 1/7/82 33 481 $273,850,000
Fire Orange Fire DR-657 1982 Orange, City of Redondo Beach 4/21/82 4/21/82 $50,877,040
Flood McDonald Island Levee Break DR-669 1982 MacDonald Island 8/24/82 8/24/82 $11,561,870
Flood, Severe
Storm 1982-83 Winter Storms DR-677 1982
Contra Costa, San Joaquin,
Sacramento, Marin, San Mateo,
Los Angeles, San Diego, Alameda,
Orange, San Benito, Santa
Barbara, Santa Clara, Santa Cruz,
Shasta, Sonoma, Ventura, Trinity,
Colusa, Lake, Mendocino,
Monterey, San Luis Obispo,
Solano, Yolo, Butte, Glenn, Kern,
Kings, San Bernardino, Sutter,
Tehama, Merced, Del Norte,
Fresno, madera, Napa, Placer,
Riverside, Stanislaus, Tulare,
1982, 1983 2/9/83 0 0 $523,617,032
Rancho Santiago Community College District
VII. Appendices
Page 29 of 43
Hazard Type
Disaster Name Disaster # Year Counties and Cities
Declared
State
Declaration
Federal
Declaration
# of
Deaths
# of
Injuries Cost of Damage
Humboldt, Mariposa, Nevada,
Yuba
Agricultural Rains Causing Agricultural
Losses N/A 1982
Fresno, Madera, Merced,
Monterey, kenr Tulare,
Sacramento, San Joaquin, Solano,
Stanislaus, Yolo
10/26/82 Not declared $345,195,974
Fire Dayton Hills Fire N/A 1982 Los Angeles, Orange, Ventura 10/10/82 Not declared 0 $19,277,102
Flood, Windstorm High Tides, Strong Winds, and
Rains N/A 1982
Contra Costa, Sacramento, San
Joaquin 12/8/82 Not declared $6,964,998
Severe Storm,
Flood Heavy Rains/ Flooding N/A 1982 Inyo 9/27/82 Not declared $6,161,320
Flood Winter Storms Unknown 1982
Contra Costa, San Joaquin,
Sacramento, Marin, San Mateo,
Los Angeles, San Diego, Alameda,
orange, San Benito, Santa
Barbara, Santa Clara, Santa Cruz,
Shasta, Sonoma, Ventura, Trinity,
Colusa, Lake Mendocino,
Monterey, San Luis Obispo,
Solano, Yolo, Butte, Glenn, Kern,
Kings, San Bernardino, Sutter,
Tehama, Merced, Del Norte,
Fresno, Madera, Napa, Placer,
Riverside, Stanislaus, Tulare,
Humboldt, Mariposa, Nevada,
Yuba
12/8/82-3/21/83 2/9/83 $523,617,032
Earthquake Coalinga Earthquake DR-682 1983 Fresno 5/2/83 5/3/83 0 47 $31,076,300
Flood Colorado River Flooding DR-682 1983 Riverside, San Bernardino,
Imperial
6/23/83,
6/28/83 7/1/83 $4,640,315
Flood 1983 Summer Storms DR-690 1983 Inyo, Riverside, San Bernardino 8/29/83 8/29/83 3 $34,689,155
Economic Mexican Fruit Fly N/A 1983 Los Angeles 11/4/83 Not declared
Severe Storm,
Flood
Levee Failure, High Winds,
High Tides, Floods, Storms,
Wind Driven Water
N/A 1983 Contra Costa, Alameda 12/9/83,
1/18/84 Not declared $10,909,785
Earthquake Morgan Hill Earthquake EM-4043 1984 Santa Clara 4/25/84 0 27 $7,265,000
Severe Storm Storms N/A 1984
Kern, Riverside, Tulare, San
Bernardino, San Luis Obispo,
Monterey, City of Escondido, Inyo
Not declared $1,600,000
Fire Statewide Fires DR-739 1985
San Diego, City of Lost Angeles,
San Luis Obispo, Monterey, Santa
Clara, Santa Cruz, Ventura
7/1/85 - 7/11/85 4/25/84 3 470 $64,845,864
Fire Wheeler Fire N/A 1985 Ventura 10/14/85 Not declared 1 2
Miscellaneous Hydrilla Proliferation N/A 1985 Shasta 9/13/85 Not declared
Rancho Santiago Community College District
VII. Appendices
Page 30 of 43
Hazard Type
Disaster Name Disaster # Year Counties and Cities
Declared
State
Declaration
Federal
Declaration
# of
Deaths
# of
Injuries Cost of Damage
Severe Storm Storms DR-758 1986
Humboldt, Napa, Sonoma, Glenn,
Lake, Marin, Modoc, Sacramento,
Santa Clara, Santa Cruz, Solano,
Yuba, Alpine, Amador, Butte,
Calaveras, Colusa, El Dorado,
Lassen, Mendocino, Nevada,
Placer, Plumas, San Joaquin,
Sierra, Sutter, Tehama, Tuolumne,
Yolo, Fresno, Madera, San Mateo,
Alameda, Contra Costa, Del Norte,
Trinity, Mono, San Benito, Shasta
2/18-86 -
3/12/86 2/18/86 13 $407,538,904
Flood Heavy Rains N/A 1986 Monterey, Siskyou 3/26/86 Not declared $400,000
Miscellaneous Plane Crash N/A 1986 City of Cerritos 8/31/86 Not declared 67 2
Earthquake Whittier Earthquake DR-799 1987 Monterey park, City of Whittier, Los
Angeles, Orange
10/2/87 -
10/5/87 10/7/87 9 200 $358,052,144
Earthquake Imperial County Earthquake N/A 1987 Imperial 11/23/87 Not declared 0 94 $2,638,833
Economic Mediterranean Fruit Fly N/A 1987 Los Angeles 8/25/87 Not declared
Fire Forest Fire - Del Norte Fire,
Pebble Beach N/A 1987 Monterey Not declared 0 8 $15,000,000
Fire Acorn Fire N/A 1987 Alpine 8/3/87 Not declared 0 3 $8,500,000
Fire Wildland Fires N/A 1987
Colusa, Del Norte, Butte, Fresno,
Humboldt, Inyo, Kern, Lake,
Lassen, Mariposa, Mendocino,
Modoc, Mono, Nevada, Placer,
Plumas, Riverside, San Bernardino,
Shasta, Sierra, Siskiyou, Trinity,
Tulare, Tuolumne
9/10/87, 9/3/87 Not declared 3 76 $18,000,000
Fire Wildfires/ Flooding/ Mud Slides N/A 1987 San Diego 11/19/87 Not declared $5,371,150
Severe Storm Coastal Storms DR-812 1988 Los Angeles, Orange, San Diego 1/21/88 2/5/88 0
Fire Fires - 49er, Miller, and Fern DR-815 1988 Shasta, Solano, Yuba, Nevada 9/11/88-9/20/88 9/13/88 0 $31,247,534
Economic Mediterranean Fruit Fly N/A 1988 Los Angeles 7/21/88 Not declared
Fire Wildland Fires N/A 1988 Calaveras 7/21/88 Not declared
Fire, Windstorm Fire and Wind Driven Waves N/A 1988 City of Redondo Beach 6/15/88 Not declared 0 $25,000,000
Fire, Windstorm Fires/ High Winds N/A 1988 Los Angeles 12/9/88 Not declared 0 2 $12,400,000
Severe Storm Storms N/A 1988 Santa Barbara, City of San
Buenaventura 1/26/88 Not declared $49,416,200
Earthquake Loma Prieta Earthquake DR-845 1989
Alameda, Monterey, San Benito,
San Mateo, Santa Clara, Santa
Cruz, San Francisco, Contra Costa,
Marin, City of Isleton, City of Tracy,
Solano
10/18/89 -
10/30/89 10/18/89 63 3,757 $5,900,000,000
Economic Mediterranean Fruit Fly N/A 1989 Los Angeles 8/9/89 Not declared
Rancho Santiago Community College District
VII. Appendices
Page 31 of 43
Hazard Type
Disaster Name Disaster # Year Counties and Cities
Declared
State
Declaration
Federal
Declaration
# of
Deaths
# of
Injuries Cost of Damage
Economic Mediterranean Fruit Fly N/A 1989 Santa Clara 9/6/89 Not declared
Economic Mediterranean Fruit Fly N/A 1989 San Bernardino 10/3/89 Not declared
Economic Mediterranean Fruit Fly N/A 1989 Orange 11/20/89 Not declared
Fire Santa Barbara Fires DR-872 1990 Los Angeles, Santa Barbara,
Riverside, San Bernardino
6/28/90,
6/29/90 6/30/90 3 89 $300,000,000
Freeze Freeze DR-894 1990
Santa Cruz, Fresno, Glenn,
imperial, Kern, Mendocino,
Monterey, Riverside, San Benito,
San Bernardino, San Diego, San
Mateo, Santa Barbara, Santa Clara,
Solano, Sonoma, Tulare, Ventura,
Alameda, Butte, Colusa, Los
Angeles, Madera, Marin, Merced,
Napa, San Joaquin, San Luis
Obispo, Sutter, Yolo, Yuba,
Stanislaus, Tehama
12/19/90-
1/18/91 2/11/91 $856,329,675
Drought Drought N/A 1990 City of Santa Barbara 7/17/90 Not declared
Drought Drought N/A 1990 Santa Barbara 11/13/90 Not declared
Earthquake Upland Earthquake N/A 1990 Los Angeles, San Bernardino 3/9/90, 3/13/90 Not declared 0 38 $12,034,150
Economic Mediterranean Fruit Fly N/A 1990 Riverside 4/18/90 Not declared
Economic Mexican Fruit Fly N/A 1990 Los Angeles, San Diego 5/14/90 Not declared
Fire Finley Fire/ Yosemite Fire N/A 1990 Mariposa, Kern, Tehama 8/13/90,
8/14/90 Not declared 1 84 $548,000,000
Severe Storm Severe Storms N/A 1990 Butte, Nevada 2/22/90 Not declared 1 17 $11,500,000
Fire East Bay Hills Fire DR-919 1991 Alameda County 10/20/91 10/22/91 25 150 $1,700,000,000
Economic Sweet potato Whitefly N/A 1991 Imperial, Riverside Not declared $120,567,949
HazMat Cantara Spill N/A 1991 Shasta, Siskyou 300 $38,000,000
Severe Storm 1992 Winter Storms DR-935 1992
Los Angeles, Ventura, City of Los
Angeles, kern, orange, San
Bernardino
2/12/92,
2/19/92 2/25/92 5 $123,240,531
Civil Unrest Los Angeles Civil Disorder DR-942 1992 Los Angeles 4/29/92 5/22/92 53 2,383 $800,000,000
Earthquake Cape Mendocino Earthquakes DR-943 1992 Humboldt 4/25/92 5/5/92 0 356 $48,271,137
Earthquake Big Bear - Landers Earthquakes DR-947 1992 Riverside, San Bernardino 6/28/92 6/28/92 1 $402 $91,079,376
Fire Shasta/Calaveras Fire DR-958 1992 Calaveras, Shasta 8/21/92 8/29/92 0 $8 $54,108,500
Flood 1992 Late Winter Storms DR-979 1992
Alpine, Los Angeles, Humboldt,
Napa, Santa Barbara, Culver City,
City of Los Angeles, Contra Costa,
Mendocino, Sonoma, Fresno,
imperial, Madera, Monterey, San
Bernardino, Sierra, Tehama, Trinity,
Tulare, Modoc, Orange, Riverside,
1/7/93 - 2/19/93 1/15/93 20 10 $600,000,000
Rancho Santiago Community College District
VII. Appendices
Page 32 of 43
Hazard Type
Disaster Name Disaster # Year Counties and Cities
Declared
State
Declaration
Federal
Declaration
# of
Deaths
# of
Injuries Cost of Damage
Lassen, Siskiyou, Plumas, San
Diego
HazMat Sewage Spill N/A 1992 San Diego, City of Chula Vista, City
of Coronado, San Diego 2/6/92, 2/7/92 Not declared
Fire Southern California Firestorms DR-1005 1993 Los Angeles, Ventura, San Diego,
Orange, Riverside, San Bernardino
10/27/93,
10/28/93 10/28/93 4 162 $1,000,000,000
Economic Mediterranean Fruit Fly N/A 1993 Riverside 5/21/94 Not declared
HazMat Tijuana River Pollution N/A 1993 San Diego 9/10/93 Not declared
HazMat New River Pollution N/A 1993 Imperial 10/6/93 Not declared
Earthquake Northridge Earthquake DR-1008 1994 Los Angeles, Ventura, Orange 1/17/94,
1/24/94 1/17/94 57 11,846 $40,000,000,000
Economic Salmon fisheries DR-1038 1994 Del Norte, Humboldt, Mendocino,
Sonoma 5/20/94 9/20/94 $28,300,000
Earthquake Humboldt Earthquake N/A 1994 Humboldt 12/29/94 Not declared $1,300,000
Economic Mediterranean Fruit Fly N/A 1994 Ventura 10/7/94 Not declared
Fire San Luis Obispo Fire - Hwy 41 N/A 1994 San Luis Obispo 8/24/94 Not declared 12 $6,382,235
Severe Storm Severe Winter Storms DR-1044 1995
Los Angeles, Orange, Humboldt,
Lake , Sonoma, Butte, Colusa,
Contra Costa, Del Norte, Glenn,
Kern, Lassen, Mendocino, Modoc,
Monterey, Napa, placer, Plumas,
San Luis Obispo, Santa Barbara,
Santa Clara, Santa Cruz, Tehama,
Ventura, Yolo, Yuba, Alpine,
Amador, Nevada, Riverside,
Sacramento, San Bernardino, San
Mateo, Shasta, Sutter, Trinity, San
Diego, Alameda, Marin, Fresno,
Kings, El Dorado, Madera, Solano,
Siskiyou
1/6/95 - 3/14/95 1/13/95 11 $741,400,000
Severe Storm,
Flood Late Winter Storms DR-1046 1995 All counties except Del Norte 1/10/95 17 $1,100,000,000
Fire Southern California Firestorms EM-3120 1996 Los Angeles, Orange, San Diego 10/1/96 5 $40,000,000
Flood January 1997 Floods 1997
Alpine, Amador, Butte, Colusa, Del
Norte, El Dorado, Glenn,
Humboldt, Lake, Lassen, Modoc,
Napa, Nevada, Plumas,
Sacrament, San Joaquin, Sierra,
Siskiyou, Solano, Sonoma, Sutter,
Tehama, Trinity, Yuba, Calaveras,
Madera, Mono, Monterey, Placer,
San Benito, San Luis Obispo, San
Mateo, Santa Cruz, Shasta,
Stanislaus, Tuolumne, Yolo, Contra
Costa, Fresno, Marin, Tulare,
1/2/97 - 1/31/97 8 $1,800,000,000
Rancho Santiago Community College District
VII. Appendices
Page 33 of 43
Hazard Type
Disaster Name Disaster # Year Counties and Cities
Declared
State
Declaration
Federal
Declaration
# of
Deaths
# of
Injuries Cost of Damage
Mariposa, Merced, Santa Clara,
Alameda, San Francisco, Kings,
Flood El Nino 1998
Alameda, Amador, Butte,
Calaveras, Colusa, Contra Costa,
Fresno, Glenn Humboldt, Kern,
Kings, Lake, Los Angeles, Marin,
Mendocino, Merced, Monterey,
Napa, Orange, Riverside,
Sacramento, San Benito, San
Bernardino, San Diego, San
Francisco, San Joaquin, San Luis
Obispo, San Mateo, Santa
Barbara, Santa Clara, Santa Cruz,
Siskiyou, Solano, Sonoma,
Stanislaus, Sutter, Tehama, Trinity,
Tulare, Ventura, Yolo, Yuba
17 $550,000,000
Freeze Freeze 1998 Fresno, Kern, Kings, Madera,
Merced, Monterey, Tulare, Ventura 2/9/99
Fire Fire 1999 Various Counties 8/26/99
Road Damage 1999 Sonoma 3/29/99
Earthquake Earthquake 2000 Napa 9/6/00
Drought Water Shortage 2001 City of Rio Dell 3/16/01
Fire California Wildfires DR-1498 2003 Ventura, LA, San Bernardino,
Riverside, San Diego DR1498
Earthquake Sierra Madre Earthquake N/A 2003 Los Angeles 7/5/91 Not declared 1 30 $33,500,000
Fire Widespread Fires N/A 2003 Madera Not declared 2 Not available
Severe Storm,
Freeze Freeze and Snow Conditions N/A 2003 Lake 7/13/72 Not declared $357,000
Drought Drought 2003 Modoc, Siskiyou 5/4/01
Economic Exotic Newcastle Disease
Epidemic 2003 15 Northern Counties 2/21/03
Economic Bark Beetle Infestation 2003 San Bernardino, San Diego,
Riverside 3/7/03
Fire Wildfire 2003 Calaveras 9/10/01
Fire Southern California Wildfires DR-1498 2003 Ventura, Los Angeles, San
Bernardino, Riverside, San Diego 10/24-26/03 10/27/03
Earthquake San Simeon Earthquake DR-1505 2003 San Luis Obispo, Santa Barbara 12/23/03 1/13/04 Estimated $55
million
Flood Levee Break DR-1529 2004 San Joaquin 6./4/04 6/30/04 $53,000,000
Landslide La Conchita Mudslide 2005 La Conchita, Ventura County 1/12/05 Not Declared 10 22
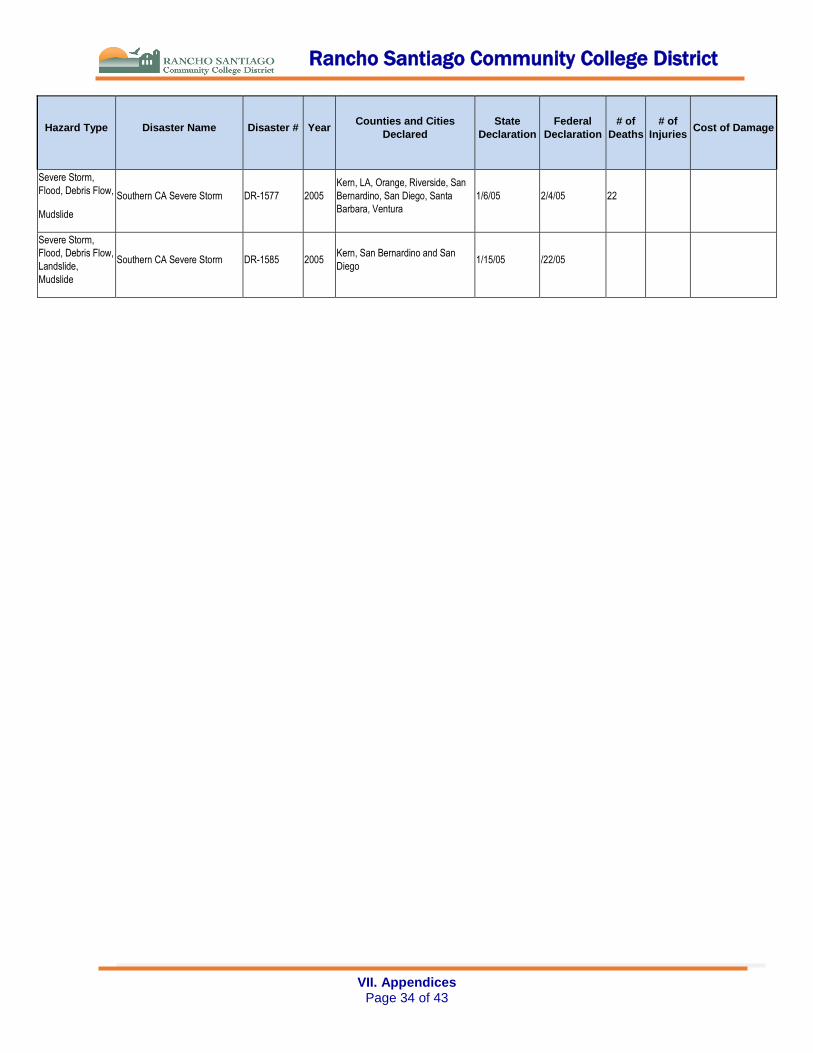
Rancho Santiago Community College District
VII. Appendices
Page 34 of 43
Hazard Type
Disaster Name Disaster # Year Counties and Cities
Declared
State
Declaration
Federal
Declaration
# of
Deaths
# of
Injuries Cost of Damage
Severe Storm,
Flood, Debris Flow,
Mudslide
Southern CA Severe Storm DR-1577 2005
Kern, LA, Orange, Riverside, San
Bernardino, San Diego, Santa
Barbara, Ventura
1/6/05 2/4/05 22
Severe Storm,
Flood, Debris Flow,
Landslide,
Mudslide
Southern CA Severe Storm DR-1585 2005 Kern, San Bernardino and San
Diego 1/15/05 /22/05
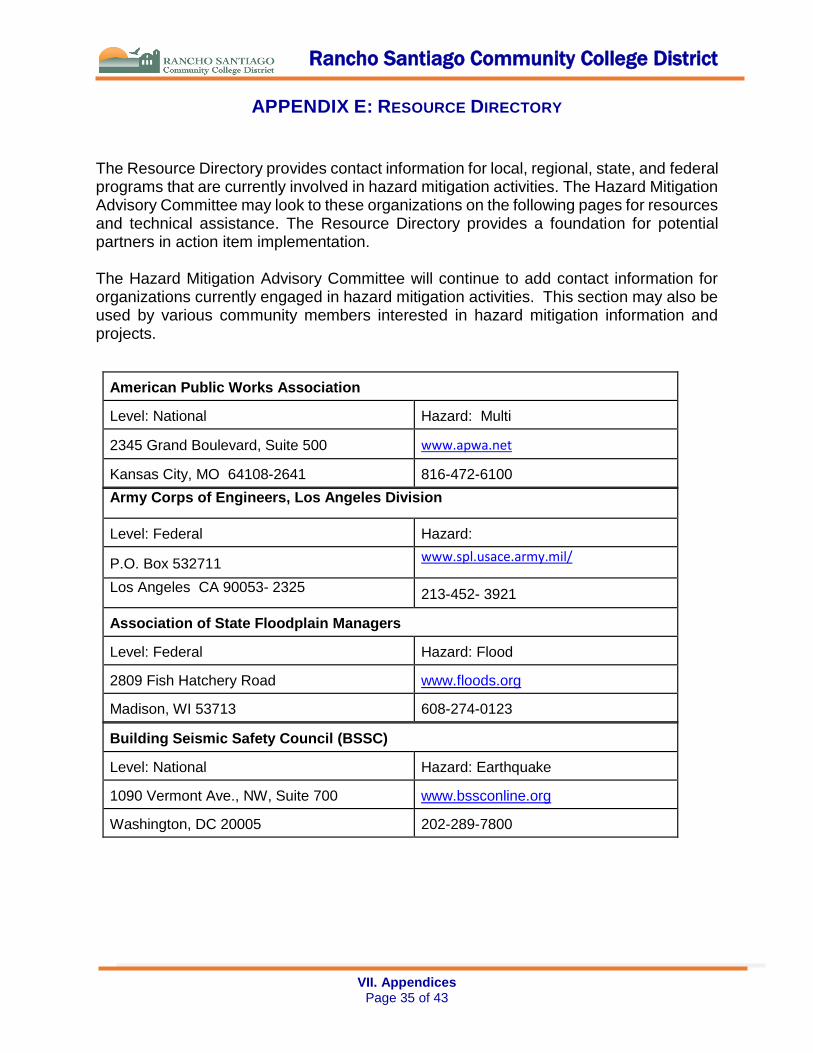
Rancho Santiago Community College District
VII. Appendices
Page 35 of 43
APPENDIX E: RESOURCE DIRECTORY
The Resource Directory provides contact information for local, regional, state, and federal programs that are currently involved in hazard mitigation activities. The Hazard Mitigation Advisory Committee may look to these organizations on the following pages for resources and technical assistance. The Resource Directory provides a foundation for potential partners in action item implementation. The Hazard Mitigation Advisory Committee will continue to add contact information for organizations currently engaged in hazard mitigation activities. This section may also be used by various community members interested in hazard mitigation information and projects.
American Public Works Association
Level: National Hazard: Multi
2345 Grand Boulevard, Suite 500 www.apwa.net
Kansas City, MO 64108-2641 816-472-6100
Army Corps of Engineers, Los Angeles Division
Level: Federal Hazard:
P.O. Box 532711 www.spl.usace.army.mil/
Los Angeles CA 90053- 2325 213-452- 3921
Association of State Floodplain Managers
Level: Federal Hazard: Flood
2809 Fish Hatchery Road www.floods.org
Madison, WI 53713 608-274-0123
Building Seismic Safety Council (BSSC)
Level: National Hazard: Earthquake
1090 Vermont Ave., NW, Suite 700 www.bssconline.org
Washington, DC 20005 202-289-7800
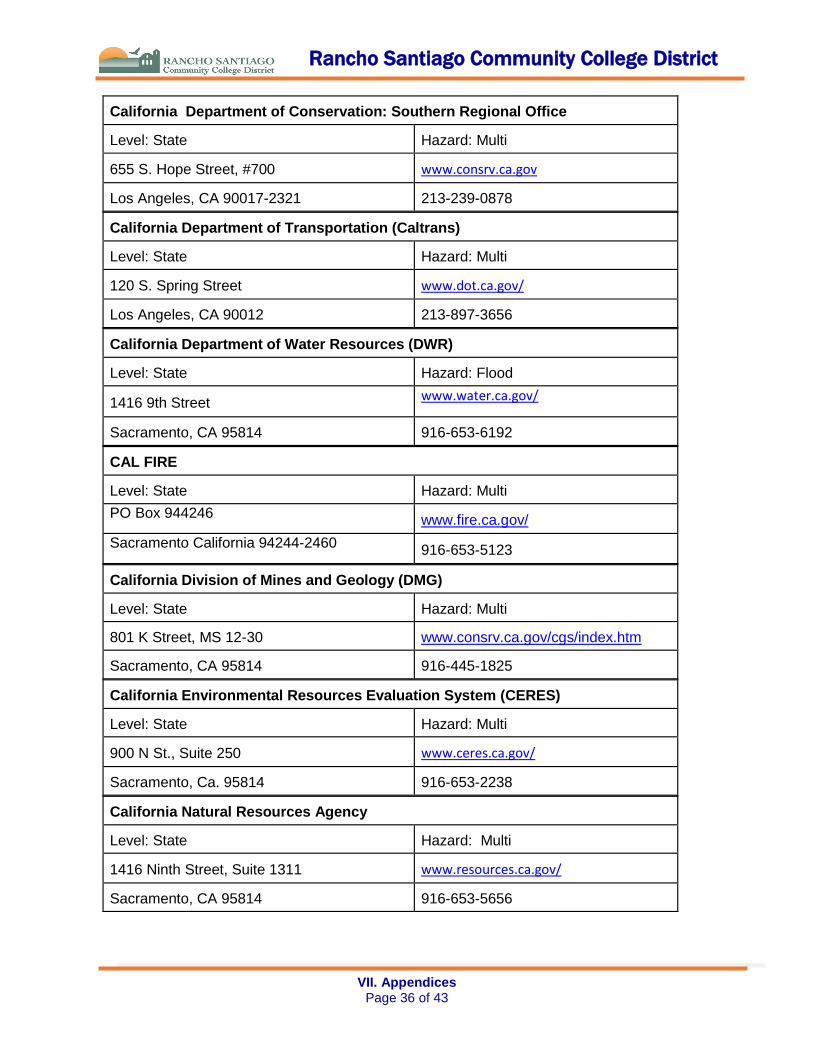
Rancho Santiago Community College District
VII. Appendices
Page 36 of 43
California Department of Conservation: Southern Regional Office
Level: State Hazard: Multi
655 S. Hope Street, #700 www.consrv.ca.gov
Los Angeles, CA 90017-2321 213-239-0878
California Department of Transportation (Caltrans)
Level: State Hazard: Multi
120 S. Spring Street www.dot.ca.gov/
Los Angeles, CA 90012 213-897-3656
California Department of Water Resources (DWR)
Level: State Hazard: Flood
1416 9th Street www.water.ca.gov/
Sacramento, CA 95814 916-653-6192
CAL FIRE
Level: State Hazard: Multi
PO Box 944246 www.fire.ca.gov/
Sacramento California 94244-2460 916-653-5123
California Division of Mines and Geology (DMG)
Level: State Hazard: Multi
801 K Street, MS 12-30 www.consrv.ca.gov/cgs/index.htm
Sacramento, CA 95814 916-445-1825
California Environmental Resources Evaluation System (CERES)
Level: State Hazard: Multi
900 N St., Suite 250 www.ceres.ca.gov/
Sacramento, Ca. 95814 916-653-2238
California Natural Resources Agency
Level: State Hazard: Multi
1416 Ninth Street, Suite 1311 www.resources.ca.gov/
Sacramento, CA 95814 916-653-5656
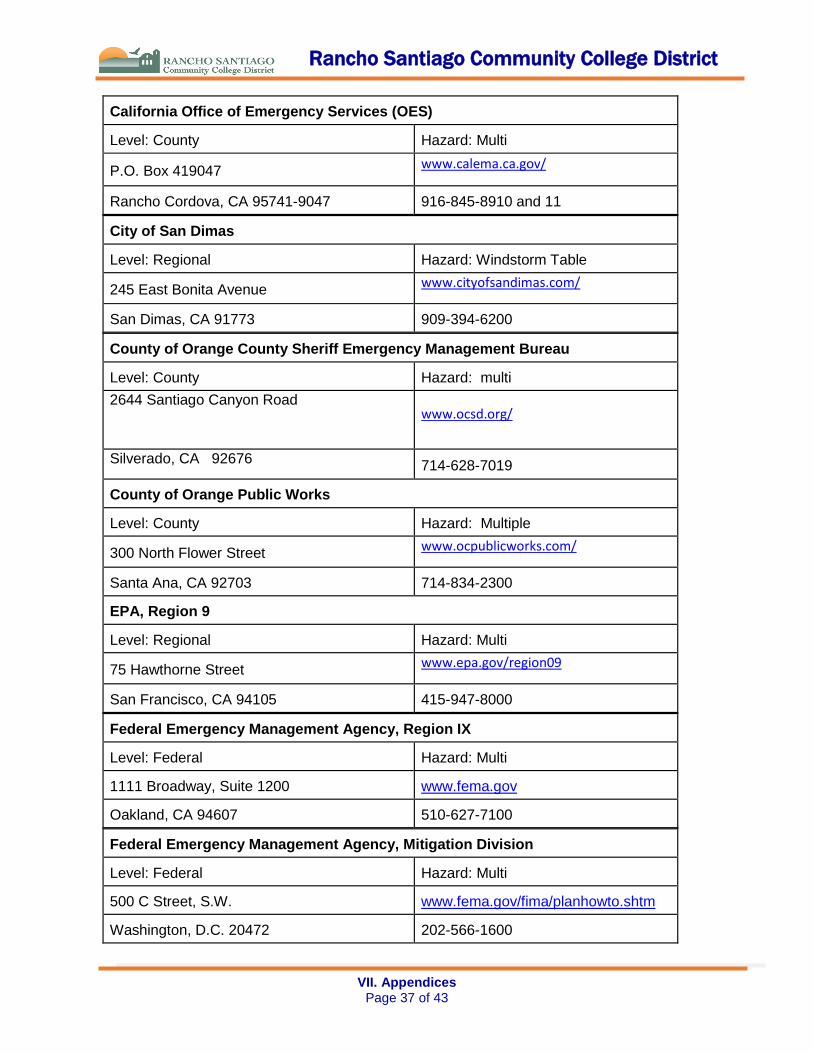
Rancho Santiago Community College District
VII. Appendices
Page 37 of 43
California Office of Emergency Services (OES)
Level: County Hazard: Multi
P.O. Box 419047 www.calema.ca.gov/
Rancho Cordova, CA 95741-9047 916-845-8910 and 11
City of San Dimas
Level: Regional Hazard: Windstorm Table
245 East Bonita Avenue www.cityofsandimas.com/
San Dimas, CA 91773 909-394-6200
County of Orange County Sheriff Emergency Management Bureau
Level: County Hazard: multi
2644 Santiago Canyon Road
www.ocsd.org/
Silverado, CA 92676 714-628-7019
County of Orange Public Works
Level: County Hazard: Multiple
300 North Flower Street www.ocpublicworks.com/
Santa Ana, CA 92703 714-834-2300
EPA, Region 9
Level: Regional Hazard: Multi
75 Hawthorne Street www.epa.gov/region09
San Francisco, CA 94105 415-947-8000
Federal Emergency Management Agency, Region IX
Level: Federal Hazard: Multi
1111 Broadway, Suite 1200 www.fema.gov
Oakland, CA 94607 510-627-7100
Federal Emergency Management Agency, Mitigation Division
Level: Federal Hazard: Multi
500 C Street, S.W. www.fema.gov/fima/planhowto.shtm
Washington, D.C. 20472 202-566-1600
Rancho Santiago Community College District
VII. Appendices
Page 38 of 43
Floodplain Management Association
Level: Federal Hazard: Flood
P.O. Box 50891 www.floodplain.org
Sparks, NV 89435-0891 775-626-6389
International Society of Arboriculture
Level: International Hazard: Severe Weather
P.O. Box 3129 www.isa-arbor.com
Champaign, IL 61826-3129 217-355-9411
Landslide Hazards Program, USGS
Level: Federal Hazard: Landslide
12201 Sunrise Valley Drive, MS 906 www.landslides.usgs.gov/index
Reston, VA 20192 703-648- 4000
National Fire Protection Association (NFPA)
Level: National Hazard: Wildfire
P.O. Box 9101 www.nfpa.org
Quincy, MA 02269-9101 617-770-3000
National Flood Insurance Program (NFIP)
Level: Federal Hazard: Flood
500 C Street, S.W. www.fema.gov/nfip/
Washington, D.C. 20472 202-566-1600
National Flood Insurance Program (NFIP)
Community Rating System (CRS)
Level: Federal Hazard: Flood
500 C Street, S.W. www.fema.gov/nfip/crs.shtm
Washington, D.C. 20472 202-566-1600
National Interagency Fire Center (NIFC)
Level: Federal Hazard: Wildfire
3833 S. Development Ave. www.nifc.gov
Boise, Idaho 83705-5354 208-387-5512
National Landslide Information Center, US Geological Survey
Rancho Santiago Community College District
VII. Appendices
Page 39 of 43
Level: Federal Hazard: Landslide
345 Middlefield Road www.landslides.usgs.gov/nlic/
Menlo Park, CA 94025 650-853-8300
National Oceanic /Atmospheric Administration
Level: Federal Hazard: Multi
14th Street & Constitution Ave NW, Room
6013 www.noaa.gov
Washington, DC 20230 202-482-6090
National Resources Conservation Service
Level: Federal Hazard: Multi
14th and Independence Ave., SW Room,
5105-A www.nrcs.usda.gov/
Washington, DC 20250 202-720-7246
National Weather Service, Oxnard, CA
Level: Federal Hazard: Multi
520 North Elevar Street www.nws.noaa.gov/
Oxnard, CA 93030 805-988- 6615
National Weather Service, Office of Hydrologic Development
Level: Federal Hazard: Flood
1325 East West Highway, SSMC2 www.nws.noaa.gov/
Silver Spring, MD 20910 301-713-1658
National Wildland/Urban Interface Fire Program
Level: Federal Hazard: Wildfire
1 Batterymarch Park www.firewise.org/
Quincy, MA 02169-7471 617-770-3000
Rancho Santiago Community College District
VII. Appendices
Page 40 of 43
Office of the State Fire Marshal (SFM)
Level: State Hazard: Wildfire
1131 "S" Street www.osfm.fire.ca.gov
Sacramento, CA 95814 916-445-8200
Orange County Fire Authority Headquarters (OCFA)
Level: County Hazard: All
One Authority Road www.ocfa.org
Irvine, CA 949-881-2411
Orange County Sanitation District
Level: County Hazard: All
10844 Ellis Avenue www.ocsd.com/
Fountain Valley, CA 92708 714-962-2411
South Coast Air Quality Management District (AQMD)
Level: Regional Hazard: Multi
21865 E. Copley Drive www.aqmd.gov
Diamond Bar, CA 91765 800-CUT-SMOG
Southern California Association of Governments (SCAG)
Level: Regional Hazard: Multi
818 W. Seventh Street, 12th Floor www.scag.ca.gov
Los Angeles, CA 90017 213-236-1800
Southern California Earthquake Center (SCEC)
Level: Regional Hazard: Earthquake www.scec.org
3651 Trousdale Parkway Suite 169
Los Angeles, CA 90089-0742 213-740-5843
US Army Corps of Engineers
Level: Federal Hazard: Multi
P.O. Box 532711 www.usace.army.mil
Los Angeles CA 90053- 2325 213-452- 3921

Rancho Santiago Community College District
VII. Appendices
Page 41 of 43
USDA Forest Service
Level: Federal Hazard: Wildfire
1400 Independence Ave. SW www.fs.fed.us
Washington, D.C. 20250-0002 202-205-8333
Rancho Santiago Community College District
VII. Appendices
Page 42 of 43
US Department of the Interior, Bureau of Reclamation
Level: Federal Hazard: Multi
2800 Cottage Way www.usbr.gov/
Sacramento CA 95825-1898 916- 978-5000 or 5599
US Fire Administration (USFA) (an entity of FEMA)
Level: Federal Hazard: Multi
16825 South Seton Avenue www.usfa.fema.gov/
Emmitsburg, MD 21727 301-447-1000
United States Geological Survey
Level: Federal Hazard: Multi
345 Middlefield Road www.usgs.gov/
Menlo Park, CA 94025 650-853-8300
USGS Water Resources
Level: Federal Hazard: Multi
6000 J Street, Placer Hall www.water.usgs.gov
Sacramento, CA 95819-6129 916-278-3000
University of Nebraska-Lincoln/U.S. Drought Monitor
Level: National Hazard: Drought
3310 Holdrege Street www.droughtmonitor.uni.edu
Lincoln, Nebraska (402) 472–6707
Rancho Santiago Community College District
VII. Appendices
Page 43 of 43
LIST OF REFERENCES ON FILE WITH RSCCD RISK MANAGEMENT OFFICE
Reference A – RSCCD 2015 Insurance Property Evaluation Report (completed every 5 years)
Reference B – RSCCD Earthquake Hazus Study by MMI Engineering
Reference C – RSCCD Flood Hazus Study by MMI Engineering
Reference D – RSCCD Facilities Master Plan