Embed Size (px)
Citation preview
No. 217
LEGISLATIVE ASSEMBLY OF THE NORTHERN TERRITORY
WRITTEN QUESTION
Mr Chandler to Minister for Education and Training, in relation to the portfolio areas within the Department of Education and Training.
Questions are asked of each Minister of their departments and are asked to be responded to by output group within each department.
Minister for Education and Training, in relation to the portfolio areas within the Department of Education and Training – Generic Estimates Questions
#Note: All HR Questions are as of Pay Cycle 20, 30 March 2011
ANSWERS:. All 2010-11 financial year questions use the time period 1 July 2010 to 31 March 2010.
1. What is the NTG FTE Cap for your Agency?
4187 FTE
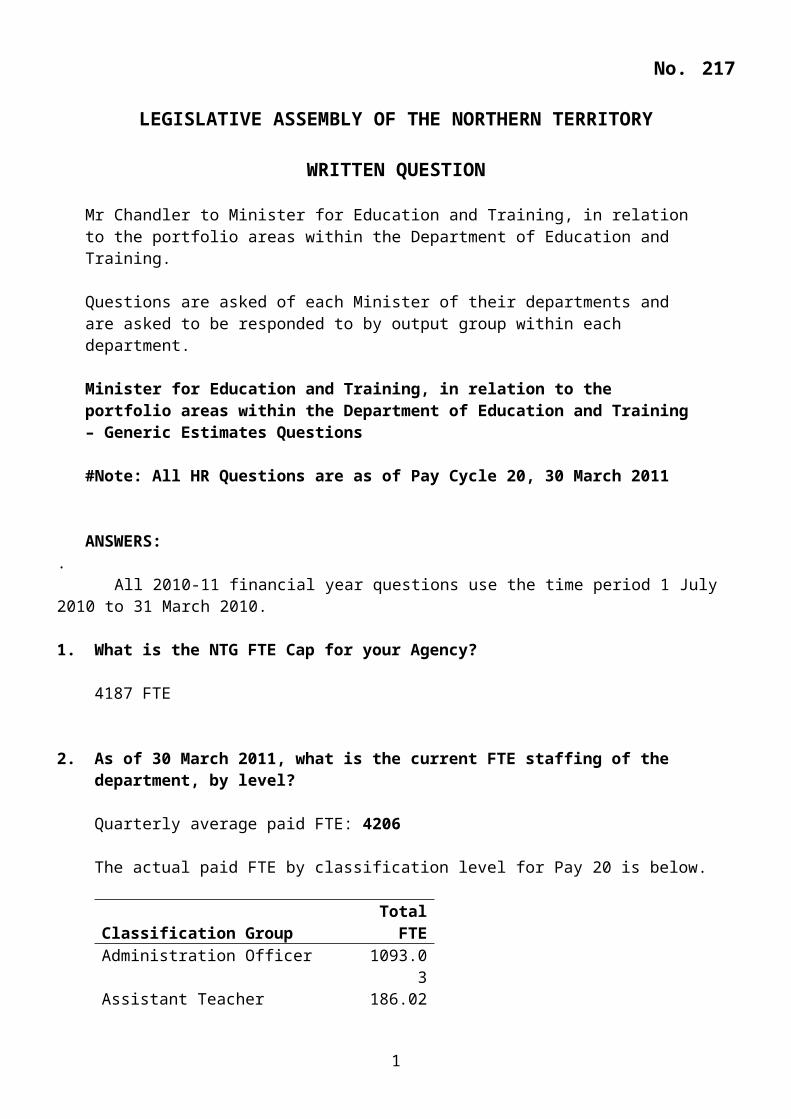
2. As of 30 March 2011, what is the current FTE staffing of the department, by level?
Quarterly average paid FTE: 4206
The actual paid FTE by classification level for Pay 20 is below.
Classification GroupTotal FTE
Administration Officer 1093.03Assistant Teacher 186.02Executive Contract Officer 51.13Executive Contract Principal 77.5Other Agency 3.9Physical 103.35Professional 41Senior Administration Officer 48.5Senior Teacher 486.87Teacher 2252.55Technical 4.7
Total 4,387.37
1
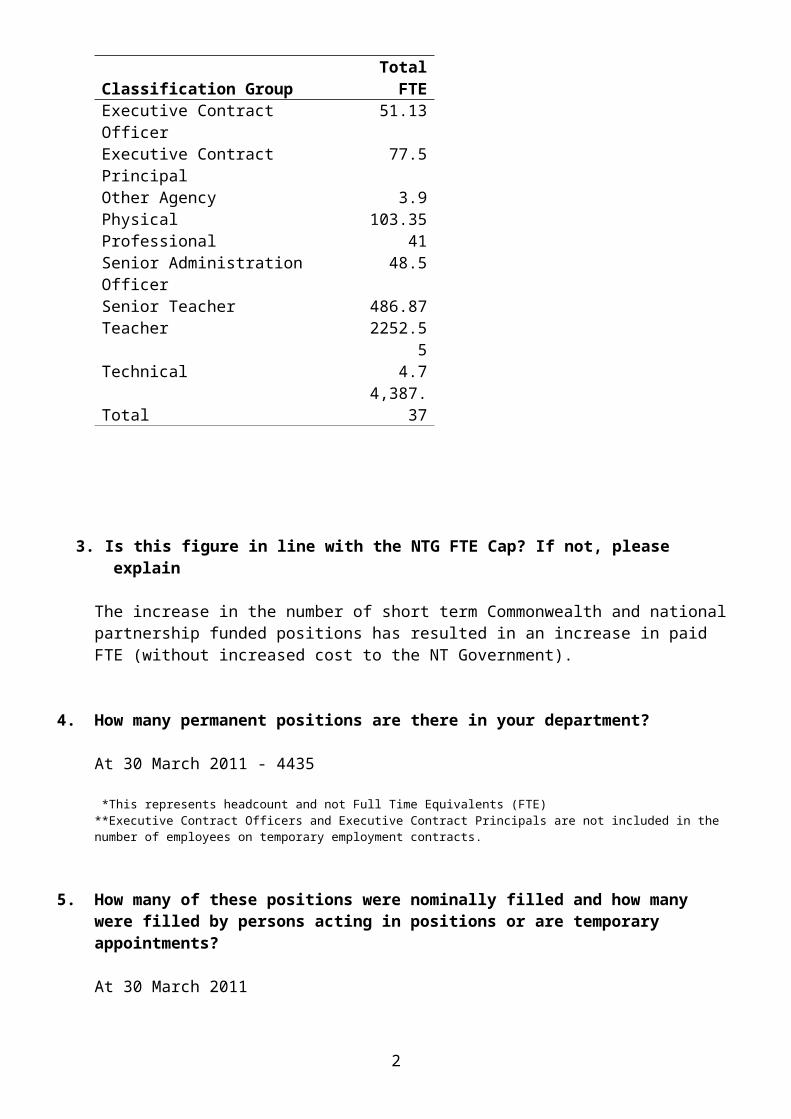
3. Is this figure in line with the NTG FTE Cap? If not, please explain
The increase in the number of short term Commonwealth and national partnership funded positions has resulted in an increase in paid FTE (without increased cost to the NT Government).
4. How many permanent positions are there in your department?
At 30 March 2011 - 4435
*This represents headcount and not Full Time Equivalents (FTE)**Executive Contract Officers and Executive Contract Principals are not included in the number of employees on temporary employment contracts.
5. How many of these positions were nominally filled and how many were filled by persons acting in positions or are temporary appointments?
At 30 March 2011
Nominally filled by permanent employees: 2503
Temporarily filled by permanent employees: 536
Filled by employees on temporary contracts: 1268
Please separate by permanent/temporary/acting by level
Classification GroupNumber of Staff
Permanent Employees
Held in Nominal
Positions
Permanent Employee
s not in their
Nominal Position
Temporary Employment
ContractsAdministration Officer 1,123 617 183 323Assistant Teacher 216 124 2 90Executive Contract Officer 45Executive Contract Principal 83Physical 131 76 2 53Principal 67 49 12 6Professional 34 8 1 25Senior Administration Officer 56 29 23 4Senior Teacher 534 275 212 47Teacher 2,121 1,322 100 699Technical 5 3 1 1Trainee and Apprentices 20 20
Total 4,435 2,503 536 1,268
198 CTs and STs have been offered permanency at the CT classification as part of the teacher permanency round. These offers were made after the above report was run.
2
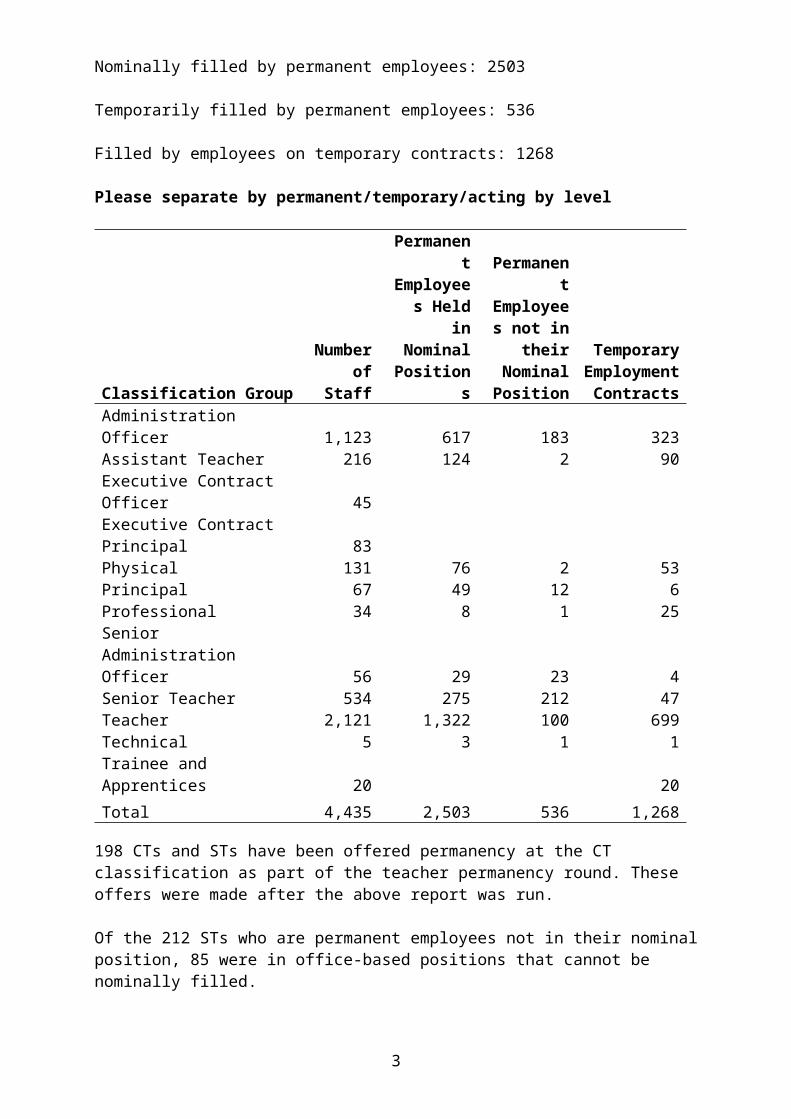
Of the 212 STs who are permanent employees not in their nominal position, 85 were in office-based positions that cannot be nominally filled.
There are currently 257 externally funded positions. These positions are unable to be filled on a permanent basis. Please note that with positions that have dual funding, only the first funding source has been used to identify the funding source.
6. What was the turnover rate of staff in the Agency in 2010?
Time period: 1 July 2010 to 31 March 2011
Not including transfers between NTG agencies the turnover rate is 18%
Including transfers between NTG agencies the turnover rate is 22.92%. This is an expected turnover rate as it includes:
DET’s commitment to EBA outcomes for remote staff and teacher transfers Separations of employees on short-term contracts backfilling those on sick, long
service and study leave. Over half of the separations were due to the completion of temporary staff to back
fill people on short-term leave. If this were taken into account, the percentage would be considerably lower again.
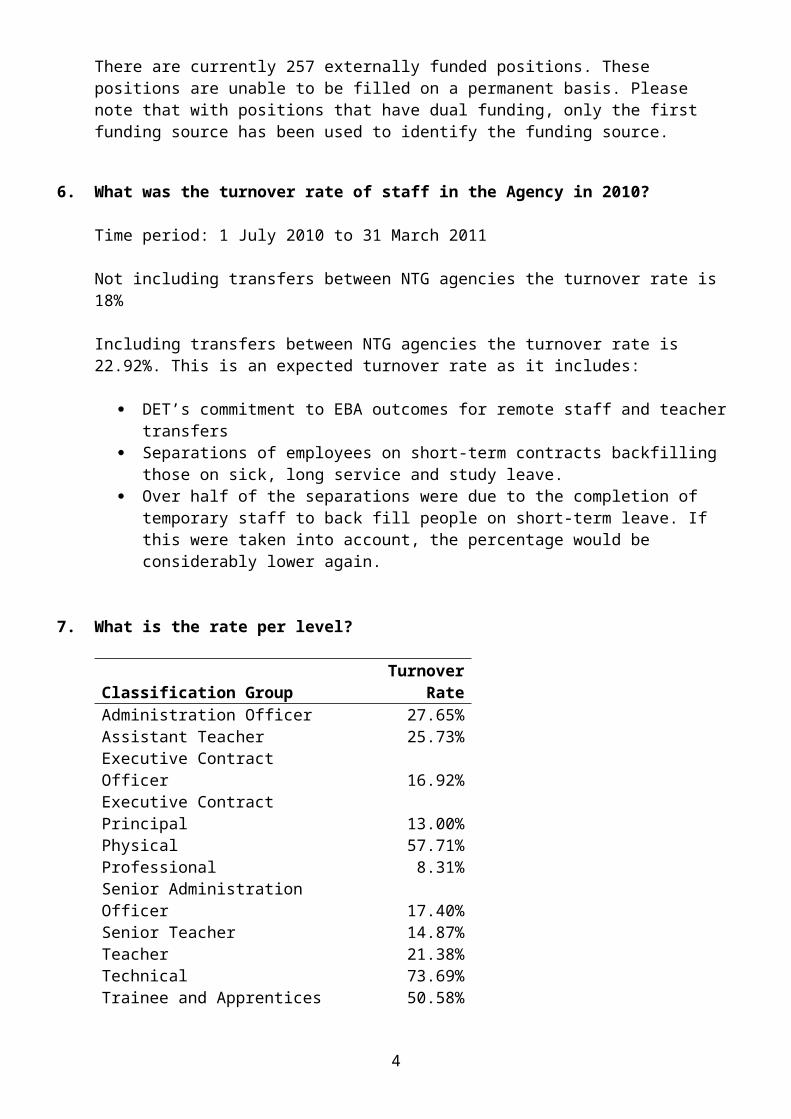
7. What is the rate per level?
Classification GroupTurnover
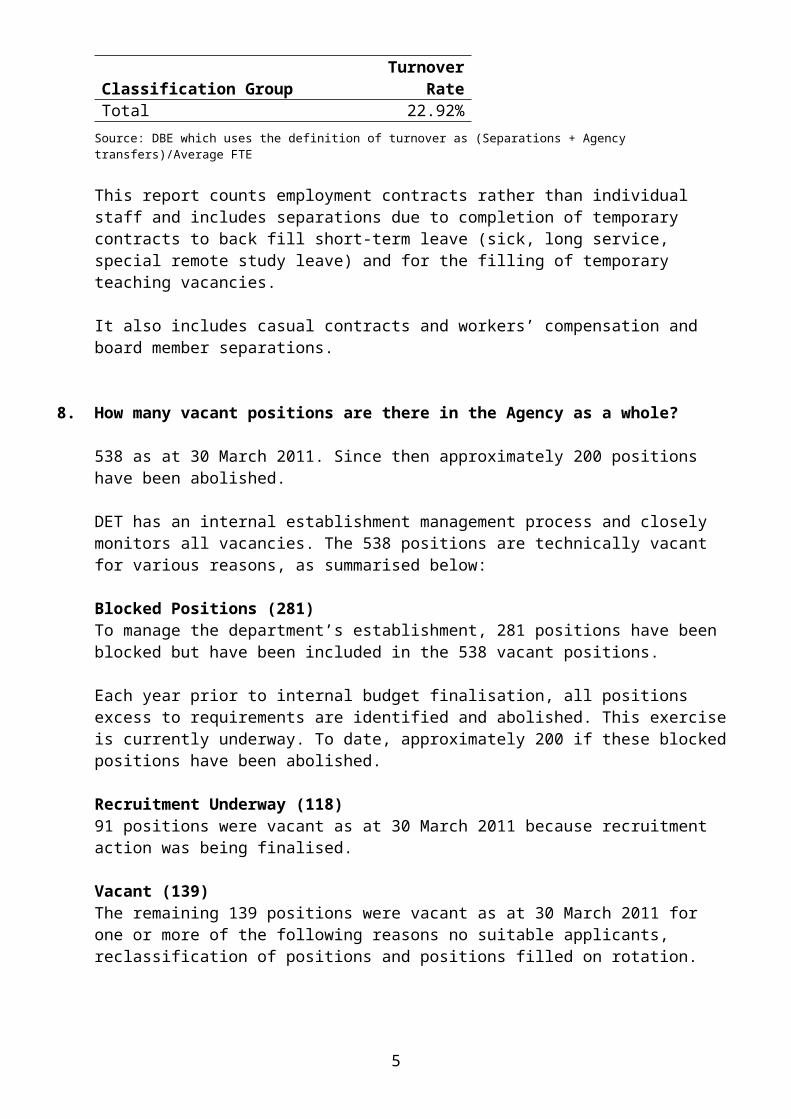
RateAdministration Officer 27.65%Assistant Teacher 25.73%Executive Contract Officer 16.92%Executive Contract Principal 13.00%Physical 57.71%Professional 8.31%Senior Administration Officer 17.40%Senior Teacher 14.87%Teacher 21.38%Technical 73.69%Trainee and Apprentices 50.58%Total 22.92%
Source: DBE which uses the definition of turnover as (Separations + Agency transfers)/Average FTE
This report counts employment contracts rather than individual staff and includes separations due to completion of temporary contracts to back fill short-term leave (sick, long service, special remote study leave) and for the filling of temporary teaching vacancies.
It also includes casual contracts and workers’ compensation and board member separations.
3
8. How many vacant positions are there in the Agency as a whole?
538 as at 30 March 2011. Since then approximately 200 positions have been abolished.
DET has an internal establishment management process and closely monitors all vacancies. The 538 positions are technically vacant for various reasons, as summarised below:
Blocked Positions (281)To manage the department’s establishment, 281 positions have been blocked but have been included in the 538 vacant positions.
Each year prior to internal budget finalisation, all positions excess to requirements are identified and abolished. This exercise is currently underway. To date, approximately 200 if these blocked positions have been abolished.
Recruitment Underway (118)91 positions were vacant as at 30 March 2011 because recruitment action was being finalised.
Vacant (139)The remaining 139 positions were vacant as at 30 March 2011 for one or more of the following reasons no suitable applicants, reclassification of positions and positions filled on rotation.
9. How long, in total days, have nominal positions been vacant in the department?
Unable to extract this data.
10. How many staff are currently employed on a temporary contract?
At 30 March 2011 – 1565*
*198 CTs and STs have been offered permanency at the CT classification as part of teacher permanency round. These offers were made after the above report was generated.
There are currently 257 externally funded positions. Because of the nature of the positions they are unable to be filled on a permanent basis.
If the 198 teachers offered permanency and the 257 externally funded positions were removed the number of employees on temporary contracts would decrease to 1110.
4
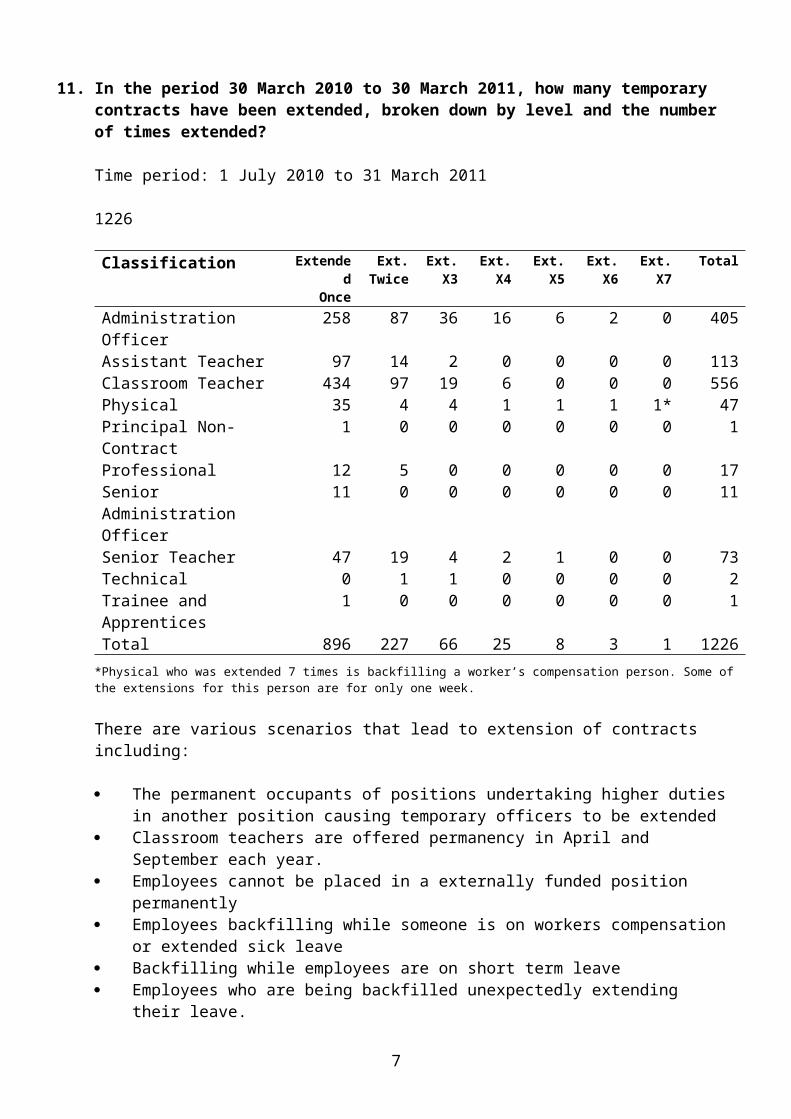
11. In the period 30 March 2010 to 30 March 2011, how many temporary contracts have been extended, broken down by level and the number of times extended?
Time period: 1 July 2010 to 31 March 2011
1226
Classification ExtendedOnce
Ext.Twice
Ext.X3
Ext.X4
Ext.X5
Ext.X6
Ext.X7
Total
Administration Officer 258 87 36 16 6 2 0 405Assistant Teacher 97 14 2 0 0 0 0 113Classroom Teacher 434 97 19 6 0 0 0 556Physical 35 4 4 1 1 1 1* 47Principal Non-Contract 1 0 0 0 0 0 0 1Professional 12 5 0 0 0 0 0 17Senior Administration Officer
11 0 0 0 0 0 0 11
Senior Teacher 47 19 4 2 1 0 0 73Technical 0 1 1 0 0 0 0 2Trainee and Apprentices 1 0 0 0 0 0 0 1Total 896 227 66 25 8 3 1 1226
*Physical who was extended 7 times is backfilling a worker’s compensation person. Some of the extensions for this person are for only one week.
There are various scenarios that lead to extension of contracts including:
The permanent occupants of positions undertaking higher duties in another position causing temporary officers to be extended
Classroom teachers are offered permanency in April and September each year. Employees cannot be placed in a externally funded position permanently Employees backfilling while someone is on workers compensation or extended sick
leave Backfilling while employees are on short term leave Employees who are being backfilled unexpectedly extending their leave. Physicals are usually casual contracts short term backfill for less than 3 weeks Permanent employees undertaking paid study leave.
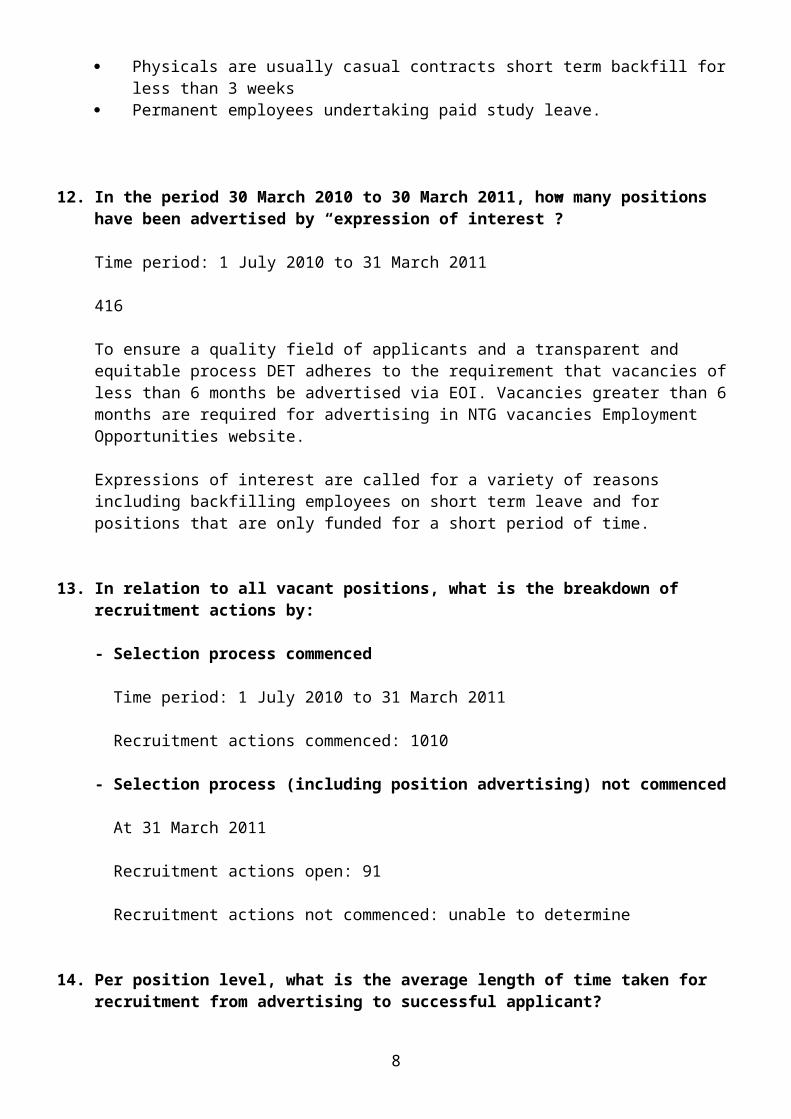
12. In the period 30 March 2010 to 30 March 2011, how many positions have been advertised by “expression of interest”?
Time period: 1 July 2010 to 31 March 2011
416
To ensure a quality field of applicants and a transparent and equitable process DET adheres to the requirement that vacancies of less than 6 months be advertised via EOI. Vacancies greater than 6 months are required for advertising in NTG vacancies Employment Opportunities website.
5
Expressions of interest are called for a variety of reasons including backfilling employees on short term leave and for positions that are only funded for a short period of time.
13. In relation to all vacant positions, what is the breakdown of recruitment actions by:
- Selection process commenced
Time period: 1 July 2010 to 31 March 2011
Recruitment actions commenced: 1010
- Selection process (including position advertising) not commenced
At 31 March 2011
Recruitment actions open: 91
Recruitment actions not commenced: unable to determine
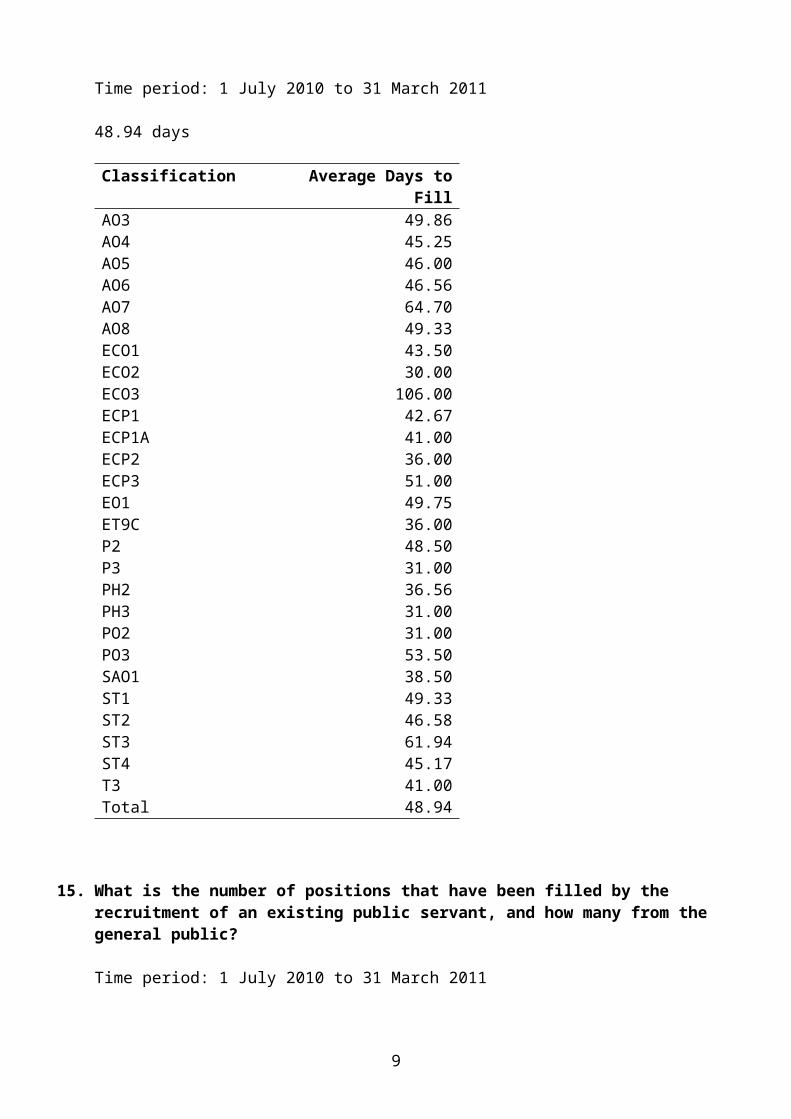
14. Per position level, what is the average length of time taken for recruitment from advertising to successful applicant?
Time period: 1 July 2010 to 31 March 2011
48.94 days
Classification Average Days to Fill
AO3 49.86AO4 45.25AO5 46.00AO6 46.56AO7 64.70AO8 49.33ECO1 43.50ECO2 30.00ECO3 106.00ECP1 42.67ECP1A 41.00ECP2 36.00ECP3 51.00EO1 49.75ET9C 36.00P2 48.50P3 31.00PH2 36.56PH3 31.00PO2 31.00PO3 53.50SAO1 38.50ST1 49.33
6
Classification Average Days to Fill
ST2 46.58ST3 61.94ST4 45.17T3 41.00Total 48.94
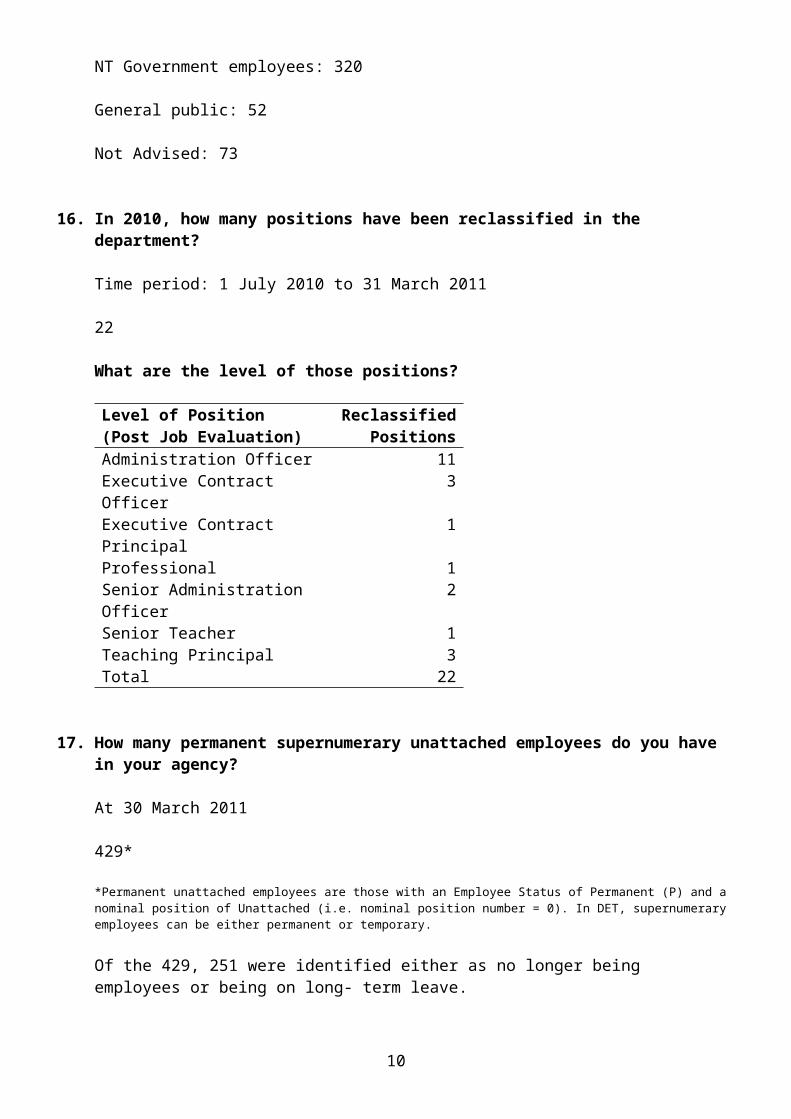
15. What is the number of positions that have been filled by the recruitment of an existing public servant, and how many from the general public?
Time period: 1 July 2010 to 31 March 2011
NT Government employees: 320
General public: 52
Not Advised: 73
16. In 2010, how many positions have been reclassified in the department?
Time period: 1 July 2010 to 31 March 2011
22
What are the level of those positions?
Level of Position (Post Job Evaluation)
Reclassified Positions
Administration Officer 11Executive Contract Officer 3Executive Contract Principal 1Professional 1Senior Administration Officer 2Senior Teacher 1Teaching Principal 3Total 22
17. How many permanent supernumerary unattached employees do you have in your agency?
At 30 March 2011
429*
*Permanent unattached employees are those with an Employee Status of Permanent (P) and a nominal position of Unattached (i.e. nominal position number = 0). In DET, supernumerary employees can be either permanent or temporary.
7
Of the 429, 251 were identified either as no longer being employees or being on long- term leave.
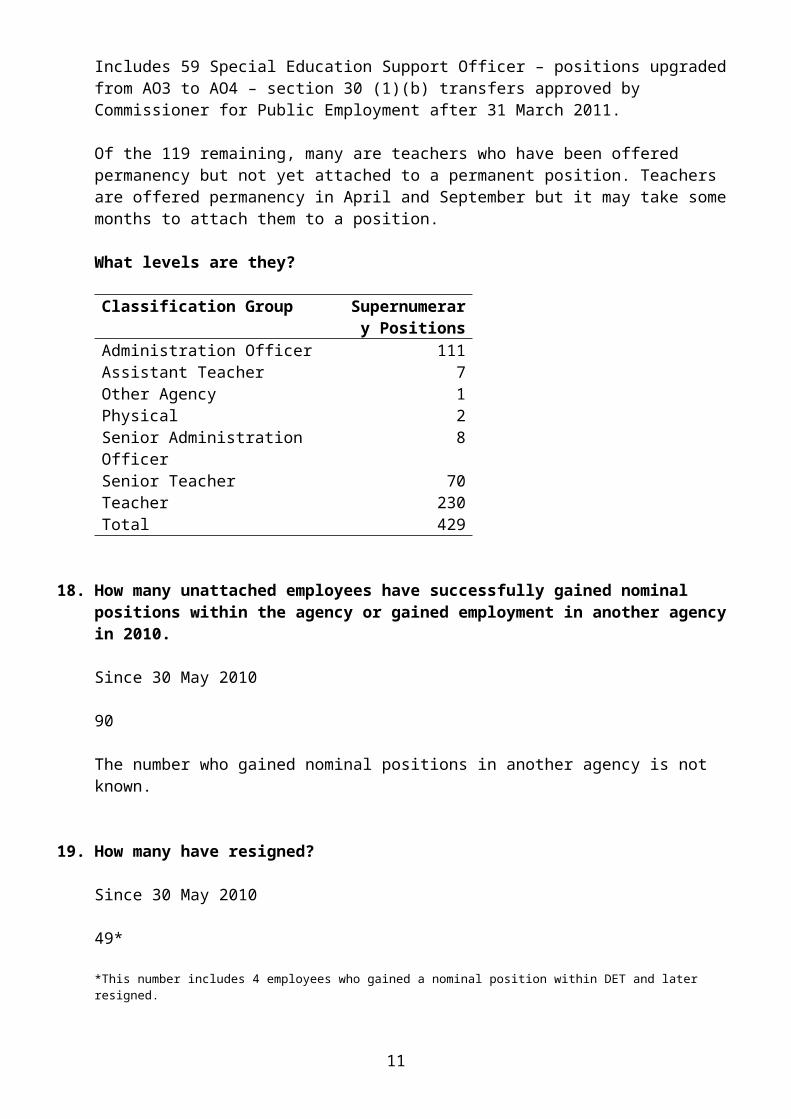
Includes 59 Special Education Support Officer – positions upgraded from AO3 to AO4 – section 30 (1)(b) transfers approved by Commissioner for Public Employment after 31 March 2011.
Of the 119 remaining, many are teachers who have been offered permanency but not yet attached to a permanent position. Teachers are offered permanency in April and September but it may take some months to attach them to a position.
What levels are they?
Classification Group Supernumerary Positions
Administration Officer 111Assistant Teacher 7Other Agency 1Physical 2Senior Administration Officer 8Senior Teacher 70Teacher 230Total 429
18. How many unattached employees have successfully gained nominal positions within the agency or gained employment in another agency in 2010.
Since 30 May 2010
90
The number who gained nominal positions in another agency is not known.
19. How many have resigned?
Since 30 May 2010
49*
*This number includes 4 employees who gained a nominal position within DET and later resigned.
20. What is the average length of stay of staff in the department? Please break this down by position level.
At 30 March 2011
7.2 years
8
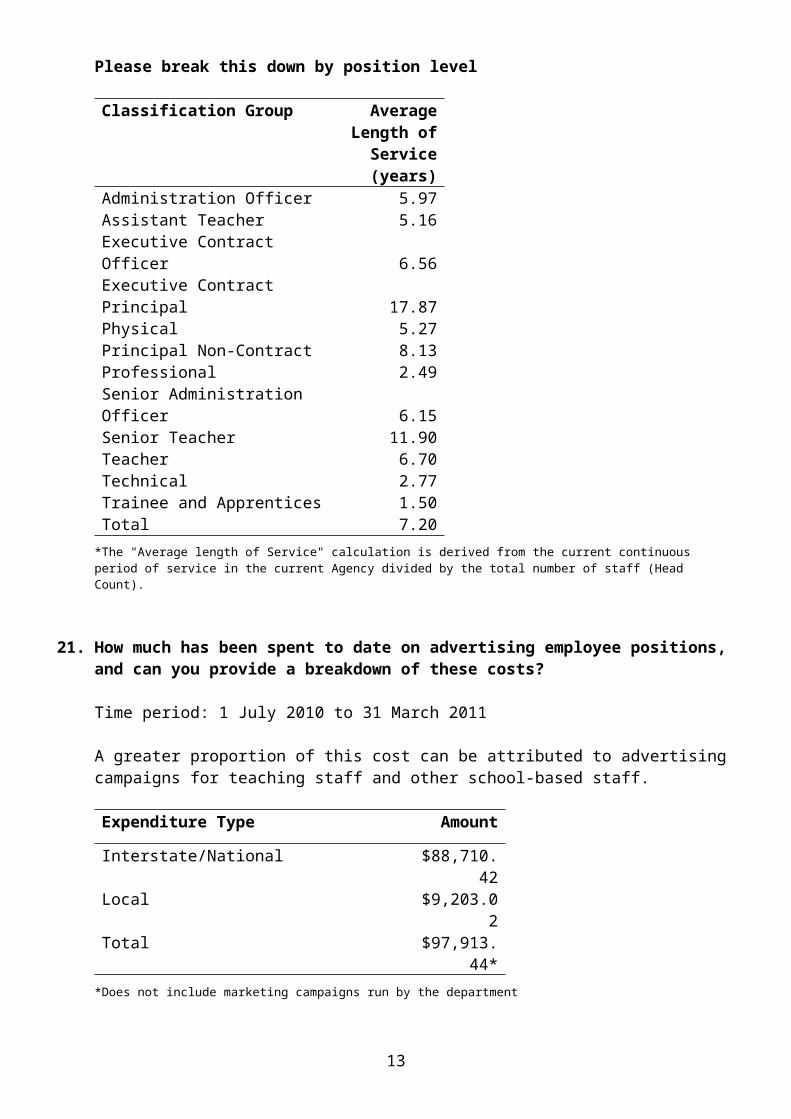
Please break this down by position level
Classification Group Average Length of
Service (years)
Administration Officer 5.97Assistant Teacher 5.16Executive Contract Officer 6.56Executive Contract Principal 17.87Physical 5.27Principal Non-Contract 8.13Professional 2.49Senior Administration Officer 6.15Senior Teacher 11.90Teacher 6.70Technical 2.77Trainee and Apprentices 1.50Total 7.20
*The "Average length of Service" calculation is derived from the current continuous period of service in the current Agency divided by the total number of staff (Head Count).
21. How much has been spent to date on advertising employee positions, and can you provide a breakdown of these costs?
Time period: 1 July 2010 to 31 March 2011
A greater proportion of this cost can be attributed to advertising campaigns for teaching staff and other school-based staff.
Expenditure Type Amount
Interstate/National $88,710.42Local $9,203.02Total $97,913.44
**Does not include marketing campaigns run by the department
22. In relation to Apprentices and Graduates, in 2010:- How many graduates started with the department
Time period: 1 January 2010 to 31 December 2010
18
- How many have completed the year
16
All 16 apprentices and graduates who completed the year are continuing with the department
9
- How many won nominal positions
None. Of the 16, one apprentice has won a temporary position with Student Services and the rest are continuing their apprenticeships and graduate programs with the department
- How many have left the NTG, and what was the length of time each stayed within the NTG before leaving?
2
23. In relation to Indigenous Employees, in 2010:- How many employees do you have in your department that recognise themselves
as Indigenous?
At 30 March 2011
553 self identified as being Indigenous
Currently 11.5% of DET employees identify as Indigenous, this is 3.3% above the NTG average.
- What are the levels of their positions held? How many at each level? How many are tenured and at what level? How many are temporary and at what levels? How many are acting up in positions and at what level?
See table below
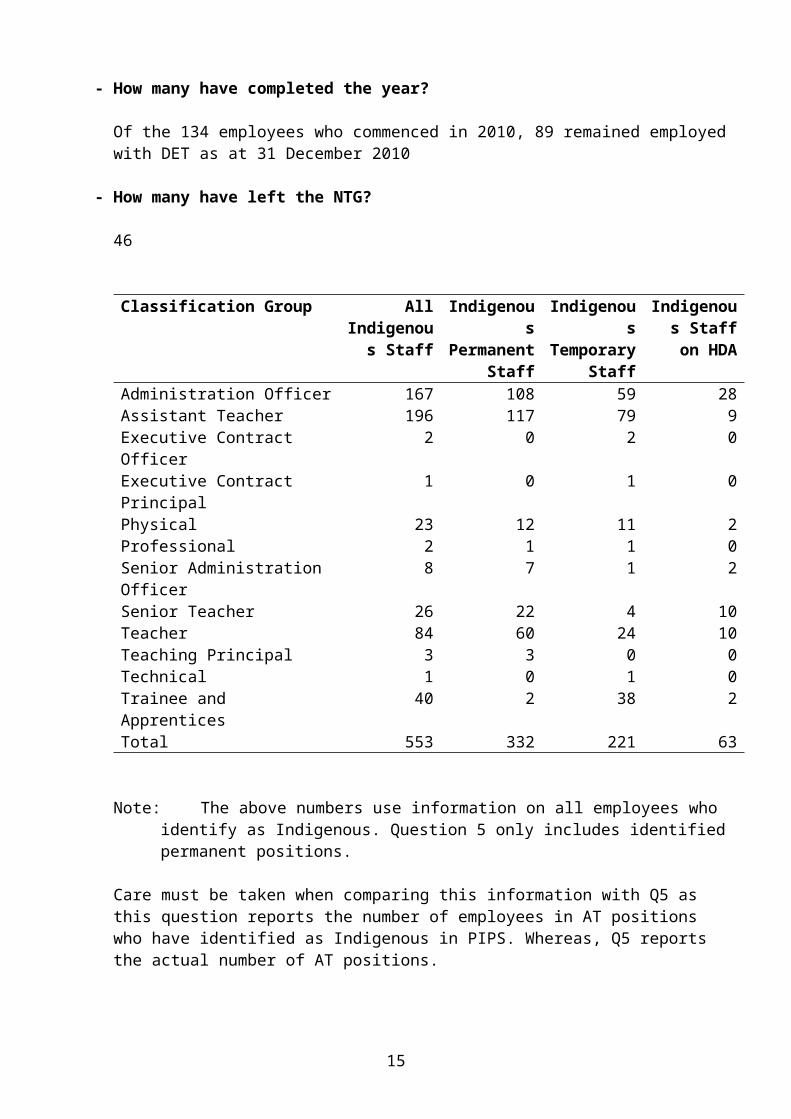
- How many have completed the year?
Of the 134 employees who commenced in 2010, 89 remained employed with DET as at 31 December 2010
- How many have left the NTG?
46
Classification Group All Indigenous
Staff
Indigenous Permanent
Staff
Indigenous Temporary
Staff
Indigenous Staff on
HDAAdministration Officer 167 108 59 28Assistant Teacher 196 117 79 9Executive Contract Officer 2 0 2 0Executive Contract Principal 1 0 1 0Physical 23 12 11 2Professional 2 1 1 0Senior Administration Officer 8 7 1 2Senior Teacher 26 22 4 10Teacher 84 60 24 10Teaching Principal 3 3 0 0
10
Classification Group All Indigenous
Staff
Indigenous Permanent
Staff
Indigenous Temporary
Staff
Indigenous Staff on
HDATechnical 1 0 1 0Trainee and Apprentices 40 2 38 2Total 553 332 221 63
Note: The above numbers use information on all employees who identify as Indigenous. Question 5 only includes identified permanent positions.
Care must be taken when comparing this information with Q5 as this question reports the number of employees in AT positions who have identified as Indigenous in PIPS. Whereas, Q5 reports the actual number of AT positions.
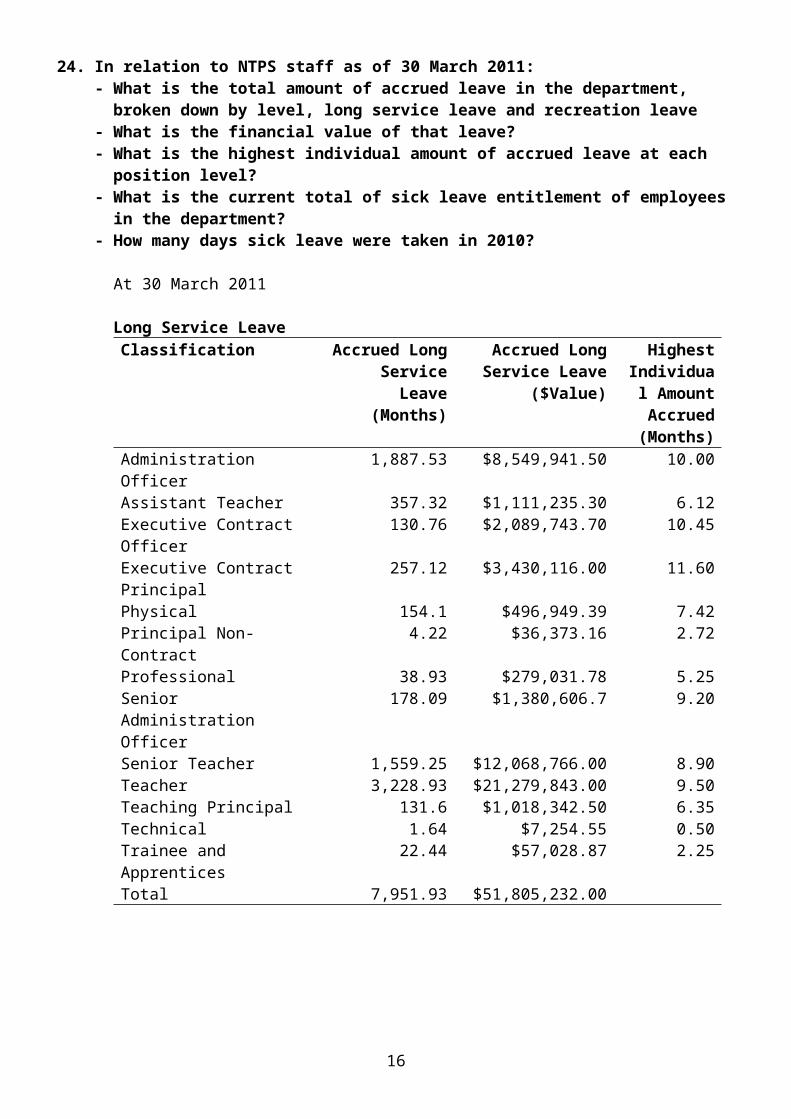
24. In relation to NTPS staff as of 30 March 2011:- What is the total amount of accrued leave in the department, broken down by
level, long service leave and recreation leave - What is the financial value of that leave?- What is the highest individual amount of accrued leave at each position level?- What is the current total of sick leave entitlement of employees in the
department?- How many days sick leave were taken in 2010?
At 30 March 2011
Long Service LeaveClassification Accrued Long
Service Leave (Months)
Accrued Long Service Leave
($Value)
Highest Individual
Amount Accrued (Months)
Administration Officer 1,887.53 $8,549,941.50 10.00Assistant Teacher 357.32 $1,111,235.30 6.12Executive Contract Officer 130.76 $2,089,743.70 10.45Executive Contract Principal
257.12 $3,430,116.00 11.60
Physical 154.1 $496,949.39 7.42Principal Non-Contract 4.22 $36,373.16 2.72Professional 38.93 $279,031.78 5.25Senior Administration Officer
178.09 $1,380,606.7 9.20
Senior Teacher 1,559.25 $12,068,766.00 8.90Teacher 3,228.93 $21,279,843.00 9.50Teaching Principal 131.6 $1,018,342.50 6.35Technical 1.64 $7,254.55 0.50Trainee and Apprentices 22.44 $57,028.87 2.25Total 7,951.93 $51,805,232.00
11

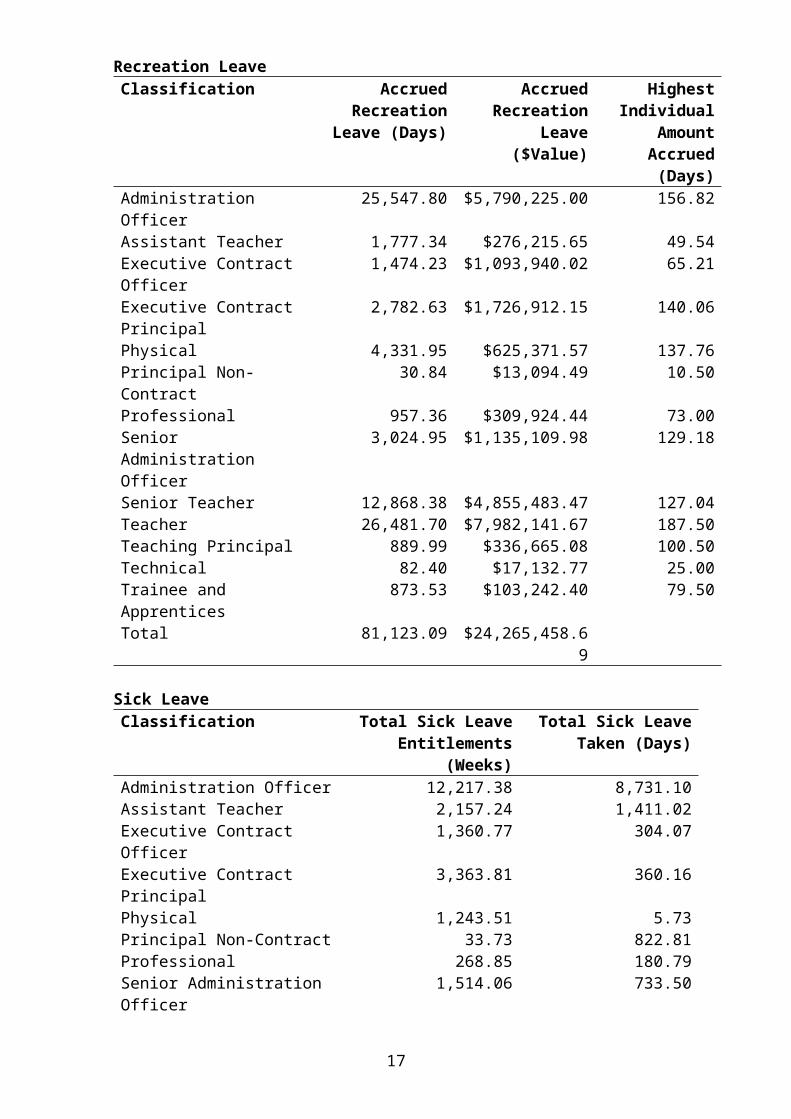
Recreation LeaveClassification Accrued
Recreation Leave (Days)
Accrued Recreation
Leave ($Value)
Highest Individual
Amount Accrued
(Days)Administration Officer 25,547.80 $5,790,225.00 156.82Assistant Teacher 1,777.34 $276,215.65 49.54Executive Contract Officer 1,474.23 $1,093,940.02 65.21Executive Contract Principal
2,782.63 $1,726,912.15 140.06
Physical 4,331.95 $625,371.57 137.76Principal Non-Contract 30.84 $13,094.49 10.50Professional 957.36 $309,924.44 73.00Senior Administration Officer
3,024.95 $1,135,109.98 129.18
Senior Teacher 12,868.38 $4,855,483.47 127.04Teacher 26,481.70 $7,982,141.67 187.50Teaching Principal 889.99 $336,665.08 100.50Technical 82.40 $17,132.77 25.00Trainee and Apprentices 873.53 $103,242.40 79.50Total 81,123.09 $24,265,458.69
Sick LeaveClassification Total Sick Leave
Entitlements (Weeks)Total Sick Leave
Taken (Days)Administration Officer 12,217.38 8,731.10Assistant Teacher 2,157.24 1,411.02Executive Contract Officer 1,360.77 304.07Executive Contract Principal 3,363.81 360.16Physical 1,243.51 5.73Principal Non-Contract 33.73 822.81Professional 268.85 180.79Senior Administration Officer 1,514.06 733.50Senior Teacher 14,708.09 4,799.39Teacher 27,022.60 12,409.67Teaching Principal 1,153.16 142.05Technical 55.20 17.00Trainee and Apprentices 113.35 107.01Total 65,211.78 30,024.30
12
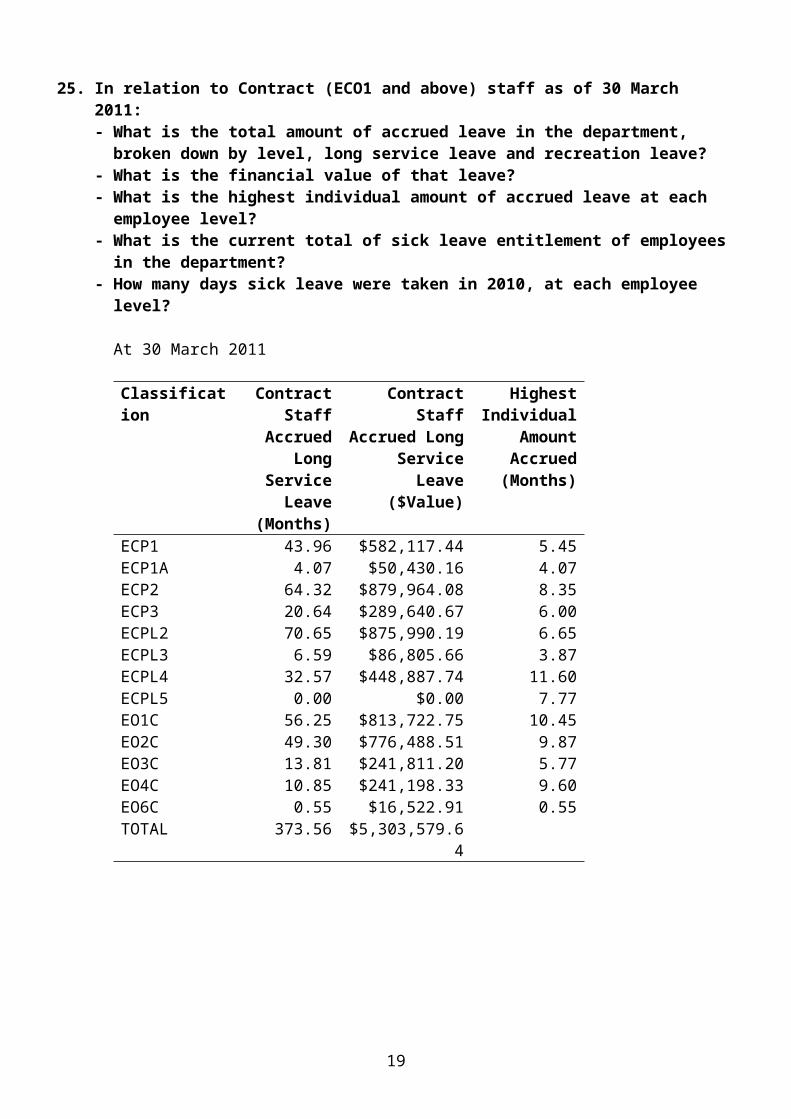
25. In relation to Contract (ECO1 and above) staff as of 30 March 2011:- What is the total amount of accrued leave in the department, broken down by
level, long service leave and recreation leave? - What is the financial value of that leave?- What is the highest individual amount of accrued leave at each employee level?- What is the current total of sick leave entitlement of employees in the
department?- How many days sick leave were taken in 2010, at each employee level?
At 30 March 2011
Classification Contract Staff
Accrued Long
Service Leave
(Months)
Contract Staff Accrued Long Service Leave
($Value)
Highest Individual
Amount Accrued (Months)
ECP1 43.96 $582,117.44 5.45ECP1A 4.07 $50,430.16 4.07ECP2 64.32 $879,964.08 8.35ECP3 20.64 $289,640.67 6.00ECPL2 70.65 $875,990.19 6.65ECPL3 6.59 $86,805.66 3.87ECPL4 32.57 $448,887.74 11.60ECPL5 0.00 $0.00 7.77EO1C 56.25 $813,722.75 10.45EO2C 49.30 $776,488.51 9.87EO3C 13.81 $241,811.20 5.77EO4C 10.85 $241,198.33 9.60EO6C 0.55 $16,522.91 0.55TOTAL 373.56 $5,303,579.64
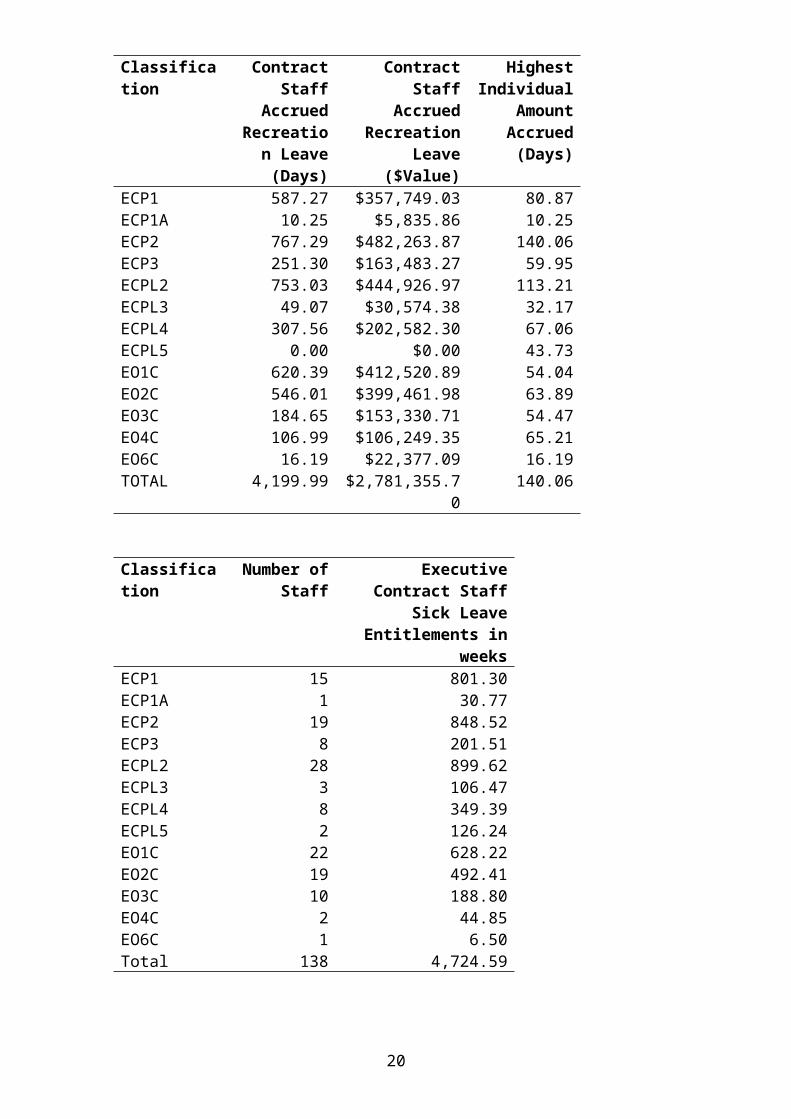
Classification
Contract Staff
Accrued Recreation
Leave (Days)
Contract Staff Accrued
Recreation Leave ($Value)
Highest Individual
Amount Accrued
(Days)
ECP1 587.27 $357,749.03 80.87ECP1A 10.25 $5,835.86 10.25ECP2 767.29 $482,263.87 140.06ECP3 251.30 $163,483.27 59.95ECPL2 753.03 $444,926.97 113.21ECPL3 49.07 $30,574.38 32.17ECPL4 307.56 $202,582.30 67.06ECPL5 0.00 $0.00 43.73EO1C 620.39 $412,520.89 54.04EO2C 546.01 $399,461.98 63.89EO3C 184.65 $153,330.71 54.47
13
Classification
Contract Staff
Accrued Recreation
Leave (Days)
Contract Staff Accrued
Recreation Leave ($Value)
Highest Individual
Amount Accrued
(Days)
EO4C 106.99 $106,249.35 65.21EO6C 16.19 $22,377.09 16.19TOTAL 4,199.99 $2,781,355.70 140.06
Classification Number of Staff
Executive Contract Staff Sick Leave Entitlements in
weeksECP1 15 801.30ECP1A 1 30.77ECP2 19 848.52ECP3 8 201.51ECPL2 28 899.62ECPL3 3 106.47ECPL4 8 349.39ECPL5 2 126.24EO1C 22 628.22EO2C 19 492.41EO3C 10 188.80EO4C 2 44.85EO6C 1 6.50Total 138 4,724.59
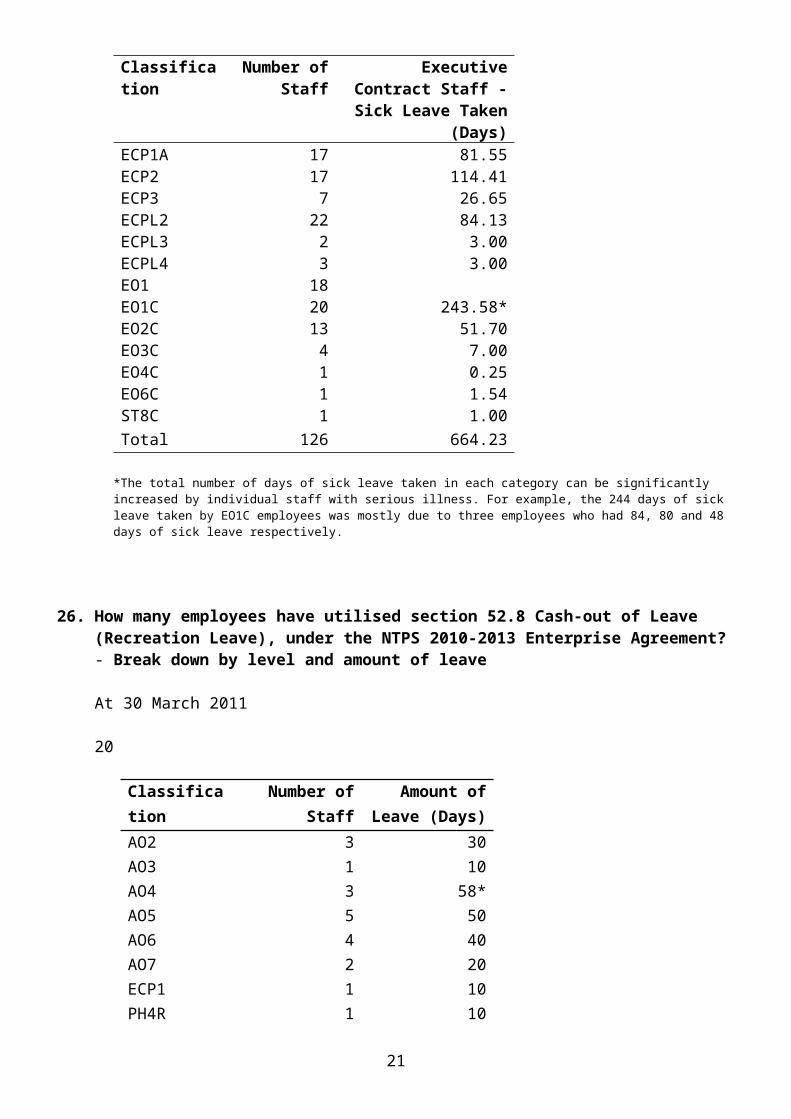
Classification Number of Staff
Executive Contract Staff - Sick Leave
Taken (Days)ECP1A 17 81.55ECP2 17 114.41ECP3 7 26.65ECPL2 22 84.13ECPL3 2 3.00ECPL4 3 3.00EO1 18EO1C 20 243.58*EO2C 13 51.70EO3C 4 7.00EO4C 1 0.25EO6C 1 1.54ST8C 1 1.00Total 126 664.23
*The total number of days of sick leave taken in each category can be significantly increased by individual staff with serious illness. For example, the 244 days of sick leave taken by EO1C employees was mostly due to three employees who had 84, 80 and 48 days of sick leave respectively.
14
26. How many employees have utilised section 52.8 Cash-out of Leave (Recreation Leave), under the NTPS 2010-2013 Enterprise Agreement?- Break down by level and amount of leave
At 30 March 2011
20
Classification
Number of Staff
Amount of Leave (Days)
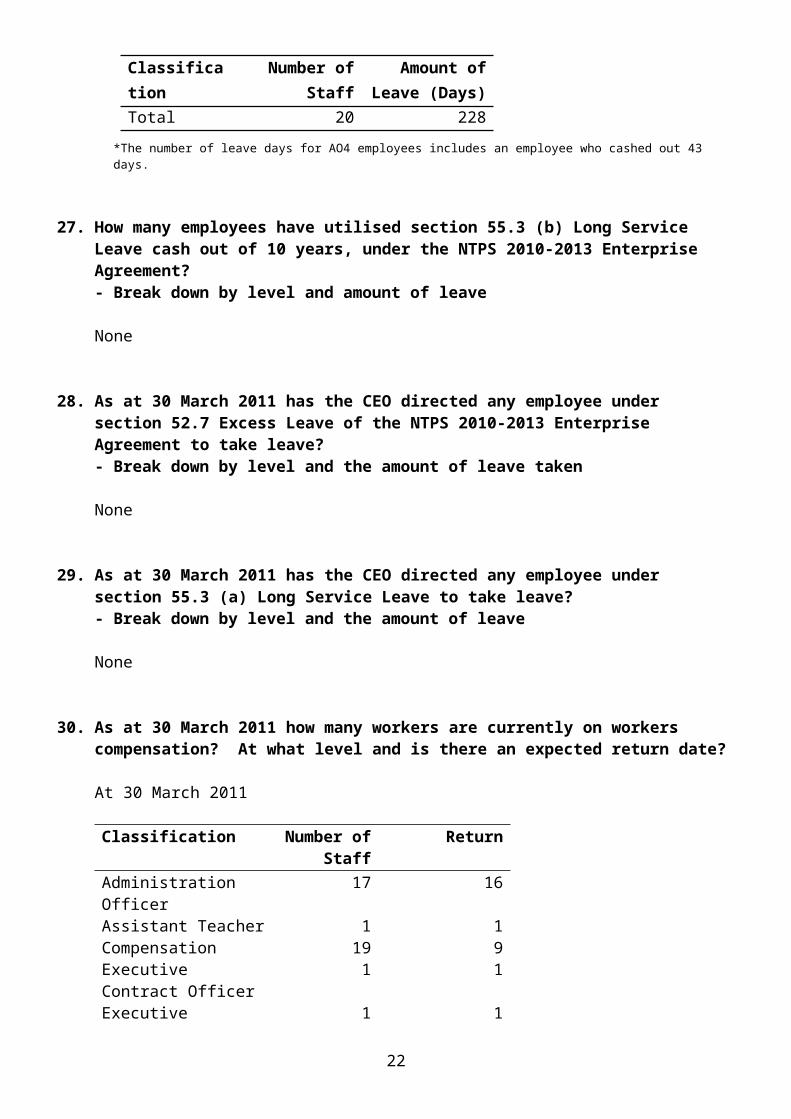
AO2 3 30AO3 1 10AO4 3 58*AO5 5 50AO6 4 40AO7 2 20ECP1 1 10PH4R 1 10Total 20 228
*The number of leave days for AO4 employees includes an employee who cashed out 43 days.
27. How many employees have utilised section 55.3 (b) Long Service Leave cash out of 10 years, under the NTPS 2010-2013 Enterprise Agreement?- Break down by level and amount of leave
None
28. As at 30 March 2011 has the CEO directed any employee under section 52.7 Excess Leave of the NTPS 2010-2013 Enterprise Agreement to take leave?- Break down by level and the amount of leave taken
None
29. As at 30 March 2011 has the CEO directed any employee under section 55.3 (a) Long Service Leave to take leave?- Break down by level and the amount of leave
None
30. As at 30 March 2011 how many workers are currently on workers compensation? At what level and is there an expected return date?
At 30 March 2011
15
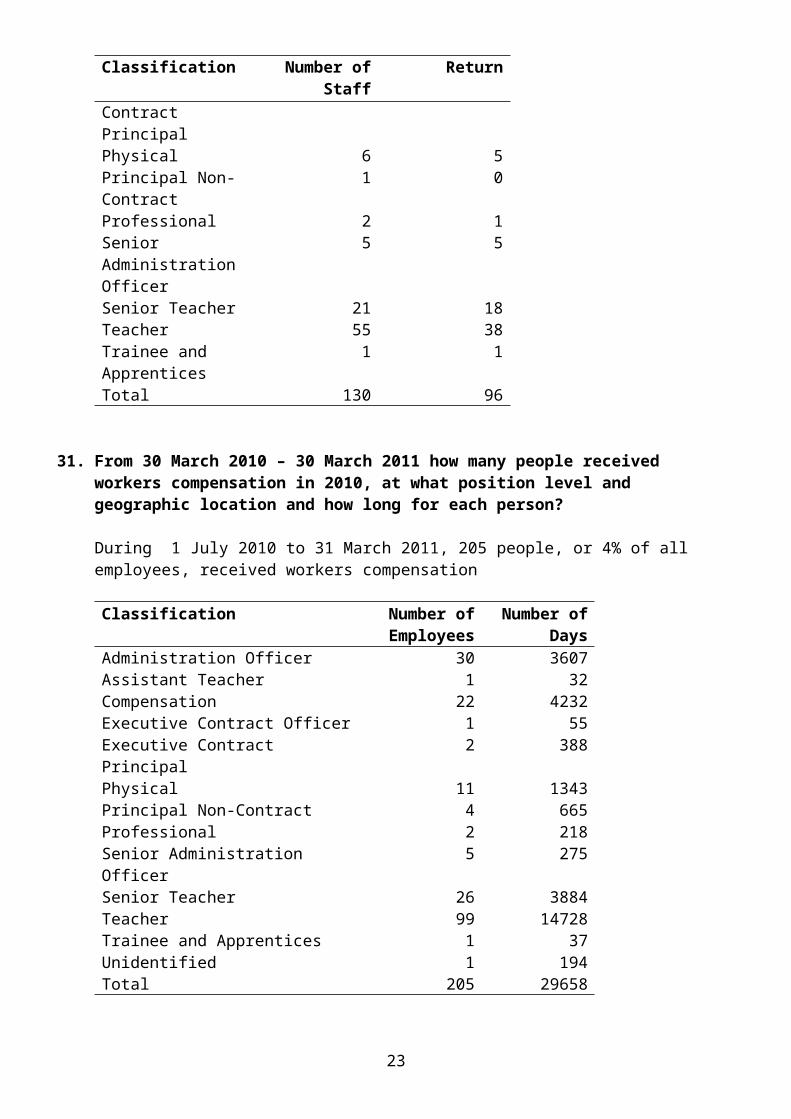
Classification Number of Staff
Return
Administration Officer 17 16Assistant Teacher 1 1Compensation 19 9Executive Contract Officer
1 1
Executive Contract Principal
1 1
Physical 6 5Principal Non-Contract 1 0Professional 2 1Senior Administration Officer
5 5
Senior Teacher 21 18Teacher 55 38Trainee and Apprentices
1 1
Total 130 96
31. From 30 March 2010 – 30 March 2011 how many people received workers compensation in 2010, at what position level and geographic location and how long for each person?
During 1 July 2010 to 31 March 2011, 205 people, or 4% of all employees, received workers compensation
Classification Number of Employees
Number of Days
Administration Officer 30 3607Assistant Teacher 1 32Compensation 22 4232Executive Contract Officer 1 55Executive Contract Principal 2 388Physical 11 1343Principal Non-Contract 4 665Professional 2 218Senior Administration Officer 5 275Senior Teacher 26 3884Teacher 99 14728Trainee and Apprentices 1 37Unidentified 1 194Total 205 29658
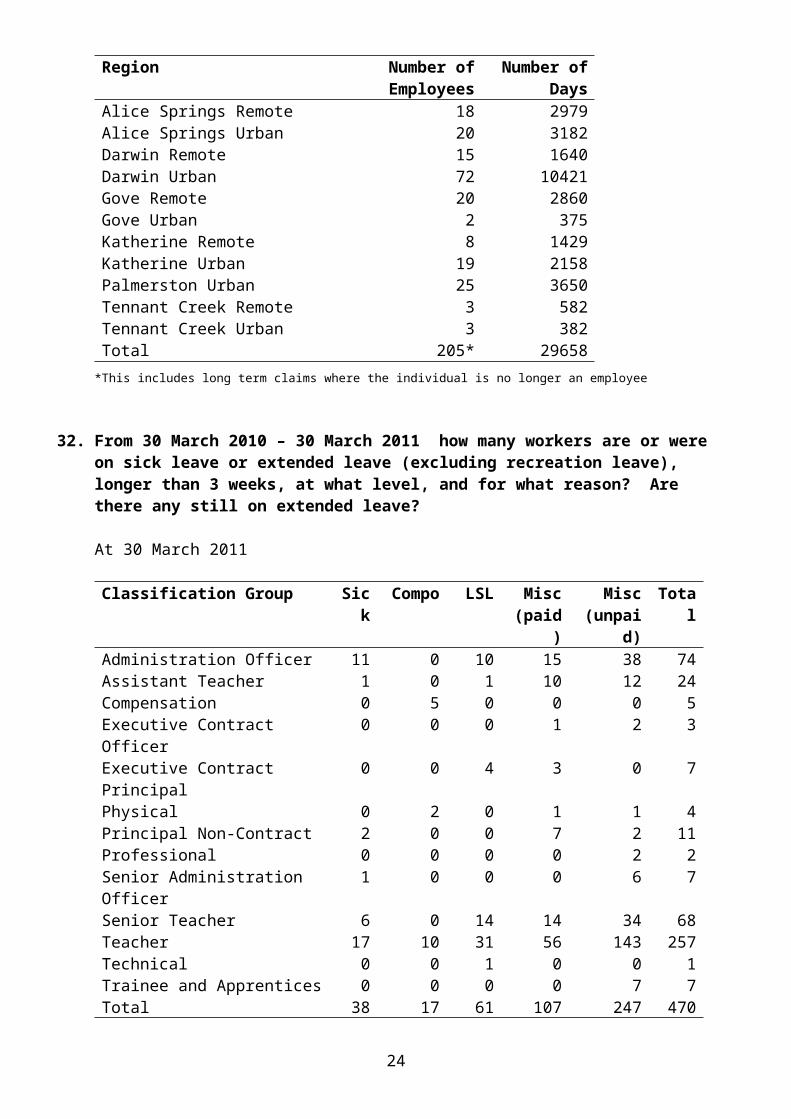
Region Number of Employees
Number of Days
Alice Springs Remote 18 2979Alice Springs Urban 20 3182Darwin Remote 15 1640Darwin Urban 72 10421Gove Remote 20 2860
16
Gove Urban 2 375Katherine Remote 8 1429Katherine Urban 19 2158Palmerston Urban 25 3650Tennant Creek Remote 3 582Tennant Creek Urban 3 382Total 205* 29658
*This includes long term claims where the individual is no longer an employee
32. From 30 March 2010 – 30 March 2011 how many workers are or were on sick leave or extended leave (excluding recreation leave), longer than 3 weeks, at what level, and for what reason? Are there any still on extended leave?
At 30 March 2011
Classification Group Sick Compo LSL Misc (paid)
Misc (unpaid)
Total
Administration Officer 11 0 10 15 38 74Assistant Teacher 1 0 1 10 12 24Compensation 0 5 0 0 0 5Executive Contract Officer 0 0 0 1 2 3Executive Contract Principal 0 0 4 3 0 7Physical 0 2 0 1 1 4Principal Non-Contract 2 0 0 7 2 11Professional 0 0 0 0 2 2Senior Administration Officer 1 0 0 0 6 7Senior Teacher 6 0 14 14 34 68Teacher 17 10 31 56 143 257Technical 0 0 1 0 0 1Trainee and Apprentices 0 0 0 0 7 7Total 38 17 61 107 247 470
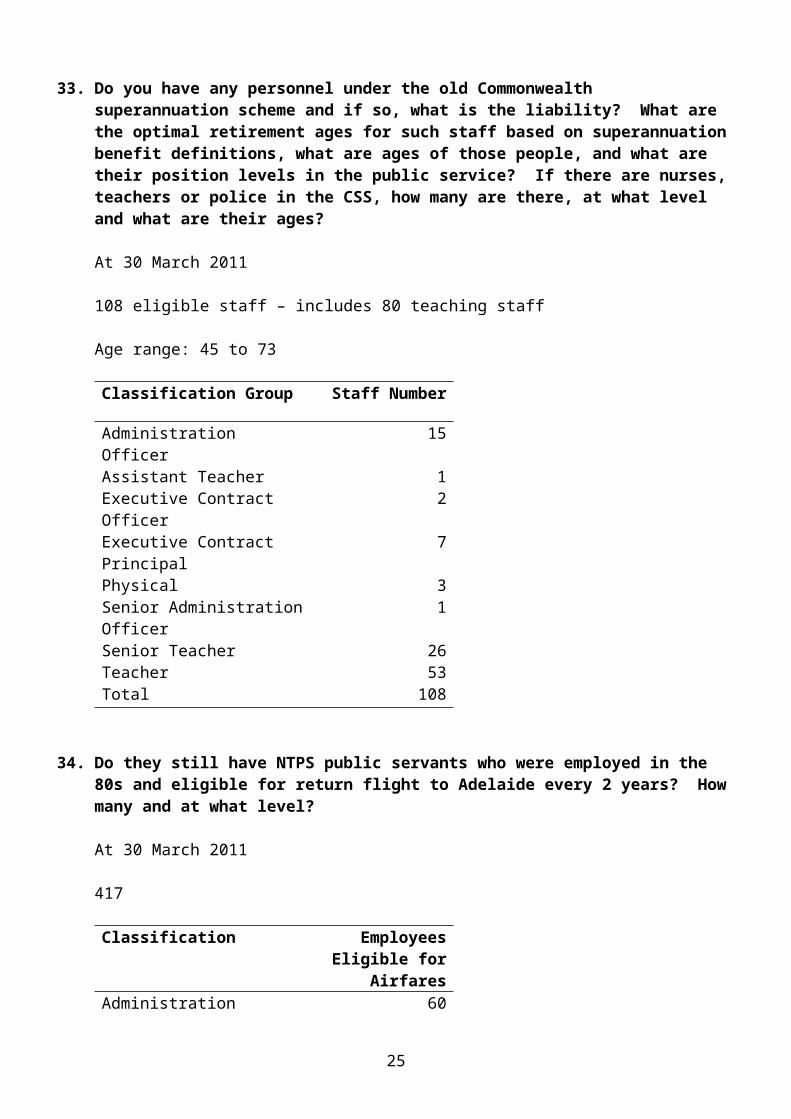
33. Do you have any personnel under the old Commonwealth superannuation scheme and if so, what is the liability? What are the optimal retirement ages for such staff based on superannuation benefit definitions, what are ages of those people, and what are their position levels in the public service? If there are nurses, teachers or police in the CSS, how many are there, at what level and what are their ages?
At 30 March 2011
108 eligible staff – includes 80 teaching staff
Age range: 45 to 73
Classification Group Staff Number
Administration Officer 15Assistant Teacher 1Executive Contract Officer 2Executive Contract Principal 7Physical 3
17

Senior Administration Officer 1Senior Teacher 26Teacher 53Total 108
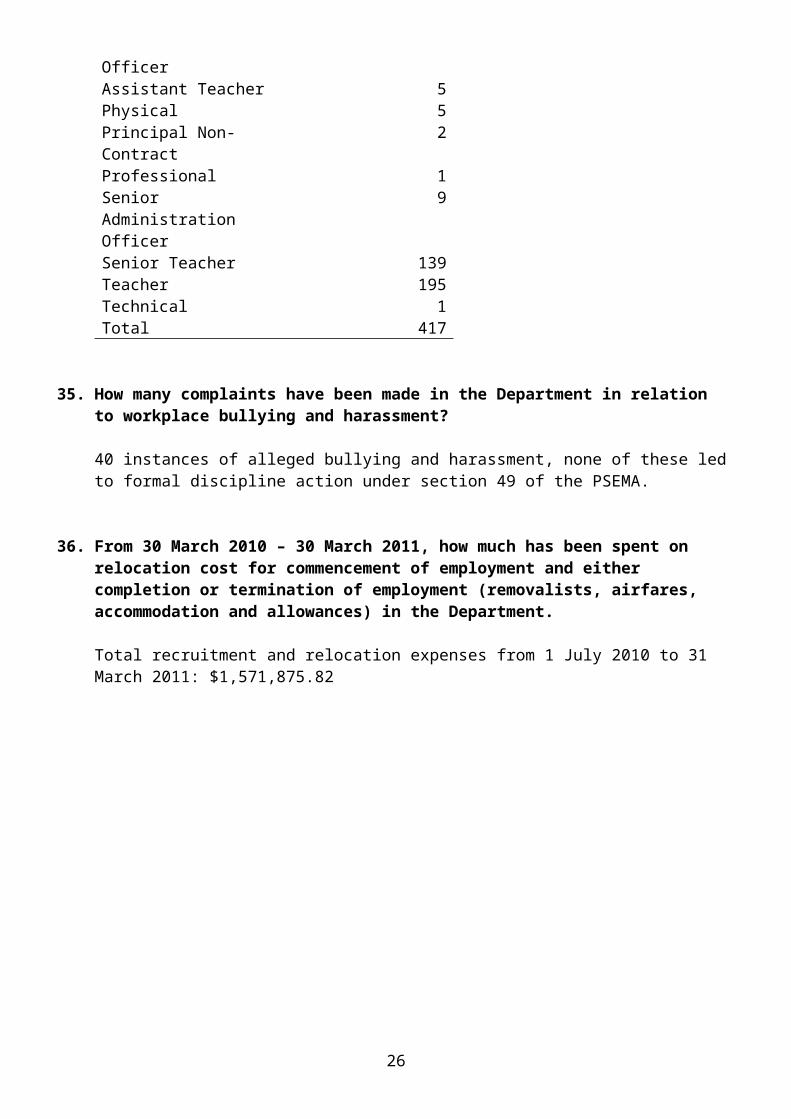
34. Do they still have NTPS public servants who were employed in the 80s and eligible for return flight to Adelaide every 2 years? How many and at what level?
At 30 March 2011
417
Classification Employees Eligible for
AirfaresAdministration Officer 60Assistant Teacher 5Physical 5Principal Non-Contract 2Professional 1Senior Administration Officer
9
Senior Teacher 139Teacher 195Technical 1Total 417
35. How many complaints have been made in the Department in relation to workplace bullying and harassment?
40 instances of alleged bullying and harassment, none of these led to formal discipline action under section 49 of the PSEMA.
36. From 30 March 2010 – 30 March 2011, how much has been spent on relocation cost for commencement of employment and either completion or termination of employment (removalists, airfares, accommodation and allowances) in the Department.
Total recruitment and relocation expenses from 1 July 2010 to 31 March 2011: $1,571,875.82
18
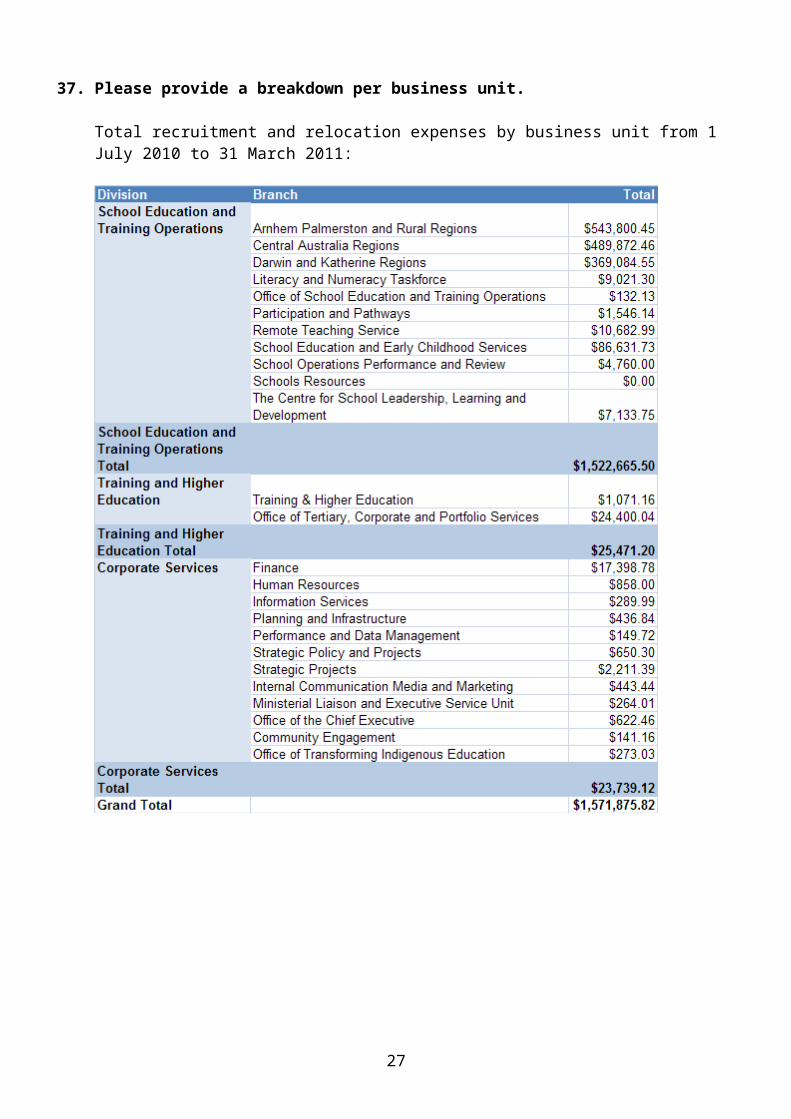
37. Please provide a breakdown per business unit.
Total recruitment and relocation expenses by business unit from 1 July 2010 to 31 March 2011:
19
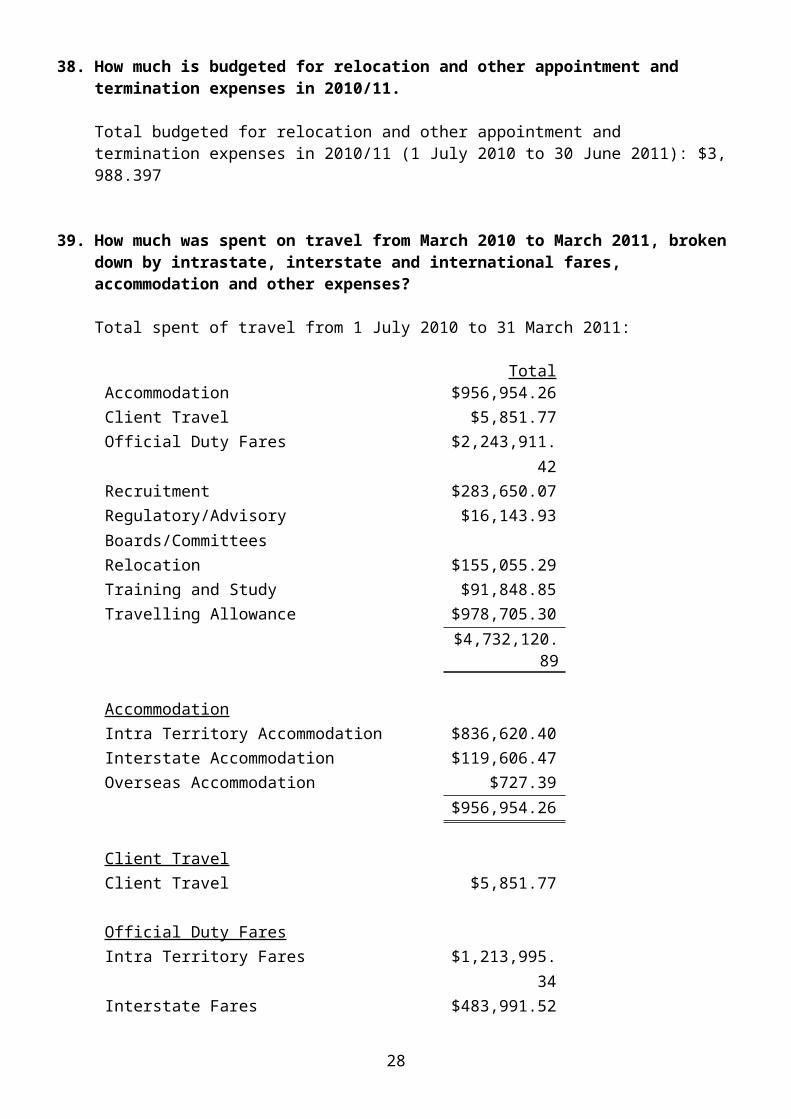
38. How much is budgeted for relocation and other appointment and termination expenses in 2010/11.
Total budgeted for relocation and other appointment and termination expenses in 2010/11 (1 July 2010 to 30 June 2011): $3, 988.397
39. How much was spent on travel from March 2010 to March 2011, broken down by intrastate, interstate and international fares, accommodation and other expenses?
Total spent of travel from 1 July 2010 to 31 March 2011:
TotalAccommodation $956,954.26Client Travel $5,851.77Official Duty Fares $2,243,911.42Recruitment $283,650.07Regulatory/Advisory Boards/Committees $16,143.93Relocation $155,055.29Training and Study $91,848.85Travelling Allowance $978,705.30
$4,732,120.89
AccommodationIntra Territory Accommodation $836,620.40Interstate Accommodation $119,606.47Overseas Accommodation $727.39
$956,954.26
Client TravelClient Travel $5,851.77
Official Duty FaresIntra Territory Fares $1,213,995.34Interstate Fares $483,991.52Overseas Fares $10,368.13Medical Fares $7,308.75Air Bus And Boat Charter $526,079.56Allow For Use Of Employee's MV $2,168.12
$2,243,911.42
RecruitmentRecruitment Fares $271,531.16Intra Territory Accommodation $9,896.55Interstate Accommodation $2,222.36
$283,650.07
20
Regulatory/Advisory Boards/CommitteesAir fares $12,447.27Accommodation $3,696.66
$16,143.93
RelocationIntra Territory Accommodation $3,519.07Interstate Accommodation $116.36Relocation Fares $151,419.86
$155,055.29
Training and StudyAccommodation $66,569.87Fares $25,278.98
$91,848.85
Travelling AllowanceIntra Territory Travelling Allowance $887,671.68Interstate Travelling Allowance $90,361.02Overseas Travelling Allowance $672.60
$978,705.30
40. How much was spent on vehicles by the Department from March 2010 to March 2011?
Expenditure on vehicles from 1 July 2010 to 31 March 2011: $5,308,733.54.
41. How many vehicles does the Department have responsibility for?
362
42. What is the change, if any, in the vehicle numbers from 2009?
Increase of 31 vehicles.
43. What proportion of those vehicles meet the emission standard of 5.5 out of 10 under the Commonwealth Government’s Green Vehicle Guide?
The NTG Greening the Fleet Strategy applies a green rating of 5.5 out of 10 to passenger vehicles – 88% of the department’s passenger fleet vehicles meets this target.
44. How many vehicles are home garaged?
228
21
45. What position levels have vehicles attached or are allowed to home garage?
Positions that have vehicle allocations attached: Executive Contract Officers – ECO1 and above; Executive Contract Principals – ECP1 and above.
Non-Contract Principals and Non-Contract Officers may be allocated a vehicle at the discretion of the Chief Executive.
Home garaging of official vehicles may be granted at the discretion of the Chief Executive or Delegate for: Officers relieving Executive Contract Officers or Non-Contract Executive Officers who
have a vehicle allocation; Officers who have approved departmental activities that are undertaken regularly
outside normal working hours; Officers who undertake houseparent duties in a departmental student resident
facility; Officers who are senior departmental representatives in a community/town outside of
major urban centers; or Where there is no secure departmental parking available for pool vehicles.
46. How many credit cards have been issued to department staff?
65
47. How many repayment transactions (and the value) for personal items and services are outstanding?
None
48. How many reports of the improper use of Information Technology have been made?
Time period: 1 July 2010 to 31 March 2011
4
49. How many reports resulted in formal disciplinary action?
Time period: 1 July 2010 to 31 March 2011
None
22
50. How many staff are considered ‘Essential’ in your Agency, for the purposes of an Emergency eg: Cyclone
200 staff
- Break down by level
While each event differs in the number of essential personnel required, DET has identified the following as the minimum current identified personnel and levels:
153 school principals/teaching principals, 7 executive schools, 10 emergency management committee, 20 corporate staff and 10 various.
Marketing:
51. How much was spent by the Department in 2010 on advertising and marketing programs (and up to 1 April 2011).
Total expenditure on Advertising and Marketing Programs between 1 July 2010 and 31 March 2011 was $565,702
52. What was each of those programs and what was the cost of each of those programs?
An overview of the major campaigns and their expenses from 1 July 2010 and 31 March 2011 is indicated below:
Teacher and Principal Recruitment - $200k for the recruitment of suitably qualified teachers and principals for urban and remote Territory schools (including the Remote Teaching Service campaign).
Every Child Every Day Campaign - $26k to continue to inform parents of their responsibility and raise awareness of compulsory school attendance across the NT.
Smart Schools Awards - $77k to celebrate and recognise the achievements of government schools. Note: the marketing component of this figure is $18k, the rest of the figure relates to administration expenses.
World Teachers Day - $13k to celebrate teachers and acknowledge recipients of Teacher Excellence Awards.
NT Training Awards - $27k to recognise excellence in apprentices, employers and training providers in the Northern Territory.
Careers Expo - $5k to promote various career options available to Territory students and the wider community.
Electronic Student Profiles Campaign - $6k to promote the new ESP system and build awareness of the benefits for parents, students and teachers.
Classmate - $69k NT News educational and topical stories which promote literacy and computing skills in the classroom.
23
Show Circuit (2010) - A Smart Territory - $149k display at regional shows throughout the Territory.
Families as First Teachers - $8,900 supporting families to assist their child’s learning in the early years.
Insurance:
53. How much was spent on insurance expenses in 2010, further broken down by worker and employee insurances, physical plant and equipment insurances and other insurances?
Total insurance expenses from 1 July to 31 March 2011:
General Insurance $4,770Personal Accident Insurance * $15,787Public Liability Insurance * $36,028Workers Compensation Insurance * $669,918
$726,503
* The Treasurer has granted standing approval for the department to obtain commercial insurance on behalf of school councils for their employees and volunteers covering Workers’ Compensation, Public Liability, and Personal Accident for voluntary workers.
54. What areas of the department are self-insured? What areas are commercially insured? If there are areas that are commercially insured, who provides this insurance, when is it due for renewal and what is the cost of this insurance provision and does it attract any thresholds under which insurance is not provided or any payments on item replacement?
In accordance with the Treasurer’s Direction, the Department is covered by self-insurance provisions, with the following exceptions:
Officers Travelling Overseas; Contractors and Consultants acting on behalf of the agency.
The need for commercial insurance in respect of these risks is considered on a case by case basis in accordance with the provisions of the Treasurer's Direction.
The Treasurer has granted standing approval for the department to obtain commercial insurance on behalf of school councils for their employees and volunteers covering Workers’ Compensation, Public Liability, and Personal Accident for voluntary workers.
There is a 7 day excess on the Personal Accident for voluntary workers.
This insurance will expire 30 June 2011 and is provided by TIO. The cost of premiums for 2010/11 is estimated to be $925 000.
55. What provision has been made for disaster or major catastrophe insurance?
24
The department operates within the Treasurer’s Directions which provide:
“As a general principle, an Agency subject to the Financial Management Act as prescribed in the Administrative Arrangements Order will self-insure its risks and meet costs as they emerge, unless a net benefit can be demonstrated to warrant the purchase of commercial insurance cover.”
Climate Change:
56. How many tonnes of CO2 did the department emit in 2010?
Total 2009-10 DET CO2 35,932 tonnes
57. What programs and strategies were introduced to reduce CO2 emissions across the department in 2010?
DET Strategic Plan and Policy.
The Energy Smart Schools Program was a key initiative in reducing DET’s energy consumption to meet the NTG Energy Smart Buildings Policy of a 10% reduction in energy intensity by all agencies by 2010-11. It targeted 60 schools and provided technical, educational and motivational advice to help develop and implement energy management plans.
$1.8 million of funding from the Government Energy Efficiency Program will be invested in 2011-12 across 44 NT schools.
$1.4 million of Commonwealth Government funding will be invested in 2011/12 as part of the National Solar Schools Program for the installation of rooftop solar photovoltaic systems across 36 schools.
$3.5 million of Building the Education Revolution funding committed to solar photovoltaic installations across 14 schools in 2011.
The Schools Environmental Tracking System is an online web-tool that allows all government schools to measure their energy savings and the corresponding reduction in greenhouse gas emissions.
A Green Schools Portal is being developed with schools (via Sharepoint) for schools to support a school-based sustainability network for sharing skills and knowledge.
An annual Student Sustainability Summit is being supported by DET to help inform, inspire and motivate both students and teachers through the sharing of sustainability programs, skills and knowledge between themselves and experts.
58. Has a target for departmental CO2 emissions been set for the coming financial year? - If yes, what % reduction is that from 2010
25
- If no, why has a target not been set
In line with NTG Energy Smart Building energy intensity targets, for 2010-11 DET have a target of 10% energy efficiency improvements based on the 2004-05 baseline.
In 2011-12 there is a large volume of new buildings coming into operation in NT schools as a result of the infrastructure investment through the Building the Education Revolution program. This includes many air-conditioned facilities such as classrooms and libraries. The major challenge for DET is to mitigate the impact by maintaining emissions intensity, which DET is aiming to do by offsetting impending increases through the efficiency measures currently being planned and undertaken.
From 2012, DET will be moving towards the NTG 2020 target of one-third improvement in energy efficiency based on 2004 baseline through ongoing commitment to and strengthening of the strategic programs for energy management.
Utilities:
59. What was the cost of power and water to the department in 2010?
Cost of power, water and sewerage for 2010 (1 July 2010 to 31 March 2011) = $870 245.16**Does not include essential services grants to schools
60. What is the projected cost for power and water to the department in 2011?
Projected cost of power, water and sewerage for 2011 (1 July 2010 to 31 March 2011) = $910 627.00
Public Events:
61. List the public events/conferences/forums that were sponsored by the department from 1 January 2010 to 1 April 2011 and what are projected for 2011/12?
Unable to report on programs that aren’t coordinated by the department as sponsorship funding is released as grants.
DET coordinated events from 1 July 2010 to 31 Mar 2011 included: Careers Expo NT Training Awards Government School Leaders’ Conference NT Board of Studies Awards Exit Art World Skills Battle of the School Bands Try a Trade Education Week Smart Schools Awards World Teachers Day Youth Business Awards
26
Future Jobs Forum
62. What is the level of sponsorship provided in terms of financial support or in kind support?
Total sponsorship expenses from 1 July to 31 March 2011:
$587,948
Advertising:
63. What is the department’s budget for advertising for the 10/11 reporting year?
$2,449,914*
* Figure includes relocation expenses. Refer to question 51 for the expenditure relevant for recruitment advertising.
64. How much is year to date expenditure? Please breakdown into newspaper, radio and TV?
The year to date expenditure (1 July 2010 to 31 March 2011) for advertising: $545,952.
Newspaper Advertising $ 270,158Radio Advertising $ 32,565Television Advertising $ 5,761Other (Magazine and Online) $ 23,345Recruitment Advertising $ 214 123
65. What advertising campaigns have been undertaken or will be undertaken by the department in 2010/11?
Every Child Every Day Campaign – to inform parents of their responsibility and raise awareness of compulsory school attendance across the NT.
Teacher Recruitment Campaign – to raise awareness of teaching opportunities and the recruitment of suitably qualified teachers for urban and remote Territory schools.
NT Training Awards – to recognise excellence in apprentices, employers and training providers in the Northern Territory.
Careers Expo – to promote various career options available to Territory students and the wider community.
World Teachers Day – to celebrate teachers, launch awards and acknowledge recipients of Teacher Awards.
School Matters (formerly Classmate) – NT News educational and topical stories which promote literacy and computing skills in the classroom.
Families and First Teachers – supporting families to assist their child’s learning in the early years.
Smart Schools Award – launch of awards celebrating and recognising the achievements of government schools.
Remote Teaching Service – to recruit, develop and recognise quality teachers to work in our most challenging remote indigenous schools.
27
66. In 2010 how many consultancies were let in the year, at what cost, how many were NT firms and how many interstate and what was the value of those intra-territory and those interstate?
There were no consultancies for advertising
28