Embed Size (px)
Citation preview

Page
D530 User’s Guide to Mergent
Fall 2010
Created by Kate MooreAssistant Librarian at the IUS Library
812-941-2489 (Reference Desk)

Page
Getting started:
1) From the library’s homepage (www.ius.edu/library), click on “Article & Database Search.”

Page
2) From the alphabetical listing, click on “M.”

Page
3) Under “M,” scroll down to find Mergent Online.4) Click on it. (If you’re off-campus, you’ll be asked to enter in your IUS username and password before accessing the site.)

Page
5) From the main search screen, enter either your company’s ticker symbol or your company’s name in the Search Box. Mergent will automatically narrow your search as you type.
6) Click on your company as it appears in the drop down menu to select it.

Page
This will take you to a general overview of your company.

Page
Finding Annual Income Statements and Balance Sheets:
1) Choose the Company Financials tab.2) Click on “Standardized.”

Page
The default financial information is the company’s Balance Sheet.
To view other financial information:
1) Click on the drop down menu and select the financials wanted.2) Modify the years as needed (Mergent shows financial information in increments of 3 years, 5 years, 7 years, 10 years, 15 years, and all available
years).3) Hit refresh.4) You can then download the report into Excel.

Page
To find the definition of an item, hover over the item’s question mark to the right .

Page
Finding Ratios:
1) In the Company Financials tab, click on “Ratios.” 2) Modify the years as needed. 3) Hit refresh.
(Finding the definition of the ratio is also available by hovering over the item’s question mark .)

Page
Comparing Companies:
To compare a company with others with the same NAIC code:
1) Click on the Report Builder Tab.2) Click on “Comparison Reports.”3) Make sure “Compare Company Against Industry” is highlighted.

Page
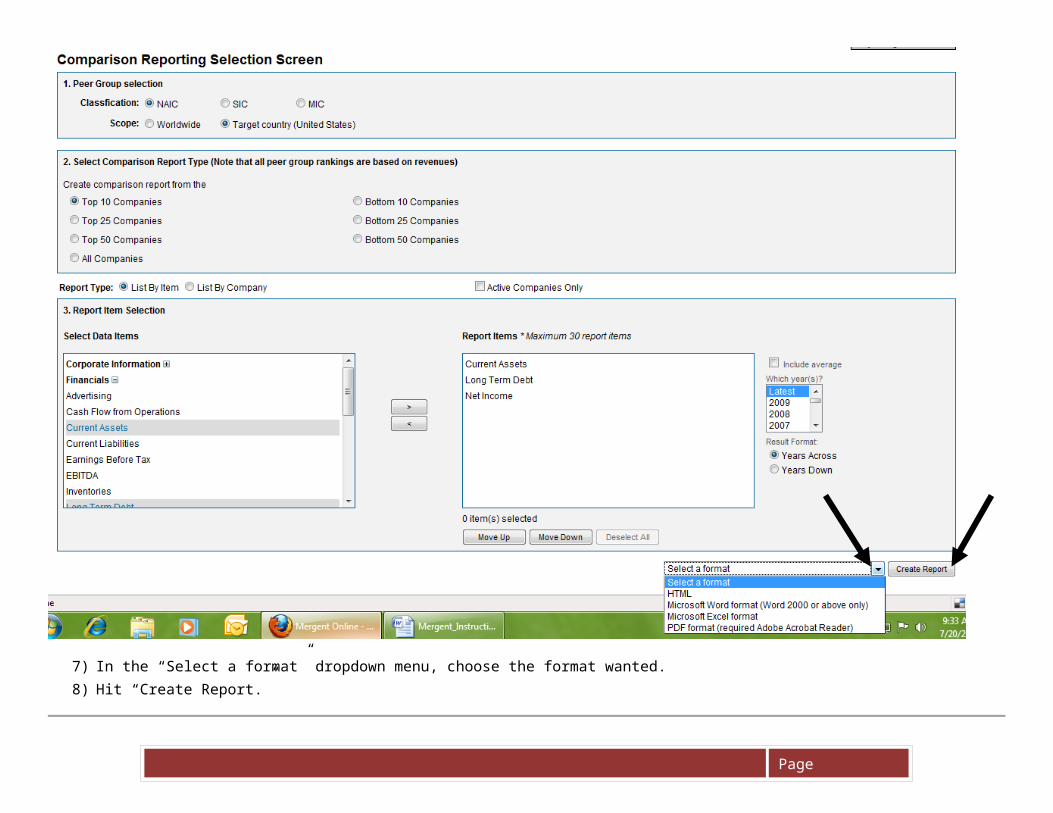
1) Determine the scope of the comparison (worldwide or U.S. only)2) Choose from the Comparison Report Type the number of companies to include in your report (10, 25, 50, or All) 3) Click on the plus signs ( ) in the “Select Data Items” menu to view the information available for comparison (Corporate Information, Financials, and
Ratios).
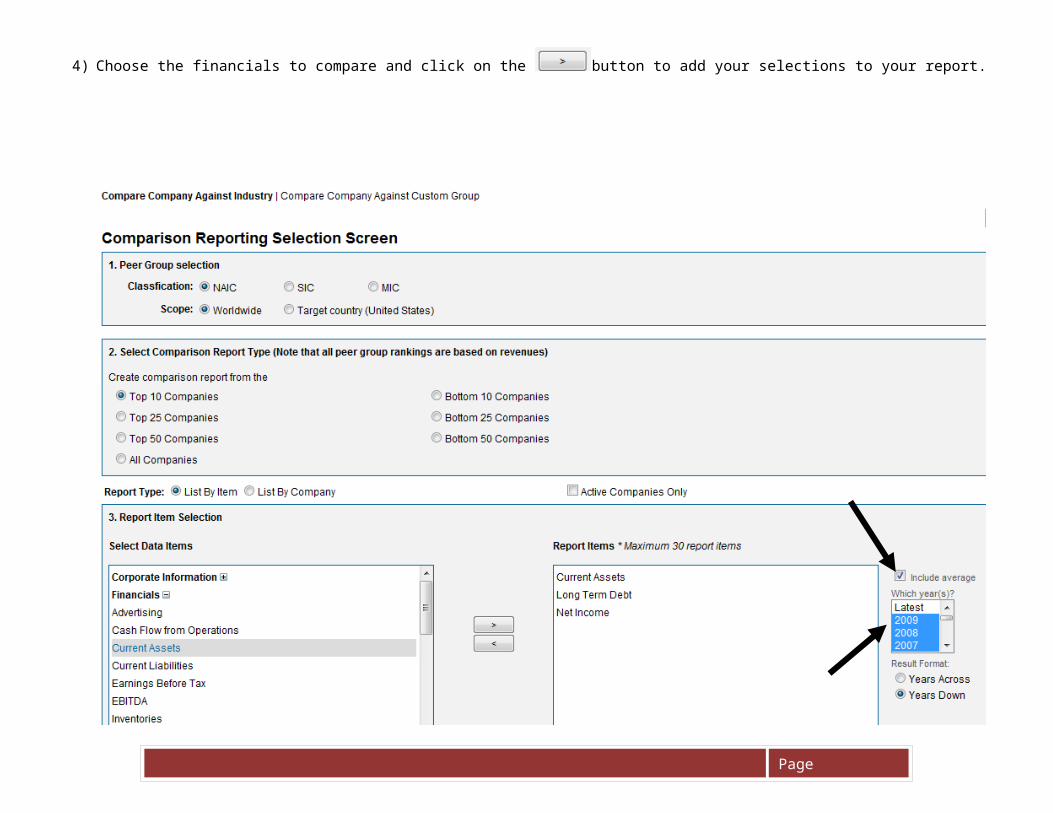
4) Choose the financials to compare and click on the button to add your selections to your report.

Page
5) Under Report Items, check the “Include average” box so that your report includes the peer average of the group of companies selected.6) To choose certain years to display, hold down on the control button and select the years wanted (the default is set to “Latest”).
Page
7) In the “Select a format” dropdown menu, choose the format wanted.8) Hit “Create Report.”
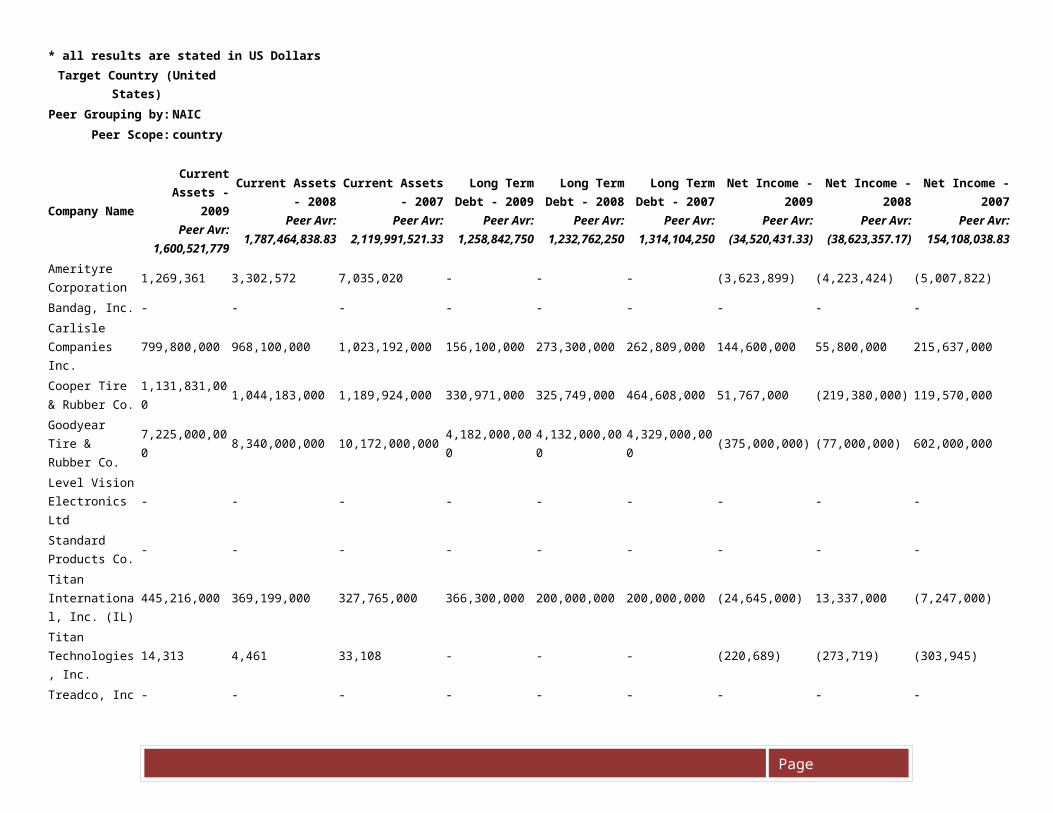
* all results are stated in US Dollars

Page
Target Country (United States)Peer Grouping by: NAIC
Peer Scope: country
Company Name
Current Assets - 2009
Peer Avr: 1,600,521,779
Current Assets - 2008
Peer Avr: 1,787,464,838.83
Current Assets - 2007
Peer Avr: 2,119,991,521.33
Long Term Debt - 2009
Peer Avr: 1,258,842,750
Long Term Debt - 2008
Peer Avr: 1,232,762,250
Long Term Debt - 2007
Peer Avr: 1,314,104,250
Net Income - 2009
Peer Avr: (34,520,431.33)
Net Income - 2008
Peer Avr: (38,623,357.17)
Net Income - 2007
Peer Avr: 154,108,038.83
Amerityre Corporation
1,269,361 3,302,572 7,035,020 - - - (3,623,899) (4,223,424) (5,007,822)
Bandag, Inc. - - - - - - - - -Carlisle Companies Inc.
799,800,000 968,100,000 1,023,192,000 156,100,000 273,300,000 262,809,000 144,600,000 55,800,000 215,637,000
Cooper Tire & Rubber Co.
1,131,831,000 1,044,183,000 1,189,924,000 330,971,000 325,749,000 464,608,000 51,767,000 (219,380,000) 119,570,000
Goodyear Tire & Rubber Co.
7,225,000,000 8,340,000,000 10,172,000,000 4,182,000,000 4,132,000,000 4,329,000,000 (375,000,000) (77,000,000) 602,000,000
Level Vision Electronics Ltd
- - - - - - - - -
Standard Products Co.
- - - - - - - - -
Titan International, Inc. (IL)
445,216,000 369,199,000 327,765,000 366,300,000 200,000,000 200,000,000 (24,645,000) 13,337,000 (7,247,000)
Titan Technologies, Inc.
14,313 4,461 33,108 - - - (220,689) (273,719) (303,945)
Treadco, Inc - - - - - - - - -
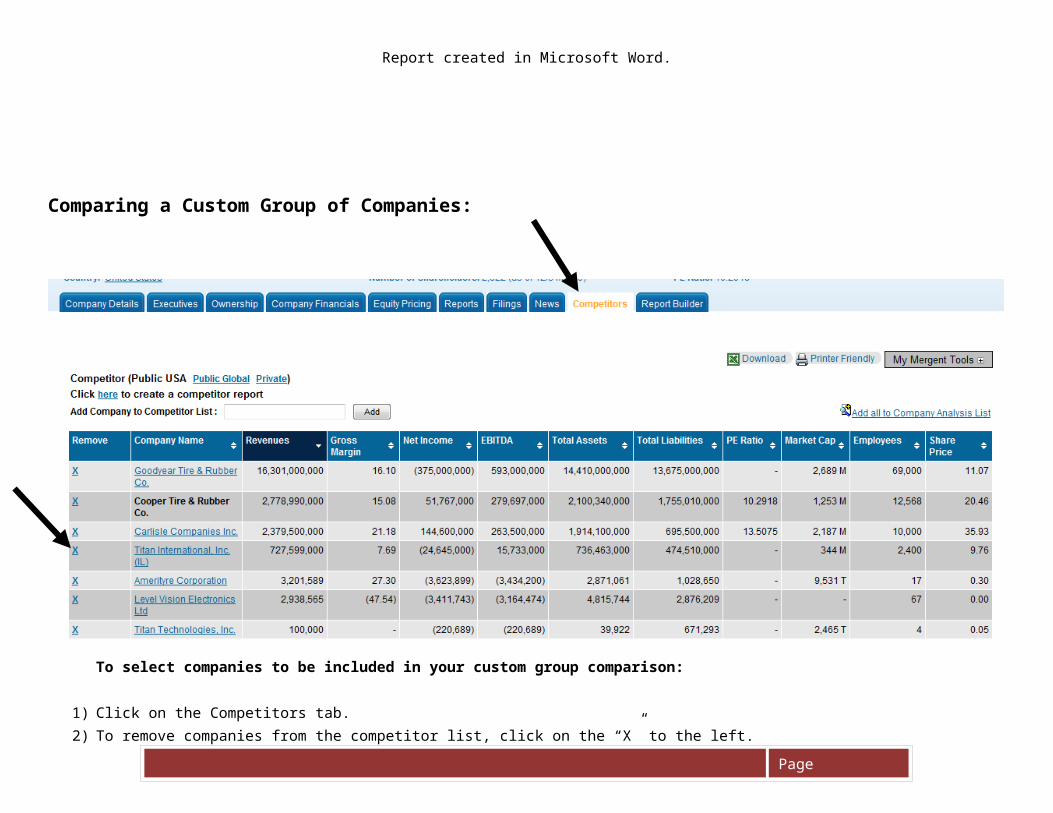
Report created in Microsoft Word.
Comparing a Custom Group of Companies:
Page
To select companies to be included in your custom group comparison:
1) Click on the Competitors tab.2) To remove companies from the competitor list, click on the “X” to the left.
Page
3) To add a company, enter either the company’s ticker symbol or the company’s name in the search box. Mergent will automatically narrow your search as you type.
4) Click on your company in the drop down menu to select it.5) Click “Add.”6) Once you have all the companies to compare in your Competitors list, click on “Add all to Company Analysis List.”
Page
7) To create the custom report, click on the Report Builder Tab. (You should see all of the companies you selected listed in the “Company Listing” area.)8) Click on “Comparison Reports.”9) Click on “Compare Company Against Custom Group.”

Page
10) Choose the companies you want to compare in your report and click on the button to add individual selections to your report.
--Or-- Click on the button to add all of the companies in the list to your report.
11) Click on the plus signs ( ) in the “Select Data Items” menu to view the financial items available for comparison.
12) Choose the financials to compare and click on the button to add your selections to your report.

Page
13) Check the “Include average” box so that your report includes the peer average of the group of companies selected.14) To choose certain years to display, hold the control button and select the years wanted (the default is set to “Latest”).
15) In the “Select a format” dropdown menu, choose the format wanted.
16) Hit “Create Report.”

Page
* all results are stated in US Dollars
Company Name
Current Ratio -
2009Peer
Avr: 2.07
Current Ratio -
2008Peer
Avr: 1.8
Current Ratio -
2007Peer
Avr: 2.35
Long-term Debt/Equity -
2009
Long-term Debt/Equity -
2008
Long-term Debt/Equity -
2007
ROA %
(Net) - 2009Peer Avr: 2.41
ROA % (Net) -
2008Peer Avr:
(2.61)
ROA %
(Net) - 2007Peer Avr: 6.65
ROE % (Net) -
2009Peer Avr:
(4.66)
ROE % (Net) -
2008Peer Avr:
(13.07)
ROE %
(Net) - 2007Peer Avr:
31.72
ROI % (Operating) -
2009Peer Avr:
9.93
ROI % (Operating) -
2008Peer Avr:
2.04
ROI % (Operating) -
2007Peer Avr:
14.41
Carlisle Companies Inc.
2.66 2.19 2.64 - - - 7.25 2.74 11.15 12.5 5.03 20.92 12.54 16.64 19.92
Cooper Tire & Rubber Co.
1.78 1.48 2.23 - - - 2.5 (10.08) 5.28 16.19 (40.28) 16.7 17.35 (18.82) 10.3
Goodyear Tire & Rubber Co.
1.76 1.75 2.18 - - - (2.53) (0.47) 3.52 (42.69) (3.97) 57.55 (0.11) 8.3 13.01
Report created in Microsoft Word.