Embed Size (px)
Citation preview
CONTENT
Industry overview 2016................................................... 0
Industry structure ............................................................ 1
Competitive electricity market and electricity price
mechanism ...................................................................... 4
Industry performance 2016 ............................................. 6
Long-term outlook ........................................................ 13
Major companies ........................................................... 15
1. SHP ..................................................................... 16
2. NT2 ..................................................................... 17
3. PPC ...................................................................... 18
Appendix....................................................................... 19
Analyst
Duc Dam
+84 98 545 1394
VCBS Research Portal
www.vcbs.com.vn/vn/Services/AnalysisResearch
VCBS Bloomberg Page: <VCBS> <Go>
`
VIETNAM POWER INDUSTRY 2016
December 16, 2016
VCBS Research and Analysis Page | 0
INDUSTRY OVERVIEW 2016
The power industry in Vietnam has a total installed capacity of 38,676 MW as of
October 2016. According to Vietnam Electricity (EVN), power output in Vietnam
increased at 10.84% CAGR in the period from 2011 to 2015. In 2015, power output
reached 143.7 billion kWh. In the first 10 months of 2016, total power output
reached 132.6 billion kWh, 11.34% higher than total power output in the same
period in 2015. EVN’s total power output forecast for Vietnam in 2016 is 159.1
billion kWh, 10.72% higher than total power output in 2015.
There are three main types of power plant in Vietnam: hydropower, coal-fired
thermal, and gas thermal. In terms of installed capacity, as of October 2016, total
installed capacity of hydropower plants is 17,022 MW, coal-fired plants’ is 12,705
MW and gas thermal plants’ is 7,684 MW. Oil-fired thermal plants’ capacity is 1,154
MW while total capacity of other power plant types such as wind and biomass power
is negligible at around 109 MW. Since hydropower plants can only operate at full
capacity during rainy seasons, total installed capacity does not fully reflect the power
output from each group. For example, according to EVN, in the first 10 months of
2016, hydropower accounted for 35.45% of the industry’s total power output, coal-
fired power accounted for 37.05%, and gas thermal power accounted for 26.04%.
In 9M.2016, hydrological conditions have major changes, affecting hydropower
segment’s earnings. El Nino has ended in May 2016 and no longer caused adverse
impacts on hydrological conditions in Vietnam. In addition, La Nina, which has
opposite conditions to those seen in El Nino, is confirmed to start in October 2016.
Current statistics predict a mild La Nina that will end around February 2017.
Natural gas prices began to increase slowly in 2016 after falling sharply in 2015,
negatively affecting earnings of gas thermal plants in the second half of 2016.
Meanwhile, international thermal coal prices in China and Australia have
skyrocketed since June 2016. While Vietnam’s domestic thermal coal prices did not
change significantly in 9M.2016, in November 2016, VinaCoMin has announced a
price increase for some of its coal classes. The rising trend of domestic thermal coal
prices will negatively affect earnings from electricity sales in Vietnam competitive
generation market of coal-fired thermal power companies.
VCBS Research and Analysis Page | 1
VIETNAM POWER INDUSTRY 2016
INDUSTRY STRUCTURE
1. Types of power plant
Power plants in Vietnam mainly fall into one of the following three types: hydropower, coal-fired
power, and gas thermal power.
Regarding installed capacity, hydropower has the largest capacity (17,022 MW), followed by coal-fired
power (12,705 MW) and gas thermal power (7,684 MW).
Regarding power output, coal-fired power has the highest power output in 10M.2016 (54.7 billion kWh
- 37.1% of total industry power output), followed by hydropower (52.4 billion kWh - 35.5% of total
power output) and gas thermal power (38.5 billion kWh - 26% of total power output).
Power output from each type of plant is not entirely proportional to its capacity since hydropower only
operates at full capacity in rainy seasons, resulting in its lower power output compared with thermal
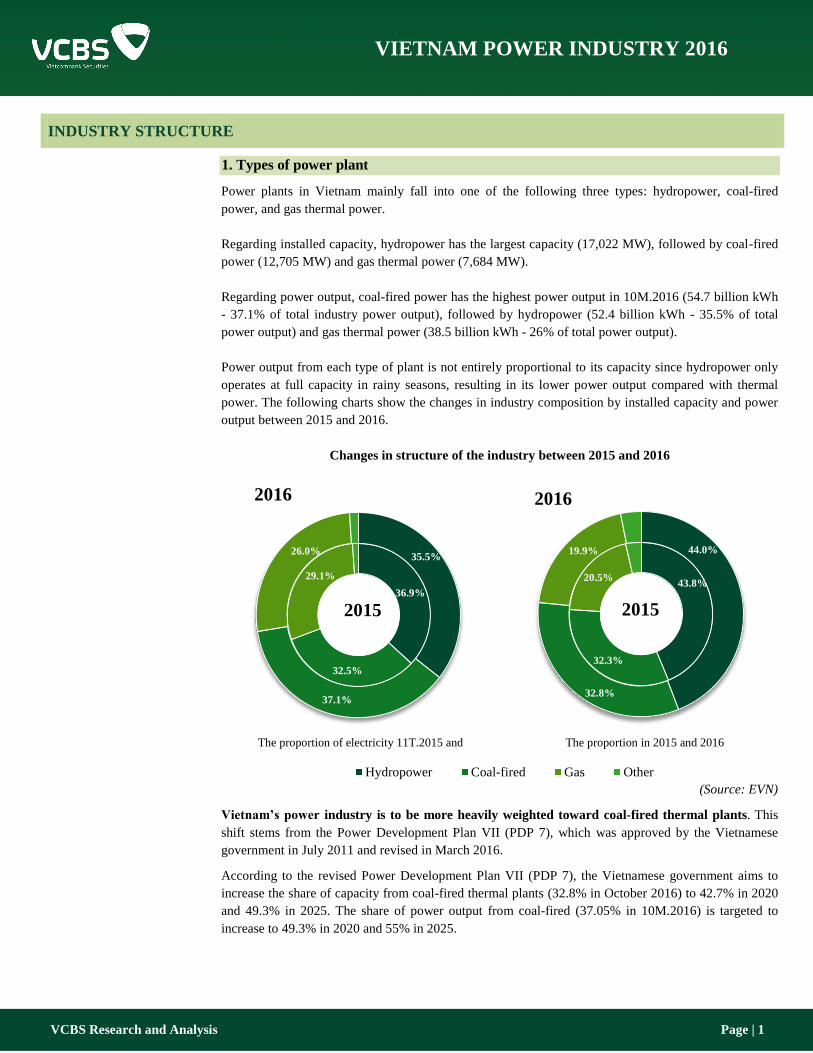
power. The following charts show the changes in industry composition by installed capacity and power
output between 2015 and 2016.
Changes in structure of the industry between 2015 and 2016
(Source: EVN)
Vietnam’s power industry is to be more heavily weighted toward coal-fired thermal plants. This
shift stems from the Power Development Plan VII (PDP 7), which was approved by the Vietnamese
government in July 2011 and revised in March 2016.
According to the revised Power Development Plan VII (PDP 7), the Vietnamese government aims to
increase the share of capacity from coal-fired thermal plants (32.8% in October 2016) to 42.7% in 2020
and 49.3% in 2025. The share of power output from coal-fired (37.05% in 10M.2016) is targeted to
increase to 49.3% in 2020 and 55% in 2025.
43.8%
32.3%
20.5%
44.0%
32.8%
19.9%
Hydropower Coal-fired Gas Other
2015
2016
36.9%
32.5%
29.1%
35.5%
37.1%
26.0%
2015
2016
The proportion of electricity 11T.2015 and
10T.2016
The proportion in 2015 and 2016
capacity
VCBS Research and Analysis Page | 2
VIETNAM POWER INDUSTRY 2016
The main reason behind this emphasis on coal-fired plants is that utilization of the river system in
Vietnam for hydropower is already close to its maximum level. Also, a drawback of hydropower
plants is that their operations are heavily influenced by weather conditions, leading to an imbalance in
power supply throughout the year with excess electricity during the rainy season and power shortage in
the dry season. Meanwhile, coal-fired power’s production costs are relatively low (only higher than
hydropower’s). As a result, the industry shifts toward building more coal-fired plants to catch up with
the double-digit growth of the economy’s power demand.
Specific details on the objectives of the revised PDP 7 are summarized in Appendix 1.
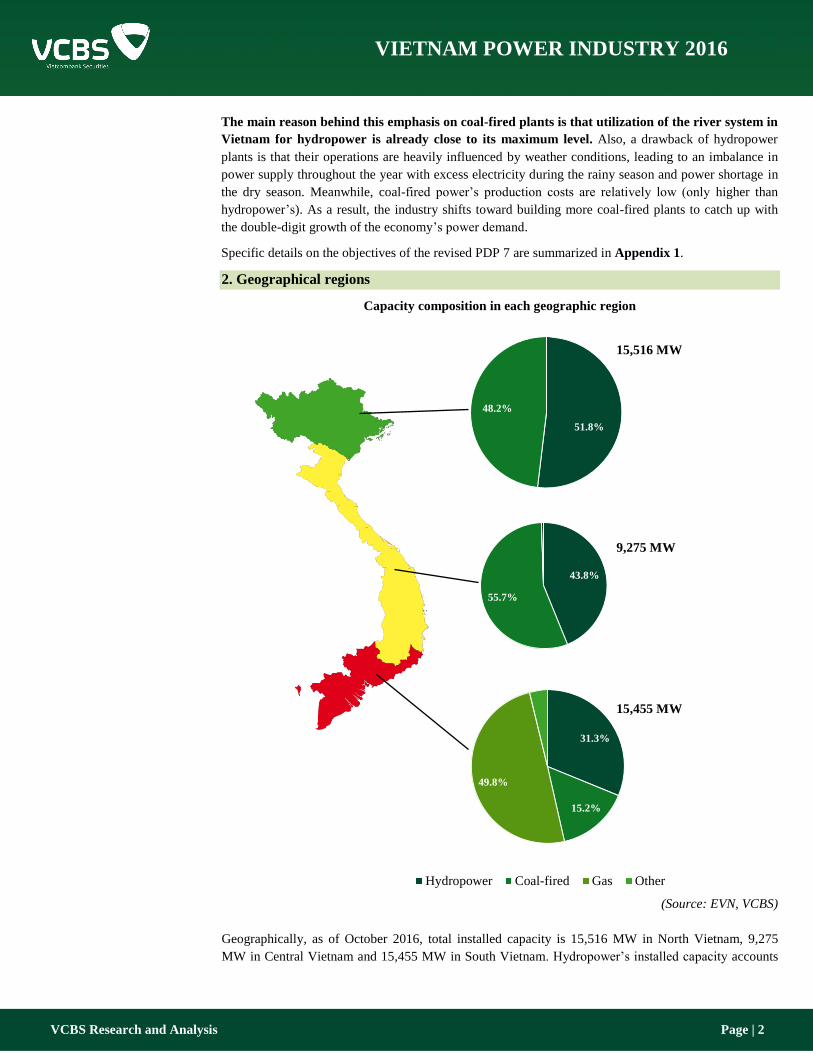
2. Geographical regions
Capacity composition in each geographic region
(Source: EVN, VCBS)
Geographically, as of October 2016, total installed capacity is 15,516 MW in North Vietnam, 9,275
MW in Central Vietnam and 15,455 MW in South Vietnam. Hydropower’s installed capacity accounts
31.3%
15.2%
49.8%
Hydropower Coal-fired Gas Other
51.8%
48.2%
43.8%
55.7%
9,275 MW
15,455 MW
15,516 MW
VCBS Research and Analysis Page | 3
VIETNAM POWER INDUSTRY 2016
for a large share in all three regions. Coal-fired capacity accounts for about 50% of total capacity in the
North and Central and 15% in the South. Meanwhile, gas thermal plants are only located in the South
due to proximities to gas fields in the South China Sea. Gas thermal power accounts for the largest share
of installed capacity in the South at approximately 50%.
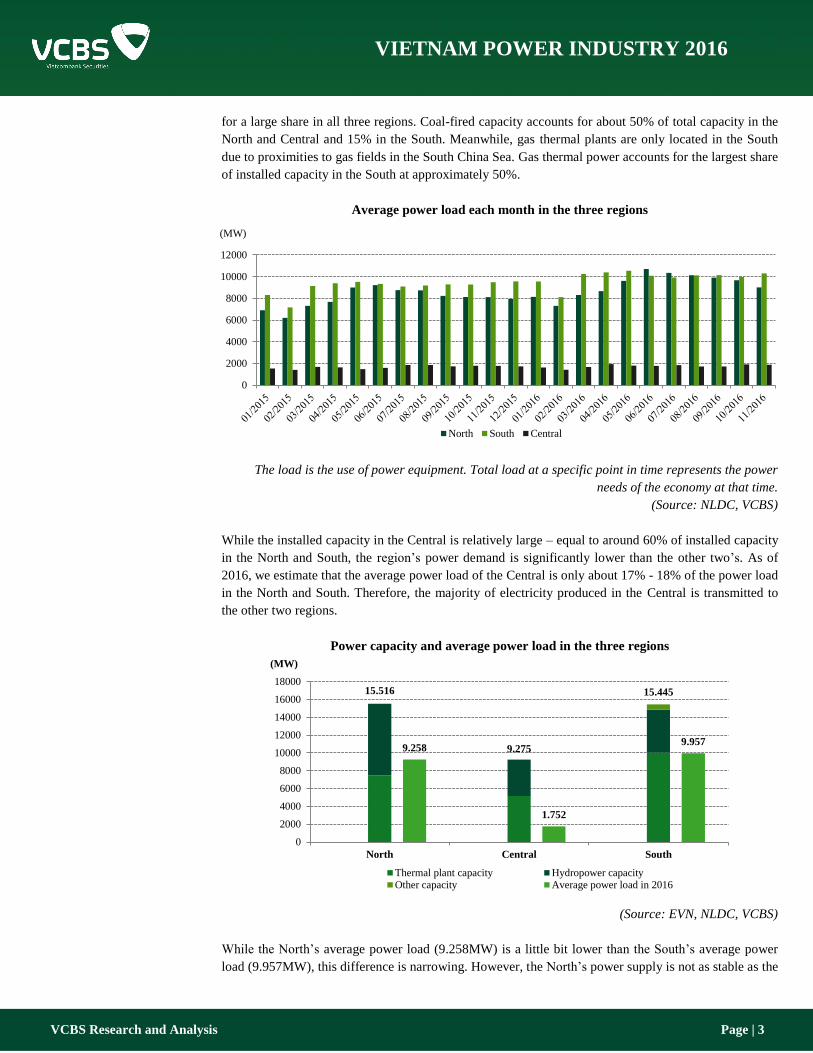
Average power load each month in the three regions
The load is the use of power equipment. Total load at a specific point in time represents the power
needs of the economy at that time.
(Source: NLDC, VCBS)
While the installed capacity in the Central is relatively large – equal to around 60% of installed capacity
in the North and South, the region’s power demand is significantly lower than the other two’s. As of
2016, we estimate that the average power load of the Central is only about 17% - 18% of the power load
in the North and South. Therefore, the majority of electricity produced in the Central is transmitted to
the other two regions.
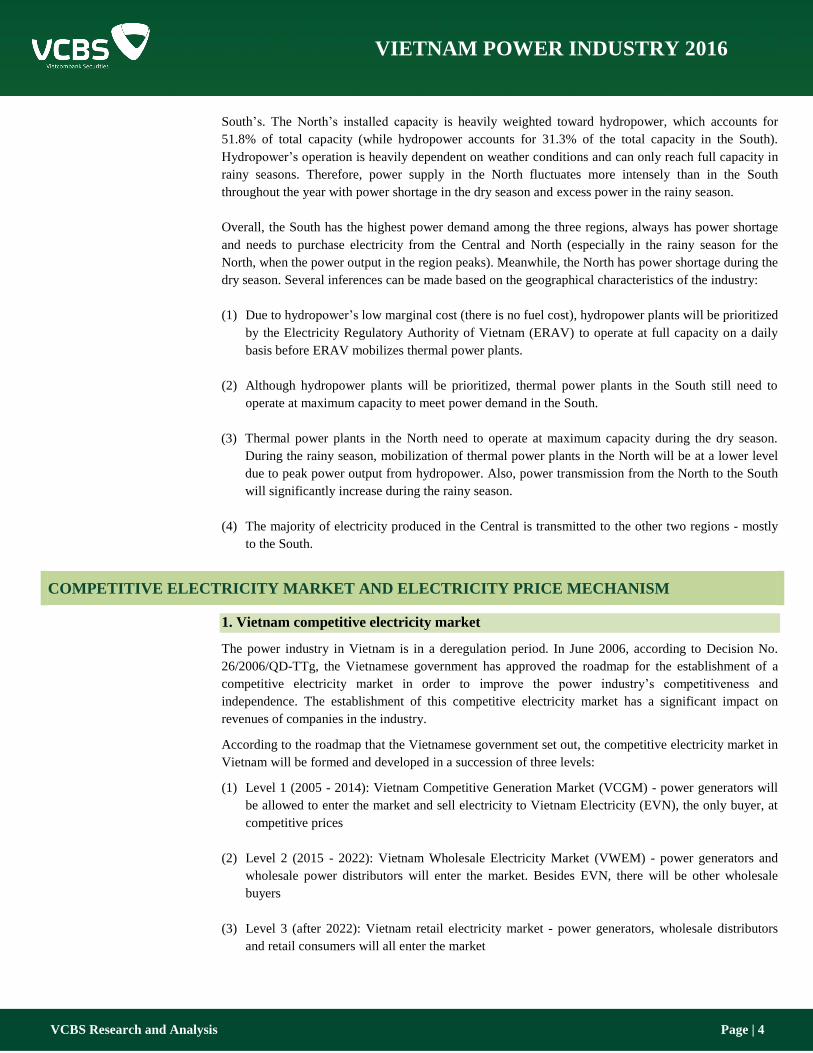
Power capacity and average power load in the three regions
(Source: EVN, NLDC, VCBS)
While the North’s average power load (9.258MW) is a little bit lower than the South’s average power
load (9.957MW), this difference is narrowing. However, the North’s power supply is not as stable as the
0
2000
4000
6000
8000
10000
12000
(MW)
North South Central
15.516
9.275
15.445
9.258
1.752
9.957
0
2000
4000
6000
8000
10000
12000
14000
16000
18000
North Central South
(MW)
Thermal plant capacity Hydropower capacityOther capacity Average power load in 2016
VCBS Research and Analysis Page | 4
VIETNAM POWER INDUSTRY 2016
South’s. The North’s installed capacity is heavily weighted toward hydropower, which accounts for
51.8% of total capacity (while hydropower accounts for 31.3% of the total capacity in the South).
Hydropower’s operation is heavily dependent on weather conditions and can only reach full capacity in
rainy seasons. Therefore, power supply in the North fluctuates more intensely than in the South
throughout the year with power shortage in the dry season and excess power in the rainy season.
Overall, the South has the highest power demand among the three regions, always has power shortage
and needs to purchase electricity from the Central and North (especially in the rainy season for the
North, when the power output in the region peaks). Meanwhile, the North has power shortage during the
dry season. Several inferences can be made based on the geographical characteristics of the industry:
(1) Due to hydropower’s low marginal cost (there is no fuel cost), hydropower plants will be prioritized
by the Electricity Regulatory Authority of Vietnam (ERAV) to operate at full capacity on a daily
basis before ERAV mobilizes thermal power plants.
(2) Although hydropower plants will be prioritized, thermal power plants in the South still need to
operate at maximum capacity to meet power demand in the South.
(3) Thermal power plants in the North need to operate at maximum capacity during the dry season.
During the rainy season, mobilization of thermal power plants in the North will be at a lower level
due to peak power output from hydropower. Also, power transmission from the North to the South
will significantly increase during the rainy season.
(4) The majority of electricity produced in the Central is transmitted to the other two regions - mostly
to the South.
COMPETITIVE ELECTRICITY MARKET AND ELECTRICITY PRICE MECHANISM
1. Vietnam competitive electricity market
The power industry in Vietnam is in a deregulation period. In June 2006, according to Decision No.
26/2006/QD-TTg, the Vietnamese government has approved the roadmap for the establishment of a
competitive electricity market in order to improve the power industry’s competitiveness and
independence. The establishment of this competitive electricity market has a significant impact on
revenues of companies in the industry.
According to the roadmap that the Vietnamese government set out, the competitive electricity market in
Vietnam will be formed and developed in a succession of three levels:
(1) Level 1 (2005 - 2014): Vietnam Competitive Generation Market (VCGM) - power generators will
be allowed to enter the market and sell electricity to Vietnam Electricity (EVN), the only buyer, at
competitive prices
(2) Level 2 (2015 - 2022): Vietnam Wholesale Electricity Market (VWEM) - power generators and
wholesale power distributors will enter the market. Besides EVN, there will be other wholesale
buyers
(3) Level 3 (after 2022): Vietnam retail electricity market - power generators, wholesale distributors
and retail consumers will all enter the market
VCBS Research and Analysis Page | 5
VIETNAM POWER INDUSTRY 2016
By the end of 2016, Vietnam competitive electricity market is still at Level 1, behind the schedule set
out by the Vietnamese government. Nevertheless, the Vietnamese government is committed to get the
market development progress back on track and plans to move the market to Level 2 in 2017. According
to Decision No. 8266/QD-BCT by the Ministry of Industry and Trade in August 2015, a trial of VWEM
(Level 2) will be launched in 2017 - 2018 and the market will officially operate in 2019.
2. Electricity price mechanism
Generally, power plants only sell small parts of their power output in the competitive market, while a
majority of the power output is sold to EVN through contracts at specific prices. In Appendix 2, we
summarize the key points about the contract prices with EVN, the electricity prices in the competitive
market as well as the impact of the electricity price mechanism on revenues of companies.
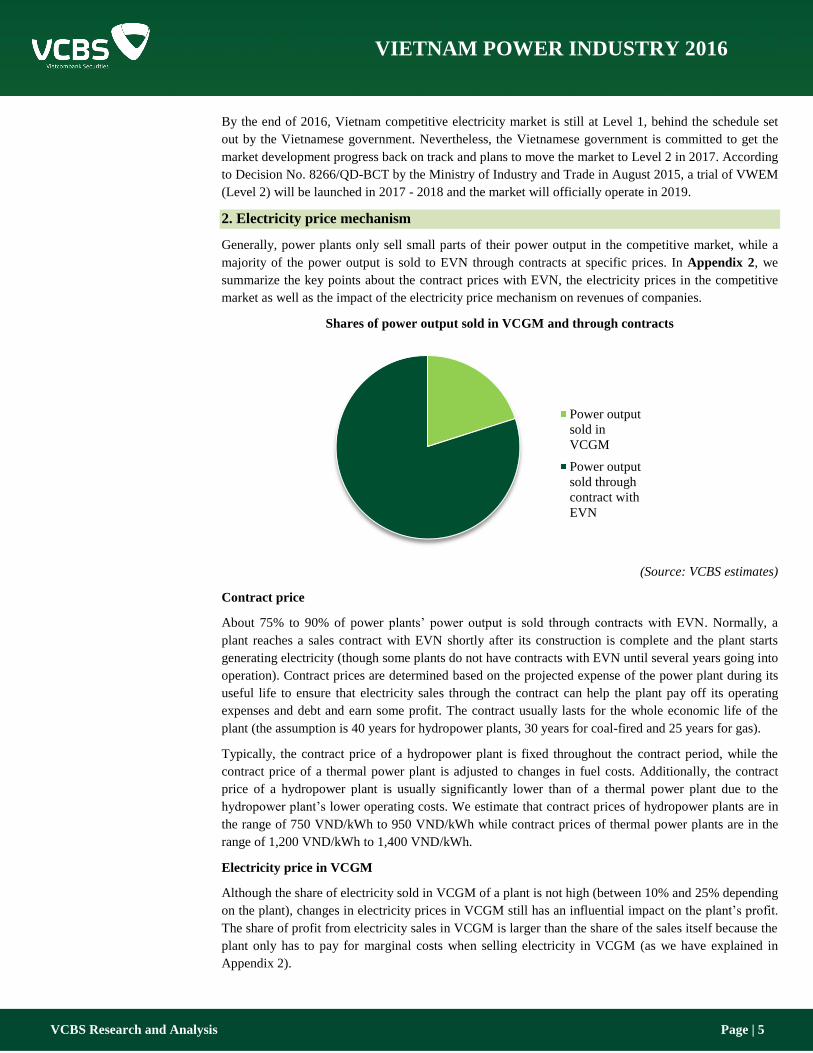
Shares of power output sold in VCGM and through contracts
(Source: VCBS estimates)
Contract price
About 75% to 90% of power plants’ power output is sold through contracts with EVN. Normally, a
plant reaches a sales contract with EVN shortly after its construction is complete and the plant starts
generating electricity (though some plants do not have contracts with EVN until several years going into
operation). Contract prices are determined based on the projected expense of the power plant during its
useful life to ensure that electricity sales through the contract can help the plant pay off its operating
expenses and debt and earn some profit. The contract usually lasts for the whole economic life of the
plant (the assumption is 40 years for hydropower plants, 30 years for coal-fired and 25 years for gas).
Typically, the contract price of a hydropower plant is fixed throughout the contract period, while the
contract price of a thermal power plant is adjusted to changes in fuel costs. Additionally, the contract
price of a hydropower plant is usually significantly lower than of a thermal power plant due to the
hydropower plant’s lower operating costs. We estimate that contract prices of hydropower plants are in
the range of 750 VND/kWh to 950 VND/kWh while contract prices of thermal power plants are in the
range of 1,200 VND/kWh to 1,400 VND/kWh.
Electricity price in VCGM
Although the share of electricity sold in VCGM of a plant is not high (between 10% and 25% depending
on the plant), changes in electricity prices in VCGM still has an influential impact on the plant’s profit.
The share of profit from electricity sales in VCGM is larger than the share of the sales itself because the
plant only has to pay for marginal costs when selling electricity in VCGM (as we have explained in
Appendix 2).
Power output
sold in
VCGM
Power output
sold through
contract with
EVN
VCBS Research and Analysis Page | 6
VIETNAM POWER INDUSTRY 2016
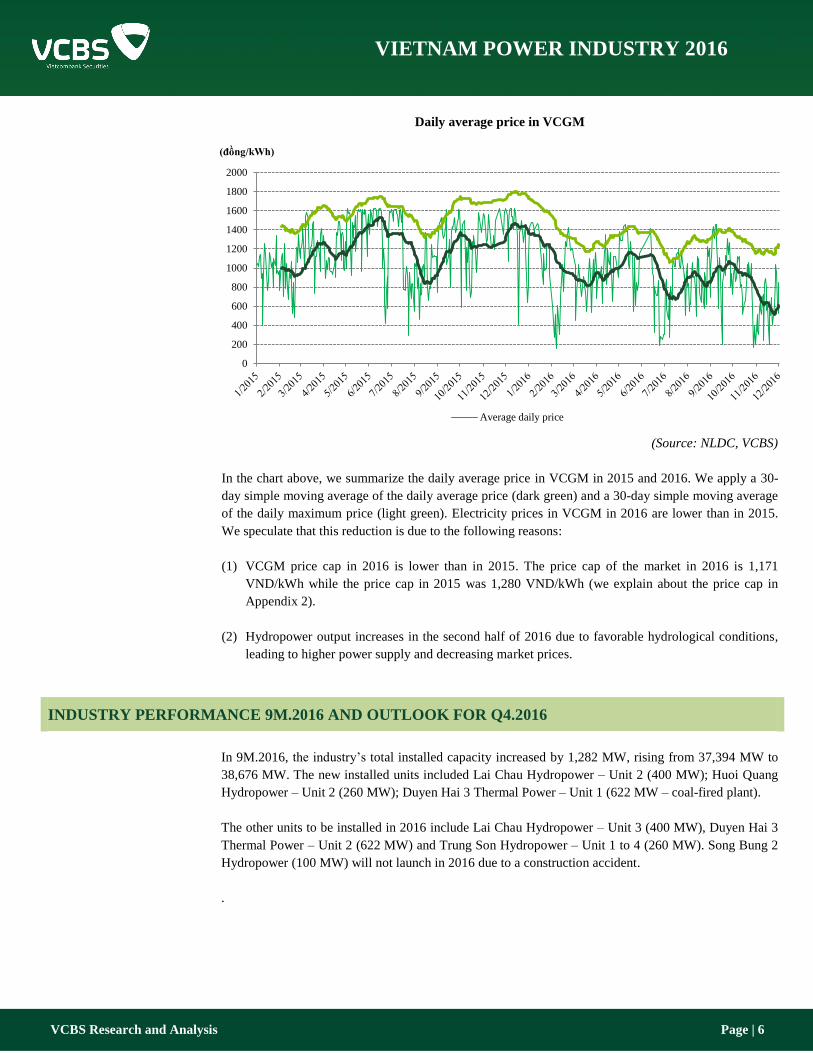
Daily average price in VCGM
(Source: NLDC, VCBS)
In the chart above, we summarize the daily average price in VCGM in 2015 and 2016. We apply a 30-
day simple moving average of the daily average price (dark green) and a 30-day simple moving average
of the daily maximum price (light green). Electricity prices in VCGM in 2016 are lower than in 2015.
We speculate that this reduction is due to the following reasons:
(1) VCGM price cap in 2016 is lower than in 2015. The price cap of the market in 2016 is 1,171
VND/kWh while the price cap in 2015 was 1,280 VND/kWh (we explain about the price cap in
Appendix 2).
(2) Hydropower output increases in the second half of 2016 due to favorable hydrological conditions,
leading to higher power supply and decreasing market prices.
INDUSTRY PERFORMANCE 9M.2016 AND OUTLOOK FOR Q4.2016
In 9M.2016, the industry’s total installed capacity increased by 1,282 MW, rising from 37,394 MW to
38,676 MW. The new installed units included Lai Chau Hydropower – Unit 2 (400 MW); Huoi Quang
Hydropower – Unit 2 (260 MW); Duyen Hai 3 Thermal Power – Unit 1 (622 MW – coal-fired plant).
The other units to be installed in 2016 include Lai Chau Hydropower – Unit 3 (400 MW), Duyen Hai 3
Thermal Power – Unit 2 (622 MW) and Trung Son Hydropower – Unit 1 to 4 (260 MW). Song Bung 2
Hydropower (100 MW) will not launch in 2016 due to a construction accident.
.
0
200
400
600
800
1000
1200
1400
1600
1800
2000
(đồng/kWh)
Average daily price
VCBS Research and Analysis Page | 7
VIETNAM POWER INDUSTRY 2016
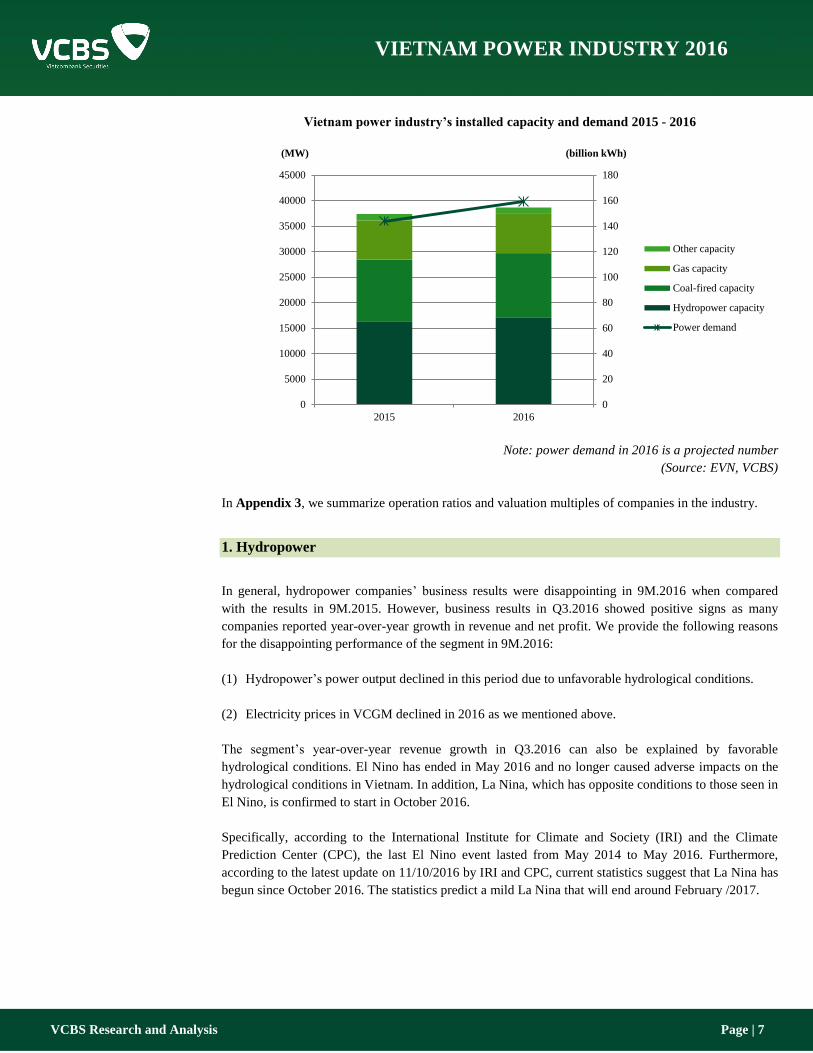
Vietnam power industry’s installed capacity and demand 2015 - 2016
Note: power demand in 2016 is a projected number
(Source: EVN, VCBS)
In Appendix 3, we summarize operation ratios and valuation multiples of companies in the industry.
1. Hydropower
In general, hydropower companies’ business results were disappointing in 9M.2016 when compared
with the results in 9M.2015. However, business results in Q3.2016 showed positive signs as many
companies reported year-over-year growth in revenue and net profit. We provide the following reasons
for the disappointing performance of the segment in 9M.2016:
(1) Hydropower’s power output declined in this period due to unfavorable hydrological conditions.
(2) Electricity prices in VCGM declined in 2016 as we mentioned above.
The segment’s year-over-year revenue growth in Q3.2016 can also be explained by favorable
hydrological conditions. El Nino has ended in May 2016 and no longer caused adverse impacts on the
hydrological conditions in Vietnam. In addition, La Nina, which has opposite conditions to those seen in
El Nino, is confirmed to start in October 2016.
Specifically, according to the International Institute for Climate and Society (IRI) and the Climate
Prediction Center (CPC), the last El Nino event lasted from May 2014 to May 2016. Furthermore,
according to the latest update on 11/10/2016 by IRI and CPC, current statistics suggest that La Nina has
begun since October 2016. The statistics predict a mild La Nina that will end around February /2017.
0
20
40
60
80
100
120
140
160
180
0
5000
10000
15000
20000
25000
30000
35000
40000
45000
2015 2016
(billion kWh) (MW)
Other capacity
Gas capacity
Coal-fired capacity
Hydropower capacity
Power demand
VCBS Research and Analysis Page | 8
VIETNAM POWER INDUSTRY 2016
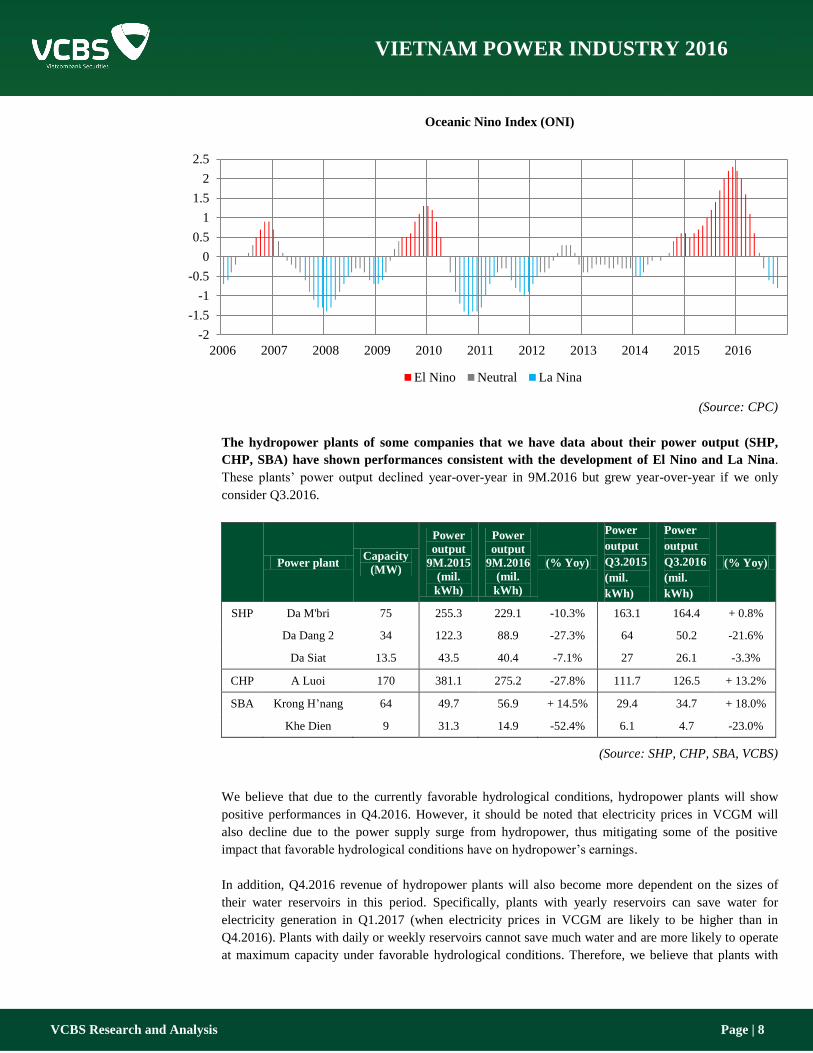
Oceanic Nino Index (ONI)
(Source: CPC)
The hydropower plants of some companies that we have data about their power output (SHP,
CHP, SBA) have shown performances consistent with the development of El Nino and La Nina.
These plants’ power output declined year-over-year in 9M.2016 but grew year-over-year if we only
consider Q3.2016.
Power plant
Capacity
(MW)
Power
output
9M.2015
(mil.
kWh)
Power
output
9M.2016
(mil.
kWh)
(% Yoy)
Power
output
Q3.2015
(mil.
kWh)
Power
output
Q3.2016
(mil.
kWh)
(% Yoy)
SHP Da M'bri 75 255.3 229.1 -10.3% 163.1 164.4 + 0.8%
Da Dang 2 34 122.3 88.9 -27.3% 64 50.2 -21.6%
Da Siat 13.5 43.5 40.4 -7.1% 27 26.1 -3.3%
CHP A Luoi 170 381.1 275.2 -27.8% 111.7 126.5 + 13.2%
SBA Krong H’nang 64 49.7 56.9 + 14.5% 29.4 34.7 + 18.0%
Khe Dien 9 31.3 14.9 -52.4% 6.1 4.7 -23.0%
(Source: SHP, CHP, SBA, VCBS)
We believe that due to the currently favorable hydrological conditions, hydropower plants will show
positive performances in Q4.2016. However, it should be noted that electricity prices in VCGM will
also decline due to the power supply surge from hydropower, thus mitigating some of the positive
impact that favorable hydrological conditions have on hydropower’s earnings.
In addition, Q4.2016 revenue of hydropower plants will also become more dependent on the sizes of
their water reservoirs in this period. Specifically, plants with yearly reservoirs can save water for
electricity generation in Q1.2017 (when electricity prices in VCGM are likely to be higher than in
Q4.2016). Plants with daily or weekly reservoirs cannot save much water and are more likely to operate
at maximum capacity under favorable hydrological conditions. Therefore, we believe that plants with
-2
-1.5
-1
-0.5
0
0.5
1
1.5
2
2.5
2006 2007 2008 2009 2010 2011 2012 2013 2014 2015 2016
El Nino Neutral La Nina

VCBS Research and Analysis Page | 9
VIETNAM POWER INDUSTRY 2016
yearly reservoirs will report less impressive earning growth in Q4.2016 than plants with daily or weekly
reservoirs.
Reservoir type of hydropower plants
Ticker Company name Power plant Capacity
(MW) Reservoir type
SHP Southern Hydropower
Da M'bri
Da Dang 2
Da Siat
75
34
13.5
Yearly
Daily
Daily
VSH Vinh Son - Song Hinh Hydropower Vinh Son
Song Hinh
66
70
Yearly
Yearly
CHP Central Hydropower A Luoi 170 Weekly
TMP Thac Mo Hydropower Thac Mo 150 Yearly
SJD Can Don Hydropower
Can Don
Na Loi
Ry Ninh II
Ha Tay
77.6
9.3
8.1
9
Yearly
Weekly
Weekly
Weekly
SBA Song Ba Hydropower Krong H’nang
Khe Dien
64
9
Yearly
Yearly
S4A Se San 4A Hydropower Se San 4A 63 Weekly
TBC Thac Ba Hydropower Thac Ba 120 Yearly
HJS Nam Mu Hydropower Nam Mu 12 Daily
DRL Hydropower Joint Stock Company -
Power No. 3 Dray H'linh 2 16 Weekly
(Source: VCBS)
2. Thermal Power
There was not a general performance trend of thermal power companies in 2016. We assess that NT2
hasd the most positive business results in 9M.2016 among thermal power companies.
Total
capacity
(MW)
Revenue
9M.2016
(bil.
VND)
(%
yoy)
Net Profit
9M.2016
(bil. VND)
(% yoy)
Revenue
Q3.2016
(bil.
VND)
(% yoy)
Net Profit
Q3.2016
(bil. VND)
(% yoy)
NT2 750 4461 -11.2% 860 + 24.4% 1,510 + 18.3% 165 + 138.5%
BTP 388 1,248 -5.5% 44 + 1329.5% 459 -2.2% 0.3 -99.3%
PPC 1,040 4489 -25.7% -350 -179.2% 1266 -28.9% 0.013 -100.0%
NBP 100 504 -4.0% 25 + 191.1% 151 -13.9% 8.5 + 154.1%
(Source: Bloomberg, VCBS)
VCBS Research and Analysis Page | 10
VIETNAM POWER INDUSTRY 2016
Besides changes in electricity prices in VCGM, changes in fuel prices and foreign exchange rates are
the main factors affecting the profitability of thermal power companies.
Since thermal power companies’ contract prices with EVN are adjusted for changes in fuel prices, the
earnings from contract sales of these companies are unaffected by changes in fuel prices. However,
earnings from sales in VCGM are affected.
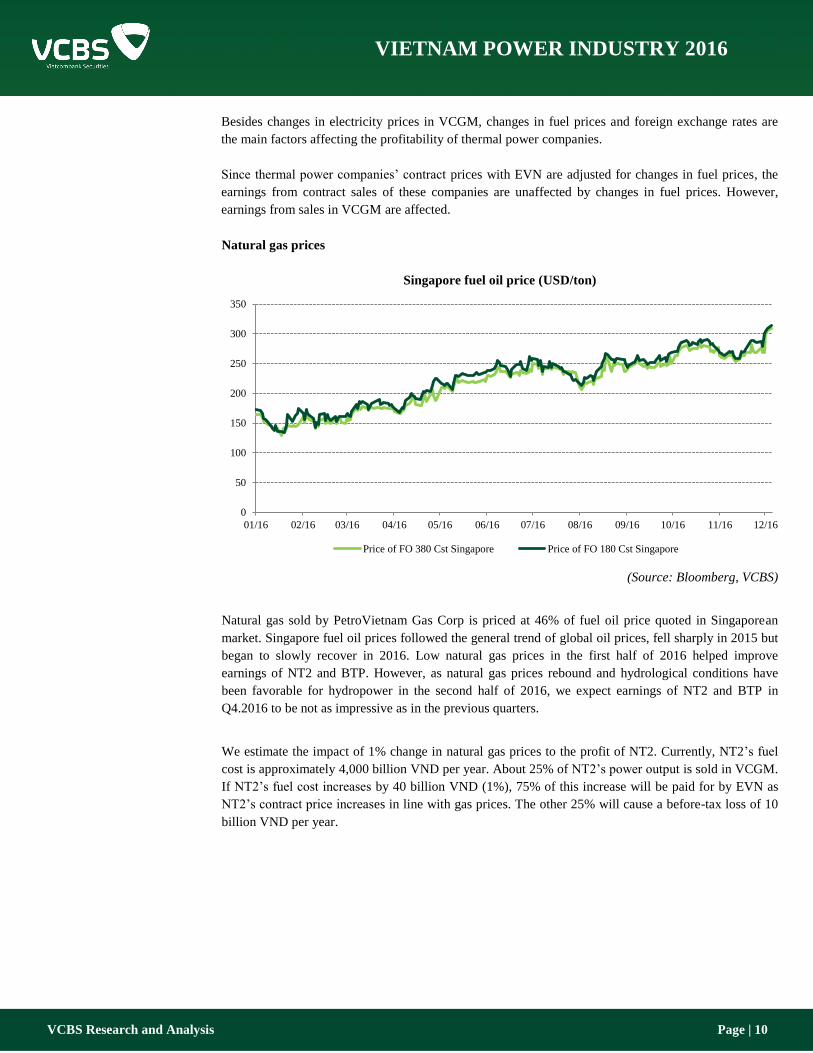
Natural gas prices
Singapore fuel oil price (USD/ton)
(Source: Bloomberg, VCBS)
Natural gas sold by PetroVietnam Gas Corp is priced at 46% of fuel oil price quoted in Singaporean
market. Singapore fuel oil prices followed the general trend of global oil prices, fell sharply in 2015 but
began to slowly recover in 2016. Low natural gas prices in the first half of 2016 helped improve
earnings of NT2 and BTP. However, as natural gas prices rebound and hydrological conditions have
been favorable for hydropower in the second half of 2016, we expect earnings of NT2 and BTP in
Q4.2016 to be not as impressive as in the previous quarters.
We estimate the impact of 1% change in natural gas prices to the profit of NT2. Currently, NT2’s fuel
cost is approximately 4,000 billion VND per year. About 25% of NT2’s power output is sold in VCGM.
If NT2’s fuel cost increases by 40 billion VND (1%), 75% of this increase will be paid for by EVN as
NT2’s contract price increases in line with gas prices. The other 25% will cause a before-tax loss of 10
billion VND per year.
0
50
100
150
200
250
300
350
01/16 02/16 03/16 04/16 05/16 06/16 07/16 08/16 09/16 10/16 11/16 12/16
Price of FO 380 Cst Singapore Price of FO 180 Cst Singapore
VCBS Research and Analysis Page | 11
VIETNAM POWER INDUSTRY 2016
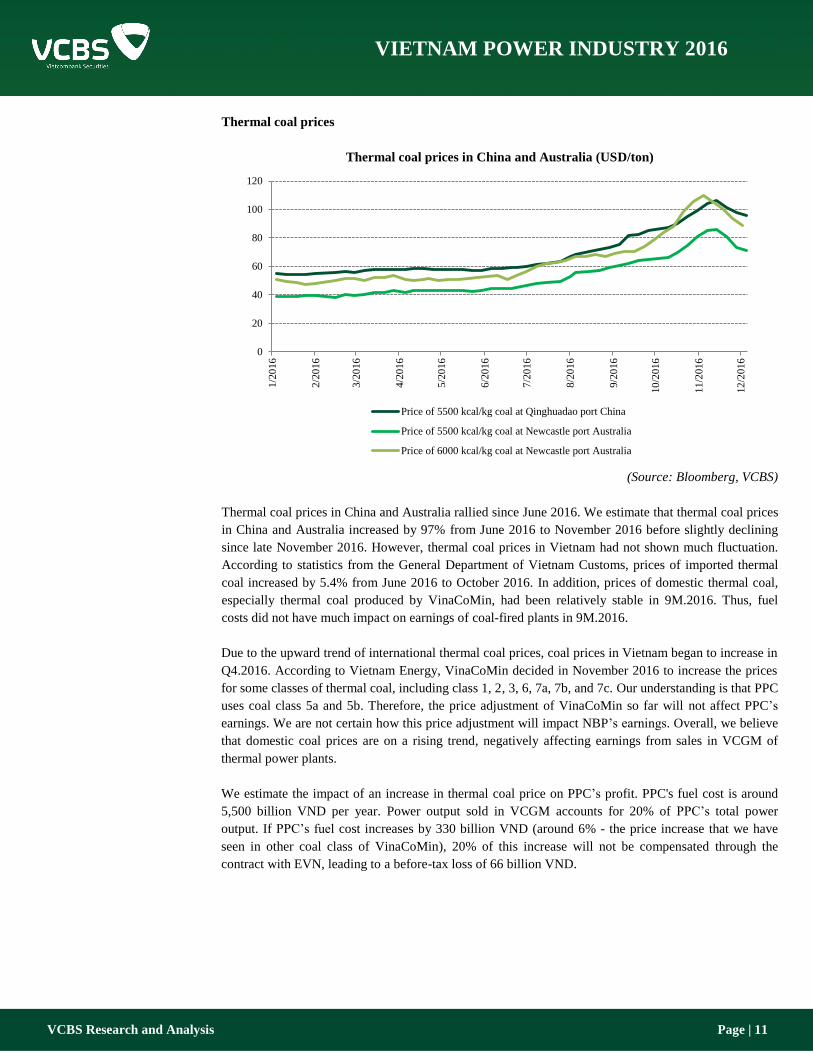
Thermal coal prices
Thermal coal prices in China and Australia (USD/ton)
(Source: Bloomberg, VCBS)
Thermal coal prices in China and Australia rallied since June 2016. We estimate that thermal coal prices
in China and Australia increased by 97% from June 2016 to November 2016 before slightly declining
since late November 2016. However, thermal coal prices in Vietnam had not shown much fluctuation.
According to statistics from the General Department of Vietnam Customs, prices of imported thermal
coal increased by 5.4% from June 2016 to October 2016. In addition, prices of domestic thermal coal,
especially thermal coal produced by VinaCoMin, had been relatively stable in 9M.2016. Thus, fuel
costs did not have much impact on earnings of coal-fired plants in 9M.2016.
Due to the upward trend of international thermal coal prices, coal prices in Vietnam began to increase in
Q4.2016. According to Vietnam Energy, VinaCoMin decided in November 2016 to increase the prices
for some classes of thermal coal, including class 1, 2, 3, 6, 7a, 7b, and 7c. Our understanding is that PPC
uses coal class 5a and 5b. Therefore, the price adjustment of VinaCoMin so far will not affect PPC’s
earnings. We are not certain how this price adjustment will impact NBP’s earnings. Overall, we believe
that domestic coal prices are on a rising trend, negatively affecting earnings from sales in VCGM of
thermal power plants.
We estimate the impact of an increase in thermal coal price on PPC’s profit. PPC's fuel cost is around
5,500 billion VND per year. Power output sold in VCGM accounts for 20% of PPC’s total power
output. If PPC’s fuel cost increases by 330 billion VND (around 6% - the price increase that we have
seen in other coal class of VinaCoMin), 20% of this increase will not be compensated through the
contract with EVN, leading to a before-tax loss of 66 billion VND.
0
20
40
60
80
100
120
1/2
016
2/2
016
3/2
016
4/2
016
5/2
016
6/2
016
7/2
016
8/2
016
9/2
016
10
/2016
11
/2016
12
/2016
Price of 5500 kcal/kg coal at Qinghuadao port China
Price of 5500 kcal/kg coal at Newcastle port Australia
Price of 6000 kcal/kg coal at Newcastle port Australia

VCBS Research and Analysis Page | 12
VIETNAM POWER INDUSTRY 2016
22150
22250
22350
22450
22550
22650
22750
17.5
18.0
18.5
19.0
19.5
20.0
20.5
21.0
Gains or losses due to changes in foreign exchange rates
Exchange rates of the JPY, KRW, EUR, USD against the VND
JPY/VND KRW/VND
EUR/VND USD/VND
(Source: Bloomberg - updated on December 09, 2016)
By the end of 2015, NT2 owed approximately 125 million USD and 117 million EUR in foreign-
denominated debt. BTP owed around 32.5 billion KRW while PPC owed around 23.7 billion JPY in
foreign-denominated debt. The earnings of these companies are all influenced by performances of the
currencies that their debts are denominated in. Notably, in 9M.2016, the JPY rose sharply, leading to
PPC’s loss due to changes in foreign exchange rates of 762 billion VND. However, this loss should
shrink by the end of 2016 as the JPY has been declining in Q4.2016.
Estimated interest rate losses of thermal power plants
Foreign-denominated debt
Exchange
rate
1/1/2016
Exchange
rate
Dec-2016
Estimated gains (losses) due to
changes in foreign exchange rates
(VND)
NT2 $ 125 million 22 450 22 650 (25,000,000,000)
€ 117 million 24 384 24 151 27,261,000,000
Total 2,261,000,000
PPC ¥ 23.7 billion 184.09 195.92 (280,371,000,000)
BTP ₩ 32.5 billion 19.06 20.05 (32,175,000,000)
(Source: VCBS approximately)
175
185
195
205
215
225
235
23500
24000
24500
25000
25500
26000
VCBS Research and Analysis Page | 13
VIETNAM POWER INDUSTRY 2016
LONG-TERM OUTLOOK
1. Power demand
The revised Power Development Plan VII (PDP 7) forecasts that power demand in Vietnam will reach
265 billion kWh in 2020, growing at 10.7% CAGR from 2015 to 2020. Based on the historical year-
over-year growth rate of power output in 2015 (11.4%) and in 10M.2016 (10.3%) as well as Vietnam's
stable GDP growth, we think that power demand growing at 10.7% CAGR in the next few years is a
reasonable assumption. We forecast that power demand in Vietnam will reach 176 billion kWh in 2017
and 195 billion kWh in 2018.
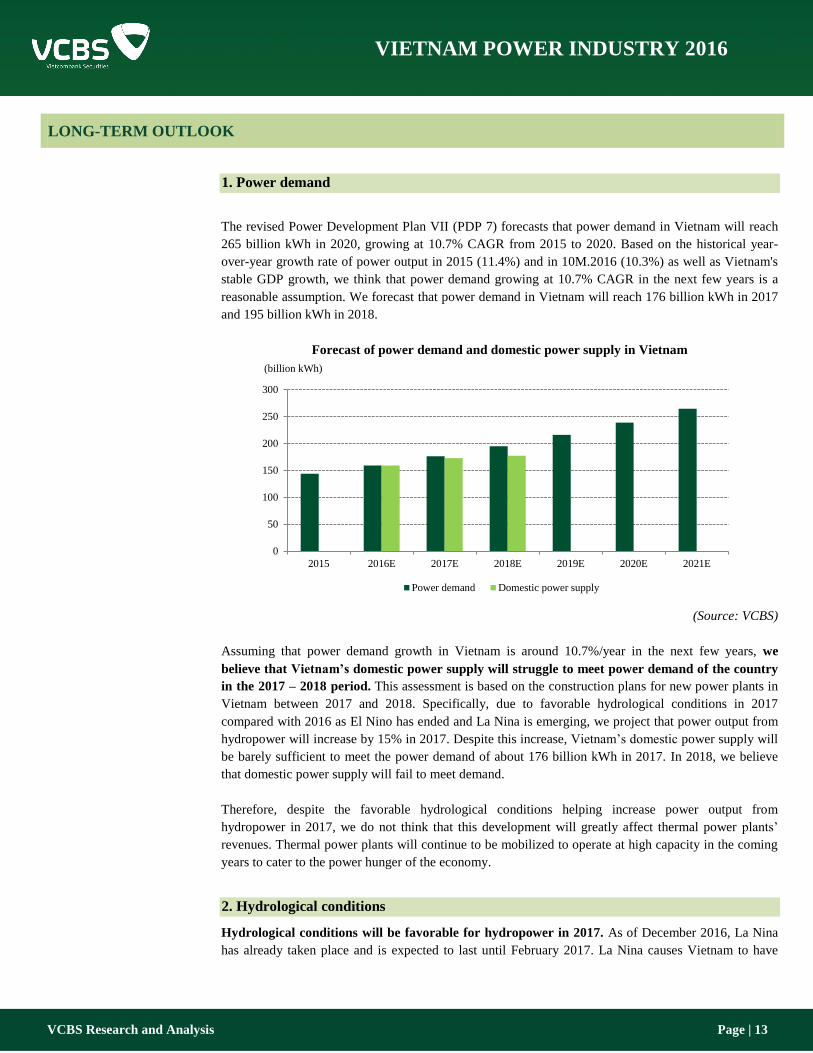
Forecast of power demand and domestic power supply in Vietnam
(Source: VCBS)
Assuming that power demand growth in Vietnam is around 10.7%/year in the next few years, we
believe that Vietnam’s domestic power supply will struggle to meet power demand of the country
in the 2017 – 2018 period. This assessment is based on the construction plans for new power plants in
Vietnam between 2017 and 2018. Specifically, due to favorable hydrological conditions in 2017
compared with 2016 as El Nino has ended and La Nina is emerging, we project that power output from
hydropower will increase by 15% in 2017. Despite this increase, Vietnam’s domestic power supply will
be barely sufficient to meet the power demand of about 176 billion kWh in 2017. In 2018, we believe
that domestic power supply will fail to meet demand.
Therefore, despite the favorable hydrological conditions helping increase power output from
hydropower in 2017, we do not think that this development will greatly affect thermal power plants’
revenues. Thermal power plants will continue to be mobilized to operate at high capacity in the coming
years to cater to the power hunger of the economy.
2. Hydrological conditions
Hydrological conditions will be favorable for hydropower in 2017. As of December 2016, La Nina
has already taken place and is expected to last until February 2017. La Nina causes Vietnam to have
0
50
100
150
200
250
300
2015 2016E 2017E 2018E 2019E 2020E 2021E
(billion kWh)
Power demand Domestic power supply
VCBS Research and Analysis Page | 14
VIETNAM POWER INDUSTRY 2016
cooler and wetter conditions, thus providing more water for the operation of hydropower. We believe
that hydropower companies will have positive business results in 2017.
However, due to the cyclical characteristic of hydrological conditions, we believe that hydrological
conditions will not have significant impacts on hydropower companies from a long term perspective.
3. Natural gas price
Natural gas sold by PetroVietnam Gas Corp is priced at 46% of fuel oil price quoted in Singapore
commodity market. Therefore, natural gas prices in Vietnam followed the general trend of global oil
prices.
The Organization of the Petroleum Exporting Countries (OPEC) has reached an agreement to cut oil
output in December 2016. Accordingly, oil production by OPEC is cut by 1.2 million bpd to 32.5
million bpd. However, as this is a reduction from the high production level in October, the new
production level is not too different from the OPEC oil production forecast in the past. In addition, the
world economy has not shown clear positive signs that can influence global oil demand. We believe that
oil prices will likely continue to rise in the short term. In the medium and long term, oil prices will
remain stable.
As current oil price level is higher than in late 2015 early 2016 and is unlikely to go down, natural gas
prices in Vietnam will follow this trend. The gains from VCGM due to low fuel price of NT2 and BTP
in the first half of 2016 will not be sustained in 2017. Regardless, as we have already mentioned, due to
the nature of the sales contracts between EVN and thermal power companies, changes in fuel costs will
not have significant impacts on companies’ earnings from contract sales. Meanwhile, earnings from
electricity sales in VCGM will be vulnerable.
4. Coal price
After a strong rally since mid-2016, international thermal coal prices began to slightly fall in November
2016. According to Citibank, there are several reasons for this fall in international thermal coal prices:
(1) Thermal coal production in China started to rise again since August 2016 as China’s National
Development Reform Commission allowed supply additions by over 30 million mt/month
compared with a deficit of 15 million mt to 25 million mt/month earlier in the year
(2) Although La Nina conditions continue to hinder coal mining in Indonesia, the increase in thermal
coal prices has ramped up production in Indonesia.
(3) The appreciation of USD has reduced USD-quoted coal price
International thermal coal price in 2017 is expected to not deviate much from the price level in
December 2016. While international thermal coal prices have stopped growing, the current price level is
still higher than in a year earlier. We believe that domestic coal prices will tend to rise in 2017 due to
the pressure from higher international coal prices, negatively impacting earnings from electricity sales
in VCGM of coal-fired companies. Again, we believe that changes in coal prices will have negligible
effects on companies’ earnings from contract sales to EVN.
VCBS Research and Analysis Page | 15
VIETNAM POWER INDUSTRY 2016
5. Electricity price in Vietnam competitive electricity market
As Vietnam wholesale electricity market is planned to operate in 2019, it has been speculated that the
market’s cap price will be significantly higher in 2019 due to a new calculation method of the cap price.
An increase in the competitive market’s cap price will have a positive impact on revenues of power
plants participating in the market.
Overall, the sales contracts with EVN bring a unique characteristic to companies in the power industry
in Vietnam. The contracts will help ensure stable cash flow from operating activities for companies in
the industry in the coming years.
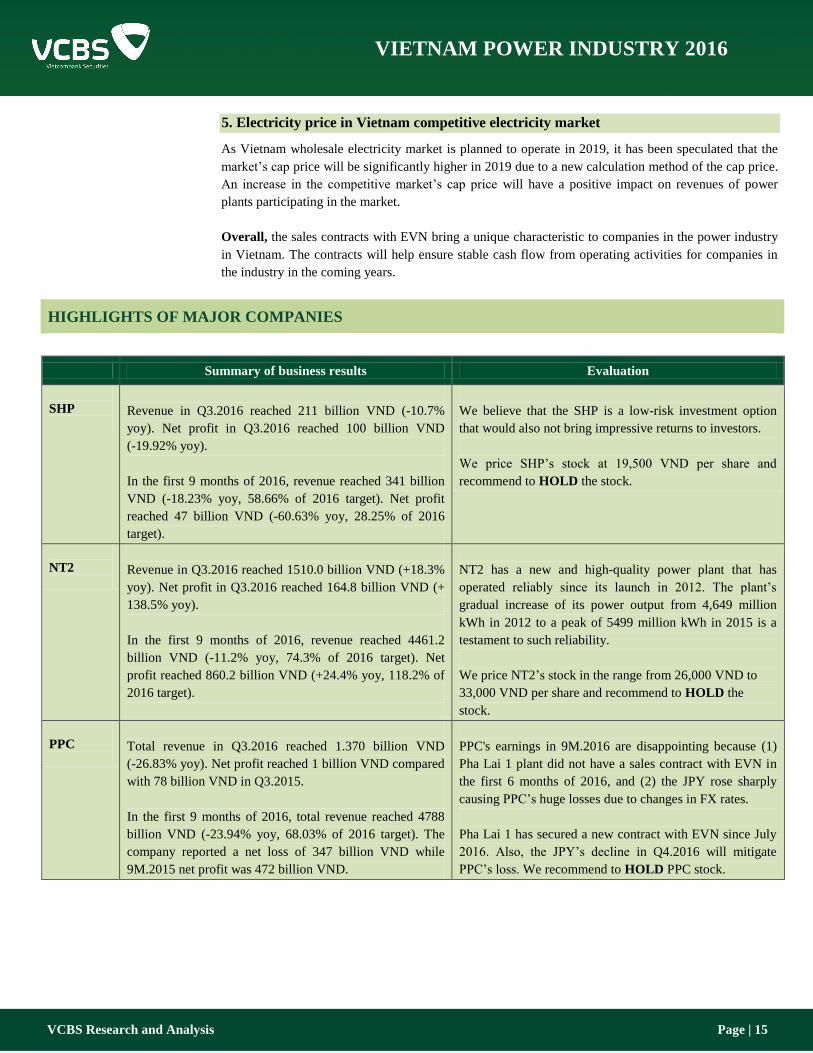
HIGHLIGHTS OF MAJOR COMPANIES
Summary of business results Evaluation
SHP
Revenue in Q3.2016 reached 211 billion VND (-10.7%
yoy). Net profit in Q3.2016 reached 100 billion VND
(-19.92% yoy).
In the first 9 months of 2016, revenue reached 341 billion
VND (-18.23% yoy, 58.66% of 2016 target). Net profit
reached 47 billion VND (-60.63% yoy, 28.25% of 2016
target).
We believe that the SHP is a low-risk investment option
that would also not bring impressive returns to investors.
We price SHP’s stock at 19,500 VND per share and
recommend to HOLD the stock.
NT2
Revenue in Q3.2016 reached 1510.0 billion VND (+18.3%
yoy). Net profit in Q3.2016 reached 164.8 billion VND (+
138.5% yoy).
In the first 9 months of 2016, revenue reached 4461.2
billion VND (-11.2% yoy, 74.3% of 2016 target). Net
profit reached 860.2 billion VND (+24.4% yoy, 118.2% of
2016 target).
NT2 has a new and high-quality power plant that has
operated reliably since its launch in 2012. The plant’s
gradual increase of its power output from 4,649 million
kWh in 2012 to a peak of 5499 million kWh in 2015 is a
testament to such reliability.
We price NT2’s stock in the range from 26,000 VND to
33,000 VND per share and recommend to HOLD the
stock.
PPC
Total revenue in Q3.2016 reached 1.370 billion VND
(-26.83% yoy). Net profit reached 1 billion VND compared
with 78 billion VND in Q3.2015.
In the first 9 months of 2016, total revenue reached 4788
billion VND (-23.94% yoy, 68.03% of 2016 target). The
company reported a net loss of 347 billion VND while
9M.2015 net profit was 472 billion VND.
PPC's earnings in 9M.2016 are disappointing because (1)
Pha Lai 1 plant did not have a sales contract with EVN in
the first 6 months of 2016, and (2) the JPY rose sharply
causing PPC’s huge losses due to changes in FX rates.
Pha Lai 1 has secured a new contract with EVN since July
2016. Also, the JPY’s decline in Q4.2016 will mitigate
PPC’s loss. We recommend to HOLD PPC stock.
VCBS Research and Analysis Page | 16
VIETNAM POWER INDUSTRY 2016
1. Southern Hydropower (SHP)
SHP reported disappointing business results in Q3.2016. SHP’s revenue in Q3.2016 reached 211
billion VND (-10.7% yoy). Net profit in Q3.2016 reached 100 billion VND (-19.92% yoy). In the first 9
months of 2016, revenue reached 341 billion VND (-18.23% yoy, 58.66% of 2016 target). Profit
reached 47 billion VND (-60.63% yoy, 28.25% of 2016 target).
SHP's business performance was quite poor in 9M.2016 as (1) Da Dang 2 produced significantly low
power output due to the impact of El Nino in this period and (2) declining electricity price in VCGM
has negatively affected the revenues of Da Dang 2 and Da M'bri.
Similar to other hydropower companies, SHP is affected by the El Niño Southern Oscillation (ENSO),
which entails both El Nino and La Nina. Over the long term, we believe that the ENSO cycle will
continue to lead to fluctuated hydrological conditions in Vietnam, affecting hydropower’s power output.
Since it is difficult to accurately predict the activities of this cycle, it is more practical to keep track of
the actual ENSO cycle on a monthly basis when forecasting the power output of hydropower
companies, including SHP.
Nevertheless, the ENSO cycle tends to balance the impacts of its two opposite events over the long
term. A strong El Nino even is likely followed by a strong La Nina event - a drought year will be offset
by a rainy year after. Therefore, from a long-term investment perspective, climate risk should not be a
concern for SHP and we are not too discouraged by SHP’s disappointing performance in 9M.2016.
Due to its sales contracts with EVN, SHP will continue to operate stably in the future. However, the
contract prices of SHP are relatively fixed and particularly low, limiting SHP’s ability to raise revenue
in the coming years. Additionally, the company currently has no plan to invest in new power plant
projects. Therefore, SHP‘s growth potential is quite limited.
We forecast that SHP’s revenue in 2016 will reach 522 billion VND (-11% yoy, 87% of 2016
target). Net profit is forecasted to reach 95 billion VND (-44% yoy, 58% of 2016 target) –equivalent to
928 VND in EPS. For 2017, we forecast that revenue will reach 649 billion VND (+24.3% yoy), net
profit will reach 230 billion VND (+142% yoy) – equivalent to 2.367 in VND EPS. We believe that
SHP’s 2017 earnings will be positive due to the favorable impact from La Nina.
We use an industry-average EV/EBITDA of 8.6 times to arrive at the value of 21,700 VND per share
for SHP. A P/E of 17.3 times, which is the average for companies with similar debt structures to SHP’s
(VSH, CHP, SBA, S4A, HJS), indicates a share value of 17,350 VND. We apply equal weight for each
method to arrive at our price target of 19,500 per share.
We believe that the SHP is a low-risk investment option that would also not bring impressive returns to
investors. Nevertheless, we identified two factors that could positively influence the value of SHP: (1)
the proportion of power output sold in VCGM may increase in the future and (2) Da M'bri’s power
output in the coming years can bring surprise as the maximum power output of the power plant is not
yet revealed. We price SHP’s stock at 19,500 VND per share and recommend to HOLD the stock.
VCBS Research and Analysis Page | 17
VIETNAM POWER INDUSTRY 2016
2. Nhon Trach 2 PetroVietnam Power (NT2)
NT2's business results in Q3.2016 have been quite positive. Revenue in Q3.2016 reached 1510.0
billion VND (+18.3% yoy). Net profit in Q3.2016 reached 164.8 billion VND (+ 138.5% yoy). In the
first 9 months of 2016, revenue reached 4461.2 billion VND (-11.2% yoy, 74.3% of 2016 target). Net
profit reached 860.2 billion VND (+24.4% yoy, 118.2% of 2016 target).
In recent years, NT2 has stable operation, gradually increasing its power output from 4,649 million kWh
(2012) to a peak of 5499 million kWh (2015). Due to the contract between NT2 and EVN, the company
is not affected much from fuel price volatility. NT2’s foreign-denominated debt is paid on schedule and
therefore, the company’s credit risk has been decreasing over the years. NT2 management believes that
the company’s key strength is its superior facilities, allowing the power plant to operate stably at high
capacity over the long term and produce impressive annual power output.
However, the rise of natural gas price in the second half of 2016 had had a negative impact on NT2. We
also believe that natural gas price in 2017 will stay at a higher level than in late 2015 early 2016.
Therefore, NT2’s gains from low fuel costs will not be sustained. Nevertheless, we believe that the
change in natural gas price will not have a substantial impact on NT2’s earnings since only about 25%
of NT2’s electricity sales is in VCGM and thus influenced by changes in gas price.
Another concern for NT2’s earnings is the company’s large foreign-denominated debt, which leads to
NT2’s volatile gains (losses) due to changes in foreign exchange rates, particularly the USD/VND and
EUR/VND. The USD has risen sharply since mid-2016 due to optimism about the US economy after
Donald Trump's victory. Meanwhile, the EUR declined after Brexit. Considering the opposite
movements of the USD and EUR, we estimate that NT2 gains about 1 to 2 billion VND due to changes
in foreign exchange rates.
For 2016, we forecast that NT2’ revenue will reach 6,130 billion VND (-8.9% yoy, 138% of 2016
target). Net profit 2016 will reach 1,158 billion VND (-4% yoy, 151% of 2016 target) - equivalent to
3,866 VND in EPS. For 2017, we forecast that revenue will reach 6,330 billion VND (+3.3% yoy) and
net profit will reach 799 billion VND (-31% yoy) - equivalent to 2,594 VND in EPS. We believe that
net profit in 2017 will be reduced significantly compared with in 2016 as NT2 power plant will have a
major overhaul, leading to a power output loss of approximately 300 million kWh during the overhaul
period. In addition, we believe that natural gas prices in 2017 will remain at Q4.2016 level, reducing
NT2’s earnings from electricity sales in VCGM. Despite this probable decline in 2017, we remain
optimistic about NT2 over the long term.
We price NT2’s stock in the range from 26,000 VND to 33,000 VND per share and recommend to
HOLD the stock.
VCBS Research and Analysis Page | 18
VIETNAM POWER INDUSTRY 2016
3. Pha Lai Thermal Power (PPC)
PPC’s business results in Q3.2016 are disappointing. Total revenue in Q3.2016 reached 1.370 billion
VND (-26.83% yoy). Net profit reached 1 billion VND compared with 78 billion VND in Q3.2015. In
the first 9 months of 2016, total revenue reached 4788 billion VND (-23.94% yoy, 68.03% of 2016
target). The company reported a net loss of 347 billion VND while 9M.2015 net profit was 472 billion
VND.
PPC’s disappointing business results in 9M.2016 are due to (1) Pha Lai 1 plant did not finalize a sales
contract with EVN in the first half of 2016, (2) the JPY rose sharply causing huge loss due to foreign
exchange differences for PPC (762 billion VND) and (3) favorable hydrological conditions in Q3.2016
led to a power supply surge from hydropower, reducing demand for thermal power.
Without taking into account PPC’s losses due to changes in foreign exchange rates, we find PPC’s
profit to be quite stable even when Pha Lai 1 did not secure a sales contract with EVN in 1H.2016.
PPC’s earnings before gains (losses) due to changes in foreign exchange rates is 415 VND billion in
9M.2016 (-45.66% yoy), compared with 763 billion VND in 9M.2015. If we consider the payment that
EVN will make to PPC (for the difference between the contract price and the temporary price of Pha Lai
1 plant in 1H.2016), earnings before gains (losses) due to changes in foreign exchange rates will be
about 645 billion VND, closer to the 763 billion VND in 9M.2015.
For 2016, we forecast that total revenue will reach 6.410 billion VND (-20.2% yoy, 91.1% of 2016
target). Net profit before gains (losses) due to changes in foreign exchange rates will reach 577 billion
VND. Net profit is expected to reach 391 billion VND (-35.3% yoy, 62.7% of 2016 target). In our
forecast, we assume that PPC will receive payment from EVN in Q4.2016 for the difference between
the contract electricity selling price and the temporary electricity selling price of Pha Lai 1 plant in
1H.2016. We also consider that JPY is declining in Q4.2016, reducing PPC’s loss due to foreign
exchange differences. In 2017, PPC’s power output will resume to its average level of around 5,500
million kWh per year. We forecast that revenue in 2017 will reach 6,929 billion VND (+14.8% yoy).
Net profit before gains (losses) due to foreign exchange differences will reach 696 billion VND
(+77.6% yoy).
Fluctuation in JPY/VND should be a key concern for investor considering PPC. The JPY appreciated by
about 18% against the VND in 9M.2016, leading to PPC’s losses of 762 billion VND. We recommend
investors to closely monitor movements of the JPY/VND before making any investment decision with
PPC.
In the long term, we believe that PPC will continue to operate stably. Both plants of PPC currently have
sales contracts with EVN. Thus, we believe that from 2017, PPC’s power output will resume to its
average level of around 5,500 million kWh per year. The sales contracts with EVN will play a critical
role in ensuring PPC’s stable cash flow from operations in the coming years. We recommend to HOLD
PPC stock.
VCBS Research and Analysis Page | 19
VIETNAM POWER INDUSTRY 2016
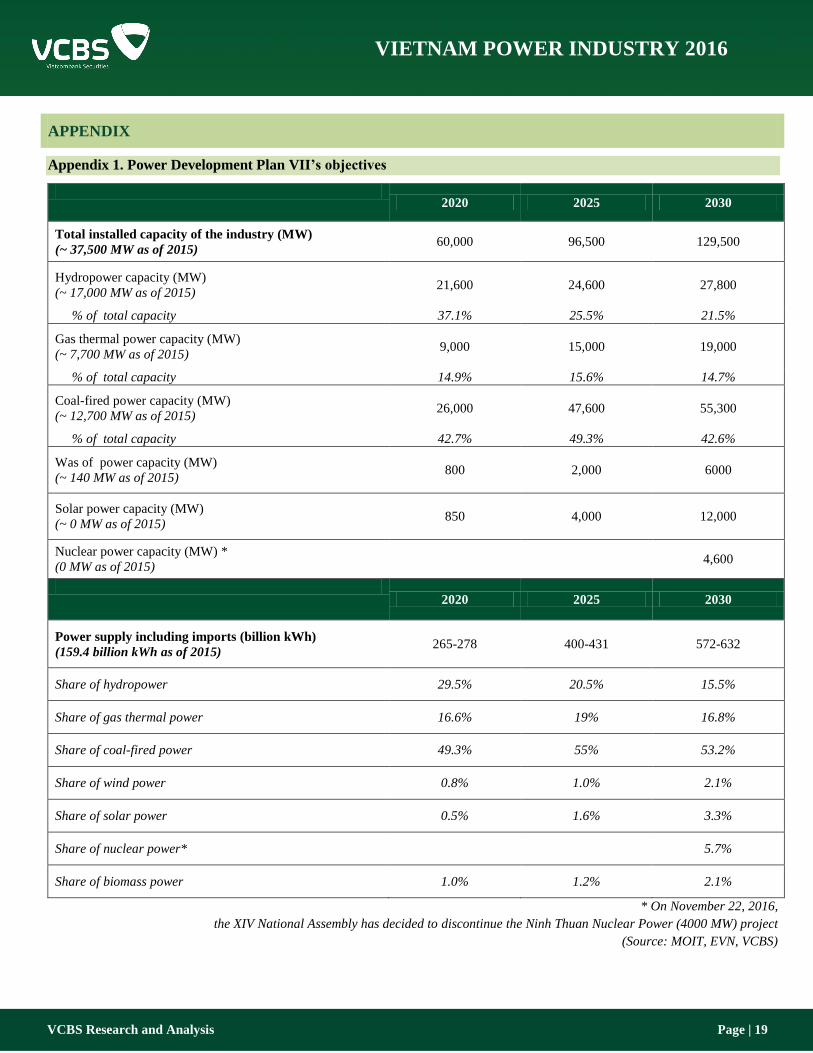
APPENDIX
Appendix 1. Power Development Plan VII’s objectives
2020 2025 2030
Total installed capacity of the industry (MW)
(~ 37,500 MW as of 2015) 60,000 96,500 129,500
Hydropower capacity (MW)
(~ 17,000 MW as of 2015) 21,600 24,600 27,800
% of total capacity 37.1% 25.5% 21.5%
Gas thermal power capacity (MW)
(~ 7,700 MW as of 2015) 9,000 15,000 19,000
% of total capacity 14.9% 15.6% 14.7%
Coal-fired power capacity (MW)
(~ 12,700 MW as of 2015) 26,000 47,600 55,300
% of total capacity 42.7% 49.3% 42.6%
Was of power capacity (MW)
(~ 140 MW as of 2015) 800 2,000 6000
Solar power capacity (MW)
(~ 0 MW as of 2015) 850 4,000 12,000
Nuclear power capacity (MW) *
(0 MW as of 2015) 4,600
2020 2025 2030
Power supply including imports (billion kWh)
(159.4 billion kWh as of 2015) 265-278 400-431 572-632
Share of hydropower 29.5% 20.5% 15.5%
Share of gas thermal power 16.6% 19% 16.8%
Share of coal-fired power 49.3% 55% 53.2%
Share of wind power 0.8% 1.0% 2.1%
Share of solar power 0.5% 1.6% 3.3%
Share of nuclear power* 5.7%
Share of biomass power 1.0% 1.2% 2.1%
* On November 22, 2016,
the XIV National Assembly has decided to discontinue the Ninh Thuan Nuclear Power (4000 MW) project
(Source: MOIT, EVN, VCBS)
VCBS Research and Analysis Page | 20
VIETNAM POWER INDUSTRY 2016
Appendix 2. Electricity price mechanism
Sales through contract with EVN and sales in VCGM
Typically, a power plant with installed capacity ≥ 30 MW is required to participate in VCGM.
The plant also has a power purchase agreement (PPA) with EVN. Under this contract, each year,
the power plant will be given a contractual power output (Qc) to sell to EVN under the contract
price of that year. Qc varies each year, while the contract price changes each month. The power
plant must produce Qc before having excess power to sell in VCGM.
Power output of the plant can be divided into two categories: (1) power output sold to EVN through
the sales contract (Qc) and (2) power output sold in VCGM. The Electricity Regulatory Authority
of Vietnam (ERAV) will determine the power output the plant needs to produce each hour based on
the Qc that the plant is assigned with. At a given hour, the plant has to produce this hourly Qc
before having excess power to sell in VCGM.
Price mechanism
The electricity price defined in the contract is calculated based on a projection of the plant’s
economic life so that if the plant can sell Qc at this price, the revenue from Qc will help pay off
operation costs and leave a certain profit.
For hydropower plants: Contract price (VND/kWh) = fixed cost price + operating and
maintenance cost price
Fixed cost price is calculated so that the plant can cover the costs of depreciation, interest
expense, debt repayment and have a certain profit left. Operation and maintenance cost price
helps cover major overhaul and labor costs. Fixed cost price may vary each year or is kept
constant for the plant’s whole economic life. Operation and maintenance cost price changes
monthly, taking into account the impact of inflation.
For thermal power plants: Contract price (VND/kWh) = fixed cost price + operating and
maintenance cost price + variable cost price + transportation cost of raw materials price
Fixed cost price is calculated so that the plant can cover the costs of depreciation, interest
expense, debt repayment and have a certain profit left. Operating and maintenance cost price
helps cover major overhaul and labor costs, adjusting for inflation. Variable cost price helps
pay for fuel costs and is adjusted for actual fuel prices. Transportation cost of raw materials
price helps pay for the shipping of the fuel and is adjusted for actual shipping costs. Fixed cost
price may vary each year or is kept constant for the plant’s whole economic life. Other prices
change monthly.
(Note: These prices are calculated when the contract is made, based on a projection of the plant’s
expenditures in its whole economic life. The assumptions used in this projection may be inaccurate
compared with the plant’s actual operational costs.)
Electricity price in VCGM changes every hour. Every plant participating in VCGM is quoted the
same electricity price at a specific hour.
Electricity price in VCGM = capacity price + market price
Capacity price is determined by ERAV for each hour and correlates with the system’s power load at
that hour.
VCBS Research and Analysis Page | 21
VIETNAM POWER INDUSTRY 2016
Market price changes every hour and is determined by ask prices that the plants offer in that hour.
After the plants offer their ask prices and power output for each hour of the day, ERAV will
determine the market price for each hour based on the actual power demand at that hour. Plants that
offer prices equal or lower than the market price will be mobilized and will be paid at the market
price.
Market price cannot be higher than the price cap that ERAV sets out. This price caps may be
readjusted each month and are different for hydropower, coal-fired power and gas thermal power
plants.
How the pricing mechanism affects plants’ revenues
For thermal power plants, the contract price is adjusted by changes in fuel costs as well as overhaul
and labor costs. For hydropower plants, the contract price is adjusted for changes in overhaul and
labor costs. After a plant sells the annual power output specified in the contract, the plant will
essentially be able to pay off its fixed costs, variable costs and interest expense as well as to repay
its debt.
Therefore, after meeting the annual contract power output (Qc), power plants only have to worry
about marginal costs when selling electricity in VCGM. For thermal power plants, the marginal
costs include fuel costs, which are still substantial, as well as environmental protection charges. For
hydropower plants, the marginal costs include environmental protection charges, which are
negligible.
Participation in VCGM is beneficial for both hydropower and thermal power plants. A plant will
make a good profit in VCGM as long as the market price is higher than its marginal costs. Since
hydropower plants have virtually no marginal cost, they can sell electricity in VCGM at very low
prices. Thermal power plants have to sell at minimum prices that are higher than their fuel costs per
kWh.
In general, every plant is guaranteed that it can sell at least the contractual power output (Qc) each
year. Sales in VCGM depend on power demand of the economy. Since hydropower plants have low
ask prices, they are more likely to be able to sell electricity in VCGM. Thermal power plants with
higher ask prices only sell electricity in VCGM after all hydropower plants have been mobilized.
The more inefficient a thermal power plant operates, the more struggle it has to sell electricity in
VCGM.

VCBS Research and Analysis Page | 22
VIETNAM POWER INDUSTRY 2016
Appendix 3. Companies in the industry
Ticker Company name Type
Total
capacity
(MW)
Revenue
9M.2016
(bil.
VND)
yoy
Revenu
Q3.2016
(bil.
VND)
yoy
Profit
margin
2015
Profit
margin
9M.2016
Profit
margin
Q3.2016
SHP Southern Hydropower Hydropower 122.5 341 -18.2% 211 -10.4% 27.7% 13.1% 46.5%
VSH Vinh Son - Song Hinh Hydropower Hydropower 136 329 -9.4% 106 + 15.8% 53.8% 61.4% 53.2%
CHP Central Hydropower Hydropower 170 291 -32.7% 116 + 0.7% 45.0% 8.5% 19.9%
TMP Thac Mo Hydropower Hydropower 150 348 -29.3% 147 -7.0% 37.0% 22.8% 35.1%
SJD Can Don Hydropower Hydropower 104 265 -13.3% 128 -12.8% 46.9% 37.7% 31.0%
SBA Song Ba Hydropower Hydropower 73 105 + 6.1% 52 + 31.1% 26.6% 16.5% 33.0%
S4A Se San 4A Hydropower Hydropower 63 127 -25.6% 68 + 3.2% 9.9% 20.8% 42.3%
TBC Thac Ba Hydropower Hydropower 120 222 + 15.5% 83 + 153.0% 45.9% 52.1% 51.8%
HJS Nam Mu Hydropower Hydropower 12 123 + 2.0% 41 + 7.2% 20.5% 23.2% 23.2%
DRL Hydropower - Power No. 3 Hydropower 16 35 -13.6% 13.5 -22.0% 54.8% 50.6% 58.0%
NT2 Nhon Trach 2 PetroVietnam Power Gas 750 4461 -11.2% 1,510 + 18.3% 17.0% 19.3% 10.9%
BTP Ba Ria Thermal Power Gas 388 1,248 -5.5% 459 -2.2% 5.2% 3.6% 0.1%
PPC Pha Lai Thermal Power Coal-fired 1,040 4489 -25.7% 1266 -28.9% 7.3% -7.8% 0.0%
NBP Ninh Binh Thermal Power Coal-fired 100 504 -4.0% 151 -13.9% 6.7% 5.0% 5.7%
(Source: Bloomberg, VCBS - updated on 12/15/2016)
Ticker
Gross
profit
margin
ttm
Net
profit
margin
ttm
ROA ttm ROE ttm Debt/
Assets
EPS 2015
(VND/
share)
Dividend
2015
(VND/
share)
EPS ttm
(VND/
share)
EV/
EBIT
ttm
EV/
EBITDA
ttm
P/E ttm P/B
SHP 48.2% 18.1% 3.20% 6.27% 51.8% 1,686 1,600 1,004 14.5x 8.0x 25.2x 1.6x
VSH 61.8% 54.4% 4.53% 8.24% 48.5% 1,191 1,000 1,144 20.1x 15.2x 13.8x 1.2x
CHP 59.8% 34.7% 6.78% 14.02% 45.3% 2,484 1,600 1,620 12.2x 8.2x 12.7x 1.8x
TMP 44.2% 24.7% 6.55% 10.48% 28.2% 2,985 2,500 1,484 9.9x 5.5x 18.5x 2.0x
SJD 58.0% 35.9% 8.58% 11.37% 18.0% 3,899 - 2,668 10.2x 7.1x 9.3x 1.0x
SBA 67.5% 29.1% 4.09% 8.82% 49.4% 859 - 968 10.4x 8.1x 11.5x 1.0x
S4A 50.3% 9.2% 1.38% 3.90% 62.4% 538 - 426 - - 30.9x 1.5x
TBC 62.4% 49.1% 15.06% 15.42% 0,0% 1,816 1,800 2,175 7.8x 6.0x 11.0x 1.7x
HJS 41.0% 23.2% 7.36% 16.04% 42.9% 2,012 1,200 1,835 9.3x 5.6x 8.1x 1.2x
DRL 54.3% 47.9% 22.40% 22.15% 0,0% 3,429 2,518 2,853 10.3x 7.5x 13.9x 3.2x
Mean 11.6x 7.9x 15.5x 1.6x
Median 10.3x 7.5x 13.2x 1.6x
NT2 26.4% 21.2% 11.33% 27.68% 46.8% 3,937 2,115 4,599 9.6x 6.6x 6.0x 1.6x
BTP 13.1% 8.9% 7.77% 15.71% 29.2% 1,587 1,000 2,595 2.1x 1.9x 5.0x 0.8x
PPC 8.8% -5.3% -3.05% -6.30% 47.2% 1,762 2,500 -1,010 14.2x 12.0x - 1.2x
NBP 13.1% 4.3% 6.70% 11.17% 0,0% 3,799 1,500 2,147 4.6x 3.8x 8.2x 0.9x
Mean 7.6x 6.1x 6.4x 1.1x
Median 7.1x 5.2x 6.0x 1.0x
(Source: Bloomberg, VCBS - updated on 12/15/2016)
VCBS Research and Analysis Page | 23
VIETNAM POWER INDUSTRY 2016
DISCLAIMER
This report is designed to provide updated information on the Vietnam power industry. The VCBS analysts exert their best efforts to obtain the most
accurate and timely information available from various sources, including information pertaining to market prices. All information stated in the report
has been collected and assessed as carefully as possible.
It must be stressed that all opinions, judgments, estimations and projections in this report represent independent views of the analyst at the date of
publication. Therefore, this report should be best considered a reference and indicative only. It is not an offer or advice to buy or sell or any actions
related to any assets. VCBS and/or Departments of VCBS as well as any affiliate of VCBS or affiliate that VCBS belongs to or is related to (thereafter,
VCBS), provide no warranty or undertaking of any kind in respect to the information and materials found on, or linked to the report and no obligation to
update the information after the report was released. VCBS does not bear any responsibility for the accuracy of the material posted or the information
contained therein, or for any consequences arising from its use, and does not invite or accept reliance being placed on any materials or information so
provided.
This report may not be copied, reproduced, published or redistributed for any purpose without the written permission of an authorized representative of
VCBS. Please cite sources when quoting. Copyright 2012 Vietcombank Securities Company. All rights reserved.
CONTACT INFORMATION
Thi Ly Duc Dam
Head of Research
Analyst
VIETCOMBANK SECURITIES COMPANY
http://www.vcbs.com.vn
Ha Noi Headquarter Floor 12th& 17th, Vietcombank Tower, 198 Tran QuangKhai Street, HoanKiem District, Hanoi
Tel: (84-4)-39366990 ext: 140/143/144/149/150/151
Ho Chi Minh Branch Floor 1st and 7th, Green Star Building, 70 Pham Ngoc Thach Street, Ward 6, District No. 3, Ho Chi Minh City
Tel: (84-8)-3820 8116
Da Nang Branch Floor 12th, 135 Nguyen Van Linh Street, Thanh Khe District, Da Nang City
Tel: (84-511)-3888991 ext: 801/802
Phu My Hung Transaction Unit Lawrence Sting Building, 801 Nguyen Luong Bang Street, Phu My Hung Urban Zone, District No. 7, Ho Chi Minh City
Tel: (84-8)-54136573
Giang Vo Transaction Unit Floor 1st, Building C4 Giang Vo, Giang Vo Ward, Ba Dinh District, Hanoi
Tel: (84-4)-37265551
Can Tho Representative Office Floor 1st, Vietcombank Can Tho Building, 7 HoaBinh Avenue, NinhKieu District, Can Tho City
Tel: (84-710)-3750888
Vung Tau Representative Office Floor 1st, 27 Le Loi Street, Vung Tau City, Ba Ria - Vung Tau Province
Tel: (84-64)-3513974/75/76/77/78
An Giang Representative Office Floor 7th, Vietcombank An Giang Tower, 30-32 Hai Ba Trung,, My Long Ward, Long Xuyen City, An Giang Province
Tel: (84-76)-3949843
Dong Nai Representative Office F240-F241 Vo Thi Sau Street, 7th Block, Thong Nhat Ward, Bien Hoa City, Dong Nai Province
Tel: (84-61)-3918815
HaiPhong Representative Office Floor 2nd, 11 Hoang Dieu Street, Minh Khai Ward, Hong Bang District, HaiPhong City
Tel: (+84-76) 3949 843
Binh Duong Representative Office Floor 3th, 516 CachMangThang Tam Street, PhuCuong Ward, Thu Dau Mot City, Binh Duong Province.
Tel: (+84-76) 3949 843
TERMS OF USE