Embed Size (px)
Citation preview
Technical Report 151
Video Data Analytics for Safer and More Efficient Mobility
Research Supervisor: Natalia Ruiz Juri Center for Transportation Research October 2020
Data-Supported Transportation Operations & Planning Center (D-STOP)
A Tier 1 USDOT University Transportation Center at The University of Texas at Austin
D-STOP is a collaborative initiative by researchers at the Center for Transportation Research and the Wireless Networking and Communications Group at The University of Texas at Austin.
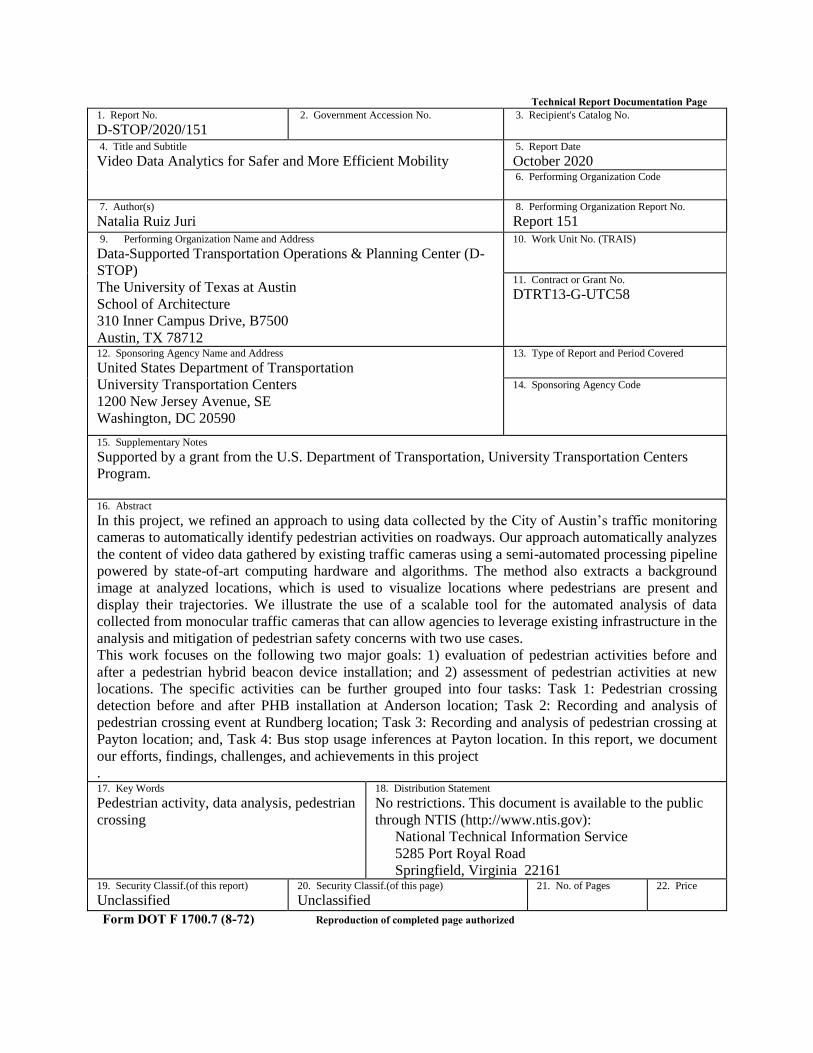
Technical Report Documentation Page
1. Report No.
D-STOP/2020/151 2. Government Accession No.
3. Recipient's Catalog No.
4. Title and Subtitle
Video Data Analytics for Safer and More Efficient Mobility 5. Report Date
October 2020 6. Performing Organization Code
7. Author(s)
Natalia Ruiz Juri 8. Performing Organization Report No.
Report 151 9. Performing Organization Name and Address
Data-Supported Transportation Operations & Planning Center (D-
STOP)
The University of Texas at Austin
School of Architecture
310 Inner Campus Drive, B7500
Austin, TX 78712
10. Work Unit No. (TRAIS)
11. Contract or Grant No.
DTRT13-G-UTC58
12. Sponsoring Agency Name and Address
United States Department of Transportation
University Transportation Centers
1200 New Jersey Avenue, SE
Washington, DC 20590
13. Type of Report and Period Covered
14. Sponsoring Agency Code
15. Supplementary Notes
Supported by a grant from the U.S. Department of Transportation, University Transportation Centers
Program.
16. Abstract
In this project, we refined an approach to using data collected by the City of Austin’s traffic monitoring
cameras to automatically identify pedestrian activities on roadways. Our approach automatically analyzes
the content of video data gathered by existing traffic cameras using a semi-automated processing pipeline
powered by state-of-art computing hardware and algorithms. The method also extracts a background
image at analyzed locations, which is used to visualize locations where pedestrians are present and
display their trajectories. We illustrate the use of a scalable tool for the automated analysis of data
collected from monocular traffic cameras that can allow agencies to leverage existing infrastructure in the
analysis and mitigation of pedestrian safety concerns with two use cases.
This work focuses on the following two major goals: 1) evaluation of pedestrian activities before and
after a pedestrian hybrid beacon device installation; and 2) assessment of pedestrian activities at new
locations. The specific activities can be further grouped into four tasks: Task 1: Pedestrian crossing
detection before and after PHB installation at Anderson location; Task 2: Recording and analysis of
pedestrian crossing event at Rundberg location; Task 3: Recording and analysis of pedestrian crossing at
Payton location; and, Task 4: Bus stop usage inferences at Payton location. In this report, we document
our efforts, findings, challenges, and achievements in this project
. 17. Key Words
Pedestrian activity, data analysis, pedestrian
crossing
18. Distribution Statement
No restrictions. This document is available to the public
through NTIS (http://www.ntis.gov):
National Technical Information Service
5285 Port Royal Road
Springfield, Virginia 22161 19. Security Classif.(of this report)
Unclassified 20. Security Classif.(of this page)
Unclassified 21. No. of Pages
22. Price
Form DOT F 1700.7 (8-72) Reproduction of completed page authorized
iv
Disclaimer
The contents of this report reflect the views of the authors, who are responsible for the
facts and the accuracy of the information presented herein. This document is
disseminated under the sponsorship of the U.S. Department of Transportation’s
University Transportation Centers Program, in the interest of information exchange. The
U.S. Government assumes no liability for the contents or use thereof.
Mention of trade names or commercial products does not constitute endorsement or
recommendation for use.
Acknowledgements
The authors recognize that support for this research was provided by a grant from the
U.S. Department of Transportation, University Transportation Centers.
.
Task 2019-17 Video Analytics for Vision Zero 3
FINAL REPORT
Prepared by the Center for Transportation Research at The University of Texas at Austin
for the City of Austin Transportation Department
COA/CTR Interlocal Agreement UTA16-000016, Task 2019-17
October 2020
Table of Contents Executive Summary ........................................................................................................................... 3
1. Introduction ............................................................................................................................. 4
2. Tasks Performed ...................................................................................................................... 5
2.1 Task 1: Pedestrian crossing detection before and after PHB installation at Anderson location .................................................................................................................5
2.2 Task 2: Recording and analysis of pedestrian crossing event at Rundberg location .............. 9
2.3 Task 3: Recording and analysis of pedestrian crossing at Payton location ........................... 11
2.4 Task 4: Bus stop usage at Payton location ............................................................................ 14
3. Challenges and Achievements ............................................................................................... 18
3.1 COVID-19 impact ................................................................................................................. 18
3.2 Achievements ........................................................................................................................ 18
4. Findings, summary, and discussion ....................................................................................... 19
References ........................................................................................................................................ 20
3
Executive Summary In Video Analytics for Vision Zero 3, we have continued to refine an approach to use data collected by the City of Austin’s traffic monitoring cameras to automatically identify pedestrian activities on roadways. Our approach automatically analyzes the content of video data gathered by existing traffic cameras using a semi-automated processing pipeline powered by state-of-art computing hardware and algorithms. The method also extracts a background image at analyzed locations, which is used to visualize locations where pedestrians are present and display their trajectories. We illustrate the use of a scalable tool for the automated analysis of data collected from monocular traffic cameras that can allow agencies to leverage existing infrastructure in the analysis and mitigation of pedestrian safety concerns with two use cases.
Our work has been focused on the following two major goals: 1) evaluation of pedestrian activities before and after a pedestrian hybrid beacon device installation; and 2) assessment of pedestrian activities at new locations. For the first goal, we have explored additional algorithms for the pedestrian tracking code, namely SORT, and refined our pedestrian detection by further limiting regions of interest. We have evaluated the SORT algorithm at Anderson Lane and Burnet Road (hereafter “Anderson location”). For the second goal, we have evaluated two additional locations, Lamar and Rundberg (hereafter “Rundberg location”) and Lamar Boulevard and Payton Gin Road (hereafter “Payton location”). The specific activities can be further grouped into four tasks: Task 1: Pedestrian crossing detection before and after PHB installation at Anderson location; Task 2: Recording and analysis of pedestrian crossing event at Rundberg location; Task 3: Recording and analysis of pedestrian crossing at Payton location; and, Task 4: Bus stop usage inferences at Payton location. In this report, we document our efforts, findings, challenges, and achievements for the below work tasks.
4
1. Introduction The rise in pedestrian fatalities in the US over the past few years has led many transportation agencies to refocus efforts on implementing proven safety countermeasures to improve pedestrian safety. As approximately 75 percent of pedestrian fatalities occur at mid-block locations, much focus is placed on strategies to facilitate safer pedestrian crossings. One such treatment, the pedestrian hybrid beacon (PHB), has been shown to reduce serious injury and fatal crashes by 15 percent and pedestrian crashes by nearly 70 percent [1]. Over the past decade the City of Austin has installed more than seventy-five PHBs at locations characterized by documented pedestrian demand, crash history, and long distances between safe crossing opportunities, among other factors. When studying potential PHB locations, the City has traditionally relied on manual observations to quantify pedestrian movements, such as the number of crossings over a given time period. However, manual observations provide information only for limited time periods, making it challenging to quantify the evolution of pedestrian behavior over time or in response to a treatment such as a PHB.
The collection and analysis of video data at critical locations provides an opportunity to analyze pedestrian movements and to provide a verifiable account of road user behavior. The former reduces the need to rely on ad hoc decision making [2]. However, if analyses are conducted by human observers, there is a limit to the number of locations and analysis periods that may be considered. Automated approaches to effectively recognize, analyze, and store pedestrian activities over time are needed. The technical challenges associated with pedestrian activity analysis using traffic monitoring video data are different from those faced when conducting traffic flow analyses. Regular roadside cameras have wide and deep fields of view. Pedestrian activities occupy only a small portion of the field, and at many locations are only present sporadically. Further, pedestrians appear smaller in size than cars and are more frequently subject to obstruction from other objects within the scene.
Incorporating Internet of Things (IoT) and smart devices within an intelligent transportation system (ITS) usually comes with substantial up-front costs for installation and deployment. At the same time, advances in algorithm development and software design bring new opportunities to increase utilization of existing transportation infrastructure. To address these challenges, we have continued developing a video processing pipeline [3] to improve pedestrian detection and tracking specifically. We have implemented additional features, including select areas of interest from the video frames, reporting additional measures of object detections, incorporating heuristics based on best practices, additional visualization summarization, and manual video curation utilities.
Beginning in Section 2, we describe the work according to task. Task 1: Pedestrian crossing detection before and after PHB installation at Anderson location; Task 2: Recording and analysis of pedestrian crossing event at Rundberg location; Task 3: Recording and analysis of pedestrian crossing at Payton location; and, Task 4: Bus stop usage inferences at Payton location. In Section 3, we describe other challenges and achievements during the past year of work. We conclude and discuss main findings in Section 4.
5
2. Tasks Performed
2.1 Task 1: Pedestrian crossing detection before and after PHB installation at Anderson location At the Anderson location, analyses were conducted before and after the activation of a PHB device that facilitates safe pedestrian crossings in the area, many of which are related to an active bus stop. We have applied our approach to compare pedestrian street-crossing patterns before and after at the intersection of Anderson Lane and Burnet Road (hereafter “Anderson location”) during the previous year. The aim for this year is to explore additional algorithms in order to improve the quality of pedestrian crossing detection. Table 1 Data collection summary for Anderson location
Anderson & Burnet Date Time range Sept. 19–21 (Wed.–Fri);
Sept. 29–Oct. 2 (Sat.–Tue.) Feb 12–15 (Tue.–Fri.); Feb 23–25 (Sat.–Mon.)
Average size per video file ~300MB ~300MB Total size 1300GB 1400GB
Average durations 15 mins 15mins
The time range and size of video recordings selected for computational analysis are summarized in Table 1. This task is a continuation from the prior year.
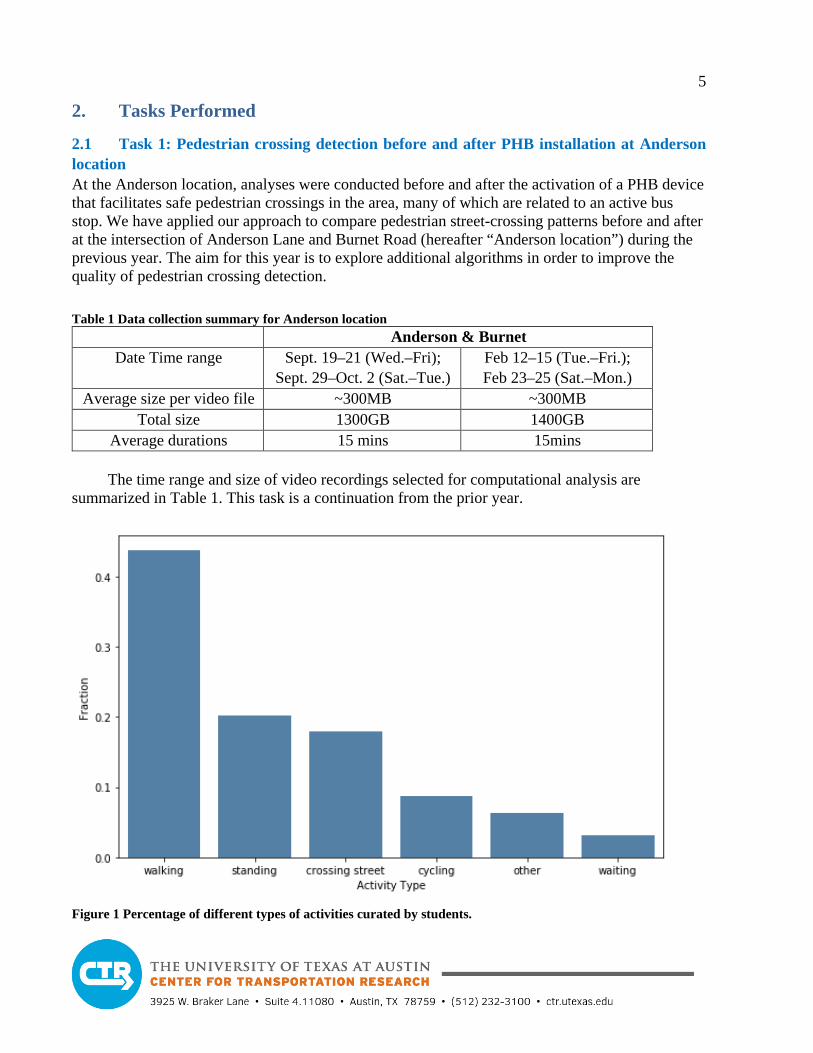
Figure 1 Percentage of different types of activities curated by students.
6
In addition to computational detection of pedestrian crossing events, we have asked students
to manually curate and count pedestrian crossing events. The purpose of student curation is to create ground truth data for evaluation of algorithm prediction and detections. There are 44 hours videos that have been curated: September 19, 2019; September 29, 2019; February 13, 2020; and, February 23, 2020 (partially finished). For each 15-minute video, the curation takes on average 0.57 hours to finish. There are five categories of activities: walking, standing, crossing, cycling, and waiting. There is also an “other category” for all other activities. Figure 1 shows the percentage of different types of activities curated by students.
To further understand the effectiveness of our approach, we explored an alternative algorithm approach, “Single Online and Real time Tracking” (SORT) [14]. The SORT algorithm identifies tracks in three steps as follows:
• Step 1: Track initialization. Pedestrians are assigned tracks at the start of the video or as new pedestrians enter the frame.
• Step 2: Track estimation: A forecast algorithm (Kalman filter) is used to predict the location of pedestrian in future frames based on velocity (requires a “burn-in” of a few frames).
• Step 3: Track association. Cost optimization (Hungarian algorithm) is used to associate pedestrians into tracks across frames based on the velocity forecast and overlap of bounding boxes.
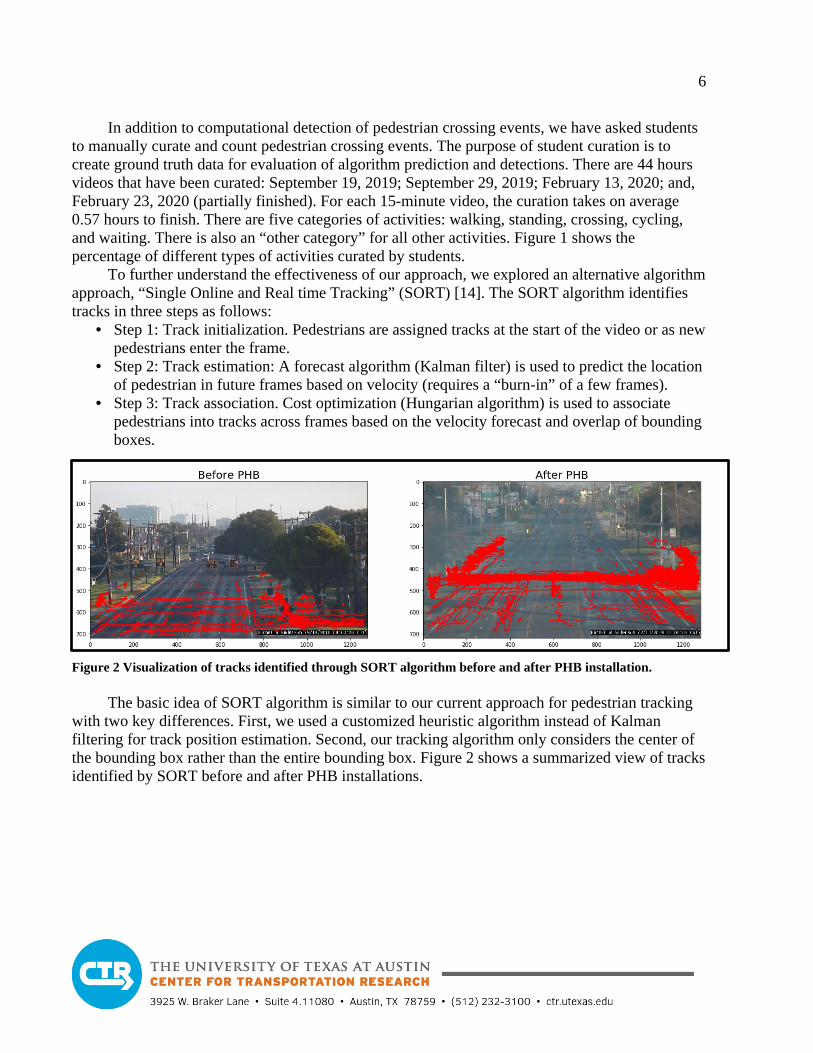
Figure 2 Visualization of tracks identified through SORT algorithm before and after PHB installation.
The basic idea of SORT algorithm is similar to our current approach for pedestrian tracking with two key differences. First, we used a customized heuristic algorithm instead of Kalman filtering for track position estimation. Second, our tracking algorithm only considers the center of the bounding box rather than the entire bounding box. Figure 2 shows a summarized view of tracks identified by SORT before and after PHB installations.
7
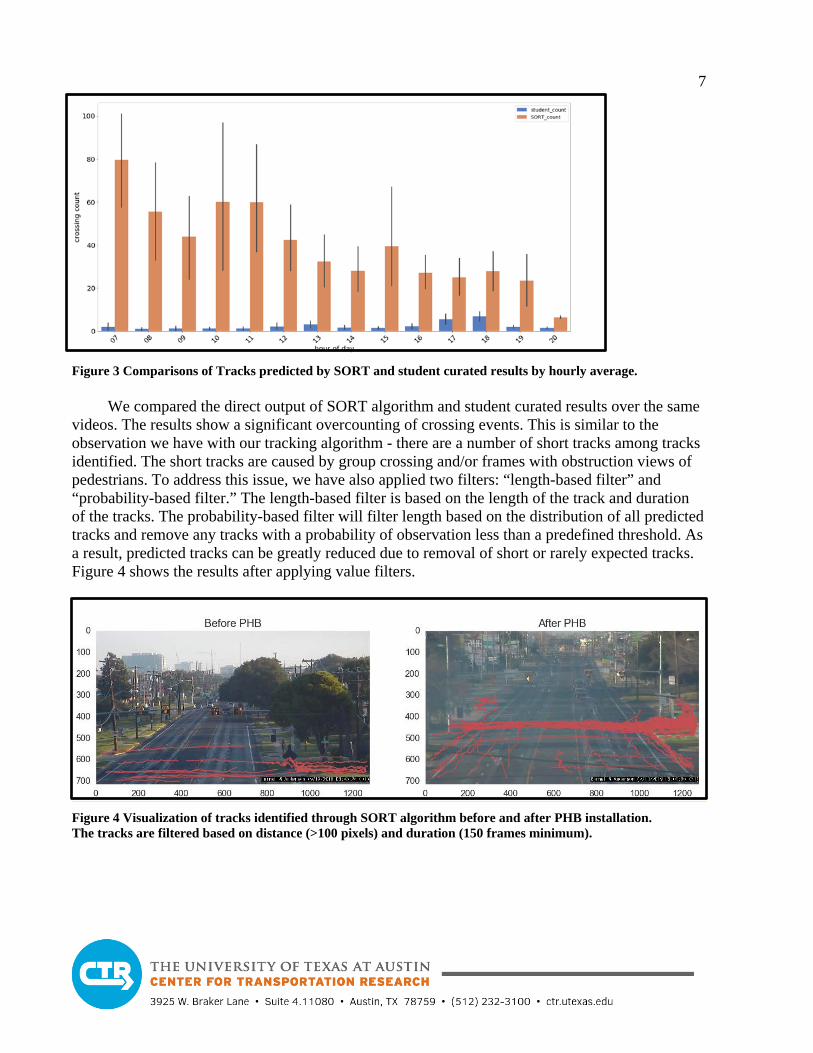
Figure 3 Comparisons of Tracks predicted by SORT and student curated results by hourly average.
We compared the direct output of SORT algorithm and student curated results over the same
videos. The results show a significant overcounting of crossing events. This is similar to the observation we have with our tracking algorithm - there are a number of short tracks among tracks identified. The short tracks are caused by group crossing and/or frames with obstruction views of pedestrians. To address this issue, we have also applied two filters: “length-based filter” and “probability-based filter.” The length-based filter is based on the length of the track and duration of the tracks. The probability-based filter will filter length based on the distribution of all predicted tracks and remove any tracks with a probability of observation less than a predefined threshold. As a result, predicted tracks can be greatly reduced due to removal of short or rarely expected tracks. Figure 4 shows the results after applying value filters.
Figure 4 Visualization of tracks identified through SORT algorithm before and after PHB installation. The tracks are filtered based on distance (>100 pixels) and duration (150 frames minimum).
8
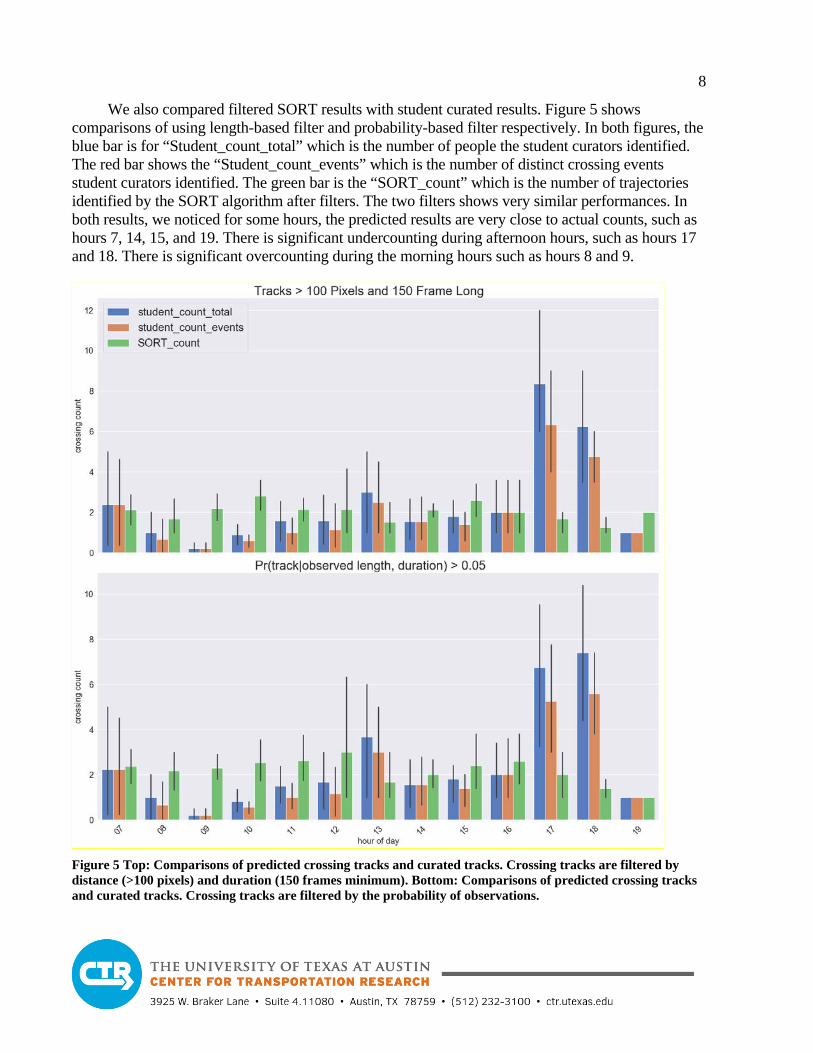
We also compared filtered SORT results with student curated results. Figure 5 shows comparisons of using length-based filter and probability-based filter respectively. In both figures, the blue bar is for “Student_count_total” which is the number of people the student curators identified. The red bar shows the “Student_count_events” which is the number of distinct crossing events student curators identified. The green bar is the “SORT_count” which is the number of trajectories identified by the SORT algorithm after filters. The two filters shows very similar performances. In both results, we noticed for some hours, the predicted results are very close to actual counts, such as hours 7, 14, 15, and 19. There is significant undercounting during afternoon hours, such as hours 17 and 18. There is significant overcounting during the morning hours such as hours 8 and 9.
Figure 5 Top: Comparisons of predicted crossing tracks and curated tracks. Crossing tracks are filtered by distance (>100 pixels) and duration (150 frames minimum). Bottom: Comparisons of predicted crossing tracks and curated tracks. Crossing tracks are filtered by the probability of observations.
9
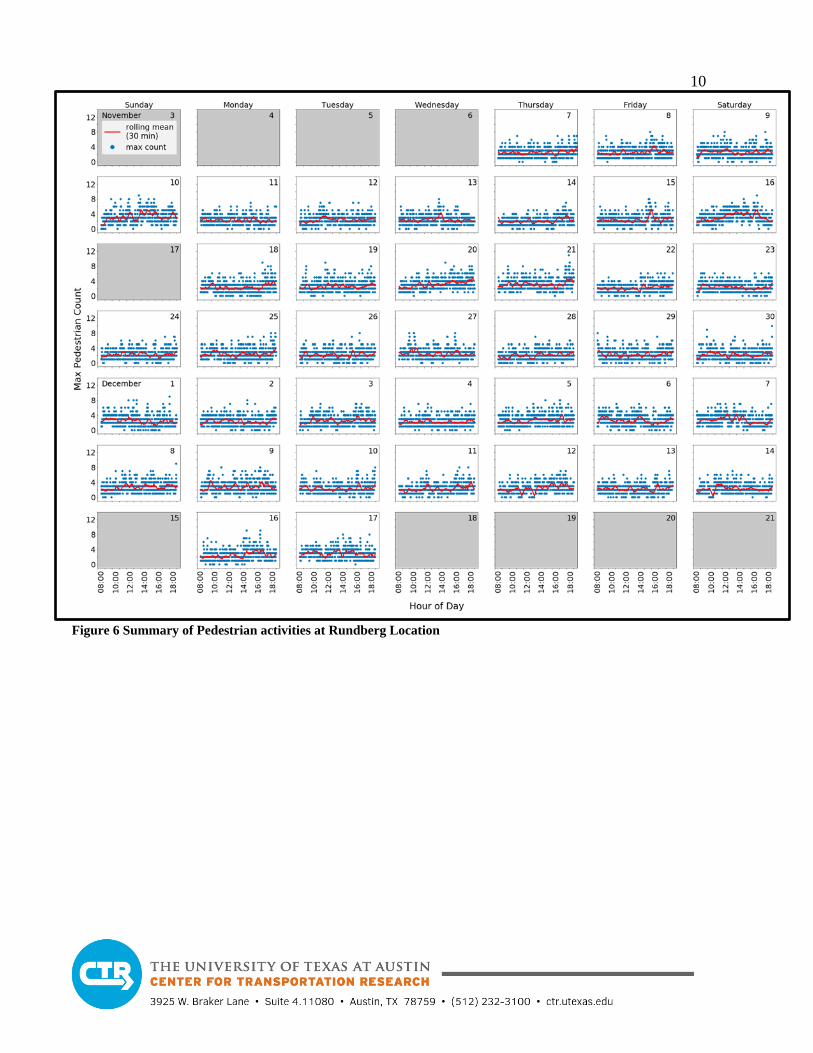
2.2 Task 2: Recording and analysis of pedestrian crossing event at Rundberg location We started video collection at the Rundberg location in March 2019. We have continued our video collection through November 2019. The Rundberg location analyses are focused on volume and location of pedestrian frequently crossing the street. This is an important step toward understanding the impact of measures designed to promote street crossing on designated safe areas, such as crosswalks. We have automated video captures in 15 minute intervals at each location during the period from November 07, 2019, to December 17, 2019. Since the camera angle and direction can be dynamically adjusted by staff at City of Austin for other purposes, video recordings that capture activity away from the location of interest to the case studies are discarded. There are 38 days with good recordings except 11/17/2019, 12/10/2019, and 12/15/2019. Additionally, there are several days during which we do not have full recordings, including 11/9, 11/26, 11/29, 12/12, and 12/14/2019. The rough time range and size of video recordings selected for computational analysis are summarized in Table 2.
Table 2 Recording summary at Rundberg location Lamar & Rundberg
Date Time range Nov. 07–Dec. 17 2019 Average size per video file ~600MB
Total size ~912GB Average durations 15 mins
The pedestrian activities for each day during the selected periods are summarized in Figure 6 at the Rundberg location. Each blue point shows the maximum number of pedestrians detected in any single frame in a one-minute slice of a video (where one minute is inferred from frame numbers given a 30fps framerate). The red line is a 30-minute rolling average over those maximum pedestrian counts. Pedestrians outside of the road are excluded from these counts. Figure 7 shows the combined view for each hour over all days.
10
Figure 6 Summary of Pedestrian activities at Rundberg Location

11
Figure 7 Pedestrian detection per 30-minute window for all days, color-coded by weekend or week days.
2.3 Task 3: Recording and analysis of pedestrian crossing at Payton location The Payton location is another location selected for a focused study on pedestrian crossing detections. We have accumulated roughly a month-long recording from 3/7/2020 to 4/8/2020. Most recordings were deemed usable between 10am to 8pm. The raw recording is about 40~50 GB per day, with a total of ~1.4TB total recorded video.
Figure 8 Visual summary results at Payton location during week days (03/09~03/13 and 03/16~03/19). The activities are colored for four time periods of the day: Yellow: 7-10 am; Green: 10:00-13:00; Blue: 13:00~16:00; Red: 16:00~19:00.
12
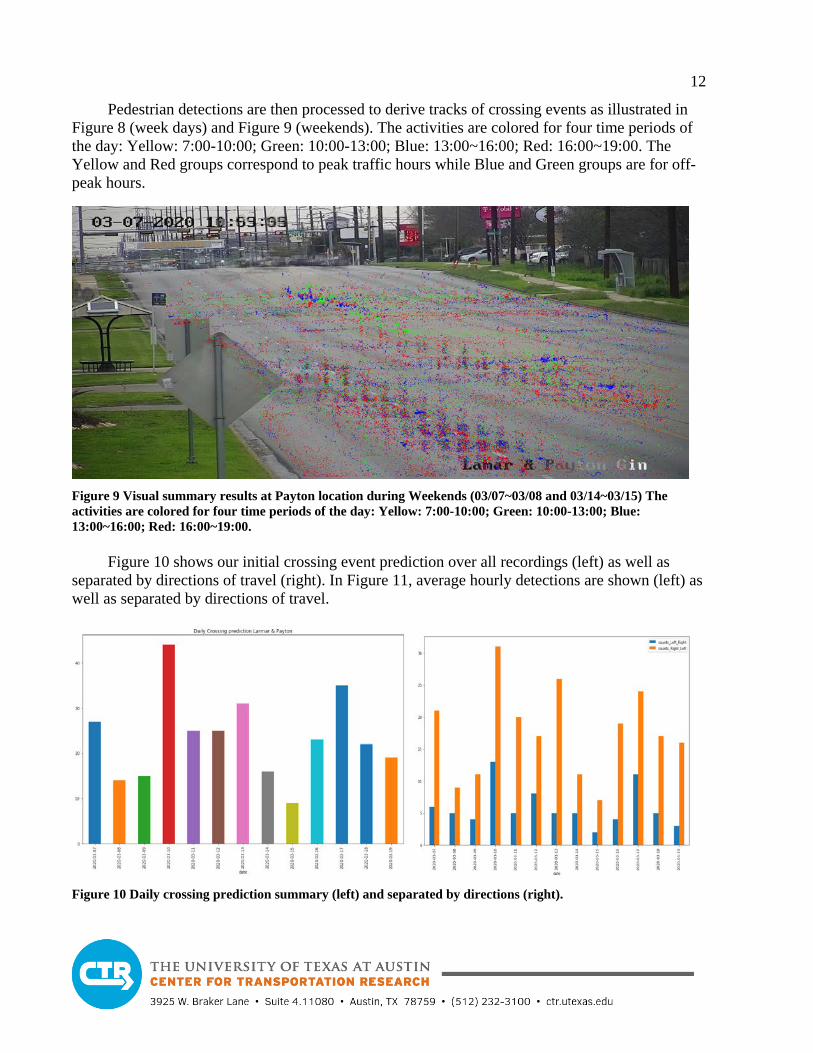
Pedestrian detections are then processed to derive tracks of crossing events as illustrated in Figure 8 (week days) and Figure 9 (weekends). The activities are colored for four time periods of the day: Yellow: 7:00-10:00; Green: 10:00-13:00; Blue: 13:00~16:00; Red: 16:00~19:00. The Yellow and Red groups correspond to peak traffic hours while Blue and Green groups are for off-peak hours.
Figure 9 Visual summary results at Payton location during Weekends (03/07~03/08 and 03/14~03/15) The activities are colored for four time periods of the day: Yellow: 7:00-10:00; Green: 10:00-13:00; Blue: 13:00~16:00; Red: 16:00~19:00.
Figure 10 shows our initial crossing event prediction over all recordings (left) as well as separated by directions of travel (right). In Figure 11, average hourly detections are shown (left) as well as separated by directions of travel.
Figure 10 Daily crossing prediction summary (left) and separated by directions (right).
13
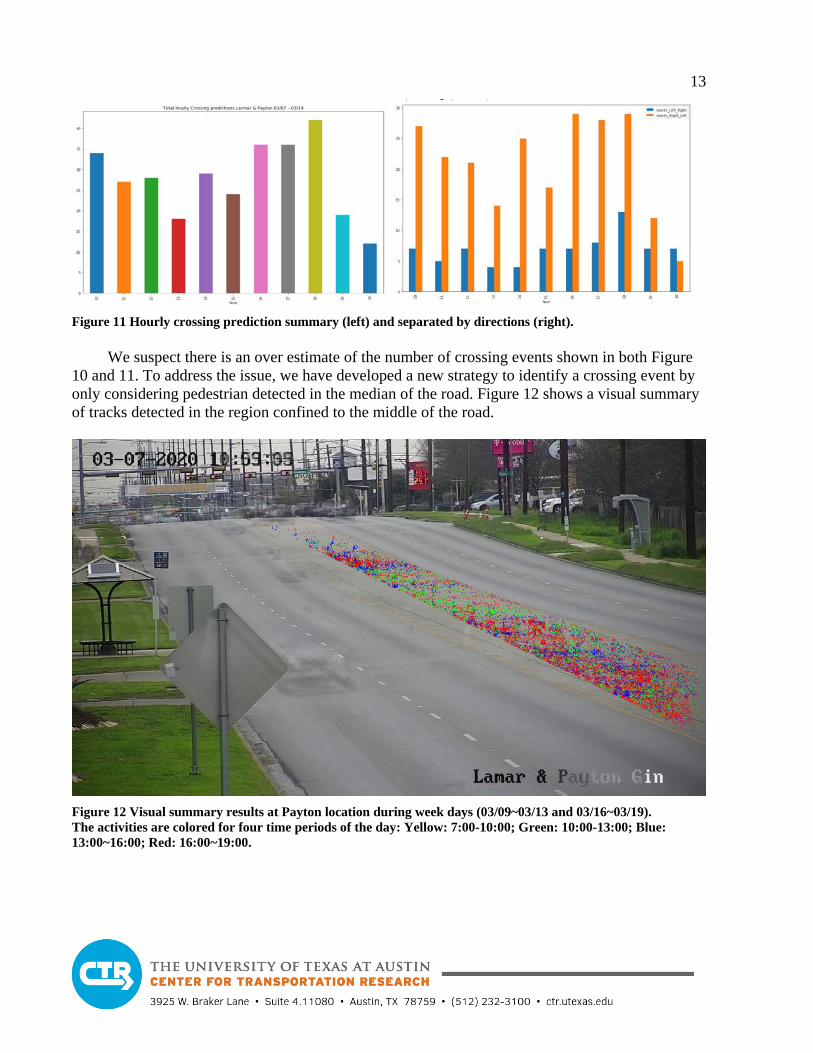
Figure 11 Hourly crossing prediction summary (left) and separated by directions (right).
We suspect there is an over estimate of the number of crossing events shown in both Figure 10 and 11. To address the issue, we have developed a new strategy to identify a crossing event by only considering pedestrian detected in the median of the road. Figure 12 shows a visual summary of tracks detected in the region confined to the middle of the road.
Figure 12 Visual summary results at Payton location during week days (03/09~03/13 and 03/16~03/19). The activities are colored for four time periods of the day: Yellow: 7:00-10:00; Green: 10:00-13:00; Blue: 13:00~16:00; Red: 16:00~19:00.
14
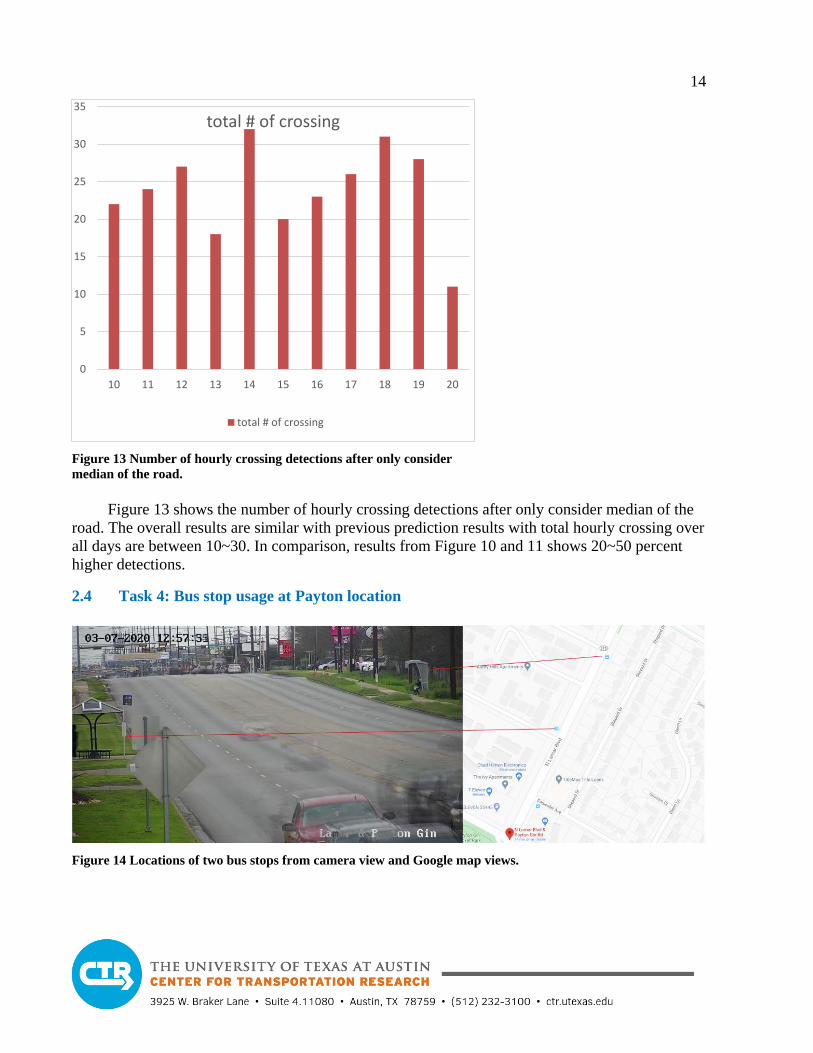
Figure 13 Number of hourly crossing detections after only consider median of the road.
Figure 13 shows the number of hourly crossing detections after only consider median of the road. The overall results are similar with previous prediction results with total hourly crossing over all days are between 10~30. In comparison, results from Figure 10 and 11 shows 20~50 percent higher detections.
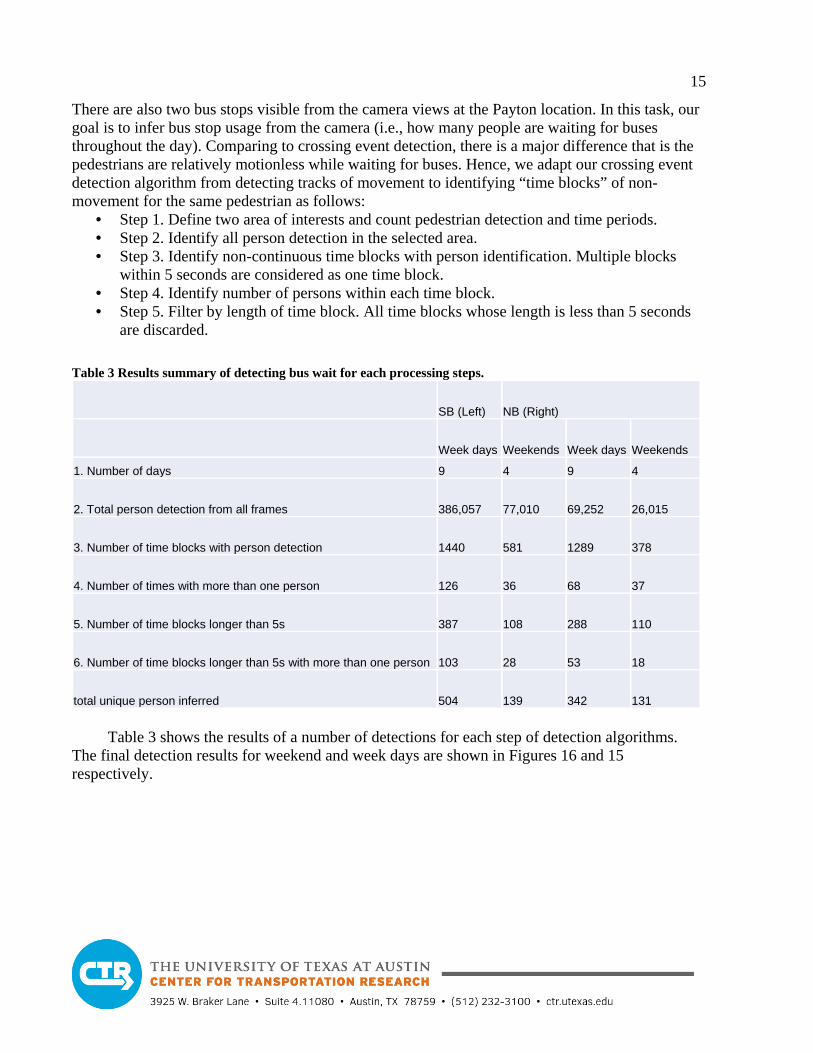
2.4 Task 4: Bus stop usage at Payton location
Figure 14 Locations of two bus stops from camera view and Google map views.
0
5
10
15
20
25
30
35
10 11 12 13 14 15 16 17 18 19 20
total # of crossing
total # of crossing
15
There are also two bus stops visible from the camera views at the Payton location. In this task, our goal is to infer bus stop usage from the camera (i.e., how many people are waiting for buses throughout the day). Comparing to crossing event detection, there is a major difference that is the pedestrians are relatively motionless while waiting for buses. Hence, we adapt our crossing event detection algorithm from detecting tracks of movement to identifying “time blocks” of non-movement for the same pedestrian as follows:
• Step 1. Define two area of interests and count pedestrian detection and time periods. • Step 2. Identify all person detection in the selected area. • Step 3. Identify non-continuous time blocks with person identification. Multiple blocks
within 5 seconds are considered as one time block. • Step 4. Identify number of persons within each time block. • Step 5. Filter by length of time block. All time blocks whose length is less than 5 seconds
are discarded. Table 3 Results summary of detecting bus wait for each processing steps.
SB (Left) NB (Right)
Week days Weekends Week days Weekends
1. Number of days 9 4 9 4
2. Total person detection from all frames 386,057 77,010 69,252 26,015
3. Number of time blocks with person detection 1440 581 1289 378
4. Number of times with more than one person 126 36 68 37
5. Number of time blocks longer than 5s 387 108 288 110
6. Number of time blocks longer than 5s with more than one person 103 28 53 18
total unique person inferred 504 139 342 131
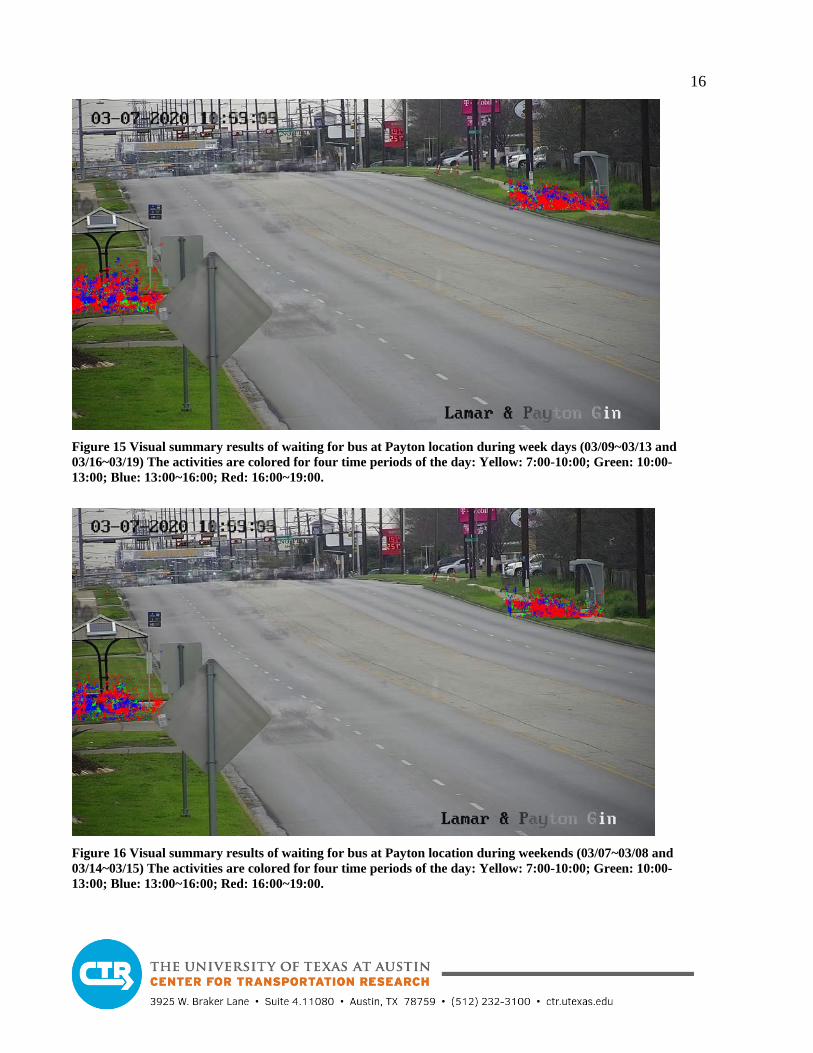
Table 3 shows the results of a number of detections for each step of detection algorithms.
The final detection results for weekend and week days are shown in Figures 16 and 15 respectively.
16
Figure 15 Visual summary results of waiting for bus at Payton location during week days (03/09~03/13 and 03/16~03/19) The activities are colored for four time periods of the day: Yellow: 7:00-10:00; Green: 10:00-13:00; Blue: 13:00~16:00; Red: 16:00~19:00.
Figure 16 Visual summary results of waiting for bus at Payton location during weekends (03/07~03/08 and 03/14~03/15) The activities are colored for four time periods of the day: Yellow: 7:00-10:00; Green: 10:00-13:00; Blue: 13:00~16:00; Red: 16:00~19:00.
17
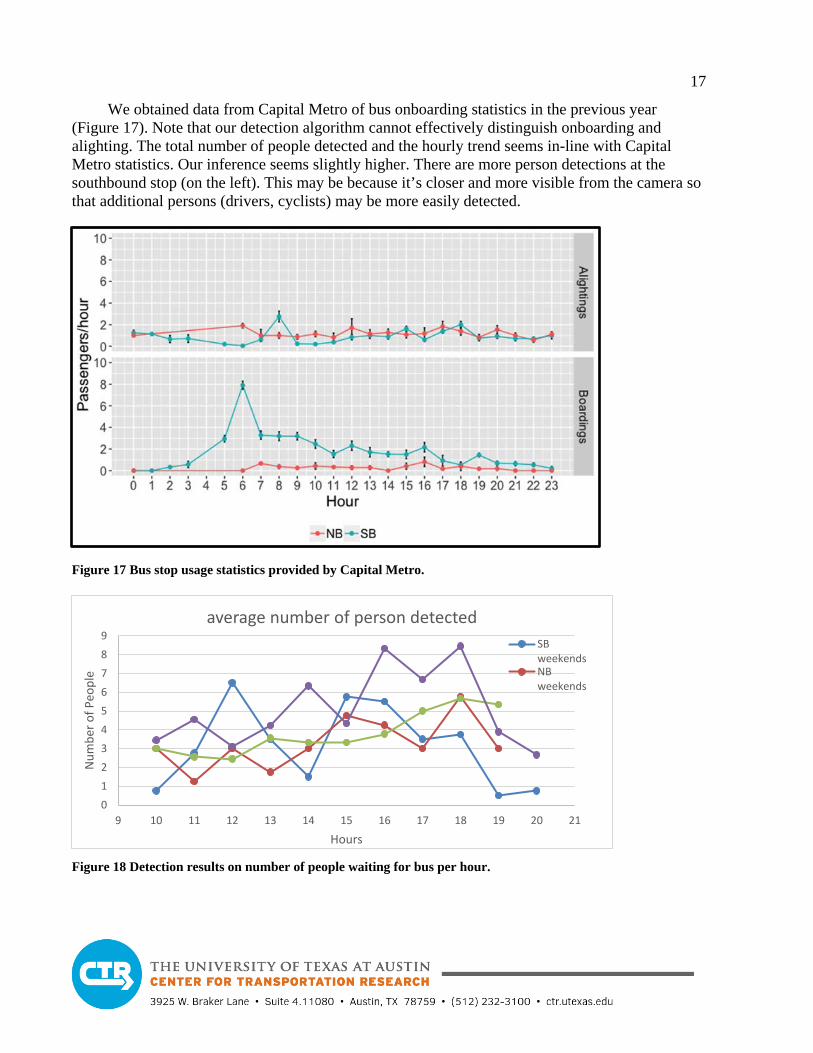
We obtained data from Capital Metro of bus onboarding statistics in the previous year (Figure 17). Note that our detection algorithm cannot effectively distinguish onboarding and alighting. The total number of people detected and the hourly trend seems in-line with Capital Metro statistics. Our inference seems slightly higher. There are more person detections at the southbound stop (on the left). This may be because it’s closer and more visible from the camera so that additional persons (drivers, cyclists) may be more easily detected.
Figure 17 Bus stop usage statistics provided by Capital Metro.
Figure 18 Detection results on number of people waiting for bus per hour.
0123456789
9 10 11 12 13 14 15 16 17 18 19 20 21
Num
ber o
f Peo
ple
Hours
average number of person detectedSBweekendsNBweekends
18
3. Challenges and Achievements
3.1 COVID-19 impact Our work progress has been directly impacted by COVID-19 in the following way: Our video recording pipeline was disrupted due to a change of network access policy and heightened security requirements on both the UT side (TACC and CTR) and at the City of Austin. As a result, we were unable to record over a longer period of time since May.
We were planning to finish the student curation on all videos at the Anderson location. However, due to school closures, the Vislab is no longer accessible to students. Therefore, the student curation was suspended. As a mitigation plan, we are working to move the curation process to be completed online.
Both computing resources utilizations and personnel priority have been affected by prioritized COVID-19 related work. This has caused delays in processing video recordings, data management as well software and website development since March.
3.2 Achievements We have published two papers during the past year:
1. Weijia Xu, Ruiz, N., K. Pierce., Huang, R., Meyer, J, Duthie, J. (2019). “Detecting Pedestrian Crossing Events in Large Video Data from Traffic Monitoring Cameras.” 2019 IEEE International Conference on Big Data (Big Data), Los Angeles, CA, USA, 2019, pp. 3824-3831, doi: 10.1109/BigData47090.2019.9005655.
2. Weijia Xu, Ruiz, N., Huang, R., Duthie, J., Meyer, J., Clary, J., (2019). “Deep learning methods to leverage traffic monitoring cameras for pedestrian data applications.” 26th ITS World Congress, Oct. 21-25, 2019, Singapore (Best Technical Paper Awards)
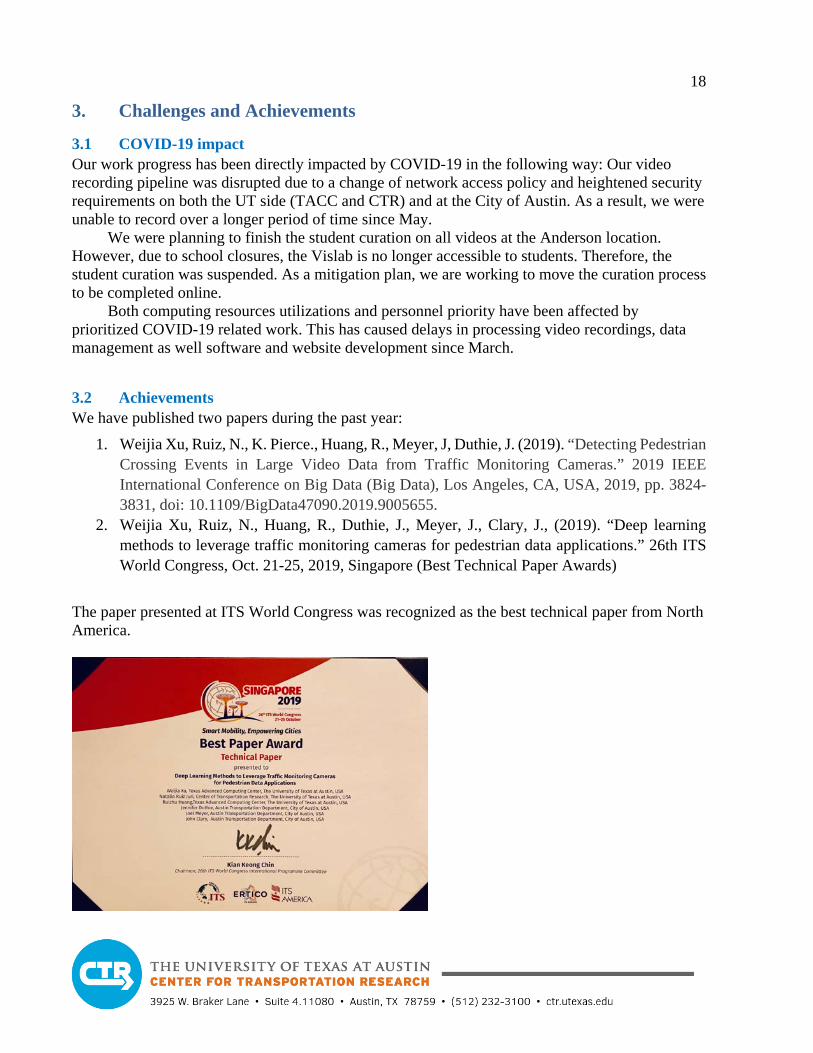
The paper presented at ITS World Congress was recognized as the best technical paper from North America.
19
4. Findings, summary, and discussion Our work has been focused on the following two major goals: 1) evaluation of pedestrian activities before and after a pedestrian hybrid beacon device installation; and 2) assessment of pedestrian activities at new locations. For the first goal, we have explored additional algorithms for pedestrian tracking code, namely SORT, and refined our pedestrian detection by further limiting regions of interest. We have evaluated the SORT algorithm at Anderson Lane and Burnet Road. For the second goal, we have evaluated two additional locations, Lamar Boulevard and Rundberg Lane and Lamar Boulevard and Payton Gin Road. The use case presented in this work illustrates the potential of implementing deep-learning methods to the study of pedestrian street-crossing patterns. We also propose several metrics of pedestrian activity to support the systematic analysis of before/after scenarios and the quantification of the benefits of pedestrian safety treatments. While preliminary, our results suggest that meaningful metrics may be automatically derived from data recorded by traffic monitoring cameras, which would enable agencies to conduct more thorough analyses on a larger number of locations.
Artificial intelligence technologies can greatly reduce the effort involved in analyzing video data, and frameworks such as the one presented here can facilitate research traditionally based on manual video data analysis and promote further work on video data applications and integration. A unique advantage of our framework is to convert video recordings into query-able information, which can accommodate multiple subsequent use cases without re-processing [3]. While the framework and specific applications are still under development, we have demonstrated their potential to support useful analyses with minimal effort when compared to manual processing.
20
References 1. FHWA. Proven Safety Countermeasures: Pedestrian Hybrid Beacons.
https://safety.fhwa.dot.gov/provencountermeasures/ped_hybrid_beacon/. 2. Sayed, T., M. H. Zaki, J. Autey (2013). Automated safety diagnosis of vehicle–bicycle interactions using
computer vision analysis, Safety Science, vol. 59, pp. 163–172.3. Xu, W., N. Ruiz Juri, R. Huang, J. Duthie, J. Clary (2018). Automated pedestrian safety analysis using
data from traffic monitoring cameras. In Proceedings 1st ACM/EIGSCC Symposium On Smart Cities andCommunities, Portland, OR. ACM (New York, USA).
4. Kastrinaki, V., M. Zervakis, K. Kalaitzakis (2003). A survey of video processing techniques for trafficapplications, Image and Vision Computing, vol. 21, issue 4, pp. 359–381.
5. Kuciemba, S., K. Swindler (2016). Transportation Management Center Video Recording and ArchivingBest General Practices. Federal Highway Administration report no. FHWA-HOP-16-033.
6. Zangenehpour, S., L. F. Miranda-Moreno, N. Saunier (2015). Automated classification based on videodata at intersections with heavy pedestrian and bicycle traffic: methodology and application.Transportation Research Part C: Emerging Technologies, vol. 56, pp. 161–176.
7. Hu, W., X. Xiao, D. Xie, T. Tan, S. Maybank (2004). Traffic accident prediction using 3-D model-basedvehicle tracking. IEEE Transactions on Vehicular Technology, vol. 53, issue 3, pp. 677–694.
8. St. Aubin, P., L. Miranda-Moreno, N. Saunier (2013). An automated surrogate safety analysis atprotected highway ramps using cross-sectional and before-after video data. Transportation Research PartC: Emerging Technologies, vol. 36, pp. 284–295.
9. St. Aubin, P., N. Saunier, L. Miranda-Moreno (2015). Large-scale automated proactive road safetyanalysis using video data. Transportation Research Part C: Emerging Technologies, vol. 58, part B, pp.363–379.
10. Morris B. T., M. M. Trivedi (2008). A survey of vision-based trajectory learning and analysis forsurveillance. IEEE Transactions on Circuits and Systems for Video Technology, vol. 18, issue 8, pp.1114–1127.
11. Morris B. T., C. Tran, G. Scora, M. M. Trivedi, M. J. Barth (2012). Real-time video-based trafficmeasurement and visualization system for energy/emissions. IEEE Transactions on IntelligentTransportation Systems, vol. 13, issue 4, pp. 1667–1678.
12. Huang, L., W. Xu, S. Liu, V. Pandey, N. Ruiz Juri (2017). Enabling versatile analysis of large scaletraffic video data with deep learning and HiveQL. In Proceedings 2017 IEEE International Conferenceon Big Data (Big Data), Boston, MA.
13. Redmon, J, S. Divvala, R. Girshick, A. Farhadi (2016). You Only Look Once: Unified, Real-Time ObjectDetection. In Proceedings IEEE Conference on Computer Vision and Pattern Recognition, Las Vegas,NV.
14. Bewley, Alex, Zongyuan Ge, Lionel Ott, Fabio Ramos, and Ben Upcroft. "Simple online andrealtime tracking." In 2016 IEEE International Conference on Image Processing (ICIP), pp.3464-3468. IEEE, 2016.