Embed Size (px)
Citation preview

Verizon Communications 2005 Annual Report

In keeping with Verizon’s commitment to protecting the environment, this Annual Report is printed on recycled paper. Information about our environmental initiatives– including energy conservation, reducing greenhouse gas emissions, waste reduction and recycling – can be found on our website (www.verizon.com) by clickingon “About Verizon” and selecting “Verizon and the Environment.”
Consolidated Revenues(billions)
2003 2004 2005
Cash Flow from Operations(billions)
2003 2004 20050
10
20
Total Debt(billions)
2003 2004 20050
20
40
Dividends per Share
2003 2004 20050.0
1.0
2.0
0
20
40
60
80
With more than $75 billion in annual revenues in 2005, Verizon Communications is one of the world’s leading providers of communications services.
—$22 billion in Cash Flows From Operations
—Reported earnings of $2.65 per diluted share
—105.3 million total customer connections (wireline, wireless and broadband)
—#1 in customer satisfaction for Verizon Wireless, American Customer Satisfaction Index
—Top-ranked “major communications performer” in J.D. Power Customer Satisfaction Survey
—Numerous awards and “best of” lists, including Latina Style, DiversityInc, CIO Magazine, Hispanic
Magazine, and Frost & Sullivan Product Innovation Awards
Domestic TelecomProvider of wireline and other telecommunications services, including broadband
— Revenues of $37.6 billion— Serving nearly 30 million wireline households
throughout the United States— 5.1 million broadband connections — Deploying the most advanced broadband network,
including video, in the U.S.
Verizon WirelessLeading wireless services provider with the nation’smost reliable wireless network
— Revenues of $32.3 billion— 51.3 million customers across the United States— Industry leader in customer loyalty, profitability
and customer growth— Leading innovator in wireless services, including
broadband, video and music
Verizon Communications
Information ServicesProvider of print, Internet and wireless yellow pagesdirectories and related shopping information
— Revenues of $3.5 billion— Publishes more than 1,300 Verizon directory titles with a
total circulation of approximately 121 million copies in theU.S., and 8 million internationally
— Verizon SuperPages.com is an advanced Internet directoryand online shopping resource
— In December 2005, Verizon announced that it is exploringdivesting Verizon Information Services through a spin-off,sale or other strategic transaction
InternationalWireline and wireless operations and investments in theAmericas and Europe
— Revenues of $2.2 billion— Ownership and management interests in:
• Verizon Dominicana • Puerto Rico Telephone • CANTV • Vodafone Omnitel
(all data as of December 31, 2005)

1
putting our customers first
At Verizon, we believe that the power of communications canhave a profound effect on people’s lives. That’s why our highlyskilled and dedicated workforce is motivated to put our cus-tomers first by delivering all the benefits of the wireless, wirelineand multimedia services that consumers and businessesdemand. We want our customers to enjoy a seamless commu-nications experience, at home, in the office and on the road,that connects them to the things that matter most – whereverthey are and whenever they want.
Verizon has 105 million customer connections – the totalof our switched access lines, broadband connections and wire-less subscribers – that provide the richer, deeper and broader
experiences that customers are demanding from their commu-nications providers. Our long history of service and reliabilitymakes us the customer’s trusted guide in this new and con-stantly changing world of communications, and we believe thatthe best way to deliver long-term shareowner value is to firstdeliver a superior customer experience.
Providing great service to customers is our number-onepriority. It’s who we are and why we exist. We come to workevery day trying to do our job better than we did yesterday. Ourslogan, “we never stop working for you,” expresses the centralspirit of Verizon’s philosophy of total accountability for satisfy-ing our customers.
VERIZON COMMUNICATIONS INC. 2005 ANNUAL REPORT
2
Ivan Seidenberg, Chairman and Chief Executive Officer
delivering growththrough transformation
network. Over the years, we haveinvested steadily in fiber backbones, dig-ital switching, and higher-bandwidthcapabilities such as DSL, which havegiven us a growing foothold in broad-band. In 2005, we took another big stepto transform this business by deployinga unique fiber architecture to the homethat enables us to provide super-high-speed Internet access and enter thevideo market. This fiber network nowpasses 3 million customers, with another3 million targeted for 2006.
The power of networks also underliesour approach to the business and gov-ernment market, where we dramaticallyimproved our competitive positionthrough our acquisition of MCI. Thistransaction gives us the global reach,Internet backbone, customer relation-ships and product portfolio to be a trulymajor player in this marketplace. Weclosed this transaction in January 2006and immediately launched our newVerizon Business unit, which is poised tobecome one of the premier global serv-ice providers in the marketplace.
Verizon now has the technology baseto grow the way other high-tech compa-nies do: through innovation. We are intro-ducing more new products in the markettoday than at any time in our history –from broadband products for every mar-ket niche, to Internet voice services, tonew wireless video and music products,to on-line games, and more.
We built our company to stand at thecenter of that digital marketplace.
Verizon is investing in the technologywe need to compete and grow. We areusing that technology to expand our rev-enue base and produce real innovationfor customers. Our strategy is to createour future in the digital world – and in2005, we saw that strategy take root.
Preparing to Lead in the Digital WorldWe are using technology investment toposition each of our major businesses tobenefit from the growth trends that aretransforming our industry.
At Verizon Wireless, we moved aheadof the rest of the industry to gain anational footprint and invested early on in a network that gave us an edge inquality and efficiency. We also were a firstmover in wireless broadband, launchingour high-speed network ahead of the rest of the industry and carving out a premium position in the fast-growingmarkets for wireless data, video andmusic. Our wireless broadband networknow covers half the United States. The result of this approach is that, ratherthan slowing down as competition in wireless ramps up, we have acceler-ated our momentum – gaining marketshare, improving profitability and turning in quarter after quarter of industry-leading results.
As we’ve done in wireless, we areusing technology transformation to cre-ate competitive advantage in our wired
The good news is, customers areresponding and our operating and finan-cial results are strong.
2005 Operating and Financial ResultsRevenues were $75 billion in 2005, up5.4 percent over 2004. In the last fouryears, we have expanded our revenuebase by $8.6 billion through our focus ongrowth businesses such as wireless, con-sumer broadband and high-speed busi-ness data products. Leading the way wasVerizon Wireless, which grew revenues by16.8 percent – an extraordinary perform-ance for a business with more than $30billion in revenues. We saw strong growthin consumer broadband and high-speeddata services in our Telecom business,which is helping us manage the impact oftechnology substitution and competitionin our traditional business.
We also turned in a solid financial per-formance in 2005. Reported earnings forthe year were $7.4 billion, or $2.65 perdiluted share. After adjustments for one-time and special items, earnings grew 1.6percent over 2004. Our operating busi-nesses generated $22 billion in cash forthe year, which enabled us to invest $15.3billion in capital, reduce debt by $300 mil-lion, and pay $4.4 billion in dividends toshareowners. In the last five years, wehave reduced total debt by $18.8 billion,making our balance sheet as strong todayas at any time in our history.
Fellow shareowners:
When we created Verizon in 2000, we had at our core a belief that investing in technology was the key tocreating value in communications. As services like video, photos, data, music and games converged ontobroadband networks, we knew that businesses and consumers would demand access to this surge of digitalcontent – creating huge new markets for companies whose networks could transport all those bits andbytes, make them work together and help make customers’ lives simpler, richer and more productive.

37.543.8
TBD
2.33.6
TBD
2.33.6
TBD
Wireless Subscribers(millions)
2003 2004 20050
20
40
60
Broadband Subscribers(millions)
2003 2004 20050
2
4
6
Revenue Growth(billions)
2003 2004 200540
50
60
70
80
3
VERIZON COMMUNICATIONS INC. 2005 ANNUAL REPORT
Putting Customers FirstOf course, the way to make a companymore valuable to investors is by making itmore valuable to customers – not justthrough its products, but also through itspeople, reputation and commitment toservice. In 2005 we formalized our “cus-tomer first” commitment and aligned ouremployees around our core values ofintegrity, respect, performance excellenceand accountability.
Our employees are proud to be part ofa company that’s taking charge of its ownfuture. They are passionate about puttingcustomers first. They hold one another –and themselves – accountable for deliver-ing outstanding service with the highestof ethical standards. And just as they’vedone throughout our history, our peoplecame through for their neighbors in timesof crisis. Whether it was responding tothe tsunami in Asia or Hurricane Katrinaon the Gulf Coast, Verizon employeescontinue to demonstrate the moral fiberand can-do spirit that is built into thefoundation of our company.
We are grateful to the members of ourBoard of Directors, who have steadfastlysupported our investments in technol-ogy. We’re confident in our pathway tothe future. We’re excited about gettingon the right side of the big ideas that arepushing our industry forward. And withevery step we take toward becoming thepremier broadband, wireless and multi-media company in the industry, we knowwe are creating a better future for ourpeople and a more valuable company forour shareowners.
Ivan G. SeidenbergChairman and Chief Executive Officer
In 2005, we added millions of newcustomers across our business. VerizonWireless had another record-settingyear, adding 7.5 million new customers,for a total of 51.3 million. We also had arecord-setting year in broadband, adding1.7 million customers, for a total of 5.1 million.
We continue to focus on what mattersto customers. Verizon Wireless set new
standards of excellence for the wirelessindustry, leading the league in customerloyalty, network reliability and quality.Both our landline and wireless compa-nies rank tops in our categories inAmerican Customer Satisfaction and J. D. Power surveys, and our brand isregularly named by consumers as number one in our industry.
Looking ahead, we will continue tofocus our resources on our network busi-nesses. To that end, we announced thatwe are exploring the divestiture of ourvaluable Verizon Information Servicesunit. We also are making some toughchoices to secure our place in the future.For example, in 2005 we announced thatwe are making changes to retirementbenefits for management employees,which will be effective July 1, 2006.These changes (which do not affect pen-sions or benefits for current retirees) willhelp align benefit plans for managementemployees across the company, addressunpredictable and escalating costs, andput Verizon on a more stable competitivefooting going forward.
The bottom line is that we entered2006 in a strong financial position, withconsistent revenue growth, solid marginsand cash flows, and a strong balancesheet.
Unfortunately, 2005 was a difficultyear for Verizon’s stock. Our total returnfor the year was down 22.2 percent.This is both disappointing and frustratingfor us. Investors have told us that they
are concerned with the effect of compe-tition and technology substitution in ourtraditional business, the heavy capitalinvestment we’re making in broadband,and the potential uncertainty created in2005 by the pending MCI transaction.
2006 will be an important year for usto demonstrate that we can use ourcapital to produce results in the market-place and growth for shareowners. Ourpeople are up to the challenge. In fact,as I visit employees around Verizon, I amstruck by their commitment to our strat-egy and their conviction that our tech-nology investments are creating a morevaluable company.
Together, we will marshal that convic-tion to deliver results that will build thatsame kind of confidence and optimismamong investors.
Verizon now has the technology base togrow the way other high-tech companies do:through innovation.

4
giving customers more choiceAround the block or around the globe, the power and intelli-gence of Verizon’s high-tech networks give customers morechoice of communications services, both now and in the future.Our networks touch more customers in a day than many com-panies do in an entire year. We will begin 2006 serving morethan 51 million wireless customers, nearly 30 million wirelinehouseholds, 134,000 large business customers, and thou-sands of schools, libraries, universities and government officesall over the United States and the world.
Verizon is the industry leader in wireless, broadband andglobal communications networks because we continue toinvest in the advanced infrastructure necessary to deliver supe-
rior products and services to customers with a growingappetite for innovation.
Innovative products and great customer service helpedVerizon Wireless add a record 7.5 million new subscribers lastyear, with the highest customer loyalty in the industry. Our sub-scribers enjoy the most reliable wireless network in the country,as well as the most widely available wireless broadband net-work in the country.
In the residential market, Verizon is giving customers a bet-ter choice for broadband and video services. Our newstate-of-the-art fiber network, which takes fiber-optic technologyall the way to customers’ homes and businesses, is the most

5
in communications servicesadvanced broadband network being deployed in America today.Our fiber network provides customers with blazing fast Internetconnections and over 400 channels of 100 percent digital video.
In addition, our merger with MCI earlier this year has madeVerizon a leading global provider of advanced communicationssolutions to the business and government marketplace. Weown and operate one of the most expansive end-to-end globalInternet Protocol (IP) networks. This infrastructure includesover 270,000 domestic and 360,000 international route milesof fiber-optic cable, provides next-generation IP network serv-ices to medium and large businesses and governmentcustomers, and offers access to over 140 countries.
Our investments in fiber, wireless broadband and global IPnetworks have made us a strong competitor in the convergedcommunications marketplace. But what really sets us apart isour ability to integrate these network strengths to improve effi-ciencies and provide better value to our customers.
As technology and competition continue to evolve, ourcustomers will find new and exciting ways to connect with eachother. To satisfy the needs of a constantly changing market-place, we’re focused on delivering the best customerexperience possible. Our quality networks, innovative products,reliable service and great value will continue to make Verizonthe first choice in communications.
VERIZON COMMUNICATIONS INC. 2005 ANNUAL REPORT
6
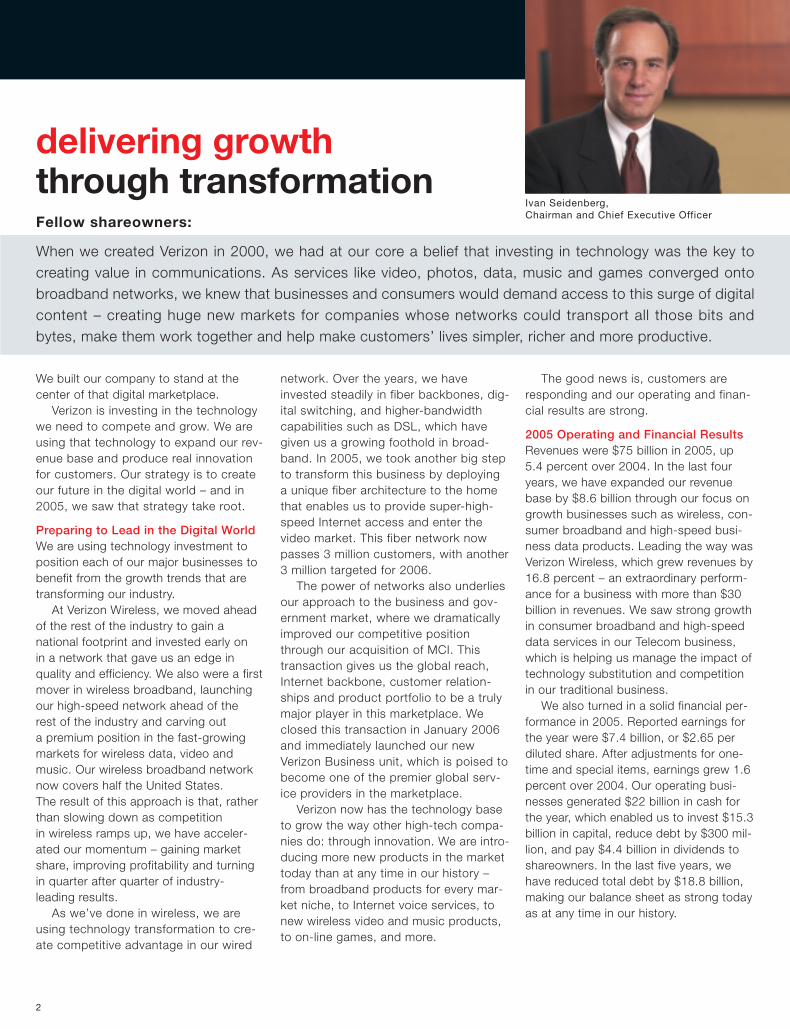
creating the nation’s most advanced The growth of the Internet has created a digital world ofmovies, photos, music and other data that can now be carriedover broadband networks and delivered to a wide variety ofelectronic devices. Verizon is at the center of this convergingmarketplace. As a result of Verizon’s investment in advancedbroadband networks, we can capture this digital content, makeit all work together and then deliver it to whatever device thecustomer wants.
Verizon has created the best all-around value in broad-band today. We offer a speed for every need, a price for everybudget, along with unsurpassed content and applications fortoday’s digital household. We put customers first with excellent
service and a continuously growing portfolio of broadbandservices delivered over reliable, advanced networks.
Verizon offers a choice of high-speed DSL Internet serviceplans, and Verizon Online DSL customers also have a choice ofWeb portals featuring a wide array of content, such as onlinesecurity, entertainment and multiple mail accounts.
In 2004, Verizon began rolling out our groundbreakingfiber network, featuring an advanced technology that usesfiber-optics instead of copper wire as the direct connection tohomes and businesses. By the end of 2005, Verizon’s fiber net-work passed 3 million homes and was deployed in close to 800communities in more than half the states that we serve. We

7
broadband networksplan to pass an additional 3 million homes by the end of 2006,covering around 20 percent of our residential customer base.
Verizon FiOS is the new suite of broadband servicesoffered over this network. It gives customers a broad array ofvoice and data applications and delivers Internet access atblazing fast speeds of up to 30 megabits per second, with evengreater speeds possible in the future.
But FiOS is more than just a super-fast Internet connec-tion. We’ve harnessed the speed and capacity of broadbandwith the power of broadcast to create a revolutionary newentertainment experience. FiOS TV offers a simple, compellingand affordable package, and is designed to be a superior alter-
native to cable and satellite TV. We offer over 400 all-digitalchannels, more than 20 high-definition channels and 2,000video-on-demand titles. Delivered over our high-speed fibernetwork, FiOS TV displays amazingly sharp pictures that seemto leap from the TV screen.
FiOS Internet and FiOS TV are redefining and enriching thebroadband experience for customers. Our fiber network pro-v ides unprecedented power to today’s mul t i - task inghousehold and is changing the way America communicates.And for Verizon, it will be a platform for long-term growth as wetransform our business around the expanding opportunities inbroadband and multimedia.
VERIZON COMMUNICATIONS INC. 2005 ANNUAL REPORT
Verizon Online DSL
ESPN’S NFL Primetime

8
providing the nation’s most reliableVerizon Wireless is committed to offering customers the mostreliable service on the nation’s best wireless voice and datanetwork. We’ve been recognized consistently as a leader in theU.S. wireless industry for our superior network coverage, prod-ucts and services, as well as for our outstanding customersupport. In 2005, Verizon Wireless posted the lowest customerchurn rate – an indicator of customer loyalty – among nationalcarriers. We provide customers with the highest level of satis-faction by offering quality products and innovative services, andwe proudly stand behind our motto: “we never stop working for you.”
Verizon Wireless has been a strong growth engine for thecorporation and keeps getting better with time. In 2005, our
solid business fundamentals and innovative new serviceshelped add a record number of new subscribers while deliver-ing strong revenue growth and healthy margins. Best of all, wehave a business culture that is driven to deliver continuousimprovement and innovation year after year.
A major development in 2005 was Verizon’s continuedexpansion of the largest wireless high-speed broadband net-work in the U.S., now available to 150 million Americans in 180major metropolitan areas coast to coast. Mobile professionalscan be more productive outside of the office withBroadbandAccess service from Verizon Wireless, which offersusers DSL-comparable speeds. BroadbandAccess provides
8

9
wireless networkmobile workers access to their corporate information just as ifthey were attached to a high-speed wired connection, but withthe freedom of true mobility.
V CAST, also available on the Verizon Wireless broadbandnetwork, is the nation’s first wireless multimedia service forconsumers. Launched in early 2005, V CAST delivers crystalclear on-demand content such as short broadcasts, 3D games,and music videos from news and entertainment sources andother innovative content providers.
Verizon Wireless continued its reputation for innovation byintroducing the world’s most comprehensive music service, V CAST Music, in early 2006. This service offers customers the
ability to download a wide variety of music over the air directlyto their wireless phones or straight to their computers. V CASTMusic from Verizon Wireless gives customers immediateaccess to songs from well-known artists and lets customersplay music on their wireless phones – the same device theyhave come to rely upon for entertainment, information andmobile communication.
V CAST Music is the mobile music experience that con-sumers have been craving. It further emphasizes the leadershiprole Verizon plays in bringing customers the entertainment con-tent they want and the mobility they need in today’s fast-pacedworld.
9
VERIZON COMMUNICATIONS INC. 2005 ANNUAL REPORT

10
providing innovative business solutions
The completion of the Verizon and MCI merger on January 6,2006 created a strong competitor for advanced communica-tions services by enhancing Verizon’s ability to deliverconverged communications across the country and around theworld. The new unit – called Verizon Business – leverages thepower of the global MCI network and the reach of Verizon’sbroadband and wireless networks in the U.S.
We now employ a highly trained and experienced globalforce of sales and service professionals in hundreds of salesoffices around the world. We own and operate one of the mostexpansive end-to-end global IP networks. This infrastructureincludes over 270,000 domestic and 360,000 international
route miles of fiber-optic cable, provides next-generation IP network services to medium and large businesses and gov-ernment customers, and offers access to over 140 countries.
The launch of Verizon Business is a game-changing event,for us and our customers. Verizon now serves 94 percent of theFortune 500 largest companies and is the leading communica-tions provider for the federal government. In addition, we are amarket leader in key industry segments including financial serv-ices, retail, manufacturing, health care, state and localgovernment, and education. Verizon Business now enablesthese business and government customers to seamlessly linktheir offices – by means of an advanced, cost-effective high-
10

1111111111
over our IP network
speed data and voice network – down the street, across thenation or around the world.
Verizon Business also provides the clear advantages of asingle source for the full range of end-to-end services. Weoperate one of the world’s most connected global Internetbackbone networks. Our expansive IP footprint, coupled withour direct interconnections in major metropolitan areas acrossthe country, enables customers to reach more destinationsthan any other carrier.
We will use our global reach, local presence and unsur-passed combination of wireless and wireline capabilities to be asingle-source provider of complete local-to-global business
continuity solutions. We’ve introduced a new suite of servicesthat integrate the capabilities of our wired and wireless net-works to enable workforce mobility and maintain uninterruptedbusiness operations. The new offerings demonstrate the bene-fits of the merger by combining the power of Verizon Wireless,America’s most reliable network, with the Verizon Businessglobal IP network.
Verizon Business in uniquely positioned to help move theindustry forward. Our new innovative global network, deep IPexperience and broad set of product offerings will yield newand greater possibilities for our customers around the globe touse advanced technology to achieve their business goals.
11
VERIZON COMMUNICATIONS INC. 2005 ANNUAL REPORT

1212
making an impact on our communitiesIn 2005, as Hurricanes Katrina and Rita devastated the GulfCoast, Verizon rose to the occasion. We deployed techniciansfrom across the country and provided communicationsresources to ensure continued operation of our wireline andwireless networks. We donated 10,000 wireless phones withfree airtime, distributed 20,000 prepaid calling cards andstaffed call centers with 10,000 volunteers to support anational telethon. In addition, we contributed more than $10.8million in employee donations and corporate matching gifts.
Verizon’s response to these disasters is rooted in morethan a century of caring about the people we serve. We fosterrelationships to address social and economic needs in ourcommunities. We also partner with organizations and use tech-
nology to develop innovative programs for literacy, education,domestic violence prevention, health care and accessibility.And our volunteer program encourages employees to donatetheir time, money and talents to help build stronger, sustainablecommunities by supporting the causes they care about.
Our corporate responsibility goes far beyond the tradi-tional definition of philanthropy. Through grassroots programswe put essential tools in the hands of people making a differ-ence at the local level. Together, we are building a lastingfoundation and are making sure people have the resources andfundamental skills to succeed.
More information about our corporate responsibility initia-tives can be found at www.verizon.com/responsibility.
13
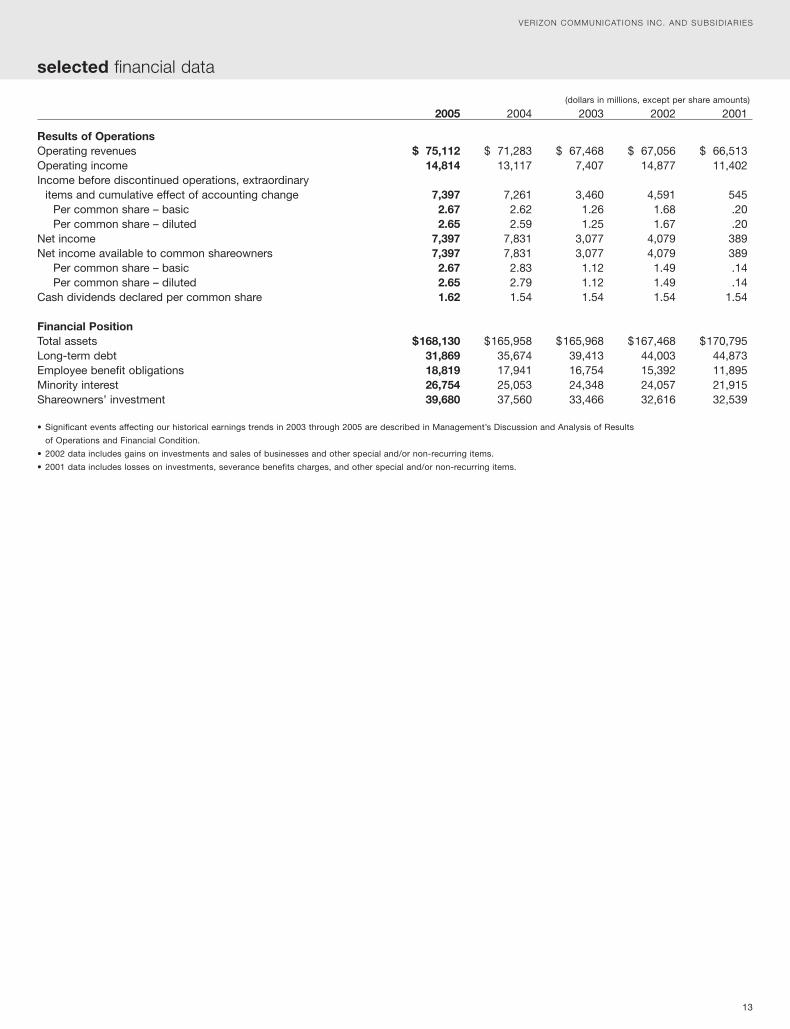
(dollars in millions, except per share amounts)
2005 2004 2003 2002 2001
Results of OperationsOperating revenues $ 75,112 $ 71,283 $ 67,468 $ 67,056 $ 66,513Operating income 14,814 13,117 7,407 14,877 11,402Income before discontinued operations, extraordinary
items and cumulative effect of accounting change 7,397 7,261 3,460 4,591 545Per common share – basic 2.67 2.62 1.26 1.68 .20Per common share – diluted 2.65 2.59 1.25 1.67 .20
Net income 7,397 7,831 3,077 4,079 389Net income available to common shareowners 7,397 7,831 3,077 4,079 389
Per common share – basic 2.67 2.83 1.12 1.49 .14Per common share – diluted 2.65 2.79 1.12 1.49 .14
Cash dividends declared per common share 1.62 1.54 1.54 1.54 1.54
Financial PositionTotal assets $168,130 $165,958 $165,968 $167,468 $170,795Long-term debt 31,869 35,674 39,413 44,003 44,873Employee benefit obligations 18,819 17,941 16,754 15,392 11,895Minority interest 26,754 25,053 24,348 24,057 21,915Shareowners’ investment 39,680 37,560 33,466 32,616 32,539
• Significant events affecting our historical earnings trends in 2003 through 2005 are described in Management’s Discussion and Analysis of Results
of Operations and Financial Condition.
• 2002 data includes gains on investments and sales of businesses and other special and/or non-recurring items.
• 2001 data includes losses on investments, severance benefits charges, and other special and/or non-recurring items.
selected financial data
VERIZON COMMUNICATIONS INC. AND SUBSIDIARIES

Domestic Telecom. Verizon added 7,521,000 wireless cus-tomers, 1,659,000 broadband connections and 992,000 longdistance lines. Excluding the revenues of Verizon’s Hawaii wire-line and directory operations, which were sold in 2005,consolidated revenue growth would have been 6.0% in 2005compared to 2004.
• Operational Efficiency – While focusing resources on growthmarkets, we are continually challenging our management teamto lower expenses, particularly through technology-assisted pro-ductivity improvements including self-service initiatives. Theeffect of these and other efforts, such as the 2003 labor agree-ments and voluntary separation plans, real estate consolidationsand call center routing improvements, has been to significantlychange the company’s cost structure and maintain stable oper-ating income margins. Real estate consolidations include ourdecision to establish Verizon Center for the leadership team. In2005, Verizon restructured its management retirement benefitplans such that management employees will no longer earn pen-sion benefits or earn service towards the company retireemedical subsidy after June 30, 2006, after receiving an 18-monthenhancement of the value of their pension and retiree medicalbenefits, but will receive higher savings plan matching contribu-tions. The net effect of these management benefit plan changesis expected to be a reduction in pretax benefit expenses ofapproximately $3 billion over 10 years. In addition, DomesticTelecom’s salary and benefits expenses have declined in 2005and 2004 as a result of the 2003 voluntary separation plan.Workforce levels in 2005 and 2004 increased to 217,000 and209,000, respectively, from 200,000 as of December 31, 2003driven by wireless and wireline broadband growth markets.
• Capital Allocation – Verizon’s capital expenditures continue to bedirected toward growth markets. High-speed wireless data(Evolution-Data Optimized, or EV-DO) services, replacement ofcopper access lines with fiber optics to the home, as well asexpanded services to business markets are examples of areas ofcapital expenditures in support of these growth markets. In 2005,Verizon achieved targeted increased capital expenditures of$15,324 million compared to 2004 capital expenditures of$13,259 million in support of growth initiatives. Approximately69% of 2005 capital expenditures related to growth initiatives. In2006, Verizon management expects capital expenditures to be inthe range of $15.4 billion to $15.7 billion, excluding capitalexpenditures associated with MCI. Including MCI, capital expen-ditures are expected to be $17.0 billion to $17.4 billion in 2006.In addition to capital expenditures, Domestic Wireless continuesto acquire wireless spectrum in support of expanding data appli-cations and customer base. In 2005, this included participationin the Federal Communications Commission (FCC) Auction 58and the NextWave Telecom Inc. (NextWave) and Qwest Wireless,LLC acquisitions.
• Cash Flow Generation – The financial statements reflect theemphasis of management on not only directing resources togrowth markets, but also using cash provided by our operatingand investing activities for the repayment of debt in addition toproviding a competitive dividend to our shareowners. In 2005,Verizon increased its dividend by 5.2% to $1.62 per share from$1.54 per share in 2004. At December 31, 2005, Verizon’s totaldebt was $39,010 million, a decrease of $257 million from$39,267 million at December 31, 2004. However, Verizon’s bal-ance of cash and cash equivalents at December 31, 2005 of$776 million declined by $1,514 million from $2,290 million atDecember 31, 2004.
OVERVIEW
Verizon Communications Inc. (Verizon) is one of the world’s leadingproviders of communications services. Verizon’s domestic wirelinetelecommunications business provides local telephone services,including broadband, in 28 states and Washington, D.C. andnationwide long-distance and other communications products andservices. Verizon’s domestic wireless business, operating asVerizon Wireless, provides wireless voice and data products andservices across the United States using one of the most extensivewireless networks. Information Services operates directory pub-lishing businesses and provides electronic commerce services.Verizon’s International segment includes wireline and wireless com-munications operations and investments in the Americas andEurope. In connection with the closing of the merger with MCI, Inc.(MCI), which occurred on January 6, 2006, Verizon now owns andoperates one of the most expansive end-to-end global InternetProtocol (IP) networks which includes over 270,000 domestic and360,000 international route miles of fiber optic cable and providesaccess to over 140 countries worldwide. Operating as VerizonBusiness, we are now better able to provide next-generation IP net-work services to medium and large businesses and governmentcustomers. Stressing diversity and commitment to the communitiesin which we operate, Verizon has a highly diverse workforce of250,000 employees, including Verizon Business.
The sections that follow provide information about the importantaspects of our operations and investments, both at the consoli-dated and segment levels, and include discussions of our results ofoperations, financial position and sources and uses of cash. Inaddition, we have highlighted key trends and uncertainties to theextent practicable. The content and organization of the financialand non-financial data presented in these sections are consistentwith information used by our chief operating decision makers for,among other purposes, evaluating performance and allocatingresources. We also monitor several key economic indicators as wellas the state of the economy in general, primarily in the UnitedStates where the majority of our operations are located, in evalu-ating our operating results and analyzing and understandingbusiness trends. While most key economic indicators, includinggross domestic product, impact our operations to some degree, wehave noted higher correlations to housing starts, non-farm employ-ment, personal consumption expenditures and capital spending, aswell as more general economic indicators such as inflation andunemployment rates.
Our results of operations, financial position and sources and usesof cash in the current and future periods reflect Verizon manage-ment’s focus on the following four key areas:
• Revenue Growth – Our emphasis is on revenue transformation,devoting more resources to higher growth markets such as wire-less, wireline broadband connections, including digitalsubscriber lines (DSL) and fiber optics to the home (Verizon’sFiOS data product), long distance and other data services aswell as expanded services to business markets, rather than totraditional wireline voice services, where we have been experi-encing access line losses. In 2005, revenues from these growthareas increased by 15% compared to 2004 and represent 58%of our total revenues, up from 53% of total revenues in 2004 and47% in 2003. Verizon reported consolidated revenue growth of5.4% in 2005 compared to 2004, led by 16.8% higher revenue atDomestic Wireless and 10.5% total data revenue growth at
14
management’s discussion and analysis of results of operations and financial condition
VERIZON COMMUNICATIONS INC. AND SUBSIDIARIES

Supporting these key focus areas are continuing initiatives topackage more effectively and add more value to our products andservices. In 2004, Verizon announced a deployment expansion ofFiOS in several states in our service territory. As of the end of 2005,we have met our goal of passing three million premises by the endof 2005. We have achieved a penetration rate of 9% in marketswhere Verizon has been actively marketing for more than sixmonths and 14% in markets where we have been marketing fornine months, and continue to progress toward our goal of reaching30% penetration in five years. In 2005, Verizon began offering videoon the FiOS network in three markets and expects to begin offeringvideo services in markets in New York, Massachusetts andCalifornia in the first quarter of 2006. In Keller, Texas, the firstmarket that FiOS TV has been offered, we have achieved a 21%penetration rate in four months. FiOS TV includes a collection of all-digital programming with more than 375 channels, 47 musicchannels and 20 high-definition television channels. Innovativeproduct bundles include local wireline, long distance, wireless andbroadband services for consumer and general business retail cus-tomers. These efforts will also help counter the effects ofcompetition and technology substitution that have resulted inaccess line losses that have contributed to declining DomesticTelecom revenues over the past several years.
Verizon Business will serve medium and large businesses and gov-ernment customers from related business operations withinDomestic Telecom that market communications and informationtechnology and services to large businesses and governments andMCI’s global, corporate and government customers group.Beginning in 2006, Verizon will be positioned as a global communi-cations solutions provider. In connection with this merger, Verizonexpects to achieve merger synergies with a net present value ofapproximately $8 billion; annual synergies over the next three yearsare estimated to be $550 million in 2006, $825 million in 2007 and$1,100 million in 2008. Integration costs over that same three yearperiod are estimated to be $400 million in 2006, $325 million in 2007and $275 million in 2008 and integration capital expenditures areestimated to be between $1.6 billion and $1.9 billion, of which $550million is expected to be spent in 2006. Examples of these syner-gies include moving more voice and data traffic, such as long-haullong distance traffic, onto Verizon’s networks rather than payingthird party access providers and duplicate work force reductions.
At Domestic Wireless, we will continue to execute on the funda-mentals of our network superiority and value proposition to delivergrowth for the business while at the same time provide new andinnovative products and services for our customers. We are contin-uing to expand the areas where we are offering BroadbandAccess,our EV-DO service. During 2005, Domestic Wireless expanded itsbroadband network to 180 major metropolitan areas, covering over150 million people across the United States. We have achieved ourgoal of reaching approximately one-half of the U.S. population bythe end of 2005. During 2005, we launched V CAST, our consumerbroadband wireless service offering, which provides customers withunlimited access to a variety of video and gaming content on EV-DO handsets. In the first year of V CAST service, customersreceived 11.8 million downloads. Beginning in 2006, DomesticWireless launched V CAST Music, a comprehensive mobile musicservice in which customers can download music over the airdirectly to their wireless phones and to their personal computers.
In December 2005, Verizon announced that it is exploring divestingInformation Services through a spin-off, sale or other strategictransaction. However, since this process is still ongoing,Information Services’ results of operations, financial position andcash flows remain in Verizon’s continuing operations.
CONSOLIDATED RESULTS OF OPERATIONS
In this section, we discuss our overall results of operations andhighlight special and non-recurring items. In the following section,we review the performance of our four reportable segments. Weexclude the effects of the special and non-recurring items from thesegments’ results of operations since management does not con-sider them in assessing segment performance, due primarily to theirnon-recurring and/or non-operational nature. We believe that thispresentation will assist readers in better understanding our resultsof operations and trends from period to period. This section on con-solidated results of operations carries forward the segment results,which exclude the special and non-recurring items, and highlightsand describes those items separately to ensure consistency ofpresentation in this section and the “Segment Results ofOperations” section.
The special and non-recurring items include operating resultsthrough the sale date of our wireline and directory businesses inHawaii which operated approximately 700,000 switched accesslines and were sold in the second quarter of 2005. These operatingresults are not in segment results of operations to enhance compa-rability. Segment results also do not include discontinuedoperations in segment income. See “Other Consolidated Results –Discontinued Operations” for a discussion of these results of oper-ations. In addition, consolidated operating results include severalother events and transactions that are highlighted because of theirnon-recurring and/or non-operational nature. See “Special Items”for additional discussion of these items.
15
management’s discussion and analysis of results of operations and financial condition continued
2005 Compared to 2004Consolidated revenues in 2005 were higher by $3,829 million, or5.4% compared to 2004 revenues. This increase was primarily theresult of significantly higher revenues at Domestic Wireless andhigher International revenues, partially offset by lower revenues atDomestic Telecom and the sale of Hawaii operations in the secondquarter of 2005.
Domestic Wireless’s revenues increased by $4,639 million, or16.8% in 2005 compared to 2004 due to a 7.5 million, or 17.2%increase in customers to 51.3 million as of December 31, 2005 andhigher equipment and other revenue, partially offset by a decreasein average revenue per customer per month. Increased equipmentand other revenues was principally the result of an increase in wire-less devices sold together with an increase in revenue per unit sold.Average revenue per customer per month decreased 1.5% to$49.49 in 2005 compared to 2004, primarily due to pricing changesin early 2005, partially offset by a 71.7% increase in data revenueper customer in 2005 compared to 2004, driven by increased use ofour messaging and other data services. Data revenues were $2,243million in 2005 compared to $1,116 million in 2004. Average min-utes of use (MOUs) per customer increased to 665, or 16.1% in2005 compared to 2004.
Domestic Telecom’s revenues in 2005 were lower than 2004 by$405 million, or 1.1% primarily due to lower revenues from localservices, partially offset by higher network access and long dis-tance services revenues. The decline in local service revenues of$669 million, or 3.7% in 2005 was mainly due to lower demand andusage of our basic local exchange and accompanying services, asreflected by declines in switched access lines in service of 6.7% in2005, driven by the effects of competition and technology substitu-tion. Our network access revenues increased by $159 million, or1.3% in 2005 principally due to increased DSL and carrier specialaccess revenues, partially offset by the impact of decreasingswitched MOUs and access lines and mandatory price reductionsassociated with federal and state price cap filings and other regula-tory decisions. We added 1.7 million new broadband connections,for a total of 5.1 million lines in service at December 31, 2005, anincrease of 47.6% compared to 3.5 million lines in service atDecember 31, 2004. Switched MOUs declined by 7.1% in 2005compared to 2004 reflecting the impact of access line loss andtechnology substitution. Network access revenues also increased in2005 as a result of a favorable adjustment associated with a recentregulatory decision. Long distance service revenues increased $206million, or 5.0% in 2005 principally as a result of customer growthfrom our interLATA long distance services. In 2005, we added 1.0million long distance lines, for a total of 18.4 million long distancelines nationwide, representing a 5.7% increase from December 31,2004. The introduction of our Freedom service plans continues to
stimulate growth in long distance services. As of December 31,2005, approximately 53% of our local wireline customers havechosen Verizon as their long distance carrier.
Lower revenue of Hawaii operations sold of $393 million, or 66.1% in2005 compared to 2004 was the result of the sale during the secondquarter of 2005 of our wireline and directory operations in Hawaii.
2004 Compared to 2003Consolidated revenues in 2004 were higher by $3,815 million, or5.7% compared to 2003 revenues. This increase was primarily theresult of significantly higher revenues at Domestic Wireless, partiallyoffset by lower revenues at Domestic Telecom.
Domestic Wireless’s revenues increased by $5,173 million, or23.0% in 2004 compared to 2003 as a result of 6.3 million net cus-tomer additions and higher revenue per customer per month,including higher data revenue per customer. Average revenue percustomer per month was $50.22, or 2.8% higher in 2004 comparedto 2003, primarily due to a larger number of customers on higheraccess price plan offerings as well as an increase in data revenuesper subscriber. Data revenues were $1,116 million in 2004 com-pared to $449 million in 2003. These increases were partially offsetby decreased roaming revenue due to bundled pricing.
Domestic Telecom’s revenues in 2004 were lower than 2003 by$1,034 million, or 2.6% primarily due to lower local and networkaccess services, partially offset by higher long distance revenues.The decline in local service revenues of $916 million, or 4.8% in2004 was mainly due to lower demand and usage of our basic localexchange and accompanying services, as reflected by a decline inswitched access lines in service of 4.6% in 2004. These revenuedeclines were mainly driven by the effects of competition, regula-tory pricing rules for unbundled network elements (UNEs) andtechnology substitution. Network access revenues declined by$486 million, or 3.9% in 2004 compared to 2003 principally due todecreasing MOUs and access lines, as well as mandatory pricereductions associated with federal and state price cap filings andother regulatory decisions. Switched MOUs declined in 2004 by5.7% compared to 2003, reflecting the impact of access line lossand wireless substitution. Domestic Telecom’s long distance servicerevenues increased $390 million, or 10.4% in 2004 compared to2003, principally as a result of customer growth from our interLATAlong distance services. In 2004, we added 2.3 million long distancelines, for a total of 17.7 million long distance lines nationwide, rep-resenting a 15.5% increase from December 31, 2003.
16
management’s discussion and analysis of results of operations and financial condition continued
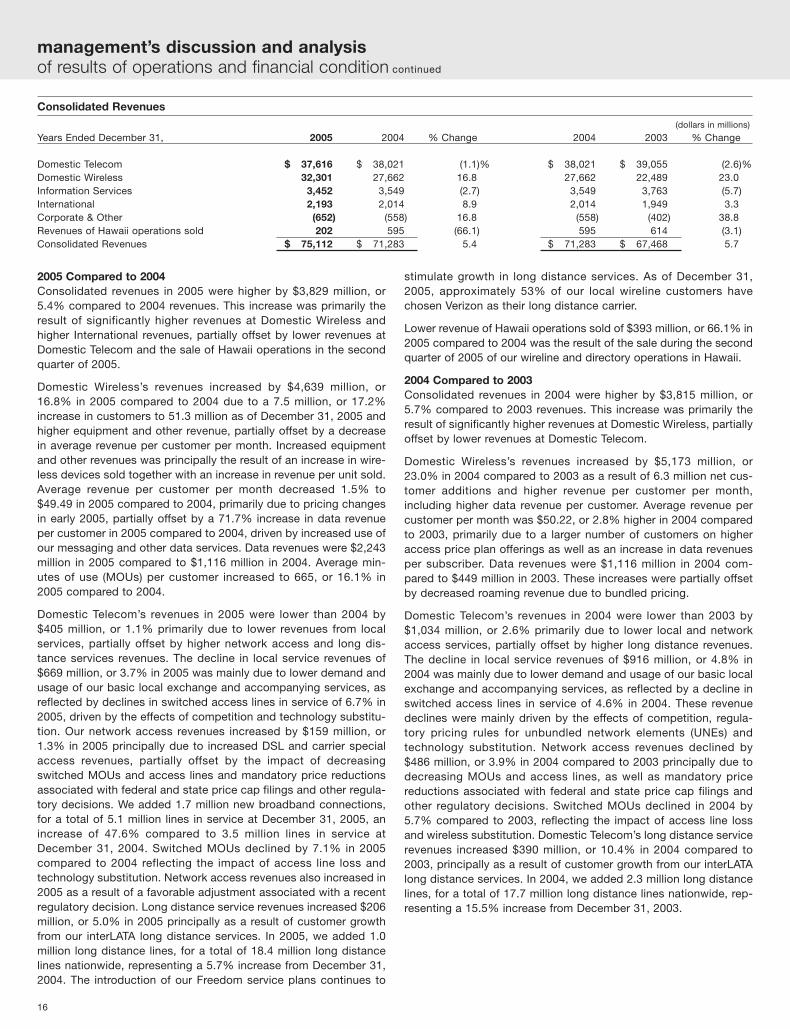
Consolidated Revenues
(dollars in millions)
Years Ended December 31, 2005 2004 % Change 2004 2003 % Change
Domestic Telecom $ 37,616 $ 38,021 (1.1)% $ 38,021 $ 39,055 (2.6)%Domestic Wireless 32,301 27,662 16.8 27,662 22,489 23.0Information Services 3,452 3,549 (2.7) 3,549 3,763 (5.7)International 2,193 2,014 8.9 2,014 1,949 3.3Corporate & Other (652) (558) 16.8 (558) (402) 38.8Revenues of Hawaii operations sold 202 595 (66.1) 595 614 (3.1)Consolidated Revenues $ 75,112 $ 71,283 5.4 $ 71,283 $ 67,468 5.7

charges in 2004 also include an expense credit of $204 millionresulting from the favorable resolution of pre-bankruptcy amountsdue from MCI, partially offset by a charge of $113 million related tooperating asset losses.
Depreciation and Amortization ExpenseDepreciation and amortization expense increased by $137 million,or 1.0% in 2005 compared to 2004. This increase was primarily dueto the increase in depreciable assets and software, partially offsetby lower rates of depreciation on telephone plant.
Sales of Businesses, NetDuring the second quarter of 2005, we sold our wireline and directorybusinesses in Hawaii and recorded a net pretax gain of $530 million.
2004 Compared to 2003Cost of Services and SalesCost of services and sales increased by $1,467 million, or 6.8% in2004 compared to 2003. This increase was principally due toincreased pension and other postretirement benefit costs, primarilyat Domestic Telecom, higher direct wireless network charges andcustomer handset costs at Domestic Wireless as a result of cus-tomer base growth and higher costs at Domestic Telecomassociated with growth businesses, partially offset by lower work-force levels and other cost reductions at Domestic Telecom.
The overall impact of pension and other postretirement benefit planassumption changes, combined with lower asset returns over thelast several years, increased net pension and postretirement benefitexpenses by $1,166 million in 2004 (primarily in cost of services andsales) compared to 2003. Costs increased in 2004 at DomesticWireless primarily due to higher direct wireless network chargesresulting from increased MOUs in 2004 compared to 2003 andhigher cost of equipment sales due to an increase in handsets sold,driven by growth in customer additions and an increase in equip-ment upgrades in 2004 compared to 2003. Higher customerpremises equipment and other costs associated with our growthbusinesses at Domestic Telecom such as long distance and DSLalso contributed to the increase in cost of services and sales. Theseexpense increases were partially offset by the effect of workforcereductions. In 2004, Domestic Telecom benefited from an averageof approximately 15,000 fewer employees compared to 2003 levels.This reduction in employees was principally due to a voluntary sep-aration plan, which was completed in November 2003. Costs in2004 were also impacted by lower interconnection expensecharged by CLECs and settlements with carriers, including the MCIsettlement recorded in the second quarter of 2004.
Selling, General and Administrative ExpenseSelling, general and administrative expense was $3,806 million, or15.3% lower in 2004 compared to 2003. This decrease was drivenby lower special charges in 2004 by $5,390 million and lower costs
2005 Compared to 2004Cost of Services and SalesCost of services and sales increased by $2,301 million, or 9.9% in2005 compared to 2004. This increase was principally due toincreases in pension and other postretirement benefit costs, higherdirect wireless network costs, increases in wireless equipment costsand higher costs associated with our wireline growth businesses.
The overall impact of pension and other postretirement benefit planassumption changes, combined with lower asset returns over thelast several years, increased net pension and postretirement benefitexpenses by $399 million in 2005 (primarily in cost of services andsales) compared to 2004. Higher direct wireless network chargesresulted from increased MOUs in 2005 compared to 2004, partiallyoffset by lower roaming, local interconnection and long distancerates. Cost of equipment sales was higher in 2005 due primarily toan increase in wireless devices sold together with an increase incost per unit sold, driven by growth in customer additions and anincrease in equipment upgrades in 2005. Higher costs associatedwith our wireline growth businesses, long distance and broadbandconnections, included a 2,400, or 1.7% increase in the number ofDomestic Telecom employees as of December 31, 2005 comparedto December 31, 2004. Costs in 2004 were impacted by lower inter-connection expense charged by competitive local exchangecarriers (CLECs) and settlements with carriers, including the MCIsettlement recorded in 2004.
Selling, General and Administrative ExpenseSelling, general and administrative expense was $224 million, or1.1% higher in 2005 compared to 2004. This increase was driven byincreases in salary, pension and benefits costs, including anincrease in the customer care and sales channel work force andsales commissions, partially offset by gains on real estate sales in2005 and lower bad debt costs. In addition, 2004 included the favor-able resolution of a 2003 Telecomunicaciones de Puerto Rico, Inc.(TELPRI) charge. Special and non-recurring items in selling, generaland administrative expenses in 2005 were $315 million compared tospecial and non-recurring items in 2004 of $995 million.
Special and non-recurring items in 2005 included a pretax impair-ment charge of $125 million pertaining to our leasing operations forairplanes leased to airlines experiencing financial difficulties, a netpretax charge of $98 million related to the restructuring of theVerizon management retirement benefit plans and a pretax chargeof $59 million associated with employee severance costs and sev-erance-related activities in connection with the voluntary separationprogram to surplus union-represented employees. Special and non-recurring items recorded in 2004 included $815 million related topension settlement losses incurred in connection with the voluntaryseparation of approximately 21,000 employees in the fourth quarterof 2003 who received lump-sum distributions during 2004. Special
17
Consolidated Operating Expenses
(dollars in millions)
Years Ended December 31, 2005 2004 % Change 2004 2003 % Change
Cost of services and sales $ 25,469 $ 23,168 9.9% $ 23,168 $ 21,701 6.8%Selling, general and administrative expense 21,312 21,088 1.1 21,088 24,894 (15.3)Depreciation and amortization expense 14,047 13,910 1.0 13,910 13,607 2.2Sales of businesses, net (530) – nm – (141) (100.0)Consolidated Operating Expenses $ 60,298 $ 58,166 3.7 $ 58,166 $ 60,061 (3.2)
nm – Not meaningful
management’s discussion and analysis of results of operations and financial condition continued
at Domestic Telecom associated with workforce reductions and bylower bad debt expense, partially offset by cost increases atDomestic Wireless and Domestic Telecom. Special charges relatedto severance, pension and benefits were $4,607 million lower in2004 compared to 2003, driven primarily by fourth quarter 2003charges incurred in connection with the voluntary separation ofapproximately 21,000 employees. Lease impairment and other spe-cial charges in 2003 were $496 million, compared to other specialcredits, net of $91 million in 2004.
Domestic Wireless’s salary and benefits expense increased by $821million, including a $447 million increase in costs incurred in 2004related to that segment’s long-term incentive program, and by anincrease in the employee base, primarily in the customer care andsales channels. Also contributing to the increase at DomesticWireless were higher sales commissions in our direct and indirectchannels primarily related to an increase in customer additions andrenewals during the year. Cost increases in 2004 at DomesticTelecom included higher net pension and benefit costs, asdescribed in costs of services and sales above, additional otheremployee benefit costs and higher professional and general costs.
Depreciation and Amortization ExpenseDepreciation and amortization expense increased by $303 million,or 2.2% in 2004 compared to 2003. This increase was primarily dueto increased depreciation expense related to the increase in depre-ciable assets, partially offset by lower rates of depreciation ontelephone plant.
Sales of Businesses, NetIn 2003, Information Services recorded a pretax gain of $141 millionprimarily related to the sale of its European directory publicationoperations in Austria, the Czech Republic, Gibraltar, Hungary,Poland and Slovakia.
Pension and Other Postretirement BenefitsFor 2005 pension and other postretirement benefit costs, the dis-count rate assumption was lowered to 5.75% from 6.25% in 2004consistent with interest rate levels at the end of 2004. The expectedrate of return on pension plan assets remained 8.50% while theexpected rate of return on postretirement benefit plan assets waslowered to 7.75% from 8.50% in 2004. The medical cost trend ratewas 10% for 2005. For 2004 pension and other postretirement ben-efit costs, the discount rate assumption was lowered to 6.25% from6.75% in 2003, consistent with interest rate levels at the end of2003. The expected rate of return on pension and postretirementbenefit plan assets was maintained at 8.50%. The medical costtrend rate assumption was 10% in 2004.
For 2006 pension and other postretirement benefit costs, we evalu-ated our key employee benefit plan assumptions in response tocurrent conditions in the securities markets and medical and pre-scription drug cost trends. The discount rate assumption will bemaintained at 5.75%, consistent with interest rate levels at the endof 2005. The expected rate of return on pension plan assets willremain 8.50% while the expected rate of return on postretirementbenefit plan assets will increase to 8.25% from 7.75% in 2005. Themedical cost trend rate will be 10% for 2006.
Verizon’s union contracts contain health care cost provisions thatlimit company payments toward health care costs to specific dollaramounts (known as caps). These caps pertain to both current andfuture retirees, and have a significant impact on the actuarial valua-tion of postretirement benefits. These caps have been included in
union contracts for several years, but have exceeded the annualhealth care cost every year until 2003. During the negotiation of newcollective bargaining agreements for union contracts covering79,000 unionized employees in the second half of 2003, the datehealth care caps would become effective was extended and thedollar amounts of the caps were increased. In the fourth quarter of2003, we began recording retiree health care costs as if there wereno caps, in connection with the ratification of the union contracts.Since the caps are an assumption included in the actuarial determi-nation of Verizon’s postretirement obligation, the effect of extendingand increasing the caps increased the accumulated postretirementobligation in the fourth quarter of 2003 by $5,158 million, whichincreased the annual postretirement benefit expense by $667 mil-lion in 2004.
During 2005, we recorded net pension and postretirement benefitexpense of $1,376 million ($839 million after-tax, or $.30 per dilutedshare), compared to net pension and postretirement benefit expenseof $977 million ($596 million after-tax, or $.21 per diluted share) in2004 and net pension and postretirement benefit income of $(189)million ($115 million after-tax, or $.04 per diluted share) in 2003.
Other Consolidated Results
Equity in Earnings of Unconsolidated BusinessesEquity in earnings of unconsolidated businesses decreased by$1,002 million in 2005 compared to 2004. The decrease is primarilydue to a pretax gain of $787 million recorded on the sale of our20.5% interest in TELUS Corporation (TELUS) in the fourth quarterof 2004 and the sale of another investment in 2004, lower equityincome resulting from the sale of TELUS and estimated additionalpension liabilities at Compañía Anónima Nacional Teléfonos deVenezuela (CANTV), partially offset by higher tax benefits and oper-ational results at our Italian investment Vodafone Omnitel N.V.(Vodafone Omnitel).
Equity in earnings of unconsolidated businesses increased by $413million in 2004 compared to 2003. The increase was primarily dueto a pretax gain of $787 million recorded on the sale of our 20.5%interest in TELUS in 2004. This increase was partially offset by taxbenefits in 2003 from a reorganization at Vodafone Omnitel and acontribution tax reversal benefiting Vodafone Omnitel. In early 2003,Vodafone Group Plc (Vodafone) completed the reorganization ofseveral of its investments in Vodafone Omnitel that resulted in theconsolidation of several holding companies. As a result, the intan-gible assets held by these holding companies were transferred toVodafone Omnitel and became tax-deductible for Italian tax pur-poses. It was determined that this intangible asset was deductibleover a three-year period as a customer database. At the time thatthe reorganization was effective, Vodafone Omnitel began recordingthe tax benefit associated with the newly created intangible asset inits reported income and Verizon recorded its share of that tax ben-efit. Separately, in September 2003, the European Court of Justiceruled that an Italian contribution tax on the use of wireless frequen-cies, established by Italy in 1998, was contrary to European Unionlaw and that the Italian government must refund amounts previouslypaid by Italian wireless carriers. During the fourth quarter of 2003,Verizon recorded its share of the earnings impact of this favorableruling. In 2003, we also recorded a pretax gain of $348 million inconnection with the sale of our interest in Eurotel Praha, spol. s r.o.(Eurotel Praha), a wireless joint venture in the Czech Republic.
18
management’s discussion and analysis of results of operations and financial condition continued

Income From Other Unconsolidated BusinessesIncome from other unconsolidated businesses increased by $17million in 2005 compared to 2004 and decreased by $256 million in2004 compared to 2003. The decrease in 2004 was primarily drivenby a $176 million net gain recorded in 2003 as a result of a paymentreceived in connection with the liquidation of Genuity Inc. (Genuity)and the sales of shares of investments, including Taiwan CellularCorporation (TCC) and TelecomAsia Corporation Public CompanyLimited (TelecomAsia) in 2003. This decrease was partially offset bya pretax gain of $43 million recorded in connection with the sale ofour investment in Iowa Telecom preferred stock and TCC sharesales in 2004.
Other Income and (Expense), Net (dollars in millions)
Years Ended December 31, 2005 2004 2003
Interest income $ 120 $ 116 $ 95Foreign exchange gains (losses), net 10 (13) (11)Other, net 107 (81) (47)Total $ 237 $ 22 $ 37
In 2005, the changes in Other Income and (Expense), Net were pri-marily due to other, net income in the current year compared toother, net expenses in the prior year. Other, net in 2005 includes apretax gain on the sale of a small international business, leasedasset gains and investment gains. Other, net in 2005 and 2004include expenses of $14 million and $55 million, respectively,related to the early retirement of debt. The changes in Other Incomeand (Expense), Net in 2004 were primarily due to higher other, netexpenses, partially offset by higher interest income. Other, net in2004 and 2003 includes expenses of $55 million and $61 million,respectively, related to the early retirement of debt.
Interest Expense (dollars in millions)
Years Ended December 31, 2005 2004 2003
Total interest expense $ 2,180 $ 2,384 $ 2,797Capitalized interest costs 352 177 144Total interest costs on debt balances $ 2,532 $ 2,561 $ 2,941
Average debt outstanding $ 39,939 $ 42,555 $ 49,181Effective interest rate 6.3% 6.0% 6.0%
In 2005, the decrease in interest costs was primarily due to a reduc-tion in average debt level of $2,616 million compared to 2004,partially offset by higher average interest rates. Higher capitalexpenditures contributed to higher capitalized interest costs. In2004, the decrease in interest costs was primarily due to a reduc-tion in average debt level of $6,626 million compared to 2003.Higher capital expenditures contributed to higher capitalizedinterest costs.
Minority Interest (dollars in millions)
Years Ended December 31, 2005 2004 2003
Minority interest $ 3,045 $ 2,409 $ 1,583
The increase in minority interest expense in 2005 was primarily dueto higher earnings at Domestic Wireless, which has a significantminority interest attributable to Vodafone. The increase in minorityinterest expense in 2004 was primarily due to higher earnings atDomestic Wireless and higher earnings at TELPRI.
19
management’s discussion and analysis of results of operations and financial condition continued
Provision for Income Taxes (dollars in millions)
Years Ended December 31, 2005 2004 2003
Provision for income taxes $ 3,210 $ 2,851 $ 1,213Effective income tax rate 30.3% 28.2% 26.0%
The effective income tax rate is the provision for income taxes as apercentage of income from continuing operations before the provi-sion for income taxes. Our effective income tax rate in 2005 washigher than 2004 due to taxes on overseas earnings repatriatedduring the year, lower foreign-related tax benefits and lower favorabledeferred tax reconciliation adjustments. As a result of the capital gainrealized in the second quarter of 2005 in connection with the sale ofour Hawaii businesses, we recorded tax benefits of $336 million pri-marily related to prior year investment losses, which were largelyoffset by a net tax provision of $206 million related to the repatriationof foreign earnings under the provisions of the American JobsCreation Act of 2004. The effective income tax rate in 2004 wasfavorably impacted from the reversal of a valuation allowance relatingto investments, and tax benefits related to deferred tax balanceadjustments and expense credits that are not taxable.
Our effective income tax rate in 2004 was higher than 2003 due tolower foreign-related tax benefits, particularly associated with lowerequity income from our investment in Vodafone Omnitel and higherstate taxes. Vodafone Omnitel income is not taxable until receivedin the form of dividends. The effective income tax rate in 2004 wasfavorably impacted by the reversal of a valuation allowance relatingto investments, and tax benefits related to deferred tax balanceadjustments and expense credits that are not taxable. The effectiveincome tax rate in 2003 was favorably impacted by higher equityincome from Vodafone Omnitel, a decrease in state taxes and abenefit related to a deferred tax balance adjustment.
A reconciliation of the statutory federal income tax rate to the effec-tive rate for each period is included in Note 16 to the consolidatedfinancial statements.
Discontinued OperationsDiscontinued operations represent the results of operations ofVerizon Information Services Canada Inc. for all years presented inthe consolidated statements of income and Grupo Iusacell, S.A. deC.V. (Iusacell) prior to the sale of Iusacell in July 2003. During 2004,we announced our decision to sell Verizon Information ServicesCanada Inc. and, in accordance with Statement of FinancialAccounting Standards (SFAS) No. 144, “Accounting for theImpairment or Disposal of Long-Lived Assets,” we have classifiedthe results of operations of Verizon Information Services Canada asdiscontinued operations. The sale closed in the fourth quarter of2004 and resulted in a pretax gain of $1,017 million ($516 millionafter-tax, or $.18 per diluted share). In connection with the decisionto sell our interest in Iusacell and a comparison of expected net saleproceeds to the net book value of our investment in Iusacell(including the foreign currency translation balance), we recorded apretax loss of $957 million ($931 million after-tax, or $.33 per dilutedshare) in the second quarter of 2003.
Cumulative Effect of Accounting ChangeDirectory Accounting ChangeDuring 2003, we changed our method for recognizing revenues andexpenses in our directory business from the publication-datemethod to the amortization method. The publication-date methodrecognizes revenues and direct expenses when directories are pub-lished. Under the amortization method, revenues and direct

20
expenses, primarily printing and distribution costs, are recognizedover the life of the directory, which is usually 12 months. Thisaccounting change affected the timing of the recognition of rev-enues and expenses. As required by generally accepted accountingprinciples, the directory accounting change was recorded effectiveJanuary 1, 2003. The cumulative effect of the accounting changewas a one-time charge of $2,697 million ($1,647 million after-tax, or$.58 per diluted share).
Impact of SFAS No. 143We adopted the provisions of SFAS No. 143, “Accounting for AssetRetirement Obligations,” on January 1, 2003. SFAS No. 143requires that companies recognize the fair value of a liability forasset retirement obligations in the period in which the obligationsare incurred and capitalize that amount as part of the book value ofthe long-lived asset. We determined that Verizon does not have amaterial legal obligation to remove long-lived assets as describedby this statement. However, prior to the adoption of SFAS No. 143,we included estimated removal costs in our group depreciationmodels. Consequently, in connection with the initial adoption ofSFAS No. 143 we reversed accrued costs of removal in excess ofsalvage from our accumulated depreciation accounts for theseassets. The adjustment was recorded as a cumulative effect of anaccounting change, resulting in the recognition of a gain of $3,499million ($2,150 million after-tax, or $.76 per diluted share).
SEGMENT RESULTS OF OPERATIONS
We have four reportable segments, which we operate and manageas strategic business units and organize by products and services.Our segments are Domestic Telecom, Domestic Wireless,Information Services and International. You can find additionalinformation about our segments in Note 17 to the consolidatedfinancial statements.
We measure and evaluate our reportable segments based on seg-ment income. This segment income excludes unallocated corporateexpenses and other adjustments arising during each period. Theother adjustments include transactions that the chief operatingdecision makers exclude in assessing business unit performancedue primarily to their non-recurring and/or non-operational nature.Although such transactions are excluded from business segmentresults, they are included in reported consolidated earnings. Wepreviously highlighted the more significant of these transactions inthe “Consolidated Results of Operations” section. Gains and lossesthat are not individually significant are included in all segmentresults, since these items are included in the chief operating deci-sion makers’ assessment of unit performance. These gains andlosses are primarily contained in Information Services andInternational since they actively manage investment portfolios.
Domestic Telecom
Domestic Telecom provides local telephone services, includingvoice, DSL, data transport, enhanced and custom calling features,network access, directory assistance, private lines and public tele-phones in 28 states and Washington, D.C. As discussed earlierunder “Consolidated Results of Operations,” in the second quarterof 2005, we sold wireline properties in Hawaii representing approx-imately 700,000 access lines or 1% of the total Domestic Telecomswitched access lines in service. For comparability purposes, the
results of operations shown in the tables below exclude the Hawaiiproperties that have been sold. This segment also provides longdistance services, customer premises equipment distribution, videoservices, data solutions and systems integration, billing and collec-tions and inventory management services.
Operating Revenues (dollars in millions)
Years Ended December 31, 2005 2004 2003
Local services $ 17,600 $ 18,269 $ 19,185Network access services 12,217 12,058 12,544Long distance services 4,347 4,141 3,751Other services 3,452 3,553 3,575
$ 37,616 $ 38,021 $ 39,055
Local ServicesLocal service revenues are earned by our telephone operationsfrom the provision of local exchange, local private line, wire mainte-nance, voice messaging and value-added services. Value-addedservices are a family of services that expand the utilization of thenetwork, including products such as Caller ID, Call Waiting andReturn Call. The provision of local exchange services not onlyincludes retail revenues but also includes local wholesale revenuesfrom UNEs, interconnection revenues from CLECs and wireless car-riers, and some data transport revenues.
The decline in local service revenues of $669 million, or 3.7% in2005 and $916 million, or 4.8% in 2004 was mainly due to lowerdemand and usage of our basic local exchange and accompanyingservices, as reflected by declines in switched access lines inservice of 6.7% in 2005 and 4.6% in 2004. These revenue declineswere mainly driven by the effects of competition and technologysubstitution. Technology substitution affected local service revenuegrowth in both years, as declining demand for residential accesslines resulted in 8.4% fewer lines at December 31, 2005 comparedto December 31, 2004 and a reduction in lines of 5.4% during 2004,as more customers substituted wireless, broadband and cableservices for traditional landline services. At the same time, basicbusiness access lines declined by 3.5% in 2005 and 3.1% in 2004,primarily reflecting competition and a shift to high-speed, high-volume special access lines.
In the first quarter of 2005, the FCC adopted significant newunbundling rules which eliminated the requirement to unbundle massmarket local switching for new orders on a nationwide basis, andprovided for a one year transition period for existing UNE switchingarrangements. See “Other Factors That May Affect Future Results –Regulatory and Competitive Trends – FCC Regulation” for additionalinformation on FCC rulemakings concerning UNEs. Due to a deci-sion by two major competitors to deemphasize their local marketinitiatives, wholesale voice connections (commercial local wholesalearrangements, UNE platform and resale lines) declined 1.1 million in2005, to 5.5 million as of December 31, 2005, which reflected a16.1% decrease compared to December 31, 2004. In 2004, prior tothe adoption of these new rules, wholesale voice connectionsincreased 0.8 million to 6.6 million as of December 31, 2004.
We continue to seek opportunities to retain and win-back cus-tomers. Our Freedom service plans offer local services with variouscombinations of long distance, wireless and Internet access serv-ices in a discounted bundle available on one customer bill. Since2003, we have introduced our Freedom service plans in nearly all ofour key markets. As of December 31, 2005, approximately 65% of
management’s discussion and analysis of results of operations and financial condition continued

21
Verizon’s residential customers have purchased local services incombination with either Verizon long distance or Verizon DSL, orboth. For small businesses, we have also introduced VerizonFreedom for Business in eleven key markets, covering approxi-mately 86% of business access lines.
Network Access ServicesNetwork access services revenues are earned from end-user cus-tomers and long distance and other competing carriers who use ourlocal exchange facilities to provide usage services to their cus-tomers. Switched access revenues are derived from fixed andusage-based charges paid by carriers for access to our local net-work. Special access revenues originate from carriers andend-users that buy dedicated local exchange capacity to supporttheir private networks. End-user access revenues are earned fromour customers and from resellers who purchase dial-tone services.Further, network access revenues include our DSL services.
Our network access revenues increased by $159 million, or 1.3% in2005, and decreased $486 million, or 3.9% in 2004. These changeswere principally due to increased DSL and carrier special accessrevenues, partially offset in 2005, and more than offset in 2004, bythe impact of decreasing switched MOUs and access lines andmandatory price reductions associated with federal and state pricecap filings and other regulatory decisions. We added 1.7 million newbroadband connections, for a total of 5.1 million lines in service atDecember 31, 2005, an increase of 47.6% compared to 3.5 millionlines in service at December 31, 2004. Total revenues for high-capacity and data services were $8,489 million in 2005, an increaseof 10.5% compared to 2004 revenues of $7,679 million, whichincreased 7.1% compared to 2003. Special access revenue growthreflects continuing demand in the business market for high-capacity,high speed digital services, partially offset by lessening demand forolder, low-speed data products and services and ongoing pricereductions. Switched access revenues decreased due to declines inswitched MOUs of 7.1% in 2005 compared to 2004 and 5.7% in2004 compared to 2003, reflecting the impact of access line lossand technology substitution, partially offset in 2005 by a favorableadjustment associated with a recent regulatory decision.
The FCC regulates the rates that we charge long distance carriersand end-user customers for interstate access services. See “OtherFactors That May Affect Future Results – Regulatory andCompetitive Trends – FCC Regulation” for additional information onFCC rulemakings concerning federal access rates, universal serviceand unbundling of network elements and broadband services.
Long Distance ServicesLong distance service revenues include both intraLATA toll servicesand interLATA long distance voice and data services.
Long distance service revenues increased $206 million, or 5.0% in2005 and $390 million, or 10.4% in 2004, principally as a result ofcustomer growth from our interLATA long distance services. In2005, we added 1.0 million long distance lines, for a total of 18.4million long distance lines nationwide, representing a 5.7% increasefrom December 31, 2004. In 2004, we added 2.3 million long dis-tance lines, representing an increase of 15.5% from December 31,2003. The introduction of our Freedom service plans continues tostimulate growth in long distance services. As of December 31,2005, approximately 53% of our local wireline customers havechosen Verizon as their long distance carrier.
Other ServicesOur other services include such services as billing and collections forlong distance carriers, public (coin) telephone and customer premisesequipment and supply sales. Other services revenues also includeservices provided by our non-regulated subsidiaries such as datasolutions and systems integration businesses, and other services.
Revenues from other services declined by $101 million, or 2.8% in2005, and by $22 million, or 0.6% in 2004. Revenues decreaseddue to the dissolution of non-strategic businesses, including thetermination of a large commercial inventory management contractin 2005, and reduced business volumes related to billing and col-lection services and public telephone services, partially offset byincreases resulting from higher sales of voice and data customerpremises equipment and other services.
Operating Expenses (dollars in millions)
Years Ended December 31, 2005 2004 2003
Cost of services and sales $ 15,604 $ 14,830 $ 14,512Selling, general and administrative expense 8,419 8,621 8,363Depreciation and amortization expense 8,801 8,910 9,107
$ 32,824 $ 32,361 $ 31,982
Cost of Services and SalesCost of services and sales includes the following costs directlyattributable to a service or product: salaries and wages, benefits,materials and supplies, contracted services, network access andtransport costs, customer provisioning costs, computer systemssupport and cost of products sold. Aggregate customer care costs,which include billing and service provisioning, are allocatedbetween cost of services and sales and selling, general and admin-istrative expense.
In 2005, our cost of services and sales increased by $774 million, or5.2% compared to 2004. Costs in 2005 were impacted byincreased pension and other postretirement benefit costs. As ofDecember 31, 2004, Verizon evaluated key employee benefit planassumptions in response to conditions in the securities markets.The expected rate of return on pension plan assets has been main-tained at 8.50%. However, the discount rate assumption has beenlowered from 6.25% in 2004 to 5.75% in 2005, consistent withinterest rate levels at the end of 2004. Further, there was anincrease in the retiree health care cost trend rates. The overallimpact of these assumption changes, combined with the impact oflower than expected actual asset returns over the last several years,resulted in net pension and other postretirement benefit expense(primarily in cost of services and sales) of $1,248 million in 2005,compared to net pension and postretirement benefit expense of$803 million in 2004. Also contributing to expense increases in costof services and sales were higher costs associated with our growthbusinesses, including a 2,400, or 1.7% increase in the number ofemployees as of December 31, 2005 compared to December 31,2004. Further, the expense increase was impacted by favorableadjustments to our interconnection expense in 2004, as a result ofour ongoing reviews of local interconnection expense charged byCLECs and settlements with carriers, including the MCI settlementrecorded in 2004.
In 2004, our cost of services and sales increased by $318 million, or2.2% compared to 2003. Costs in 2004 were also impacted byincreased pension and other postretirement benefit costs. As ofDecember 31, 2003, Verizon evaluated key employee benefit planassumptions in response to conditions in the securities markets
management’s discussion and analysis of results of operations and financial condition continued

22
and the result of extending and increasing limits (caps) on companypayments toward retiree health care costs in connection with theunion contracts ratified in 2003. The overall impact of theseassumption changes, combined with the impact of lower thanexpected actual asset returns over the last several years, resulted innet pension and other postretirement benefit expense (primarily incost of services and sales) of $803 million in 2004, as compared topension income, net of other postretirement benefit expense of$312 million in 2003. Higher customer premises equipment andother costs associated with our growth businesses and annualwage increases also contributed to the increase in cost of servicesand sales. Further, the comparison of 2004 to 2003 cost of servicesand sales was affected by the 2003 reduction in operatingexpenses (primarily cost of services and sales) of approximately$130 million in 2003 for insurance recoveries related to the terroristattacks on September 11, 2001.
These 2004 expense increases were partially offset by the effect ofworkforce reductions of an average of approximately 15,000employees, principally due to a voluntary separation plan inNovember 2003. Costs in 2004 were also impacted by lower inter-connection expense as a result of our ongoing reviews of localinterconnection expense charged by CLECs and settlements withcarriers, including the MCI settlement. Expense comparisons werealso impacted by 2003 contingency costs incurred in connectionwith labor negotiations and other costs recorded in 2003.
See “Other Factors That May Affect Future Results – Regulatoryand Competitive Trends – Interstate Access Charges andIntercarrier Compensation” for additional information on FCC rule-makings and other court decisions addressing intercarriercompensation for dial-up connections for Internet-bound traffic.
Selling, General and Administrative ExpenseSelling, general and administrative expense includes salaries andwages and benefits not directly attributable to a service or product,bad debt charges, taxes other than income, advertising and salescommission costs, customer billing, call center and informationtechnology costs, professional service fees and rent for administra-tive space.
Selling, general and administrative expense in 2005 decreased by$202 million, or 2.3% compared to 2004. This decrease was attrib-utable to gains on the sale of real estate in 2005, lower property andgross receipts taxes and reduced bad debt costs, partially offset byhigher net pension and benefit costs, as described above, and aprior year gain on the sale of two small business units.
In 2004, our selling, general and administrative expense increasedby $258 million, or 3.1% compared to 2003. This increase includeshigher net pension and benefit costs and higher professional andgeneral costs, partially offset by the effect of workforce reductionsand by lower bad debt expense, reduced property and grossreceipts taxes, and a gain on the sale of two small business units.
Depreciation and Amortization ExpenseThe decreases in depreciation and amortization expense in 2005 of$109 million, or 1.2%, and $197 million, or 2.2% in 2004, weremainly driven by lower rates of depreciation, partially offset byhigher plant, property and equipment balances and software amor-tization costs.
Segment Income (dollars in millions)
Years Ended December 31, 2005 2004 2003
Segment Income $ 1,906 $ 2,652 $ 3,299
Segment income decreased by $746 million, or 28.1% in 2005 and$647 million, or 19.6% in 2004 primarily as a result of the after-taximpact of operating revenues and operating expenses describedabove. Special and non-recurring items of ($168) million, $346 mil-lion and $1,063 million, after-tax, affected the Domestic Telecomsegment but were excluded from segment income in 2005, 2004and 2003, respectively. Special and non-recurring items in 2005 pri-marily included a gain on the sale of the Hawaii wireline operations,Hawaii results of operations, and a net gain on the sale of a NewYork City office building, partially offset by net expenses associatedwith changes to management retirement benefit plans, severancecosts and Verizon Center relocation-related costs. Special and non-recurring items in 2004 primarily included pension settlementlosses, operating asset losses, and costs associated with the earlyretirement of debt, partially offset by an expense credit resultingfrom the favorable resolution of pre-bankruptcy amounts due fromMCI as well as a gain on the sale of an investment. Special andnon-recurring items in 2003 primarily include the costs associatedwith severance activity, including retirement enhancement costs,and pension settlements, partially offset by the favorable impact ofadopting SFAS No. 143.
Domestic Wireless
Our Domestic Wireless segment provides wireless voice and dataservices and equipment sales across the United States. This seg-ment primarily represents the operations of the Verizon Wirelessjoint venture with Vodafone. Verizon owns a 55% interest in the jointventure and Vodafone owns the remaining 45%. All financial resultsincluded in the tables below reflect the consolidated results ofVerizon Wireless.
Operating Revenues (dollars in millions)
Years Ended December 31, 2005 2004 2003
Wireless sales and services $ 32,301 $ 27,662 $ 22,489
Domestic Wireless’s total revenues of $32,301 million were $4,639million, or 16.8% higher in 2005 compared to 2004. Service rev-enues of $28,131 million were $3,731 million, or 15.3% higher than2004. The service revenue growth was primarily due to increasedcustomers, partially offset by a decrease in average revenue percustomer per month. Equipment and other revenue increased by$908 million, or 27.8%, principally as a result of an increase in wire-less devices sold together with an increase in revenue per unit sold.
Our Domestic Wireless segment ended 2005 with 51.3 million cus-tomers, an increase of 7.5 million net new customers, or 17.2%compared to December 31, 2004. Retail net additions accountedfor 7.2 million, or 95.8% of the total net additions. The overall com-position of our Domestic Wireless customer base as of December31, 2005 was 92.4% retail postpaid, 3.1% retail prepaid and 4.5%resellers. The average monthly churn rate, the rate at which cus-tomers disconnect service, decreased to 1.3% in 2005 compared to1.5% in 2004. Retail postpaid churn decreased to 1.1% in 2005compared to 1.3% in 2004.
Average revenue per customer per month decreased 1.5% to$49.49 in 2005 compared to 2004, primarily due to pricing changes
management’s discussion and analysis of results of operations and financial condition continued

23
to our America’s Choice and Family Share plans earlier in the year.Partially offsetting the impact of these pricing changes was a71.7% increase in data revenue per customer in 2005 compared to2004, driven by increased use of our messaging and other dataservices. Data revenues were $2,243 million and accounted for8.0% of service revenue in 2005, compared to $1,116 million and4.6% of service revenue in 2004. Average MOUs per customerincreased to 665, or 16.1% in 2005 compared to 2004.
Domestic Wireless’s total revenues of $27,662 million were $5,173million, or 23.0% higher in 2004 compared to 2003. Service rev-enues of $24,400 million were $4,064 million, or 20.0% higher than2003. This revenue growth was largely attributable to customer addi-tions and higher revenue per customer per month, including higherdata revenue per customer. At December 31, 2004, customerstotaled 43.8 million, an increase of 16.8% compared to December31, 2003. Retail net additions accounted for 5.8 million, or 92.5% ofthe total net additions. Total churn decreased to 1.5% in 2004 com-pared to 1.8% in 2003. Average revenue per customer per monthincreased by 2.8% to $50.22 in 2004 compared to 2003, primarilydue to a larger number of customers on higher access price planofferings as well as an increase in data revenues per subscriber.Data revenues were $1,116 million in 2004 compared to $449 millionin 2003. These increases were partially offset by decreased roamingrevenue due to bundled pricing. Average MOUs per customerincreased to 573, or 16.5% in 2004 compared to 2003.
Operating Expenses (dollars in millions)
Years Ended December 31, 2005 2004 2003
Cost of services and sales $ 9,393 $ 7,747 $ 6,460Selling, general and administrative expense 10,768 9,591 8,057Depreciation and amortization expense 4,760 4,486 3,888
$ 24,921 $ 21,824 $ 18,405
Cost of Services and SalesCost of services and sales, which are costs to operate the wirelessnetwork as well as the cost of roaming, long distance and equip-ment sales, increased by $1,646 million, or 21.2% in 2005compared to 2004. Cost of services increased primarily due tohigher direct wireless network charges resulting from increasedMOUs in 2005 compared to 2004, partially offset by lower roaming,local interconnection and long distance rates. Cost of equipmentsales was higher by 23.0% in 2005, due primarily to an increase inwireless devices sold together with an increase in cost per unitsold, driven by growth in customer additions and an increase inequipment upgrades in 2005 compared to 2004.
Cost of services and sales increased by $1,287 million, or 19.9% in2004 compared to 2003. This increase was due primarily toincreased network costs resulting from increased MOUs and anincrease in cost of equipment sales driven by growth in new cus-tomer additions and increased equipment upgrades. These costincreases were partially offset by lower roaming, local interconnec-tion and long distance rates.
Selling, General and Administrative ExpenseSelling, general and administrative expense increased by $1,177million, or 12.3% in 2005 compared to 2004. This increase was pri-marily due to an increase in salary and benefits expense of $382million, which included a $70 million increase in costs incurred in2005 related to our long-term incentive program, and by anincrease in the employee base, primarily in the customer care andsales channels. Also contributing to the increase were higher sales
commissions in our direct and indirect channels of $215 million, pri-marily related to an increase in customer additions and renewalsduring the year. Costs associated with regulatory fees, primarily theuniversal service fund, increased by $179 million in 2005 comparedto 2004.
Selling, general and administrative expense increased by $1,534million, or 19.0% in 2004 compared to 2003. This increase was dueprimarily to higher salary and benefits expense and increased salescommissions related to the growth in customer additions andhigher costs associated with our long-term incentive program.
Depreciation and Amortization ExpenseDepreciation and amortization expense increased by $274 million,or 6.1% in 2005 compared to 2004 and increased by $598 million,or 15.4% in 2004 compared to 2003. These increases were prima-rily due to increased depreciation expense related to the increasesin depreciable assets.
Segment Income (dollars in millions)
Years Ended December 31, 2005 2004 2003
Segment Income $ 2,219 $ 1,645 $ 1,083
Segment income increased by $574 million, or 34.9% in 2005 com-pared to 2004 and increased by $562 million, or 51.9% in 2004compared to 2003, primarily as a result of the after-tax impact ofoperating revenues and operating expenses described above, par-tially offset by higher minority interest. There were no special itemsaffecting this segment in 2005, 2004 or 2003.
Increases in minority interest in 2005 and 2004 were principally dueto the increased income of the wireless joint venture and the signif-icant minority interest attributable to Vodafone.
Information Services
Information Services’ multi-platform business comprises yellowpages directories, SuperPages.com, our online directory andsearch services, and SuperPages On the Go, our directory andinformation services on wireless telephones. This segment’s opera-tions are principally in the United States.
We sold our directory operations in Hawaii in connection with thesale of Verizon’s wireline properties in Hawaii discussed earlierunder “Consolidated Results of Operations.” For comparability pur-poses, the results of operations shown in the tables below excludethe Hawaii operations that have been sold. In 2004, Verizon soldVerizon Information Services Canada, our directory operations inCanada, to an affiliate of Bain Capital, a private investment firm, for$1.6 billion. The sale resulted in an after-tax gain of $516 million.This gain and current and prior years’ results of operations for thisbusiness unit are classified as discontinued operations in accor-dance with SFAS No. 144, and are excluded from InformationServices segment results.
Operating Revenues (dollars in millions)
Years Ended December 31, 2005 2004 2003
Operating Revenues $ 3,452 $ 3,549 $ 3,763
Operating revenues in 2005 decreased $97 million, or 2.7% com-pared to 2004, primarily due to reduced domestic print advertisingrevenue, partially offset by SuperPages.com revenue growth.Verizon’s domestic Internet directory service, SuperPages.com,achieved growth of 18% in gross revenues compared with 2004.
management’s discussion and analysis of results of operations and financial condition continued

24
Operating revenues in 2004 decreased $214 million, or 5.7% com-pared to 2003, primarily due to reduced domestic print advertisingrevenue and elimination of revenue from the 2003 sale of Europeanoperations. SuperPages.com reported a 22% increase in revenueover 2003.
Operating Expenses (dollars in millions)
Years Ended December 31, 2005 2004 2003
Cost of services and sales $ 593 $ 542 $ 554Selling, general and administrative expense 1,107 1,319 1,387Depreciation and amortization expense 92 87 79Sales of businesses, net – – (141)
$ 1,792 $ 1,948 $ 1,879
Cost of Services and SalesCost of services and sales in 2005 increased $51 million, or 9.4%compared to 2004 and decreased by $12 million, or 2.2% in 2004compared to 2003. The 2005 increase was primarily due to increasedprinting and distribution costs and higher costs associated withSuperPages.com. The decrease in 2004 was primarily due to reducedexpenses related to the July 2003 sale of European operations.
Selling, General and Administrative ExpenseSelling, general and administrative expenses decreased $212 mil-lion, or 16.1% in 2005 compared to 2004. This decrease was dueprimarily to cost reductions, as well as reduced bad debt and legalexpenses. Selling, general and administrative expenses decreased$68 million, or 4.9% in 2004 compared to 2003. Lower bad debtexpenses and reduced expenses related to the July 2003 sale ofEuropean operations were partially offset by higher domestic pen-sion and benefit costs.
Depreciation and Amortization ExpenseDepreciation and amortization expense in 2005 increased by $5million, or 5.7% compared to 2004 and by $8 million, or 10.1% in2004 compared to 2003, primarily due to increased software amor-tization expense.
Sales of Businesses, NetIn 2003, we recorded a net pretax gain of $141 million primarilyrelated to the sale of our European directory publication operations inAustria, the Czech Republic, Gibraltar, Hungary, Poland and Slovakia.
Segment Income (dollars in millions)
Years Ended December 31, 2005 2004 2003
Segment Income $ 1,044 $ 968 $ 1,128
Segment income in 2005 increased by $76 million, or 7.9% com-pared to 2004 and decreased by $160 million, or 14.2% in 2004compared to 2003. The increase in 2005 and decrease in 2004 wereprimarily the result of the after-tax impact of the operating revenuesand expenses described above and lower interest expense in 2005compared to 2004.
Special and non-recurring items of $(10) million, $(596) million,$1,660 million, after-tax, affected the Information Services segmentbut were excluded from segment income in 2005, 2004 and 2003,respectively. The special and non-recurring items in all yearsinclude the results of operations of the Hawaii directory operations.The special and non-recurring items in 2004 and 2003 include theresults of operations of Verizon Information Services Canada. Thespecial and non-recurring items in 2004 also included the gain onthe sale of Verizon Information Services Canada, partially offset bypension settlement losses for employees who received lump-sum
distributions under a prior year voluntary separation plan. Specialand non-recurring items in 2003 also included a loss recorded inconnection with the cumulative effect of the directory accountingchange from the publication-date method of recognizing revenueand expenses to the amortization method, effective January 1,2003, and severance charges related to a voluntary separation plan.
International
Our International segment includes international wireline and wire-less telecommunication operations in the Americas and Europe.Our consolidated international investments as of December 31,2005 included Verizon Dominicana, C. por A. (Verizon Dominicana)in the Dominican Republic and TELPRI in Puerto Rico. Either thecost or the equity method is applied to those investments in whichwe have less than a controlling interest.
On June 13, 2003, we announced our decision to sell our 39.4%consolidated interest in Iusacell and reclassified our investment andthe results of operations of Iusacell as discontinued operations. Wesold our shares in Iusacell on July 29, 2003. The results of opera-tions for this business unit in 2003 are classified as discontinuedoperations in accordance with SFAS No. 144, and are excludedfrom International segment results.
Operating Revenues (dollars in millions)
Years Ended December 31, 2005 2004 2003
Operating Revenues $ 2,193 $ 2,014 $ 1,949
Revenues generated by our international businesses increased by$179 million, or 8.9% in 2005 compared to 2004 and increased by$65 million, or 3.3% in 2004 compared to 2003. The increase in2005 was primarily due to favorable foreign exchange rates in theDominican Republic as well as favorable wireless growth at bothTELPRI and Verizon Dominicana, partially offset by a favorableadjustment to carrier access revenues at TELPRI in 2004. Theincrease in 2004 was primarily due to operational growth at VerizonDominicana and a 2003 adjustment to carrier access revenues atTELPRI, partially offset by declining foreign exchange rates in theDominican Republic.
Operating Expenses (dollars in millions)
Years Ended December 31, 2005 2004 2003
Cost of services and sales $ 707 $ 626 $ 574Selling, general and administrative expense 675 471 691Depreciation and amortization expense 340 324 346
$ 1,722 $ 1,421 $ 1,611
Cost of Services and SalesCost of services and sales increased in 2005 by $81 million, or12.9% compared to 2004 and by $52 million, or 9.1% in 2004 com-pared to 2003. The increase in 2005 was due primarily to highervariable costs at Verizon Dominicana and at TELPRI as well as theappreciation of the Dominican Republic peso. The increase in 2004reflected higher variable costs at Verizon Dominicana, partially offsetby the decline of the Dominican Republic’s foreign exchange rates.
Selling, General and Administrative ExpenseSelling, general and administrative expenses increased in 2005 by$204 million, or 43.3% compared to 2004 and decreased by $220million, or 31.8% in 2004 compared to 2003. The increase in 2005reflects the favorable resolution in 2004 of a 2003 TELPRI chargerecorded as a result of an adverse Puerto Rico Circuit Court ofAppeals ruling on intra-island long distance access rates, the
management’s discussion and analysis of results of operations and financial condition continued

25
appreciation of the Dominican Republic peso and higher employee-related costs and commission expenses. The decrease in 2004 wasprimarily due to a TELPRI charge recorded in 2003 as a result of thePuerto Rico Circuit Court of Appeals ruling as well as the favorableresolution to the charge in 2004, an asset write-off in 2003, anddeclining foreign exchange rates in the Dominican Republic.
Depreciation and Amortization ExpenseDepreciation and amortization expense increased in 2005 by $16million, or 4.9% compared to 2004 and decreased $22 million, or6.4% in 2004 compared to 2003. The increase in 2005 primarilyreflects the appreciation of the Dominican Republic peso. Thedecrease in 2004 was due primarily to declining foreign exchangerates in the Dominican Republic and the adoption of SFAS No. 143in 2003, offset in part by increased depreciation related to ongoingnetwork capital expenditures in 2004.
Segment Income (dollars in millions)
Years Ended December 31, 2005 2004 2003
Segment Income $ 1,251 $ 1,225 $ 1,392
Segment income increased in 2005 by $26 million, or 2.1% com-pared to 2004 and decreased by $167 million, or 12.0% in 2004compared to 2003. The increase in 2005 reflects an increase ininterest income, foreign exchange gains and lower income taxes,largely offset by lower equity in earnings of unconsolidated busi-nesses and Verizon’s share (after minority interest) of the after-taximpact of the operating revenues and operating expenses previ-ously described. The decrease in 2004 was primarily the result ofthe decrease in equity in earnings of unconsolidated businesses andincome from other unconsolidated businesses, partially offset byVerizon’s share (after minority interest) of the after-tax impact of theoperating revenues and operating expenses previously described.
Equity in earnings of unconsolidated businesses decreased in 2005by $224 million, or 21.7% compared to 2004 and decreased by $60million, or 5.5% in 2004 compared to 2003. The decrease in 2005primarily resulted from lower equity income due to the sale of ourTELUS interest in 2004, estimated additional pension liabilities atCANTV and the gain on the sale of an equity investment in 2004,partially offset by higher tax benefits and operational results atVodafone Omnitel. The decrease in 2004 was driven primarily fromItalian tax benefits in 2003 arising from a reorganization and the2003 contribution tax reversal that resulted from a favorableEuropean Court of Justice ruling at Vodafone Omnitel, partiallyoffset by favorable foreign currency impacts from the euro on thatinvestment and continued operational growth, as well as a gain onthe sale of an equity investment in 2004. Income from other uncon-solidated businesses decreased by $138 million, or 81.7% in 2004compared to 2003. This decrease reflects lower gains realized fromthe sale of investments compared to 2003.
Special and non-recurring items of $(112) million, $(797) million and$791 million, after-tax, affected the International segment but wereexcluded from segment income in 2005, 2004 and 2003, respec-tively. The special and non-recurring items in 2005 primarily relatedto tax benefits realized in connection with prior years’ investmentlosses, partially offset by a net tax provision from the repatriation offoreign earnings. The special and non-recurring items in 2004 wererelated to the gain on sale of our investment in TELUS and tax ben-efits realized in connection with prior years’ sales of investments,partially offset by pension settlement losses for employees thatreceived lump-sum distributions under a voluntary separation plan.
The special and non-recurring items in 2003 include the impairmentof our investment in Iusacell, partially offset by a gain on the sale ofEurotel Praha.
SPECIAL ITEMS
Discontinued Operations
During 2004, we announced our decision to sell Verizon InformationServices Canada to an affiliate of Bain Capital, a global privateinvestment firm, for $1,540 million (Cdn. $1,985 million). The saleclosed during the fourth quarter of 2004 and resulted in a gain of$1,017 million ($516 million after-tax, or $.18 per diluted share). Inaccordance with SFAS No. 144, we have classified the results ofoperations of Verizon Information Services Canada as discontinuedoperations in the consolidated statements of income in all years.
During 2003, we announced our decision to sell our 39.4% consol-idated interest in Iusacell into a tender offer launched by MovilAccess, a Mexican company. Verizon tendered its shares shortlyafter the tender offer commenced, and the tender offer closed onJuly 29, 2003. In accordance with SFAS No. 144, we have classifiedthe results of operations of Iusacell as discontinued operations inthe consolidated statements of income in all years until the sale. Inconnection with a comparison of expected net sale proceeds to netbook value of our investment in Iusacell (including the foreign cur-rency translation balance), we recorded a pretax loss of $957million ($931 million after-tax, or $.33 per diluted share).
Sales of Businesses and Investments, Net
Sales of Businesses, NetDuring 2005, we sold our wireline and directory businesses inHawaii, including Verizon Hawaii Inc. which operated approximately700,000 switched access lines, as well as the services and assetsof Verizon Long Distance, Verizon Online, Verizon InformationServices and Verizon Select Services Inc. in Hawaii, to an affiliate ofThe Carlyle Group for $1,326 million in cash proceeds. In connec-tion with this sale, we recorded a net pretax gain of $530 million($336 million after-tax, or $.12 per diluted share).
Sales of Investments, NetDuring 2004, we recorded a pretax gain of $787 million ($565 millionafter-tax, or $.20 per diluted share) on the sale of our 20.5% interestin TELUS in an underwritten public offering in the U.S. and Canada.In connection with this sale transaction, Verizon recorded a contri-bution of $100 million to Verizon Foundation to fund its charitableactivities and increase its self-sufficiency. Consequently, werecorded a net gain of $500 million after taxes, or $.18 per dilutedshare related to this transaction and the accrual of the VerizonFoundation contribution.
Also during 2004, we sold all of our investment in Iowa Telecompreferred stock, which resulted in a pretax gain of $43 million ($43million after-tax, or $.02 per diluted share). This preferred stock wasreceived in 2000 in connection with the sale of access lines in Iowa.
During 2003, we recorded a pretax gain of $348 million on the saleof our interest in Eurotel Praha. Also during 2003, we recorded a netpretax gain of $176 million as a result of a payment received in con-nection with the liquidation of Genuity. In connection with thesesales transactions, Verizon recorded contributions of $150 millionfor each of the transactions to Verizon Foundation to fund its
management’s discussion and analysis of results of operations and financial condition continued

During 2004, we recorded pretax pension settlement losses of $815million ($499 million after-tax, or $.18 per diluted share) related toemployees that received lump-sum distributions during 2004 inconnection with the voluntary separation plan under which morethan 21,000 employees accepted the separation offer in the fourthquarter of 2003. These charges were recorded in accordance withSFAS No. 88, which requires that settlement losses be recordedonce prescribed payment thresholds have been reached.
Total pension, benefit and other costs related to severance activi-ties were $5,524 million ($3,399 million after-tax, or $1.20 perdiluted share) in 2003, primarily in connection with the voluntaryseparation of more than 25,000 employees, as follows:
• In connection with the voluntary separation of more than 21,000employees during the fourth quarter of 2003, we recorded apretax charge of $4,695 million ($2,882 million after-tax, or $1.02per diluted share). This pretax charge included $2,716 millionrecorded in accordance with SFAS No. 88 and SFAS No. 106, forpension and postretirement benefit enhancements and a net cur-tailment gain for a significant reduction of the expected years offuture service resulting from early retirements. In addition, werecorded a pretax charge of $76 million for pension settlementlosses related to lump-sum settlements of some existing pensionobligations. The fourth quarter pretax charge also included sev-erance costs of $1,720 million and costs related to otherseverance-related activities of $183 million.
• We also recorded a special charge in 2003 of $235 million ($150million after-tax, or $.05 per diluted share) primarily associatedwith employee severance costs and severance-related activitiesin connection with the voluntary separation of approximately4,000 employees. In addition, we recorded pretax pension set-tlement losses of $131 million ($81 million after-tax, or $.03 perdiluted share) in 2003 related to employees that received lump-sum distributions during the year in connection with previouslyannounced employee separations.
• Further, in 2003 we recorded a special charge of $463 million($286 million after-tax, or $.10 per diluted share) in connectionwith enhanced pension benefits granted to employees retiring inthe first half of 2003, estimated costs associated with the July10, 2003 Verizon New York arbitration ruling and pension settle-ment losses related to lump-sum pay-outs in 2003. On July 10,2003, an arbitrator ruled that Verizon New York’s termination of2,300 employees in 2002 was not permitted under a union con-tract; similar cases were pending impacting an additional 1,100employees. Verizon offered to reinstate all 3,400 impactedemployees, and accordingly, recorded a charge in the secondquarter of 2003 representing estimated payments to employeesand other related company-paid costs.
Other Special Items
During 2005, we recorded pretax charges of $139 million ($133 mil-lion after-tax, or $.05 per diluted share) including a pretaximpairment charge of $125 million ($125 million after-tax, or $.04per diluted share) pertaining to our leasing operations for aircraftleases involved in recent airline bankruptcy proceedings and apretax charge of $14 million ($8 million after-tax, or less than $.01per diluted share) in connection with the early retirement of debt.
In 2004, we recorded an expense credit of $204 million ($123 millionafter-tax, or $.04 per diluted share) resulting from the favorable reso-lution of pre-bankruptcy amounts due from MCI. Previously reached
charitable activities and increase its self-sufficiency. Consequently,we recorded a net gain of $44 million after taxes, or $.02 per dilutedshare related to these transactions and the accrual of the VerizonFoundation contributions.
Tax Matters
During 2005, we recorded a tax benefit of $336 million ($.12 perdiluted share) in connection with capital gains and prior year invest-ment losses. As a result of the capital gain realized in 2005 inconnection with the sale of our Hawaii businesses, we recorded atax benefit of $242 million ($.09 per diluted share) related to prioryear investment losses. The investment losses pertain to Iusacell,CTI Holdings, S.A. (CTI) and TelecomAsia.
Also during 2005, we recorded a net tax provision of $206 million($.07 per diluted share) related to the repatriation of foreign earn-ings under the provisions of the American Jobs Creation Act of2004, which provides for a favorable federal income tax rate in con-nection with the repatriation of foreign earnings, provided thecriteria described in the law is met. Two of Verizon’s foreign invest-ments repatriated earnings resulting in income taxes of $332million, partially offset by a tax benefit of $126 million.
As a result of the capital gain realized in 2004 in connection with thesale of Verizon Information Services Canada, we recorded tax ben-efits of $234 million ($.08 per diluted share) in the fourth quarter of2004 pertaining to prior year investment impairments. The invest-ment impairments primarily related to debt and equity investmentsin CTI, Cable & Wireless plc and NTL Incorporated.
Facility and Employee-Related Items
During 2005, we recorded a net pretax gain of $18 million ($8 mil-lion after-tax, or less than $.01 per diluted share) in connection withour planned relocation of several functions to Verizon Center,including a pretax gain of $120 million ($72 million after-tax, or $.03per diluted share) related to the sale of a New York City officebuilding, partially offset by a pretax charge of $102 million ($64 mil-lion after-tax, or $.02 per diluted share) primarily associated withrelocation-related employee severance costs and related activities.Additional relocation costs are anticipated in 2006.
During 2005, we recorded a net pretax charge of $98 million ($59million after-tax, or $.02 per diluted share) related to the restruc-turing of the Verizon management retirement benefit plans. Thispretax charge was recorded in accordance with SFAS No. 88,“Employers’ Accounting for Settlements and Curtailments ofDefined Benefit Pension Plans and for Termination Benefits” andSFAS No. 106, “Employers’ Accounting for Postretirement BenefitsOther Than Pensions” and includes the unamortized cost of priorpension enhancements of $441 million offset partially by a pretaxcurtailment gain of $343 million related to retiree medical benefits. Inconnection with this restructuring, management employees will nolonger earn pension benefits or earn service towards the companyretiree medical subsidy after June 30, 2006, after receiving an 18-month enhancement of the value of their pension and retiree medicalsubsidy, but will receive a higher savings plan matching contribution.
In addition, during 2005 we recorded a charge of $59 million ($36million after-tax, or $.01 per diluted share) associated withemployee severance costs and severance-related activities in con-nection with the voluntary separation program for surplusunion-represented employees.
26
management’s discussion and analysis of results of operations and financial condition continued

The increase in working capital requirements was driven by higherseverance payments in 2004 compared to higher severanceaccruals in 2003, primarily related to the fourth quarter 2003 volun-tary separation plan. In addition, a higher tax refund was recordedin the 2003 period.
Cash Flows Used In Investing Activities
Capital expenditures continue to be our primary use of capitalresources and facilitate the introduction of new products and serv-ices, enhance responsiveness to competitive challenges andincrease the operating efficiency and productivity of our networks.Including capitalized software, we invested $8,267 million in ourDomestic Telecom business in 2005, compared to $7,118 millionand $6,820 million in 2004 and 2003, respectively. We also invested$6,484 million in our Domestic Wireless business in 2005, com-pared to $5,633 million and $4,590 million in 2004 and 2003,respectively. The increase in capital spending of both DomesticTelecom and Domestic Wireless represents our continuing effort toinvest in high growth areas including wireless, long distance, broad-band and other wireline data initiatives.
In 2006, capital expenditures including capitalized software areexpected to be in the range of $15.4 billion to $15.7 billion, excludingcapital expenditures associated with MCI. Including MCI, capitalexpenditures are expected to be $17.0 billion to $17.4 billion in 2006.
We invested $4,684 million in acquisitions and investments in busi-nesses during 2005, including $3,003 million to acquire NextWaveTelecom Inc. (NextWave) personal communications serviceslicenses, $641 million to acquire 63 broadband wireless licenses inconnection with FCC auction 58, $419 million to purchase QwestWireless, LLC’s spectrum licenses and wireless network assets inseveral existing and new markets, $230 million to purchase spec-trum from MetroPCS, Inc. and $297 million for other wirelessproperties and licenses. In 2004, we invested $1,196 million in acqui-sitions and investments in businesses, including $1,052 million forwireless licenses and businesses, including the NextWave licensescovering the New York metropolitan area, and $144 million related toVerizon’s limited partnership investments in entities that invest inaffordable housing projects. In 2003, we invested $1,162 million inacquisitions and investments in businesses, including $762 million toacquire 50 wireless licenses and related network assets fromNorthcoast Communications LLC, $242 million related to Verizon’slimited partnership investments in entities that invest in affordablehousing projects and $157 million for other wireless properties.
In 2005, we received cash proceeds of $1,326 million in connectionwith the sale of Verizon’s wireline and directory operations inHawaii. In 2004, we received cash proceeds of $1,720 million,including $1,603 million from the sale of Verizon InformationServices Canada and $117 million from the sale of a small businessunit. In 2003, we received cash proceeds of $229 million, from thesale of our European directory publication operations in Austria, theCzech Republic, Gibraltar, Hungary, Poland and Slovakia.
Our short-term investments include principally cash equivalentsheld in trust accounts for payment of employee benefits. In 2005,2004 and 2003, we invested $1,978 million, $1,827 million and$1,887 million, respectively, in short-term investments, primarily topre-fund active employees’ health and welfare benefits. Proceedsfrom the sales of all short-term investments, principally for the pay-ment of these benefits, were $1,634 million, $1,727 million and$1,767 million in the years 2005, 2004 and 2003, respectively.
settlement agreements became fully effective when MCI emergedfrom bankruptcy proceedings in the second quarter of 2004.
Also during 2004, we recorded a charge of $113 million ($87 millionafter-tax, or $.03 per diluted share) related to operating asset lossespertaining to our international long distance and data network. Inaddition, we recorded pretax charges of $55 million ($34 millionafter-tax, or $.01 per diluted share) in connection with the earlyretirement of debt.
During 2003, we recorded other special pretax charges of $557 mil-lion ($419 million after-tax, or $.15 per diluted share). These chargesincluded $240 million ($156 million after-tax, or $.06 per dilutedshare) primarily in connection with environmental remediationefforts relating to several discontinued businesses, including aformer facility that processed nuclear fuel rods in Hicksville, NewYork (see “Other Factors That May Affect Future Results – RecentDevelopments – Environmental Matters”) and a pretax impairmentcharge of $184 million ($184 million after-tax, or $.06 per dilutedshare) pertaining to our leasing operations for airplanes leased toairlines experiencing financial difficulties and for power generatingfacilities. These 2003 charges also include pretax charges of $61million ($38 million after-tax, or $.01 per diluted share) related to theearly retirement of debt and other pretax charges of $72 million ($41million after-tax, or $.01 per diluted share).
CONSOLIDATED FINANCIAL CONDITION
(dollars in millions)
Years Ended December 31, 2005 2004 2003
Cash Flows Provided By (Used In)Operating activities $ 22,012 $ 21,820 $ 22,467Investing activities (18,492) (10,343) (12,236)Financing activities (5,034) (9,856) (10,959)Increase (Decrease) In Cash and
Cash Equivalents $ (1,514) $ 1,621 $ (728)
We use the net cash generated from our operations to fund networkexpansion and modernization, repay external financing, pay divi-dends and invest in new businesses. Additional external financingis utilized when necessary. While our current liabilities typicallyexceed current assets, our sources of funds, primarily from opera-tions and, to the extent necessary, from readily available externalfinancing arrangements, are sufficient to meet ongoing operatingand investing requirements. We expect that capital spendingrequirements will continue to be financed primarily through inter-nally generated funds. Additional debt or equity financing may beneeded to fund additional development activities or to maintain ourcapital structure to ensure our financial flexibility.
Cash Flows Provided By Operating Activities
Our primary source of funds continues to be cash generated fromoperations. In 2005, the increase in cash from operations comparedto 2004 was primarily driven by the repatriation of $2.2 billion of for-eign earnings from unconsolidated businesses and lower severancepayments in 2005, largely offset by cash income tax payments,including taxes paid in 2005 related to the 2004 sales of VerizonInformation Services Canada and TELUS shares, and higher pen-sion fund contributions.
In 2004, the decrease in cash from operations compared to 2003was primarily driven by an increase in working capital requirements.
27
management’s discussion and analysis of results of operations and financial condition continued

and $1,239 million of other corporate long-term debt, and reducedour short-term borrowings by $1,330 million with cash from opera-tions and the issuance of Verizon Global Funding, DomesticTelecom and Domestic Wireless long-term debt. Verizon GlobalFunding, Domestic Telecom and Domestic Wireless issued long-term debt with principal amounts of $1,500 million, $1,653 millionand $1,525 million, respectively, resulting in total cash proceeds of$4,591 million, net of discounts, costs and a payment related to ahedge on the interest rate for an anticipated financing.
Our ratio of debt to debt combined with shareowners’ equity was49.6% at December 31, 2005 compared to 51.1% at December 31, 2004.
As of December 31, 2005, we had $11 million in bank borrowingsoutstanding. We also had approximately $6.7 billion of unusedbank lines of credit (including a $6.0 billion three-year committedfacility which expires in June 2008, a $400 million one-year com-mitted facility for TELPRI which expires in February 2006 andvarious other facilities totaling approximately $400 million). In addi-tion, our financing subsidiary had shelf registrations for theissuance of up to $8.5 billion of unsecured debt securities. Thedebt securities of our telephone and financing subsidiaries con-tinue to be accorded high ratings by primary rating agencies. InFebruary 2005, both Standard & Poor’s and Moody’s InvestorsService (Moody’s) indicated that the proposed acquisition of MCI(see “Other Factors That May Affect Future Results – RecentDevelopments – MCI Merger”) may result in downgrades inVerizon’s debt ratings. At that time, Moody’s placed the short-termand long-term debt of Verizon and its telephone subsidiaries onreview for possible downgrade, while simultaneously changing theoutlook on the A3-rated Verizon Wireless debt to stable from posi-tive. Standard & Poor’s placed the A+ long-term debt rating ofVerizon and affiliates (including Verizon Wireless) on credit watchwith negative implications. Fitch Ratings also placed the A+ ratingof Verizon, along with the ratings of its affiliates, on ratings watchnegative as a result of the proposed acquisition of MCI. InDecember 2005, Moody’s downgraded the long-term debt rating ofVerizon to A3 from A2. At the same time, the short-term debt rat-ings of Verizon Global Funding and Verizon Network Funding werechanged to Prime-2 from Prime-1. Both outlooks were changed tostable. Moody’s also placed the A3-rated long-term debt of VerizonWireless on review for possible upgrade. These actions resolvedthe reviews initiated in February 2005. In January 2006, FitchRatings affirmed the A+ long-term debt ratings of Verizon and affil-iates (including Verizon Wireless), removed them from rating watchnegative, and assigned stable rating outlooks. The F1 short-termdebt ratings of Verizon Global Funding and Verizon NetworkFunding were also affirmed. These short-term ratings had not beenon rating watch negative. Also in January 2006, Standard & Poor’slowered the long-term ratings of Verizon and subsidiaries (includingVerizon Wireless) to A from A+, removed them from credit watch,and assigned a negative outlook. Short-term ratings assigned byStandard & Poor’s to Verizon remain at A-1.
We and our consolidated subsidiaries are in compliance with all ofour debt covenants.
As in prior years, dividend payments were a significant use of capitalresources. We determine the appropriateness of the level of our div-idend payments on a periodic basis by considering such factors aslong-term growth opportunities, internal cash requirements and theexpectations of our shareowners. In 2005, Verizon increased its quar-
Other, net investing activities for 2005 includes a net investment of$913 million for the purchase of 43.4 million shares of MCI commonstock from eight entities affiliated with Carlos Slim Helu, offset bycash proceeds of $713 million from property sales, including a NewYork City office building, and $349 million of repatriated proceedsfrom the sales of European investments in prior years. Other, netinvesting activities for 2004 include net cash proceeds of $1,632million received in connection with the sale of our 20.5% interest inTELUS and $650 million in connection with sales of our interests invarious other investments, including a partnership venture withCrown Castle International Corp., EuroTel Bratislava, a.s. and IowaTelecom preferred stock. Other, net investing activities for 2003include net cash proceeds of $415 million in connection with salesof our interests in various investments, primarily TCC and CrownCastle International Corp. and $195 million in connection with thesale of our interest in Eurotel Praha, representing a portion of thetotal proceeds of $525 million.
Under the terms of an investment agreement, Vodafone may requireVerizon Wireless to purchase up to an aggregate of $20 billion worthof Vodafone’s interest in Verizon Wireless at designated times at itsthen fair market value. In the event Vodafone exercises its put rights,we have the right, exercisable at our sole discretion, to purchase upto $12.5 billion of Vodafone’s interest instead of Verizon Wireless forcash or Verizon stock at our option. Vodafone had the right torequire the purchase of up to $10 billion during the 61-day periodopening on June 10 and closing on August 9 in 2005, and did notexercise that right. As a result, Vodafone still has the right to requirethe purchase of up to $20 billion worth of its interest, not to exceed$10 billion in any one year, during a 61-day period opening on June10 and closing on August 9 in 2006 and 2007. Vodafone also mayrequire that Verizon Wireless pay for up to $7.5 billion of the requiredrepurchase through the assumption or incurrence of debt.
Cash Flows Used In Financing Activities
Cash of $303 million was used to reduce our total debt during 2005.We repaid $1,533 million of Domestic Wireless, $1,183 million ofDomestic Telecom, $996 million of Verizon Global Funding Corp.,$113 million of other corporate and $93 million of International long-term debt. The Domestic Telecom debt repayment includes theearly retirement of $350 million of long-term debt and $806 millionof other long-term debt at maturity. This decrease was largely offsetby the issuance by Verizon Global Funding of long-term debt with atotal principal amount of $1,500 million, resulting in total cash pro-ceeds of $1,478 million, net of discounts and costs, and an increasein our short-term borrowings of $2,129 million.
Cash of $5,467 million was used to reduce our total debt during2004. We repaid $2,315 million and $2,769 million of DomesticTelecom and corporate long-term debt, respectively. The DomesticTelecom debt repayment includes the early retirement of $1,275million of long-term debt and $950 million of other long-term debtat maturity. The corporate debt repayment includes $1,984 millionof zero-coupon convertible notes redeemed by Verizon GlobalFunding and $723 million of other corporate long-term debt atmaturity. Also, during 2004, we decreased our short-term borrow-ings by $783 million and Verizon Global Funding issued $500 millionof long-term debt.
Cash of $7,436 million was used to reduce our total debt during2003. We repaid $5,646 million of Verizon Global Funding, $2,190million of Domestic Telecom, $1,582 million of Domestic Wireless
28
management’s discussion and analysis of results of operations and financial condition continued
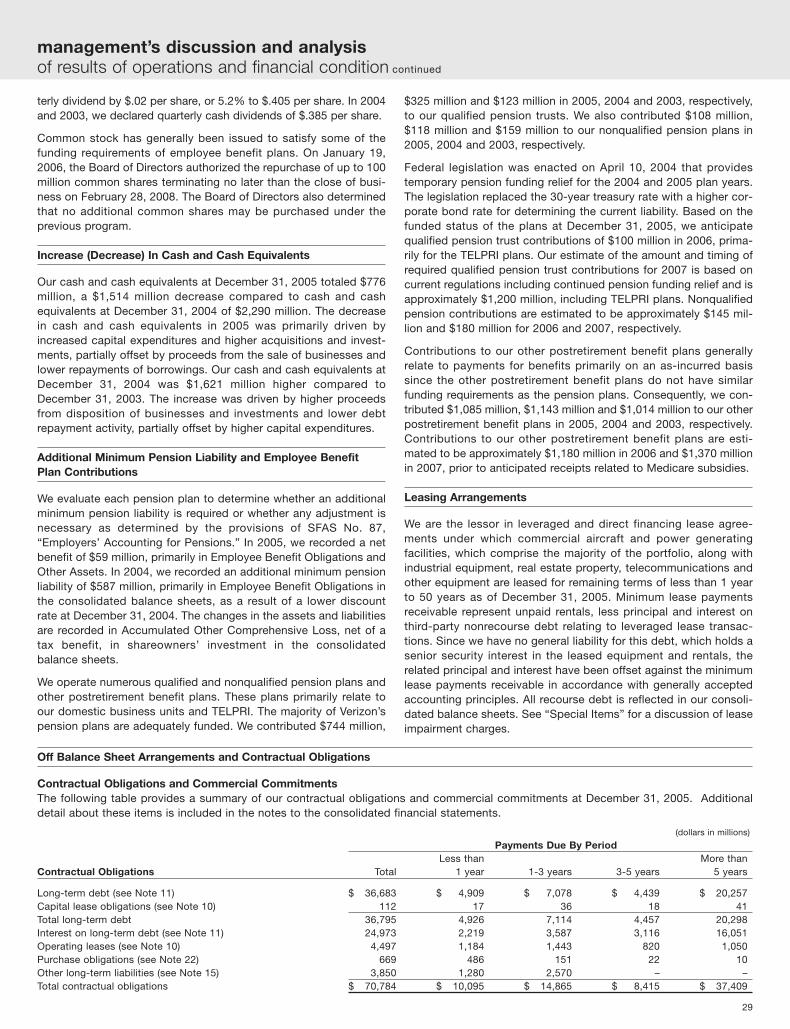
$325 million and $123 million in 2005, 2004 and 2003, respectively,to our qualified pension trusts. We also contributed $108 million,$118 million and $159 million to our nonqualified pension plans in2005, 2004 and 2003, respectively.
Federal legislation was enacted on April 10, 2004 that providestemporary pension funding relief for the 2004 and 2005 plan years.The legislation replaced the 30-year treasury rate with a higher cor-porate bond rate for determining the current liability. Based on thefunded status of the plans at December 31, 2005, we anticipatequalified pension trust contributions of $100 million in 2006, prima-rily for the TELPRI plans. Our estimate of the amount and timing ofrequired qualified pension trust contributions for 2007 is based oncurrent regulations including continued pension funding relief and isapproximately $1,200 million, including TELPRI plans. Nonqualifiedpension contributions are estimated to be approximately $145 mil-lion and $180 million for 2006 and 2007, respectively.
Contributions to our other postretirement benefit plans generallyrelate to payments for benefits primarily on an as-incurred basissince the other postretirement benefit plans do not have similarfunding requirements as the pension plans. Consequently, we con-tributed $1,085 million, $1,143 million and $1,014 million to our otherpostretirement benefit plans in 2005, 2004 and 2003, respectively.Contributions to our other postretirement benefit plans are esti-mated to be approximately $1,180 million in 2006 and $1,370 millionin 2007, prior to anticipated receipts related to Medicare subsidies.
Leasing Arrangements
We are the lessor in leveraged and direct financing lease agree-ments under which commercial aircraft and power generatingfacilities, which comprise the majority of the portfolio, along withindustrial equipment, real estate property, telecommunications andother equipment are leased for remaining terms of less than 1 yearto 50 years as of December 31, 2005. Minimum lease paymentsreceivable represent unpaid rentals, less principal and interest onthird-party nonrecourse debt relating to leveraged lease transac-tions. Since we have no general liability for this debt, which holds asenior security interest in the leased equipment and rentals, therelated principal and interest have been offset against the minimumlease payments receivable in accordance with generally acceptedaccounting principles. All recourse debt is reflected in our consoli-dated balance sheets. See “Special Items” for a discussion of leaseimpairment charges.
terly dividend by $.02 per share, or 5.2% to $.405 per share. In 2004and 2003, we declared quarterly cash dividends of $.385 per share.
Common stock has generally been issued to satisfy some of thefunding requirements of employee benefit plans. On January 19,2006, the Board of Directors authorized the repurchase of up to 100million common shares terminating no later than the close of busi-ness on February 28, 2008. The Board of Directors also determinedthat no additional common shares may be purchased under theprevious program.
Increase (Decrease) In Cash and Cash Equivalents
Our cash and cash equivalents at December 31, 2005 totaled $776million, a $1,514 million decrease compared to cash and cashequivalents at December 31, 2004 of $2,290 million. The decreasein cash and cash equivalents in 2005 was primarily driven byincreased capital expenditures and higher acquisitions and invest-ments, partially offset by proceeds from the sale of businesses andlower repayments of borrowings. Our cash and cash equivalents atDecember 31, 2004 was $1,621 million higher compared toDecember 31, 2003. The increase was driven by higher proceedsfrom disposition of businesses and investments and lower debtrepayment activity, partially offset by higher capital expenditures.
Additional Minimum Pension Liability and Employee BenefitPlan Contributions
We evaluate each pension plan to determine whether an additionalminimum pension liability is required or whether any adjustment isnecessary as determined by the provisions of SFAS No. 87,“Employers’ Accounting for Pensions.” In 2005, we recorded a netbenefit of $59 million, primarily in Employee Benefit Obligations andOther Assets. In 2004, we recorded an additional minimum pensionliability of $587 million, primarily in Employee Benefit Obligations inthe consolidated balance sheets, as a result of a lower discountrate at December 31, 2004. The changes in the assets and liabilitiesare recorded in Accumulated Other Comprehensive Loss, net of atax benefit, in shareowners’ investment in the consolidated balance sheets.
We operate numerous qualified and nonqualified pension plans andother postretirement benefit plans. These plans primarily relate toour domestic business units and TELPRI. The majority of Verizon’spension plans are adequately funded. We contributed $744 million,
29
management’s discussion and analysis of results of operations and financial condition continued
Off Balance Sheet Arrangements and Contractual Obligations
Contractual Obligations and Commercial CommitmentsThe following table provides a summary of our contractual obligations and commercial commitments at December 31, 2005. Additionaldetail about these items is included in the notes to the consolidated financial statements.
(dollars in millions)
Payments Due By PeriodLess than More than
Contractual Obligations Total 1 year 1-3 years 3-5 years 5 years
Long-term debt (see Note 11) $ 36,683 $ 4,909 $ 7,078 $ 4,439 $ 20,257Capital lease obligations (see Note 10) 112 17 36 18 41Total long-term debt 36,795 4,926 7,114 4,457 20,298Interest on long-term debt (see Note 11) 24,973 2,219 3,587 3,116 16,051Operating leases (see Note 10) 4,497 1,184 1,443 820 1,050Purchase obligations (see Note 22) 669 486 151 22 10Other long-term liabilities (see Note 15) 3,850 1,280 2,570 – –Total contractual obligations $ 70,784 $ 10,095 $ 14,865 $ 8,415 $ 37,409

Guarantees
In connection with the execution of agreements for the sales ofbusinesses and investments, Verizon ordinarily provides represen-tations and warranties to the purchasers pertaining to a variety ofnonfinancial matters, such as ownership of the securities beingsold, as well as financial losses.
Subsequent to the sale of Verizon Information Services Canada (see“Special Items – Discontinued Operations”), our InformationServices segment continues to provide a guarantee to publishdirectories, which was issued when the directory business was pur-chased in 2001 and had a 30-year term (before extensions). Thepreexisting guarantee continues, without modification, following thesale of Verizon Information Services Canada. The possible financialimpact of the guarantee, which is not expected to be adverse,cannot be reasonably estimated since a variety of the potential out-comes available under the guarantee result in costs and revenuesor benefits that may offset. In addition, performance under theguarantee is not likely.
As of December 31, 2005, letters of credit totaling $140 million hadbeen executed in the normal course of business, which support sev-eral financing arrangements and payment obligations to third parties.
MARKET RISK
We are exposed to various types of market risk in the normal courseof business, including the impact of interest rate changes, foreigncurrency exchange rate fluctuations, changes in equity investmentprices and changes in corporate tax rates. We employ risk manage-ment strategies using a variety of derivatives, including interest rateswap agreements, interest rate locks, foreign currency forwardsand collars and equity options. We do not hold derivatives fortrading purposes.
It is our general policy to enter into interest rate, foreign currencyand other derivative transactions only to the extent necessary toachieve our desired objectives in limiting our exposures to the var-ious market risks. Our objectives include maintaining a mix of fixedand variable rate debt to lower borrowing costs within reasonablerisk parameters and to protect against earnings and cash flowvolatility resulting from changes in market conditions. We do nothedge our market risk exposure in a manner that would completelyeliminate the effect of changes in interest rates, equity prices andforeign exchange rates on our earnings. We do not expect that ournet income, liquidity and cash flows will be materially affected bythese risk management strategies.
Interest Rate Risk
The table that follows summarizes the fair values of our long-termdebt and interest rate derivatives as of December 31, 2005 and2004. The table also provides a sensitivity analysis of the estimatedfair values of these financial instruments assuming 100-basis-pointupward and downward parallel shifts in the yield curve. Our sensi-tivity analysis did not include the fair values of our commercialpaper and bank loans because they are not significantly affected bychanges in market interest rates.
(dollars in millions)
Fair Value Fair Valueassuming assuming
+100 basis –100 basisAt December 31, 2005 Fair Value point shift point shift
Long-term debt and interest rate derivatives $ 38,052 $ 36,123 $ 40,202
At December 31, 2004
Long-term debt and interest rate derivatives $ 42,072 $ 39,952 $ 44,378
Foreign Currency Translation
The functional currency for our foreign operations is the local cur-rency. At December 31, 2005, our primary translation exposure wasto the Venezuelan bolivar, Dominican Republic peso and the euro.The translation of income statement and balance sheet amounts ofour foreign operations into U.S. dollars are recorded as cumulativetranslation adjustments, which are included in Accumulated OtherComprehensive Loss in our consolidated balance sheets. We alsoperiodically hold cash balances in foreign currencies. The transla-tion of foreign currency cash balances is recorded in theconsolidated statements of income in Other Income and (Expense),Net. During 2005, the translation of these cash balances were notmaterial. During 2005, we entered into zero cost euro collars tohedge a portion of our net investment in Vodafone Omnitel. Inaccordance with the provisions of SFAS No. 133, “Accounting forDerivative Instruments and Hedging Activities” and related amend-ments and interpretations, changes in the fair value of thesecontracts due to exchange rate fluctuations are recognized inAccumulated Other Comprehensive Loss and offset the impact offoreign currency changes on the value of our net investment in theoperation being hedged. As of December 31, 2005, our positions inthe zero cost euro collars have been settled. We have not hedgedour accounting translation exposure to foreign currency fluctuationsrelative to the carrying value of our other investments.
During 2004, we entered into foreign currency forward contracts tohedge our net investment in our Canadian operations and invest-ments. In accordance with the provisions of SFAS No. 133, changesin the fair value of these contracts due to exchange rate fluctuationswere recognized in Accumulated Other Comprehensive Loss andoffset the impact of foreign currency changes on the value of ournet investment in the operations being hedged. During 2004, wesold our Canadian operations and investments. Accordingly, theunrealized losses on these net investment hedge contracts wererealized in net income along with the corresponding foreign cur-rency translation balance. We recorded realized losses of $106million ($58 million after-tax) related to these hedge contracts.
Our earnings were affected by foreign currency gains or lossesassociated with the U.S. dollar denominated assets and liabilities atVerizon Dominicana.
Through June 30, 2003, our earnings were affected by foreigncurrency gains or losses associated with the unhedged portion of U.S. dollar denominated debt at Iusacell (see “ConsolidatedResults of Operations – Other Consolidated Results –Discontinued Operations”).
30
management’s discussion and analysis of results of operations and financial condition continued

Pension Plans (dollars in millions)
Pension expensePercentage Benefit obligation increase (decrease)
point increase (decrease) at for the year endedchange December 31, 2005 December 31, 2005
Discount rate + 1.00 $ (4,093) $ (216)- 1.00 5,165 173
Long-term rate of return on plan assets + 1.00 – (393)
- 1.00 – 393
Postretirement Plans (dollars in millions)
Postretirement benefit expense
Percentage Benefit obligation increase (decrease)point increase (decrease) at for the year ended
change December 31, 2005 December, 31, 2005
Discount rate + 1.00 $ (3,315) $ (186)- 1.00 3,774 221
Long-term rate of return on plan assets + 1.00 – (45)
- 1.00 – 45
Health care trend rates + 1.00 3,378 474- 1.00 (2,745) (352)
• Our accounting policy concerning the method of accountingapplied to investments (consolidation, equity or cost) involves anevaluation of all significant terms of the investments that explic-itly grant or suggest evidence of control or influence over theoperations of the entity in which we have invested. Where con-trol is determined, we consolidate the investment. If wedetermine that we have significant influence over the operatingand financial policies of an entity in which we have invested, weapply the equity method. We apply the cost method in situationswhere we determine that we do not have significant influence.
• Our current and deferred income taxes, and associated valuationallowances, are impacted by events and transactions arising in thenormal course of business as well as in connection with specialand non-recurring items. Assessment of the appropriate amountand classification of income taxes is dependent on several fac-tors, including estimates of the timing and realization of deferredincome tax assets and the timing of income tax payments. Actualcollections and payments may materially differ from these esti-mates as a result of changes in tax laws as well as unanticipatedfuture transactions impacting related income tax balances.
• Intangible assets are a significant component of our consoli-dated assets. Wireless licenses of $47,804 million represent thelargest component of our intangible assets. Our wireless licensesare indefinite-lived intangible assets, and as required by SFASNo. 142, are not amortized but are periodically evaluated forimpairment. Any impairment loss would be determined by com-paring the fair value of the wireless licenses with their carryingvalue. For 2004 and 2003, we used a residual method, whichdetermined fair value by estimating future cash flows of the wire-less business. Beginning in 2005, we began using a direct valueapproach in accordance with a September 29, 2004 StaffAnnouncement from the staff of the Securities and ExchangeCommission (SEC), “Use of the Residual Method to ValueAcquired Assets Other Than Goodwill.” The direct valueapproach also determines fair value by estimating future cashflows. There is inherent subjectivity involved in estimating futurecash flows, which can have a material impact on the amount ofany impairment.
31
SIGNIFICANT ACCOUNTING POLICIES AND RECENTACCOUNTING PRONOUNCEMENTS
Significant Accounting Policies
A summary of the significant accounting policies used in preparingour financial statements are as follows:
• Special and non-recurring items generally represent revenuesand gains as well as expenses and losses that are non-opera-tional and/or non-recurring in nature. Several of these specialand non-recurring items include impairment losses. Theseimpairment losses were determined in accordance with ourpolicy of comparing the fair value of the asset with its carryingvalue. The fair value is determined by quoted market prices or byestimates of future cash flows. There is inherent subjectivityinvolved in estimating future cash flows, which can have a sig-nificant impact on the amount of any impairment.
• Verizon’s plant, property and equipment balance represents asignificant component of our consolidated assets. Depreciationexpense on Verizon’s telephone operations is principally basedon the composite group remaining life method and straight-linecomposite rates, which provides for the recognition of the costof the remaining net investment in telephone plant, less antici-pated net salvage value, over the remaining asset lives. Wedepreciate other plant, property and equipment generally on astraight-line basis over the estimated useful life of the assets.Changes in the remaining useful lives of assets as a result oftechnological change or other changes in circumstances,including competitive factors in the markets where we operate,can have a significant impact on asset balances and deprecia-tion expense.
• We maintain benefit plans for most of our employees, includingpension and other postretirement benefit plans. In the aggregate,the fair value of pension plan assets exceeds benefit obligations,which contributes to pension plan income. Other postretirementbenefit plans have larger benefit obligations than plan assets,resulting in expense. Significant benefit plan assumptions,including the discount rate used, the long-term rate of return onplan assets and heath care trend rates are periodically updatedand impact the amount of benefit plan income, expense, assetsand obligations (see “Consolidated Results of Operations –Consolidated Operating Expenses – Pension and OtherPostretirement Benefits”). A sensitivity analysis of the impact ofchanges in these assumptions on the benefit obligations andexpense (income) recorded as of December 31, 2005 and for theyear then ended pertaining to Verizon’s pension and postretire-ment benefit plans is provided in the tables below. Note thatsome of these sensitivities are not symmetrical as the calculationswere based on all of the actuarial assumptions as of year-end.
management’s discussion and analysis of results of operations and financial condition continued

Recent Accounting Pronouncements
Stock-Based CompensationIn December 2004, the FASB issued SFAS No. 123(R), “Share-Based Payment,” which revises SFAS No. 123. SFAS No. 123(R)requires all share-based payments to employees, including grantsof employee stock options, to be recognized as compensationexpense based on their fair value. Effective January 1, 2003, Verizonadopted the fair value recognition provisions of SFAS No. 123. Weplan to adopt SFAS No. 123(R) effective January 1, 2006, using themodified prospective method and expect that any impact will not bematerial to our financial position or ongoing results of operations.
OTHER FACTORS THAT MAY AFFECT FUTURE RESULTS
Recent Developments
MCI MergerOn February 14, 2005, Verizon announced that it had agreed toacquire MCI for a combination of Verizon common shares and cash(including MCI dividends). On May 2, 2005, Verizon announced thatit agreed with MCI to further amend its agreement to acquire MCIfor cash and stock of at least $26.00 per share, consisting of cashof $5.60, which was paid as a special dividend by MCI on October27, 2005, after the October 6, 2005 approval of the transaction byMCI shareholders, plus the greater of .5743 Verizon shares for eachMCI common share or a sufficient number of Verizon shares todeliver to shareholders $20.40 of value. Under this price protectionfeature, Verizon had the option of paying additional cash instead ofissuing additional shares over the .5743 exchange ratio. This con-sideration was subject to adjustment at closing and may have beendecreased based on MCI’s bankruptcy claims-related experienceand international tax liabilities. The merger received the requiredstate, federal and international regulatory approvals by year-end2005, and on January 6, 2006, Verizon and MCI closed the merger.
Under terms of the merger agreement, MCI shareholders received.5743 shares of Verizon and cash for each of their MCI shares.Verizon elected to make a supplemental cash payment of $2.738per MCI share, $779 million in the aggregate, rather than issue addi-tional shares of Verizon common stock, so that the mergerconsideration was equal to at least $20.40 per MCI share. Verizonand MCI management mutually agreed that there was no purchaseprice adjustment related to the amount of MCI’s bankruptcy claims-related experience and international tax liabilities.
Separately, on April 9, 2005, Verizon entered into a stock purchaseagreement with eight entities affiliated with Carlos Slim Helu to pur-chase 43.4 million shares of MCI common stock for $25.72 pershare in cash plus an additional cash amount of 3% per annumfrom April 9, 2005 until the closing of the purchase of those shares.The transaction closed on May 17, 2005 and the additional cashpayment was made through May 13, 2005. The total cash paymentwas $1,121 million. Under the stock purchase agreement, Verizonwill pay the Slim entities an adjustment at the end of one year in anamount per MCI share calculated by multiplying (i) .7241 by (ii) theamount, if any, by which the price of Verizon’s common stockexceeds $35.52 per share (measured over a 20-day period), subjectto a maximum excess amount per Verizon share of $26.98. After theclosing of the stock purchase agreement, Verizon transferred theshares of MCI common stock it had purchased to a trust estab-lished pursuant to an agreement between Verizon and the
32
management’s discussion and analysis of results of operations and financial condition continued
Department of Justice. We received the special dividend of $5.60per MCI share on these 43.4 million MCI shares, or $243 million, onOctober 27, 2005.
Redemption of MCI DebtOn January 17, 2006, Verizon announced offers to purchase twoseries of MCI senior notes, MCI $1,983 million aggregate principalamount of 6.688% Senior Notes Due 2009 and MCI $1,699 millionaggregate principal amount of 7.735% Senior Notes Due 2014, at101% of their par value. Due to the change in control of MCI thatoccurred in connection with the merger with Verizon on January 6,2006, Verizon is required to make this offer to noteholders within 30days of the closing of the merger of MCI and Verizon. Separately,Verizon notified noteholders that MCI is exercising its right toredeem both series of Senior Notes prior to maturity under theoptional redemption procedures provided in the indentures. The6.688% Notes were redeemed on March 1, 2006, and the 7.735%Notes were redeemed on February 16, 2006.
In addition, on January 20, 2006, Verizon announced an offer torepurchase MCI $1,983 million aggregate principal amount of5.908% Senior Notes Due 2007 at 101% of their par value. OnFebruary 21, 2006, $1,804 million of these notes were redeemed byVerizon. Verizon satisfied and discharged the indenture governingthis series of notes shortly after the close of the offer for those note-holders who did not accept this offer.
Issuance of Debt In February 2006, Verizon issued $4,000 million of floating rate andfixed rate notes maturing from 2007 through 2035.
Spectrum PurchasesOn February 15, 2005, the FCC’s auction of broadband personalcommunications services licenses ended and Verizon Wireless andVista PCS, LLC were the highest bidders for 63 licenses totalingapproximately $697 million. On May 13, 2005, the licenses won byVerizon Wireless were granted by the FCC. The licenses won byVista PCS remain subject to FCC approval.
Sales of Businesses and InvestmentsInformation ServicesIn December 2005, we announced that we are exploring divestingInformation Services through a spin-off, sale or other strategictransaction. However, since this process is still ongoing,Information Services’ results of operations, financial position andcash flows remain in Verizon’s continuing operations.
Telephone Access LinesWe continually consider plans for a reduction in the size of ouraccess line business, including through a spin-off mechanism orotherwise, so that we may pursue our strategy of placing greaterfocus on the higher growth businesses of broadband and wireless.
Environmental MattersDuring 2003, under a government-approved plan, remediation com-menced at the site of a former Sylvania facility in Hicksville, NewYork that processed nuclear fuel rods in the 1950s and 1960s.Remediation beyond original expectations proved to be necessaryand a reassessment of the anticipated remediation costs was con-ducted. A reassessment of costs related to remediation efforts atseveral other former facilities was also undertaken. As a result, anadditional environmental remediation expense of $240 million wasrecorded in 2003, for remedial activities likely to take place over thenext several years. In September 2005, the Army Corps of

FCC Regulation Our services are subject to the jurisdiction of the FCC with respectto interstate telecommunications services and other matters forwhich the FCC has jurisdiction under the Communications Act of1934, as amended.
BroadbandThe FCC has adopted a series of orders that recognize the com-petitive nature of the broadband market, and impose lesserregulatory requirements to broadband services and facilities thanapply to narrowband. With respect to facilities, the FCC has deter-mined that certain unbundling requirements that apply tonarrowband facilities do not apply to broadband facilities such asfiber to the premise loops and packet switches. With respect toservices, the FCC has concluded that broadband Internet accessservices offered by telephone companies and their affiliates qualifyas largely deregulated information services. The same order alsoconcluded that telephone companies may offer the underlyingbroadband transmission services that are used as an input toInternet access services through private carriage arrangements onnegotiated commercial terms. The FCC’s order addressing theappropriate regulatory treatment of broadband Internet accessservices is the subject of a pending appeal.
VideoThe FCC has a body of rules that apply to cable operators underTitle VI of the Communications Act of 1934, and these rules alsogenerally apply to telephone companies that provide cable servicesover their networks. In addition, companies that provide cableservice over a cable system generally must obtain a local cablefranchise. The FCC currently is conducting a rulemaking pro-ceeding to determine whether the local franchising process isserving as a barrier to entry for new providers of video services, likeVerizon. In this proceeding, the FCC is evaluating the scope of itsauthority over the local franchise process and is consideringadopting rules under Section 621 of the Communications Act of1934 to ensure that the local franchising process does not under-mine competitive entry.
Interstate Access Charges and Intercarrier CompensationThe current framework for interstate access rates was establishedin the Coalition for Affordable Local and Long Distance Services(CALLS) plan, which the FCC adopted on May 31, 2000. The CALLSplan has three main components. First, it establishes portable inter-state access universal service support of $650 million for theindustry that replaces implicit support previously embedded ininterstate access charges. Second, the plan simplifies the patch-work of common line charges into one subscriber line charge (SLC)and provides for de-averaging of the SLC by zones and class ofcustomers. Third, the plan set into place a mechanism to transitionto a set target of $.0055 per minute for switched access services.Once that target rate is reached, local exchange carriers are nolonger required to make further annual price cap reductions to theirswitched access prices. As a result of tariff adjustments whichbecame effective in July 2003, virtually all of our switched accesslines reached the $.0055 benchmark.
The FCC currently is conducting a broad rulemaking proceeding toconsider new rules governing intercarrier compensation including,but not limited to, access charges, compensation for Internet traffic,and reciprocal compensation for local traffic. The notice seekscomments about intercarrier compensation in general, and requestsinput on seven specific reform proposals.
33
Engineers (ACE) accepted the Hicksville site into the FormerlyUtilized Sites Remedial Action Program. This may result in the ACEperforming some or all of the remediation effort for the Hicksvillesite with a corresponding decrease in costs to Verizon. To theextent that the ACE assumes responsibility for remedial work at theHicksville site, an adjustment to this reserve may be made.Adjustments may also be made based upon actual conditions dis-covered during the remediation at any of the sites requiringremediation.
New York Recovery FundingIn August 2002, President Bush signed the SupplementalAppropriations bill that included $5.5 billion in New York recoveryfunding. Of that amount, approximately $750 million has been allo-cated to cover utility restoration and infrastructure rebuilding as aresult of the September 11th terrorist attacks on lower Manhattan.These funds will be distributed through the Lower ManhattanDevelopment Corporation following an application and auditprocess. As of September 2004, we had applied for reimbursementof approximately $266 million under Category One, although we didnot record this amount as a receivable. We received advancestotaling $88 million in connection with this application process. OnDecember 22, 2004, we applied for reimbursement of an additional$136 million of “category 2” losses, and on March 29, 2005 weamended our application seeking an additional $3 million. Category2 funding is for permanent restoration and infrastructure improve-ment. According to the plan, permanent restoration is reimbursedup to 75% of the loss. On November 3, 2005, we received theresults of preliminary audit findings disallowing all but $44 million ofour original $266 million of costs in our Category One applications.On December 8, 2005, we provided a detailed rebuttal to the pre-liminary audit findings and are currently awaiting the final auditreport. Our applications are pending.
Regulatory and Competitive Trends
Competition and RegulationTechnological, regulatory and market changes have providedVerizon both new opportunities and challenges. These changeshave allowed Verizon to offer new types of services in this increas-ingly competitive market. At the same time, they have allowed otherservice providers to broaden the scope of their own competitiveofferings. Current and potential competitors for network servicesinclude other telephone companies, cable companies, wirelessservice providers, foreign telecommunications providers, satelliteproviders, electric utilities, Internet service providers, providers ofvoice over the Internet, or VoIP services, and other companies thatoffer network services using a variety of technologies. Many ofthese companies have a strong market presence, brand recognitionand existing customer relationships, all of which contribute tointensifying competition and may affect our future revenue growth.Many of our competitors also remain subject to fewer regulatoryconstraints than Verizon.
We are unable to predict definitively the impact that the ongoingchanges in the telecommunications industry will ultimately have onour business, results of operations or financial condition. The finan-cial impact will depend on several factors, including the timing,extent and success of competition in our markets, the timing andoutcome of various regulatory proceedings and any appeals, andthe timing, extent and success of our pursuit of new opportunities.
management’s discussion and analysis of results of operations and financial condition continued

34
management’s discussion and analysis of results of operations and financial condition continued
The FCC also has pending before it issues relating to intercarriercompensation for dial-up Internet-bound traffic. The FCC previ-ously found this traffic is not subject to reciprocal compensationunder Section 251(b)(5) of the Telecommunications Act of 1996.Instead, the FCC established federal rates per minute for this trafficthat declined from $.0015 to $.0007 over a three-year period,established caps on the total minutes of this traffic subject to com-pensation in a state, and required incumbent local exchangecarriers to offer to both bill and pay reciprocal compensation forlocal traffic at the same rate as they are required to pay on Internet-bound traffic. The U.S. Court of Appeals for the D.C. Circuitrejected part of the FCC’s rationale, but declined to vacate theorder while it is on remand. As a result, pending further action bythe FCC, the FCC’s underlying order remains in effect. The FCCsubsequently denied a petition to discontinue the $.0007 rate capon this traffic, but removed the caps on the total minutes ofInternet-bound traffic subject to compensation. That decision is thesubject of an appeal by several parties. Disputes also remainpending in a number of forums relating to the appropriate compen-sation for Internet-bound traffic during previous periods under theterms of our interconnection agreements with other carriers.
The FCC also is conducting a rulemaking proceeding to address theregulation of services that use Internet protocol, including whetheraccess charges should apply to voice or other Internet protocolservices. The FCC also considered several petitions askingwhether, and under what circumstances, services that employInternet protocol are subject to access charges. The FCC previouslyhas held that one provider’s peer-to-peer Internet protocol servicethat does not use the public switched network is an interstate infor-mation service and is not subject to access charges, while a servicethat utilizes Internet protocol for only one intermediate part of acall’s transmission is a telecommunications service that is subjectto access charges. Another petition asking the FCC to forbear fromapplying access charges to voice over Internet protocol servicesthat are terminated on switched local exchange networks was with-drawn by the carrier that filed that petition. The FCC also declaredthe services offered by one provider of a voice over Internet pro-tocol service to be jurisdictionally interstate on the grounds that itwas impossible to separate that carrier’s Internet protocol serviceinto interstate and intrastate components. The FCC also stated thatits conclusion would apply to other services with similar character-istics. That order has been appealed.
The FCC also has adopted rules for special access services that pro-vide for pricing flexibility and ultimately the removal of services fromprice regulation when prescribed competitive thresholds are met.More than half of special access revenues are now removed fromprice regulation. The FCC currently has a rulemaking proceedingunderway to evaluate experience under its pricing flexibility rules, andto determine whether any changes to those rules are warranted.
Universal ServiceThe FCC also has a body of rules implementing the universal serviceprovisions of the Telecommunications Act of 1996, including rulesgoverning support to rural and non-rural high-cost areas, support forlow income subscribers, and support for schools, libraries and ruralhealth care. The FCC’s current rules for support to high-cost areasserved by larger “non-rural” local telephone companies were previ-ously remanded by U.S. Court of Appeals for the Tenth Circuit,which had found that the FCC had not adequately justified theserules. The FCC has initiated a rulemaking proceeding in response to
the court’s remand, but its rules remain in effect pending the resultsof the rulemaking. The FCC also has proceedings underway to eval-uate possible changes to its current rules for assessingcontributions to the universal service fund. Any change in the currentassessment mechanism could result in a change in the contributionthat local telephone companies, wireless carriers or others mustmake and that would have to be collected from customers.
Unbundling of Network ElementsUnder section 251 of the Telecommunications Act of 1996, incum-bent local exchange carriers were required to provide competingcarriers with access to components of their network on an unbun-dled basis, known as UNEs, where certain statutory standards aresatisfied. The Telecommunications Act of 1996 also adopted a cost-based pricing standard for these UNEs, which the FCC interpretedas allowing it to impose a pricing standard known as “total elementlong run incremental cost” or “TELRIC.” The FCC’s rules definingthe unbundled network elements that must be made available atTELRIC prices have been overturned on multiple occasions by thecourts. In its most recent order issued in response to these courtdecisions, the FCC eliminated the requirement to unbundle massmarket local switching on a nationwide basis, with the obligation toaccept new orders ending as of the effective date of the order(March 11, 2005). The FCC also established a one year transition forexisting UNE switching arrangements. For high capacity transmis-sion facilities, the FCC established criteria for determining whetherhigh capacity loops, transport or dark fiber transport must beunbundled in individual wire centers, and stated that these stan-dards were only expected to affect a small number of wire centers.The FCC also eliminated the obligation to provide dark fiber loopsand found that there is no obligation to provide UNEs exclusively forwireless or long distance service. In any instance where a particularhigh capacity facility no longer has to be made available as a UNE,the FCC established a similar one year transition for any existinghigh capacity loop or transport UNEs, and an 18 month transitionfor any existing dark fiber UNEs. Verizon and other parties havechallenged various aspects of the new FCC rules on appeal.
As noted above, the FCC has concluded that the requirement underSection 251 of the Telecommunications Act of 1996 to provideunbundled network elements at TELRIC prices generally does notapply with respect to broadband facilities, such as fiber to thepremises loops, the packet-switched capabilities of hybrid loopsand packet switching. The FCC also has held that any separateunbundling obligations that may be imposed by Section 271 of theTelecommunications Act of 1996 do not apply to these same facili-ties. The decision with respect to Section 271 is the subject of anongoing appeal.

35
CAUTIONARY STATEMENT CONCERNING FORWARD-LOOKING STATEMENTS
In this Management’s Discussion and Analysis of Results ofOperations and Financial Condition, and elsewhere in this AnnualReport, we have made forward-looking statements. These state-ments are based on our estimates and assumptions and are subjectto risks and uncertainties. Forward-looking statements include theinformation concerning our possible or assumed future results ofoperations. Forward-looking statements also include those precededor followed by the words “anticipates,” “believes,” “estimates,”“hopes” or similar expressions. For those statements, we claim theprotection of the safe harbor for forward-looking statements con-tained in the Private Securities Litigation Reform Act of 1995.
The following important factors, along with those discussed else-where in this Annual Report, could affect future results and couldcause those results to differ materially from those expressed in theforward-looking statements:
• materially adverse changes in economic and industry conditionsand labor matters, including workforce levels and labor negotia-tions, and any resulting financial and/or operational impact, inthe markets served by us or by companies in which we havesubstantial investments;
• material changes in available technology;• technology substitution; • an adverse change in the ratings afforded our debt securities by
nationally accredited ratings organizations;• the final results of federal and state regulatory proceedings con-
cerning our provision of retail and wholesale services and judicialreview of those results;
• the effects of competition in our markets;• the timing, scope and financial impacts of our deployment of
fiber-to-the-premises broadband technology;• the ability of Verizon Wireless to continue to obtain sufficient
spectrum resources;• changes in our accounting assumptions that regulatory agen-
cies, including the SEC, may require or that result from changesin the accounting rules or their application, which could result inan impact on earnings; and
• the extent and timing of our ability to obtain revenue enhance-ments and cost savings following our business combination with MCI.
management’s discussion and analysis of results of operations and financial condition continued

36
We, the management of Verizon Communications Inc., are respon-sible for establishing and maintaining adequate internal control overfinancial reporting of the company. Management has evaluatedinternal control over financial reporting of the company using thecriteria for effective internal control established in Internal Control –Integrated Framework issued by the Committee of SponsoringOrganizations of the Treadway Commission.
Management has assessed the effectiveness of the company’sinternal control over financial reporting as of December 31, 2005.Based on this assessment, we believe that the internal control overfinancial reporting of the company is effective as of December 31,2005. In connection with this assessment, there were no materialweaknesses in the company’s internal control over financialreporting identified by management.
The company’s financial statements included in this annual reporthave been audited by Ernst & Young LLP, independent registeredpublic accounting firm. Ernst & Young LLP has also issued an attes-tation report on management’s assessment of the company’sinternal control over financial reporting.
Ivan G. SeidenbergChairman and Chief Executive Officer
Doreen A. TobenExecutive Vice President and Chief Financial Officer
Thomas A. BartlettSenior Vice President and Controller
report of management on internal control over financial reporting
report of independent registered public accountingfirm on internal control over financial reporting
To The Board of Directors and Shareowners of Verizon Communications Inc.:
We have audited management’s assessment, included in theaccompanying Report of Management on Internal Control OverFinancial Reporting, that Verizon Communications Inc. and sub-sidiaries (Verizon) maintained effective internal control over financialreporting as of December 31, 2005, based on criteria established inInternal Control—Integrated Framework issued by the Committee ofSponsoring Organizations of the Treadway Commission (the COSOcriteria). Verizon’s management is responsible for maintaining effec-tive internal control over financial reporting and for its assessment ofthe effectiveness of internal control over financial reporting. Ourresponsibility is to express an opinion on management’s assessmentand an opinion on the effectiveness of the company’s internal con-trol over financial reporting based on our audit.
We conducted our audit in accordance with the standards of thePublic Company Accounting Oversight Board (United States). Thosestandards require that we plan and perform the audit to obtain rea-sonable assurance about whether effective internal control overfinancial reporting was maintained in all material respects. Our auditincluded obtaining an understanding of internal control over financialreporting, evaluating management’s assessment, testing and evalu-ating the design and operating effectiveness of internal control, andperforming such other procedures as we considered necessary inthe circumstances. We believe that our audit provides a reasonablebasis for our opinion.
A company’s internal control over financial reporting is a processdesigned to provide reasonable assurance regarding the reliability offinancial reporting and the preparation of financial statements forexternal purposes in accordance with generally acceptedaccounting principles. A company’s internal control over financialreporting includes those policies and procedures that (1) pertain tothe maintenance of records that, in reasonable detail, accurately andfairly reflect the transactions and dispositions of the assets of thecompany; (2) provide reasonable assurance that transactions arerecorded as necessary to permit preparation of financial statementsin accordance with generally accepted accounting principles, andthat receipts and expenditures of the company are being made onlyin accordance with authorizations of management and directors ofthe company; and (3) provide reasonable assurance regarding pre-vention or timely detection of unauthorized acquisition, use, ordisposition of the company’s assets that could have a material effecton the financial statements.
VERIZON COMMUNICATIONS INC. AND SUBSIDIARIES

37
To The Board of Directors and Shareowners of Verizon Communications Inc.:
We have audited the accompanying consolidated balance sheets ofVerizon Communications Inc. and subsidiaries (Verizon) as ofDecember 31, 2005 and 2004, and the related consolidated state-ments of income, cash flows and changes in shareowners’investment for each of the three years in the period endedDecember 31, 2005. These financial statements are the responsi-bility of Verizon’s management. Our responsibility is to express anopinion on these financial statements based on our audits.
We conducted our audits in accordance with the standards of thePublic Company Accounting Oversight Board (United States).Those standards require that we plan and perform the audit toobtain reasonable assurance about whether the financial state-ments are free of material misstatement. An audit includesexamining, on a test basis, evidence supporting the amounts anddisclosures in the financial statements. An audit also includesassessing the accounting principles used and significant estimatesmade by management, as well as evaluating the overall financialstatement presentation. We believe that our audits provide a rea-sonable basis for our opinion.
In our opinion, the financial statements referred to above presentfairly, in all material respects, the consolidated financial position ofVerizon at December 31, 2005 and 2004, and the consolidatedresults of their operations and their cash flows for each of the threeyears in the period ended December 31, 2005, in conformity withU.S. generally accepted accounting principles.
As discussed in Note 2 to the consolidated financial statements,Verizon changed its methods of accounting for directory revenuesand expenses, stock-based compensation and asset retirementobligations effective January 1, 2003.
We also have audited, in accordance with the standards of thePublic Company Accounting Oversight Board (United States), theeffectiveness of Verizon’s internal control over financial reporting asof December 31, 2005, based on criteria established in InternalControl—Integrated Framework issued by the Committee ofSponsoring Organizations of the Treadway Commission and ourreport dated February 23, 2006 expressed an unqualified opinionthereon.
Ernst & Young LLPNew York, New York
February 23, 2006
Because of its inherent limitations, internal control over financialreporting may not prevent or detect misstatements. Also, projectionsof any evaluation of effectiveness to future periods are subject to therisk that controls may become inadequate because of changes inconditions, or that the degree of compliance with the policies or pro-cedures may deteriorate.
In our opinion, management’s assessment that Verizon maintainedeffective internal control over financial reporting, as of December 31,2005, is fairly stated, in all material respects, based on the COSOcriteria. Also, in our opinion, Verizon maintained, in all materialrespects, effective internal control over financial reporting as ofDecember 31, 2005, based on the COSO criteria.
We also have audited, in accordance with the standards of thePublic Company Accounting Oversight Board (United States), theconsolidated balance sheets of Verizon as of December 31, 2005and 2004, and the related consolidated statements of income, cashflows and changes in shareowners’ investment for each of the threeyears in the period ended December 31, 2005 and our report datedFebruary 23, 2006 expressed an unqualified opinion thereon.
Ernst & Young LLPNew York, New York
February 23, 2006
report of independent registered public accounting firm on financial statements

38
VERIZON COMMUNICATIONS INC. AND SUBSIDIARIES
consolidated statements of income
(dollars in millions, except per share amounts)
Years Ended December 31, 2005 2004 2003
Operating Revenues $ 75,112 $ 71,283 $ 67,468
Operating ExpensesCost of services and sales (exclusive of items shown below) 25,469 23,168 21,701Selling, general & administrative expense 21,312 21,088 24,894Depreciation and amortization expense 14,047 13,910 13,607Sales of businesses, net (530) – (141)
Total Operating Expenses 60,298 58,166 60,061
Operating Income 14,814 13,117 7,407Equity in earnings of unconsolidated businesses 689 1,691 1,278Income from other unconsolidated businesses 92 75 331Other income and (expense), net 237 22 37Interest expense (2,180) (2,384) (2,797)Minority interest (3,045) (2,409) (1,583)Income Before Provision for Income Taxes, Discontinued
Operations and Cumulative Effect of Accounting Change 10,607 10,112 4,673Provision for income taxes (3,210) (2,851) (1,213)Income Before Discontinued Operations and Cumulative
Effect of Accounting Change 7,397 7,261 3,460Discontinued Operations
Income (loss) from operations – 1,116 (869)Provision for income taxes – (546) (17)
Income (loss) on discontinued operations, net of tax – 570 (886)Cumulative Effect of Accounting Change, Net of Tax – – 503Net Income $ 7,397 $ 7,831 $ 3,077
Basic Earnings Per Common Share:Income before discontinued operations and cumulative
effect of accounting change $ 2.67 $ 2.62 $ 1.26Income (loss) on discontinued operations, net of tax – .21 (.32)Cumulative effect of accounting change, net of tax – – .18Net Income(1) $ 2.67 $ 2.83 $ 1.12Weighted-average shares outstanding (in millions) 2,766 2,770 2,756
Diluted Earnings Per Common Share:Income before discontinued operations and cumulative
effect of accounting change $ 2.65 $ 2.59 $ 1.25Income (loss) on discontinued operations, net of tax – .20 (.31)Cumulative effect of accounting change, net of tax – – .18Net Income(1) $ 2.65 $ 2.79 $ 1.12Weighted-average shares outstanding (in millions) 2,817 2,831 2,832
(1) Total per share amounts may not add due to rounding.
See Notes to Consolidated Financial Statements.
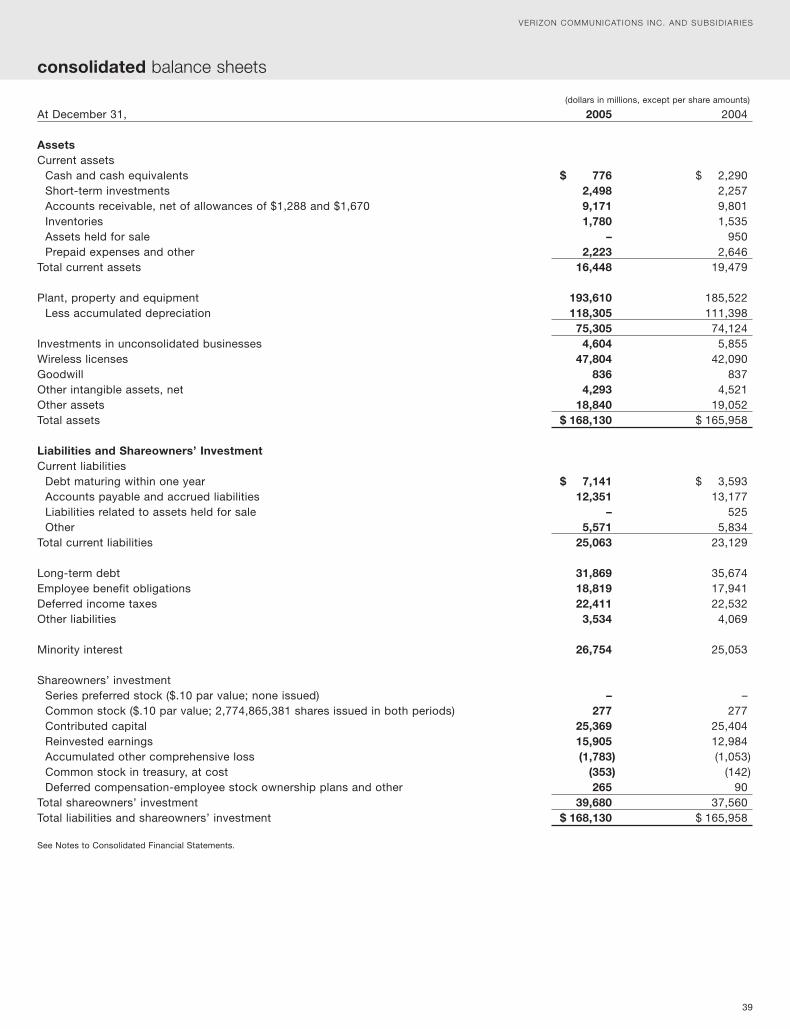
39
consolidated balance sheets
VERIZON COMMUNICATIONS INC. AND SUBSIDIARIES
(dollars in millions, except per share amounts)
At December 31, 2005 2004
AssetsCurrent assets
Cash and cash equivalents $ 776 $ 2,290Short-term investments 2,498 2,257Accounts receivable, net of allowances of $1,288 and $1,670 9,171 9,801Inventories 1,780 1,535Assets held for sale – 950Prepaid expenses and other 2,223 2,646
Total current assets 16,448 19,479
Plant, property and equipment 193,610 185,522Less accumulated depreciation 118,305 111,398
75,305 74,124Investments in unconsolidated businesses 4,604 5,855Wireless licenses 47,804 42,090Goodwill 836 837Other intangible assets, net 4,293 4,521Other assets 18,840 19,052Total assets $ 168,130 $ 165,958
Liabilities and Shareowners’ InvestmentCurrent liabilities
Debt maturing within one year $ 7,141 $ 3,593Accounts payable and accrued liabilities 12,351 13,177Liabilities related to assets held for sale – 525Other 5,571 5,834
Total current liabilities 25,063 23,129
Long-term debt 31,869 35,674Employee benefit obligations 18,819 17,941Deferred income taxes 22,411 22,532Other liabilities 3,534 4,069
Minority interest 26,754 25,053
Shareowners’ investmentSeries preferred stock ($.10 par value; none issued) – –Common stock ($.10 par value; 2,774,865,381 shares issued in both periods) 277 277Contributed capital 25,369 25,404Reinvested earnings 15,905 12,984Accumulated other comprehensive loss (1,783) (1,053)Common stock in treasury, at cost (353) (142)Deferred compensation-employee stock ownership plans and other 265 90
Total shareowners’ investment 39,680 37,560Total liabilities and shareowners’ investment $ 168,130 $ 165,958
See Notes to Consolidated Financial Statements.

40
(dollars in millions)
Years Ended December 31, 2005 2004 2003
Cash Flows from Operating ActivitiesNet Income $ 7,397 $ 7,831 $ 3,077Adjustments to reconcile net income to net cash
provided by operating activities:Depreciation and amortization expense 14,047 13,910 13,607Sales of businesses, net (530) – (141)(Gain) loss on sale of discontinued operations – (516) 931Employee retirement benefits 1,840 1,999 3,048Deferred income taxes (1,059) 1,842 826Provision for uncollectible accounts 1,290 1,181 1,789Income from unconsolidated businesses (781) (1,766) (1,609)Cumulative effect of accounting change, net of tax – – (503)Changes in current assets and liabilities, net of effects from
acquisition/disposition of businesses:Accounts receivable (933) (1,617) (938)Inventories (252) (274) (80)Other assets (191) 578 101Accounts payable and accrued liabilities (1,034) (1,930) 2,657
Other, net 2,218 582 (298)Net cash provided by operating activities 22,012 21,820 22,467
Cash Flows from Investing ActivitiesCapital expenditures (including capitalized software) (15,324) (13,259) (11,874)Acquisitions, net of cash acquired, and investments (4,684) (1,196) (1,162)Proceeds from disposition of businesses 1,326 117 229Proceeds from discontinued operations – 1,603 –Net change in short-term and other current investments (344) (100) (120)Other, net 534 2,492 691Net cash used in investing activities (18,492) (10,343) (12,236)
Cash Flows from Financing ActivitiesProceeds from long-term borrowings 1,487 514 4,653Repayments of long-term borrowings and capital lease obligations (3,919) (5,198) (10,759)Increase (decrease) in short-term obligations, excluding
current maturities 2,129 (783) (1,330)Dividends paid (4,427) (4,262) (4,239)Proceeds from sale of common stock 37 320 839Purchase of common stock for treasury (271) (370) –Other, net (70) (77) (123)Net cash used in financing activities (5,034) (9,856) (10,959)
Increase (decrease) in cash and cash equivalents (1,514) 1,621 (728)Cash and cash equivalents, beginning of year 2,290 669 1,397Cash and cash equivalents, end of year $ 776 $ 2,290 $ 669
See Notes to Consolidated Financial Statements.
VERIZON COMMUNICATIONS INC. AND SUBSIDIARIES
consolidated statements of cash flows

(dollars in millions, except per share amounts, and shares in thousands)
Years Ended December 31, 2005 2004 2003Shares Amount Shares Amount Shares Amount
Common StockBalance at beginning of year 2,774,865 $ 277 2,772,314 $ 277 2,751,650 $ 275Shares issued
Employee plans – – 2,501 – 20,664 2Shareowner plans – – 50 – – –
Shares retired – – – – – –Balance at end of year 2,774,865 277 2,774,865 277 2,772,314 277
Contributed CapitalBalance at beginning of year 25,404 25,363 24,685Shares issued-employee and shareowner plans (24) 2 725Tax benefit from exercise of stock options – 41 12Other (11) (2) (59)Balance at end of year 25,369 25,404 25,363
Reinvested EarningsBalance at beginning of year 12,984 9,409 10,536Net income 7,397 7,831 3,077Dividends declared ($1.62, $1.54 and $1.54 per share) (4,479) (4,265) (4,250)Shares issued-employee and shareowner plans – – 39Other 3 9 7Balance at end of year 15,905 12,984 9,409
Accumulated Other Comprehensive LossBalance at beginning of year (1,053) (1,250) (2,110)Foreign currency translation adjustment (755) 548 568Unrealized gains on net investment hedges 2 – –Unrealized gains (losses) on marketable securities (21) 7 1Unrealized derivative gains (losses) on cash flow hedges 10 17 (21)Minimum pension liability adjustment 34 (375) 312Other comprehensive income (loss) (730) 197 860Balance at end of year (1,783) (1,053) (1,250)
Treasury StockBalance at beginning of year (5,213) (142) (4,554) (115) (8,624) (218)Shares purchased (7,859) (271) (9,540) (370) – –Shares distributed
Employee plans 1,594 59 8,881 343 4,047 102Shareowner plans 22 1 – – 23 1
Balance at end of year (11,456) (353) (5,213) (142) (4,554) (115)
Deferred Compensation–ESOPs and OtherBalance at beginning of year 90 (218) (552)Amortization 174 301 312Other 1 7 22Balance at end of year 265 90 (218)Total Shareowners’ Investment $ 39,680 $ 37,560 $ 33,466
Comprehensive IncomeNet income $ 7,397 $ 7,831 $ 3,077Other comprehensive income (loss) per above (730) 197 860Total Comprehensive Income $ 6,667 $ 8,028 $ 3,937
See Notes to Consolidated Financial Statements.
consolidated statements of changes in shareowners’ investment
41
VERIZON COMMUNICATIONS INC. AND SUBSIDIARIES

42
notes to consolidated financial statements
NOTE 1
DESCRIPTION OF BUSINESS AND SUMMARY OFSIGNIFICANT ACCOUNTING POLICIES
Description of BusinessVerizon Communications Inc. (Verizon) is one of the world’s leadingproviders of communications services. Verizon’s domestic wirelinetelecommunications business provides local telephone services,including broadband, in 28 states and Washington, D.C. andnationwide long-distance and other communications products andservices. Verizon’s domestic wireless business, operating asVerizon Wireless, provides wireless voice and data products andservices across the United States using one of the most extensivewireless networks. Information Services operates directory pub-lishing businesses and provides electronic commerce services.Verizon’s International segment includes wireline and wireless com-munications operations and investments in the Americas andEurope. We have four reportable segments, which we operate andmanage as strategic business units: Domestic Telecom, DomesticWireless, Information Services and International. For further infor-mation concerning our business segments, see Note 17.
In connection with the closing of the merger with MCI, Inc. (MCI),which occurred on January 6, 2006, Verizon now owns and oper-ates one of the most expansive end-to-end global Internet Protocol(IP) networks which includes over 270,000 domestic and 360,000international route miles of fiber optic cable and provides access toover 140 countries worldwide. Operating as Verizon Business, weare now better able to provide next-generation IP network servicesto medium and large businesses and government customers. Forfurther information concerning the merger with MCI, see Note 24.
ConsolidationThe method of accounting applied to investments, whether consol-idated, equity or cost, involves an evaluation of all significant termsof the investments that explicitly grant or suggest evidence of con-trol or influence over the operations of the investee. Theconsolidated financial statements include our controlled sub-sidiaries. Investments in businesses which we do not control, buthave the ability to exercise significant influence over operating andfinancial policies, are accounted for using the equity method.Investments in which we do not have the ability to exercise signifi-cant influence over operating and financial policies are accountedfor under the cost method. Equity and cost method investments areincluded in Investments in Unconsolidated Businesses in our con-solidated balance sheets. Certain of our cost method investmentsare classified as available-for-sale securities and adjusted to fairvalue pursuant to Statement of Financial Accounting Standards(SFAS) No. 115, “Accounting for Certain Investments in Debt andEquity Securities.”
All significant intercompany accounts and transactions have beeneliminated.
We have reclassified prior year amounts to conform to the currentyear presentation.
Discontinued Operations, Assets Held for Sale, and Sales ofBusinesses and InvestmentsWe classify as discontinued operations any component of our busi-ness that we hold for sale or dispose of that has operations andcash flows that are clearly distinguishable operationally and forfinancial reporting purposes from the rest of Verizon. For those
components, Verizon has no significant continuing involvementafter disposal and their operations and cash flows are eliminatedfrom Verizon’s ongoing operations. Sales not classified as discon-tinued operations are reported as either Sales of Businesses, Net,Equity in Earnings of Unconsolidated Businesses or Income FromOther Unconsolidated Businesses in our consolidated statementsof income.
Use of EstimatesWe prepare our financial statements using generally acceptedaccounting principles (GAAP), which require management to makeestimates and assumptions that affect reported amounts and dis-closures. Actual results could differ from those estimates.
Examples of significant estimates include the allowance for doubtfulaccounts, the recoverability of plant, property and equipment,intangible assets and other long-lived assets, valuation allowanceson tax assets and pension and postretirement benefit assumptions.
Revenue RecognitionDomestic TelecomOur Domestic Telecom segment earns revenue based upon usageof our network and facilities and contract fees. In general, fixed feesfor local telephone, long distance and certain other services arebilled one month in advance and recognized the following monthwhen earned. Revenue from other products that are not fixed fee orthat exceed contracted amounts is recognized when such servicesare provided.
We recognize equipment revenue for services, in which we bundlethe equipment with maintenance and monitoring services, when theequipment is installed in accordance with contractual specificationsand ready for the customer’s use. The maintenance and monitoringservices are recognized monthly over the term of the contract as weprovide the services. Long-term contracts are accounted for usingthe percentage of completion method. We use the completed con-tract method if we cannot estimate the costs with a reasonabledegree of reliability.
Customer activation fees, along with the related costs up to but notexceeding the activation fees, are deferred and amortized over thecustomer relationship period.
Domestic WirelessOur Domestic Wireless segment earns revenue by providing accessto and usage of our network, which includes roaming and long dis-tance revenue. In general, access revenue is billed one month inadvance and recognized when earned. Airtime and usage revenue,roaming revenue and long distance revenue are recognized whenthe service is rendered. Equipment sales revenue associated withthe sale of wireless handsets and accessories is recognized whenthe products are delivered to and accepted by the customer, as thisis considered to be a separate earnings process from the sale ofwireless services. Customer activation fees are considered addi-tional consideration when handsets are sold to the customers at adiscount and are recorded as equipment sales revenue.
Information ServicesInformation Services earns revenues primarily from print and onlinedirectory publishing. This segment recognizes revenues andexpenses in our print directory business using the amortizationmethod. Under the amortization method, revenues and directexpenses, primarily printing and distribution costs, are recognizedover the life of the directory, which is usually 12 months. Revenue
VERIZON COMMUNICATIONS INC. AND SUBSIDIARIES

notes to consolidated financial statements continued
43
from our online directory, SuperPages.com, is recognized in themonth it is earned.
InternationalThe consolidated wireline and wireless businesses that compriseour International segment recognize revenue in a similar manner asour other segments. In addition, this segment holds several invest-ments that are either accounted for under the equity or cost methodof accounting. For additional detail on our accounting policy relatedto these investments, see “Consolidation” above.
Maintenance and RepairsWe charge the cost of maintenance and repairs, including the costof replacing minor items not constituting substantial betterments,principally to Cost of Services and Sales as these costs are incurred.
Earnings Per Common ShareBasic earnings per common share are based on the weighted-average number of shares outstanding during the year. Dilutedearnings per common share include the dilutive effect of sharesissuable under our stock-based compensation plans, an exchange-able equity interest (see Note 9), and the zero-coupon convertiblenotes (see Note 11), which represent the only potentially dilutivecommon shares.
Cash and Cash EquivalentsWe consider all highly liquid investments with a maturity of 90 daysor less when purchased to be cash equivalents, except cash equiv-alents held as short-term investments. Cash equivalents are statedat cost, which approximates market value.
Short-Term InvestmentsOur short-term investments consist primarily of cash equivalentsheld in trust to pay for certain employee benefits. Short-terminvestments are stated at cost, which approximates market value.
Marketable SecuritiesWe continually evaluate our investments in marketable securities forimpairment due to declines in market value considered to be otherthan temporary. That evaluation includes, in addition to persistent,declining stock prices, general economic and company-specificevaluations. In the event of a determination that a decline in marketvalue is other than temporary, a charge to earnings is recorded forthe loss, and a new cost basis in the investment is established.These investments are included in the accompanying consolidatedbalance sheets in Investments in Unconsolidated Businesses orOther Assets.
InventoriesWe include in inventory new and reusable supplies and networkequipment of our telephone operations, which are stated principallyat average original cost, except that specific costs are used in thecase of large individual items. Inventories of our other subsidiariesare stated at the lower of cost (determined principally on either anaverage cost or first-in, first-out basis) or market.
Plant and DepreciationWe record plant, property and equipment at cost. Our telephoneoperations’ depreciation expense is principally based on the com-posite group remaining life method and straight-line compositerates. This method provides for the recognition of the cost of theremaining net investment in telephone plant, less anticipated netsalvage value, over the remaining asset lives. This method requiresthe periodic revision of depreciation rates.
The asset lives used by our telephone operations are presented inthe following table:
Average Lives (in years)
Buildings 25-42Central office equipment 5-11Outside communications plant
Copper cable 13-18Fiber cable 20Poles and conduit 30-50
Furniture, vehicles and other 3-15
When we replace or retire depreciable plant used in our wirelinenetwork, we deduct the carrying amount of such plant from therespective accounts and charge it to accumulated depreciation (seeNote 2 for additional information on the adoption of SFAS No. 143,“Accounting for Asset Retirement Obligations”).
Plant, property and equipment of our other subsidiaries is generallydepreciated on a straight-line basis over the following estimateduseful lives: buildings, 8 to 42 years; wireless plant equipment, 3 to15 years; and other equipment, 1 to 20 years.
When the depreciable assets of our other subsidiaries are retired orotherwise disposed of, the related cost and accumulated deprecia-tion are deducted from the plant accounts, and any gains or losseson disposition are recognized in income.
We capitalize network software purchased or developed in connec-tion with related plant assets. We also capitalize interest associatedwith the acquisition or construction of plant assets. Capitalizedinterest is reported as a cost of plant and a reduction in interest cost.
In connection with our ongoing review of the estimated remaininguseful lives of plant, property and equipment and associated depre-ciation rates, we determined that, effective January 1, 2005, theremaining useful lives of three categories of telephone assets wouldbe shortened by 1 to 2 years. These changes in asset lives werebased on Verizon’s plans, and progress to date on those plans, todeploy fiber optic cable to homes, replacing copper cable. Whilethe timing and extent of current deployment plans are subject tomodification, Verizon management believes that current estimatesof reductions in impacted asset lives is reasonable and subject toongoing analysis as deployment of fiber optic lines continues. Theasset categories impacted and useful life changes are as follows:
Average Lives (in years) From To
Central office equipmentDigital switches 12 11Circuit equipment 9 8-9
Outside plantCopper cable 15-19 13-18
Computer Software CostsWe capitalize the cost of internal-use network and non-networksoftware which has a useful life in excess of one year in accordancewith Statement of Position (SOP) No. 98-1, “Accounting for theCosts of Computer Software Developed or Obtained for InternalUse.” Subsequent additions, modifications or upgrades to internal-use network and non-network software are capitalized only to theextent that they allow the software to perform a task it previouslydid not perform. Software maintenance and training costs are

notes to consolidated financial statements continued
44
(primarily recognized and unrecognized customer relationshipintangible assets) assets of our wireless operations. We determinedthe fair value of our customer relationship intangible assets basedon our average customer acquisition costs. We began using thedirect value approach in 2005 in accordance with a September 29,2004 Staff Announcement from the staff of the Securities andExchange Commission (SEC), “Use of the Residual Method to ValueAcquired Assets Other Than Goodwill.” Under either the directmethod or the residual method, if the fair value of the aggregatedwireless licenses was less than the aggregated carrying amount ofthe licenses, an impairment would have been recognized.
Intangible Assets Subject to AmortizationOur intangible assets that do not have indefinite lives (primarily cus-tomer lists and non-network internal-use software) are amortizedover their useful lives and reviewed for impairment in accordancewith SFAS No. 144, which only requires testing whenever events orchanges in circumstances indicate that the carrying amount of theasset may not be recoverable. If any indicators were present, wewould test for recoverability by comparing the carrying amount ofthe asset to the net undiscounted cash flows expected to be gen-erated from the asset. If those net undiscounted cash flows do notexceed the carrying amount (i.e., the asset is not recoverable), wewould perform the next step which is to determine the fair value ofthe asset and record an impairment, if any. We reevaluate the usefullife determination for these intangible assets each reporting periodto determine whether events and circumstances warrant a revisionin their remaining useful life.
For information related to the carrying amount of goodwill by seg-ment as well as the major components and average useful lives ofour other acquired intangible assets, see Note 7.
Sale of Stock By SubsidiaryWe recognize in consolidation changes in our ownership per-centage in a subsidiary caused by issuances of the subsidiary’sstock as adjustments to Contributed Capital.
Income TaxesVerizon and its domestic subsidiaries file a consolidated federalincome tax return.
Our telephone operations use the deferral method of accounting forinvestment tax credits earned prior to the repeal of investment taxcredits by the Tax Reform Act of 1986. We also defer certain transi-tional credits earned after the repeal. We amortize these creditsover the estimated service lives of the related assets as a reductionto the Provision for Income Taxes.
Stock-Based CompensationPrior to 2003, we accounted for stock-based employee compensa-tion under Accounting Principals Board Opinion No. 25,“Accounting for Stock Issued to Employees,” and related interpre-tations, and followed the disclosure-only provisions of SFAS No.123, “Accounting for Stock-Based Compensation.”
Effective January 1, 2003, we adopted the fair value recognitionprovisions of SFAS No. 123, using the prospective method (as per-mitted under SFAS No. 148, “Accounting for Stock-BasedCompensation – Transition and Disclosure”) to all new awardsgranted, modified or settled after January 1, 2003. Under theprospective method, employee compensation expense in the firstyear will be recognized for new awards granted, modified, or set-tled. The options generally vest over a term of three years, thereforethe expenses related to stock-based employee compensation
expensed in the period in which they are incurred. Also, we capi-talize interest associated with the development of non-networkinternal-use software. Capitalized non-network internal-use soft-ware costs are amortized using the straight-line method over aperiod of 1 to 7 years and are included in Other Intangible Assets,Net in our consolidated balance sheets. For a discussion of ourimpairment policy for capitalized software costs under SFAS No.144, “Accounting for the Impairment or Disposal of Long-LivedAssets,” see “Goodwill and Other Intangibles” below. Also, seeNote 7 for additional detail of non-network internal-use softwarereflected in our consolidated balance sheets.
Goodwill and Other Intangible AssetsGoodwillGoodwill is the excess of the acquisition cost of businesses over thefair value of the identifiable net assets acquired. Impairment testingfor goodwill is performed at least annually unless indicators of impair-ment exist. The impairment test for goodwill uses a two-stepapproach, which is performed at the reporting unit level. Reportingunits may be operating segments or one level below an operatingsegment, referred to as a component. Businesses for which discretefinancial information is available are generally considered to be com-ponents of an operating segment. Components that are economicallysimilar and managed by the same segment management group areaggregated and considered a reporting unit under SFAS No. 142,“Goodwill and Other Intangible Assets.” Step one compares the fairvalue of the reporting unit (calculated using a discounted cash flowmethod) to its carrying value. If the carrying value exceeds the fairvalue, there is a potential impairment and step two must be per-formed. Step two compares the carrying value of the reporting unit’sgoodwill to its implied fair value (i.e., fair value of reporting unit lessthe fair value of the unit’s assets and liabilities, including identifiableintangible assets). If the carrying value of goodwill exceeds its impliedfair value, the excess is required to be recorded as an impairment.
Intangible Assets Not Subject to AmortizationA significant portion of our intangible assets are Domestic Wirelesslicenses, including licenses associated with equity method invest-ments, that provide our wireless operations with the exclusive rightto utilize designated radio frequency spectrum to provide cellularcommunication services. While licenses are issued for only a fixedtime, generally ten years, such licenses are subject to renewal bythe Federal Communications Commission (FCC). Renewals oflicenses have occurred routinely and at nominal cost. Moreover, wehave determined that there are currently no legal, regulatory, con-tractual, competitive, economic or other factors that limit the usefullife of our wireless licenses. As a result, we treat the wirelesslicenses as an indefinite-lived intangible asset under the provisionsof SFAS No. 142. We reevaluate the useful life determination forwireless licenses each reporting period to determine whether eventsand circumstances continue to support an indefinite useful life.
We have tested our Domestic Wireless licenses for impairment atleast annually unless indicators of impairment exist. Beginning in2005, we began using a direct value approach in performing ourannual impairment test on our Domestic Wireless licenses. Thedirect value approach determines fair value using estimates offuture cash flows associated specifically with the licenses.Previously, we used a residual method, which determined the fairvalue of the wireless business by estimating future cash flows of thewireless operations. The fair value of aggregate wireless licenseswas determined by subtracting from the fair value of the wirelessbusiness the fair value of all of the other net tangible and intangible

notes to consolidated financial statements continued
45
included in the determination of net income for 2005, 2004 and2003 are less than what would have been recorded if the fair valuemethod was also applied to previously issued awards (see Note 2for additional information on the impact of adopting SFAS No. 123).
Foreign Currency TranslationThe functional currency for all of our foreign operations is the localcurrency. For these foreign entities, we translate income statementamounts at average exchange rates for the period, and we translateassets and liabilities at end-of-period exchange rates. We recordthese translation adjustments in Accumulated OtherComprehensive Loss, a separate component of Shareowners’Investment, in our consolidated balance sheets. We reportexchange gains and losses on intercompany foreign currency trans-actions of a long-term nature in Accumulated Other ComprehensiveLoss. Other exchange gains and losses are reported in income.
Employee Benefit PlansPension and postretirement health care and life insurance benefitsearned during the year as well as interest on projected benefit obli-gations are accrued currently. Prior service costs and creditsresulting from changes in plan benefits are amortized over theaverage remaining service period of the employees expected toreceive benefits.
In December 2005, we announced that Verizon managementemployees will no longer earn pension benefits or earn servicetowards the company retiree medical subsidy after June 30, 2006.See Note 15 for additional information.
Derivative InstrumentsWe have entered into derivative transactions to manage our expo-sure to fluctuations in foreign currency exchange rates, interestrates and equity prices. We employ risk management strategiesusing a variety of derivatives including foreign currency forwardsand collars, equity options, interest rate swap agreements andinterest rate locks. We do not hold derivatives for trading purposes.
In accordance with SFAS No. 133, “Accounting for DerivativeInstruments and Hedging Activities” and related amendments andinterpretations, we measure all derivatives, including derivativesembedded in other financial instruments, at fair value and recognizethem as either assets or liabilities on our consolidated balancesheets. Changes in the fair values of derivative instruments not qual-ifying as hedges or any ineffective portion of hedges are recognizedin earnings in the current period. Changes in the fair values of deriv-ative instruments used effectively as fair value hedges are recognizedin earnings, along with changes in the fair value of the hedged item.Changes in the fair value of the effective portions of cash flowhedges are reported in other comprehensive income (loss), and rec-ognized in earnings when the hedged item is recognized in earnings.
Recent Accounting PronouncementsStock-Based CompensationIn December 2004, the FASB issued SFAS No. 123(R), “Share-Based Payment,” which revises SFAS No. 123. SFAS No. 123(R)requires all share-based payments to employees, including grantsof employee stock options, to be recognized as compensationexpense based on their fair value. Effective January 1, 2003, Verizonadopted the fair value recognition provisions of SFAS No. 123. Weplan to adopt SFAS No. 123(R) effective January 1, 2006, using themodified prospective method and expect that any impact will not bematerial to our financial position or ongoing results of operations.
NOTE 2
ACCOUNTING CHANGE
Directory AccountingEffective January 1, 2003, we changed our method for recognizingrevenues and expenses in our directory business from the publica-tion-date method to the amortization method. The cumulative effectof this accounting change resulted in a charge of $2,697 million($1,647 million after-tax), recorded as of January 1, 2003.
Stock – Based CompensationAs discussed in Note 1, we adopted the fair value recognition pro-visions of SFAS No. 123 using the prospective method as permittedunder SFAS No. 148. The following table illustrates the effect onreported net income and earnings per share if the fair value methodhad been applied to all outstanding and unvested options in eachperiod.
(dollars in millions, except per share amounts)
Years Ended December 31, 2005 2004 2003
Net Income, As Reported $ 7,397 $ 7,831 $ 3,077
Add: Stock option-related employeecompensation expense includedin reported net income, net of relatedtax effects 57 53 44
Deduct: Total stock option-relatedemployee compensationexpense determined under fairvalue based method for allawards, net of related tax effects (57) (124) (215)
Pro Forma Net Income $ 7,397 $ 7,760 $ 2,906
Earnings Per Share
Basic – as reported $ 2.67 $ 2.83 $ 1.12Basic – pro forma 2.67 2.80 1.05
Diluted – as reported 2.65 2.79 1.12Diluted – pro forma 2.65 2.77 1.06
After-tax compensation expense for other stock-based compensa-tion included in net income as reported for the years endedDecember 31, 2005, 2004 and 2003 was $370 million, $254 millionand $80 million, respectively.
For additional information on assumptions used to determine thepro forma amounts as well as other information related to ourstock-based compensation plans, see Note 14.
Asset Retirement ObligationsWe adopted the provisions of SFAS No. 143 on January 1, 2003.SFAS No. 143 requires that companies recognize the fair value of aliability for asset retirement obligations in the period in which theobligations are incurred and capitalize that amount as part of thebook value of the long-lived asset. We determined that Verizondoes not have a material legal obligation to remove long-livedassets as described by this statement. However, prior to the adop-tion of SFAS No. 143, we included estimated removal costs in ourgroup depreciation models. Consequently, in connection with theinitial adoption of SFAS No. 143 we reversed accrued costs ofremoval in excess of salvage from our accumulated depreciationaccounts for these assets. The adjustment was recorded as acumulative effect of an accounting change, resulting in the recogni-

46
tion of a gain of $3,499 million ($2,150 million after-tax).Additionally, on December 31, 2005, FASB Interpretation (FIN) No.47, “Accounting for Conditional Asset Retirement Obligations – aninterpretation of FASB Statement No. 143” became effective. Therewas no impact of the adoption of FIN No. 47 on Verizon’s results ofoperations or financial position.
NOTE 3
DISCONTINUED OPERATIONS AND SALES OF BUSINESSES, NET
Discontinued OperationsVerizon Information Services CanadaDuring 2004, we announced our decision to sell Verizon InformationServices Canada Inc. to an affiliate of Bain Capital, a global privateinvestment firm, for $1,540 million (Cdn. $1,985 million). The saleclosed during the fourth quarter of 2004 and resulted in a gain of$1,017 million ($516 million after-tax). In accordance with SFAS No.144, we have classified the results of operations of VerizonInformation Services Canada as discontinued operations in theconsolidated statements of income in all years through the date ofdivestiture. Summarized results of operations for VerizonInformation Services Canada are as follows:
(dollars in millions)
Years Ended December 31, 2004 2003
Income from operations of Verizon Information Services Canada before income taxes $ 99 $ 88
Gain on sale of investment 1,017 –Income tax provision (546) (39)Income on discontinued operations,
net of tax $ 570 $ 49
Included in income from operations of Verizon Information ServicesCanada before income taxes in the preceding table are operatingrevenues of Verizon Information Services Canada prior to its sale inthe fourth quarter of 2004 of $280 million and $284 million for theyears ended December 31, 2004 and 2003, respectively.
IusacellDiscontinued operations also include the results of operations ofGrupo Iusacell, S.A. de C.V. (Iusacell) prior to the sale of Iusacell inJuly 2003. In connection with the decision to sell our interest inIusacell and a comparison of expected sale proceeds, less cost tosell, to the net book value of our investment in Iusacell (includingthe foreign currency translation balance), we recorded a pretax lossof $957 million ($931 million after-tax) in the second quarter of2003. This loss included $317 million of goodwill.
Summarized results of operations for Iusacell, which was part of ourInternational segment, follows:
(dollars in millions)
Year Ended December 31, 2003
Loss from operations of Iusacell before income taxes $ –Investment loss (957)Income tax benefit 22Loss on discontinued operations, net of tax $ (935)
Included in loss from operations of Iusacell before income taxes inthe preceding table are operating revenues of $181 million for theyear ended December 31, 2003.
Sales of Businesses, NetVerizon Hawaii Inc.During the second quarter of 2004, we entered into an agreement tosell our wireline and directory businesses in Hawaii, includingVerizon Hawaii Inc. which operated approximately 700,000switched access lines, as well as the services and assets of VerizonLong Distance, Verizon Online, Verizon Information Services andVerizon Select Services Inc. in Hawaii, to an affiliate of The CarlyleGroup. This transaction closed during the second quarter of 2005.In connection with this sale, we received net proceeds of $1,326million and recorded a net pretax gain of $530 million ($336 millionafter-tax). As a result of entering into the agreement to sell theHawaii businesses, we separately classified the assets held for saleand related liabilities in the December 31, 2004 condensed consol-idated balance sheet. Additional detail related to the assets held forsale, and related liabilities, follows:
(dollars in millions)
At December 31, 2004
Current assets $ 109Plant, property and equipment, net 820Other non-current assets 21
Total assets $ 950
Debt maturing within one year $ 125Other current liabilities 48Long-term debt 302Other non-current liabilities 50
Total liabilities $ 525
Other TransactionsIn 2003, we recorded a net pretax gain of $141 million ($88 millionafter-tax) primarily related to the sale of our European directorypublication operations in Austria, the Czech Republic, Gibraltar,Hungary, Poland and Slovakia.
NOTE 4
OTHER STRATEGIC ACTIONS
Facility and Employee-Related ItemsDuring 2005, we recorded a net pretax gain of $18 million ($8 mil-lion after-tax) in connection with our planned relocation of severalfunctions to Verizon Center, including a pretax gain of $120 million($72 million after-tax) related to the sale of a New York City officebuilding, partially offset by a pretax charge of $102 million ($64 mil-lion after-tax) primarily associated with relocation-related employeeseverance costs and related activities.
During 2005, we recorded a net pretax charge of $98 million ($59million after-tax) related to the restructuring of the Verizon manage-ment retirement benefit plans. This pretax charge was recorded inaccordance with SFAS No. 88, “Employers’ Accounting forSettlements and Curtailments of Defined Benefit Pension Plans andfor Termination Benefits” and SFAS No. 106, “Employers’Accounting for Postretirement Benefits Other Than Pensions” andincludes the unamortized cost of prior pension enhancements of$441 million offset partially by a pretax curtailment gain of $343 mil-lion related to retiree medical benefits. In connection with this
notes to consolidated financial statements continued
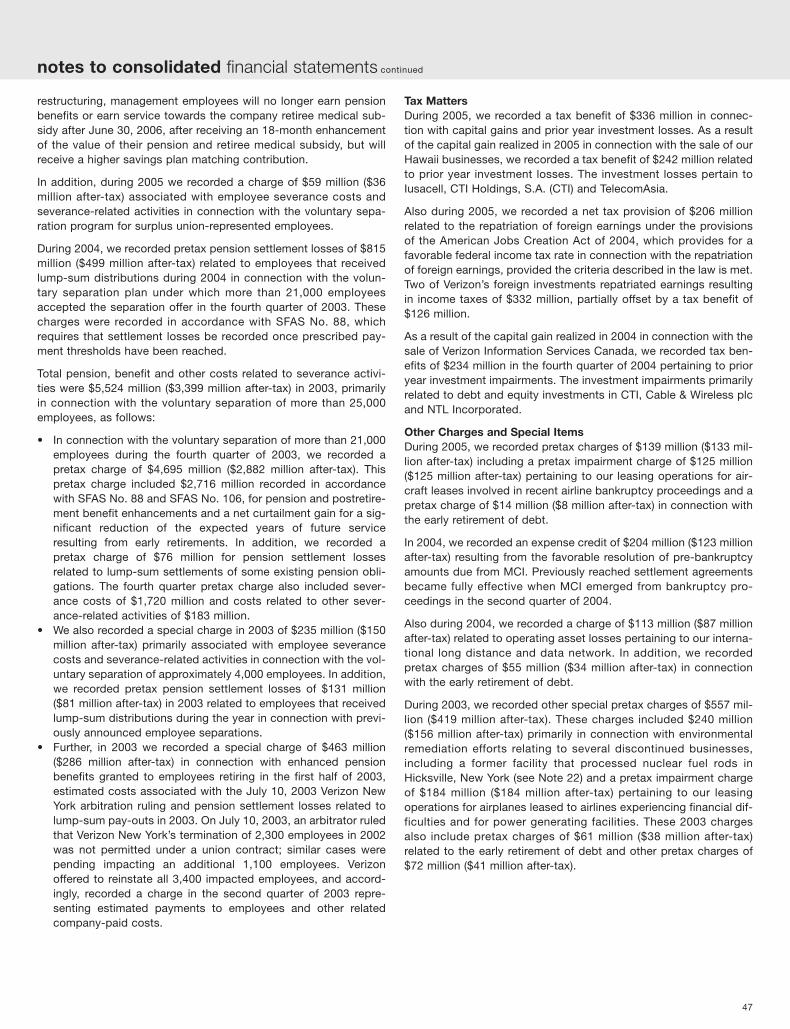
notes to consolidated financial statements continued
47
restructuring, management employees will no longer earn pensionbenefits or earn service towards the company retiree medical sub-sidy after June 30, 2006, after receiving an 18-month enhancementof the value of their pension and retiree medical subsidy, but willreceive a higher savings plan matching contribution.
In addition, during 2005 we recorded a charge of $59 million ($36million after-tax) associated with employee severance costs andseverance-related activities in connection with the voluntary sepa-ration program for surplus union-represented employees.
During 2004, we recorded pretax pension settlement losses of $815million ($499 million after-tax) related to employees that receivedlump-sum distributions during 2004 in connection with the volun-tary separation plan under which more than 21,000 employeesaccepted the separation offer in the fourth quarter of 2003. Thesecharges were recorded in accordance with SFAS No. 88, whichrequires that settlement losses be recorded once prescribed pay-ment thresholds have been reached.
Total pension, benefit and other costs related to severance activi-ties were $5,524 million ($3,399 million after-tax) in 2003, primarilyin connection with the voluntary separation of more than 25,000employees, as follows:
• In connection with the voluntary separation of more than 21,000employees during the fourth quarter of 2003, we recorded apretax charge of $4,695 million ($2,882 million after-tax). Thispretax charge included $2,716 million recorded in accordancewith SFAS No. 88 and SFAS No. 106, for pension and postretire-ment benefit enhancements and a net curtailment gain for a sig-nificant reduction of the expected years of future serviceresulting from early retirements. In addition, we recorded apretax charge of $76 million for pension settlement lossesrelated to lump-sum settlements of some existing pension obli-gations. The fourth quarter pretax charge also included sever-ance costs of $1,720 million and costs related to other sever-ance-related activities of $183 million.
• We also recorded a special charge in 2003 of $235 million ($150million after-tax) primarily associated with employee severancecosts and severance-related activities in connection with the vol-untary separation of approximately 4,000 employees. In addition,we recorded pretax pension settlement losses of $131 million($81 million after-tax) in 2003 related to employees that receivedlump-sum distributions during the year in connection with previ-ously announced employee separations.
• Further, in 2003 we recorded a special charge of $463 million($286 million after-tax) in connection with enhanced pensionbenefits granted to employees retiring in the first half of 2003,estimated costs associated with the July 10, 2003 Verizon NewYork arbitration ruling and pension settlement losses related tolump-sum pay-outs in 2003. On July 10, 2003, an arbitrator ruledthat Verizon New York’s termination of 2,300 employees in 2002was not permitted under a union contract; similar cases werepending impacting an additional 1,100 employees. Verizonoffered to reinstate all 3,400 impacted employees, and accord-ingly, recorded a charge in the second quarter of 2003 repre-senting estimated payments to employees and other relatedcompany-paid costs.
Tax MattersDuring 2005, we recorded a tax benefit of $336 million in connec-tion with capital gains and prior year investment losses. As a resultof the capital gain realized in 2005 in connection with the sale of ourHawaii businesses, we recorded a tax benefit of $242 million relatedto prior year investment losses. The investment losses pertain toIusacell, CTI Holdings, S.A. (CTI) and TelecomAsia.
Also during 2005, we recorded a net tax provision of $206 millionrelated to the repatriation of foreign earnings under the provisionsof the American Jobs Creation Act of 2004, which provides for afavorable federal income tax rate in connection with the repatriationof foreign earnings, provided the criteria described in the law is met.Two of Verizon’s foreign investments repatriated earnings resultingin income taxes of $332 million, partially offset by a tax benefit of$126 million.
As a result of the capital gain realized in 2004 in connection with thesale of Verizon Information Services Canada, we recorded tax ben-efits of $234 million in the fourth quarter of 2004 pertaining to prioryear investment impairments. The investment impairments primarilyrelated to debt and equity investments in CTI, Cable & Wireless plcand NTL Incorporated.
Other Charges and Special ItemsDuring 2005, we recorded pretax charges of $139 million ($133 mil-lion after-tax) including a pretax impairment charge of $125 million($125 million after-tax) pertaining to our leasing operations for air-craft leases involved in recent airline bankruptcy proceedings and apretax charge of $14 million ($8 million after-tax) in connection withthe early retirement of debt.
In 2004, we recorded an expense credit of $204 million ($123 millionafter-tax) resulting from the favorable resolution of pre-bankruptcyamounts due from MCI. Previously reached settlement agreementsbecame fully effective when MCI emerged from bankruptcy pro-ceedings in the second quarter of 2004.
Also during 2004, we recorded a charge of $113 million ($87 millionafter-tax) related to operating asset losses pertaining to our interna-tional long distance and data network. In addition, we recordedpretax charges of $55 million ($34 million after-tax) in connectionwith the early retirement of debt.
During 2003, we recorded other special pretax charges of $557 mil-lion ($419 million after-tax). These charges included $240 million($156 million after-tax) primarily in connection with environmentalremediation efforts relating to several discontinued businesses,including a former facility that processed nuclear fuel rods inHicksville, New York (see Note 22) and a pretax impairment chargeof $184 million ($184 million after-tax) pertaining to our leasingoperations for airplanes leased to airlines experiencing financial dif-ficulties and for power generating facilities. These 2003 chargesalso include pretax charges of $61 million ($38 million after-tax)related to the early retirement of debt and other pretax charges of$72 million ($41 million after-tax).

48
NOTE 5
MARKETABLE SECURITIES AND OTHER INVESTMENTS
We have investments in marketable securities which are considered“available-for-sale” under SFAS No. 115. These investments havebeen included in our consolidated balance sheets in Investments inUnconsolidated Businesses and Other Assets.
Under SFAS No. 115, available-for-sale securities are required to becarried at their fair value, with unrealized gains and losses (net ofincome taxes) that are considered temporary in nature recorded inAccumulated Other Comprehensive Loss. The fair values of ourinvestments in marketable securities are determined based onmarket quotations. We continually evaluate our investments in mar-ketable securities for impairment due to declines in market valueconsidered to be other than temporary. That evaluation includes, inaddition to persistent, declining stock prices, general economic andcompany-specific evaluations. In the event of a determination thata decline in market value is other than temporary, a charge to earn-ings is recorded in Income From Other Unconsolidated Businessesin the consolidated statements of income for all or a portion of theunrealized loss, and a new cost basis in the investment is estab-lished. As of December 31, 2005, no impairments were determinedto exist.
The following table shows certain summarized information relatedto our investments in marketable securities:
(dollars in millions)Gross Gross
Unrealized Unrealized FairCost Gains Losses Value
At December 31, 2005Investments in unconsolidated
businesses $ 215 $ 13 $ (3) $ 225Other assets 225 14 – 239
$ 440 $ 27 $ (3) $ 464At December 31, 2004Investments in unconsolidated
businesses $ 184 $ 7 $ (4) $ 187Other assets 149 40 – 189
$ 333 $ 47 $ (4) $ 376
Our investments in marketable securities are primarily bonds andmutual funds.
On April 9, 2005, Verizon entered into a stock purchase agreementwith eight entities affiliated with Carlos Slim Helu to purchase 43.4million shares of MCI common stock for $25.72 per share in cashplus an additional cash amount of 3% per annum from April 9, 2005until the closing of the purchase of those shares. The transactionclosed on May 17, 2005 and the additional cash payment wasmade through May 13, 2005. The total cash payment was $1,121million. Under the stock purchase agreement, Verizon will pay theSlim entities an adjustment at the end of one year in an amount perMCI share calculated by multiplying (i) .7241 by (ii) the amount, ifany, by which the price of Verizon’s common stock exceeds $35.52per share (measured over a 20-day period), subject to a maximumexcess amount per Verizon share of $26.98. After the closing of thestock purchase agreement, Verizon transferred the shares of MCIcommon stock it had purchased to a trust established pursuant to
an agreement between Verizon and the Department of Justice. Wereceived the special dividend of $5.60 per MCI share on these 43.4million MCI shares, or $243 million, on October 27, 2005. See Note24 for additional information about the MCI merger.
During 2004, we sold all of our investment in Iowa Telecom pre-ferred stock, which resulted in a pretax gain of $43 million ($43million after-tax) included in Income From Other UnconsolidatedBusinesses in the consolidated statements of income. The pre-ferred stock was received in 2000 in connection with the sale ofaccess lines in Iowa.
Certain other investments in securities that we hold are notadjusted to market values because those values are not readilydeterminable and/or the securities are not marketable. We have,however, adjusted the carrying values of these securities in situa-tions where we believe declines in value below cost were other thantemporary. During 2003, we recorded a net pretax gain of $176 mil-lion as a result of a payment received in connection with theliquidation of Genuity, Inc. In connection with this payment, Verizonrecorded a contribution of $150 million to Verizon Foundation tofund its charitable activities and increase its self-sufficiency.Consequently, we recorded a net gain of $17 million after taxesrelated to this transaction and the accrual of the Verizon Foundationcontribution. The carrying values for investments not adjusted tomarket value were $5 million at December 31, 2005 and $52 millionat December 31, 2004.
NOTE 6
PLANT, PROPERTY AND EQUIPMENT
The following table displays the details of plant, property andequipment, which is stated at cost:
(dollars in millions)
At December 31, 2005 2004
Land $ 753 $ 772Buildings and equipment 16,800 16,159Network equipment 156,719 149,261Furniture, office and data
processing equipment 12,929 13,064Work in progress 1,651 1,719Leasehold improvements 2,373 1,948Other 2,385 2,599
193,610 185,522Accumulated depreciation (118,305) (111,398)Total $ 75,305 $ 74,124
notes to consolidated financial statements continued

notes to consolidated financial statements continued
49
NOTE 7
GOODWILL AND OTHER INTANGIBLE ASSETS
GoodwillChanges in the carrying amount of goodwill are as follows:
(dollars in millions)Domestic Information
Telecom Services International Total
Balance at December 31, 2003 $ 314 $ 77 $ 444 $ 835Goodwill reclassifications and other 1 – 1 2
Balance at December 31, 2004 315 77 445 837Goodwill reclassifications and other – – (1) (1)
Balance at December 31, 2005 $ 315 $ 77 $ 444 $ 836
Other Intangible Assets(dollars in millions)
At December 31, 2005 At December 31, 2004Gross Carrying Accumulated Gross Carrying Accumulated
Amount Amortization Amount Amortization
Amortized intangible assets:Customer lists (1 to 7 years) $ 3,452 $ 3,295 $ 3,444 $ 2,832Non-network internal-use software (1 to 7 years) 7,504 3,427 6,866 2,997Other (1 to 20 years) 83 24 62 22
Total $ 11,039 $ 6,746 $ 10,372 $ 5,851Unamortized intangible assets:
Wireless licenses $ 47,804 $ 42,090
Intangible asset amortization expense was $1,528 million, $1,402 million, and $1,397 million for the years ended December 31, 2005, 2004and 2003, respectively. It is estimated to be $1,183 million in 2006, $868 million in 2007, $702 million in 2008, $565 million in 2009 and $349million in 2010, primarily related to customer lists and non-network internal-use software.
Vodafone OmnitelVodafone Omnitel N.V. (Vodafone Omnitel) is an Italian digital cel-lular telecommunications company. It is the second largest wirelessprovider in Italy. At December 31, 2005 and 2004, our investment inVodafone Omnitel included goodwill of $937 million and $1,072 mil-lion, respectively.
During 2005, we repatriated $2,202 million of Vodafone Omnitel’searnings through the repurchase of issued and outstanding sharesof its equity. Vodafone Omnitel’s owners, Verizon and VodafoneGroup Plc (Vodafone), participated on a pro rata basis; conse-quently, Verizon’s ownership interest after the share repurchaseremained at 23.1%.
TELUSTELUS Corporation (TELUS) is a full-service telecommunicationsprovider and provides subscribers with a full range of telecommuni-cations products and services including data, voice and wirelessservices across Canada.
During the fourth quarter of 2004, we recorded a pretax gain of$787 million ($565 million after-tax) on the sale of our 20.5%interest in TELUS in an underwritten public offering in the U.S. andCanada. In connection with this sale transaction, Verizon recordeda contribution of $100 million to Verizon Foundation to fund itscharitable activities and increase its self-sufficiency. Consequently,we recorded a net gain of $500 million after taxes related to thistransaction and the accrual of the Verizon Foundation contribution.
Other Equity InvesteesVerizon has limited partnership investments in entities that invest inaffordable housing projects, for which Verizon provides funding as a
NOTE 8
INVESTMENTS IN UNCONSOLIDATED BUSINESSES
Our investments in unconsolidated businesses are comprised of the following:
(dollars in millions)
2005 2004At December 31, Ownership Investment Ownership Investment
Equity InvesteesCANTV 28.5% $ 152 28.5% $ 199Vodafone Omnitel 23.1 2,591 23.1 4,642Other Various 772 Various 876Total equity investees 3,515 5,717
Cost Investees Various 1,089 Various 138Total investments in
unconsolidated businesses $ 4,604 $ 5,855
Dividends and repatriations of foreign earnings received frominvestees amounted to $2,336 million in 2005, $162 million in 2004and $198 million in 2003, respectively, and are reported in Other, Netoperating activities in the consolidated statements of cash flows.
Equity InvesteesCANTVCompañía Anónima Nacional Teléfonos de Venezuela (CANTV) isVenezuela’s largest full-service telecommunications provider.CANTV offers local services, national and international long dis-tance, Internet access and wireless services in Venezuela as well aspublic telephone, private network, data transmission, directory andother value-added services.

exercise that right. As a result, Vodafone still has the right to requirethe purchase of up to $20 billion worth of its interest, not to exceed$10 billion in any one year, during a 61-day period opening on June10 and closing on August 9 in 2006 and 2007. Vodafone also mayrequire that Verizon Wireless pay for up to $7.5 billion of the requiredrepurchase through the assumption or incurrence of debt.
Cellular Partnerships and OtherIn August 2002, Verizon Wireless and Price Communications Corp.(Price) combined Price’s wireless business with a portion of VerizonWireless in a transaction valued at approximately $1.7 billion,including $550 million of net debt. The resulting limited partnershipis controlled and managed by Verizon Wireless. In exchange for itscontributed assets, Price received a limited partnership interest inthe new partnership which is exchangeable into common stock ofVerizon Wireless if an initial public offering of that stock occurs, orinto the common stock of Verizon on the fourth anniversary of theasset contribution date if the initial public offering of VerizonWireless common stock does not occur prior to then. The price ofthe Verizon common stock used in determining the number ofVerizon common shares received in an exchange is also subject toa maximum and minimum amount.
TELPRITelecomunicaciones de Puerto Rico, Inc. (TELPRI) provides local,wireless, long distance, paging and Internet-access services inPuerto Rico.
Preferred Securities Issued By SubsidiariesOn December 7, 2005, Verizon issued a notice to redeem $100 mil-lion Verizon International Holdings Ltd. Series A variable term votingcumulative preferred stock on January 15, 2006 at the redemptionprice per share of $100,000, plus accrued and unpaid dividends.
NOTE 10
LEASING ARRANGEMENTS
As LessorWe are the lessor in leveraged and direct financing lease agree-ments under which commercial aircraft and power generatingfacilities, which comprise the majority of the portfolio, along withindustrial equipment, real estate property, telecommunications andother equipment are leased for remaining terms of less than 1 yearto 50 years as of December 31, 2005. Minimum lease paymentsreceivable represent unpaid rentals, less principal and interest onthird-party nonrecourse debt relating to leveraged lease transac-tions. Since we have no general liability for this debt, which holds asenior security interest in the leased equipment and rentals, therelated principal and interest have been offset against the minimumlease payments receivable in accordance with GAAP. All recoursedebt is reflected in our consolidated balance sheets. See Note 4 forinformation on lease impairment charges.
limited partner and receives tax deductions and tax credits basedon its partnership interests. At December 31, 2005 and 2004,Verizon had equity investments in these partnerships of $652 millionand $755 million, respectively. Verizon currently adjusts the carryingvalue of these investments for any losses incurred by the limitedpartnerships through earnings.
During 2003, we recorded a pretax gain of $348 million on the saleof our interest in Eurotel Praha, spol. s r.o. In connection with thissale transaction, Verizon recorded a contribution of $150 million toVerizon Foundation to fund its charitable activities and increase itsself-sufficiency. Consequently, we recorded a net gain of $27 millionafter taxes related to this transaction and the accrual of the VerizonFoundation contribution.
The remaining investments include wireless partnerships in theU.S., and several other domestic and international investments.
Cost InvesteesSome of our cost investments are carried at their current marketvalue. Other cost investments are carried at their original cost,except in cases where we have determined that a decline in theestimated market value of an investment is other than temporary asdescribed in Note 5. Our cost investments include a variety ofdomestic and international investments primarily involved in pro-viding telecommunication services.
The increase in our cost investments in unconsolidated businessesis primarily the result of the purchase of 43.4 million shares of MCIcommon stock from eight entities affiliated with Carlos Slim Helu(see Note 5).
NOTE 9
MINORITY INTEREST
Minority interests in equity of subsidiaries were as follows:
(dollars in millions)
At December 31, 2005 2004
Minority interests in consolidated subsidiaries*:Wireless joint venture (55%) $ 24,683 $ 23,034Cellular partnerships and other (various) 1,652 1,584TELPRI (52%) 319 335
Preferred securities issued by subsidiaries 100 100$ 26,754 $ 25,053
*Indicated ownership percentages are Verizon’s consolidated interests.
Wireless Joint VentureThe wireless joint venture was formed in April 2000 in connectionwith the combination of the U.S. wireless operations and interestsof Verizon and Vodafone. The wireless joint venture operates asVerizon Wireless. Verizon owns a controlling 55% interest in VerizonWireless and Vodafone owns the remaining 45%.
Under the terms of an investment agreement, Vodafone may requireVerizon Wireless to purchase up to an aggregate of $20 billion worthof Vodafone’s interest in Verizon Wireless at designated times at itsthen fair market value. In the event Vodafone exercises its put rights,we have the right, exercisable at our sole discretion, to purchase upto $12.5 billion of Vodafone’s interest instead of Verizon Wireless forcash or Verizon stock at our option. Vodafone had the right torequire the purchase of up to $10 billion during the 61-day periodopening on June 10 and closing on August 9 in 2005, and did not
50
notes to consolidated financial statements continued

notes to consolidated financial statements continued
51
The following table is a summary of the components of income fromleveraged leases:
(dollars in millions)
Years Ended December 31, 2005 2004 2003
Pretax lease income $ 119 $ 63 $ 108Income tax expense/(benefit) (25) (52) 11Investment tax credits 4 3 3
The future minimum lease payments to be received from noncance-lable leases, net of nonrecourse loan payments related to leveragedand direct financing leases in excess of debt service requirements,for the periods shown at December 31, 2005, are as follows:
(dollars in millions)
Capital OperatingYears Leases Leases
2006 $ 103 $ 222007 122 72008 128 42009 187 62010 161 2Thereafter 3,269 –Total $ 3,970 $ 41
As LesseeWe lease certain facilities and equipment for use in our operationsunder both capital and operating leases. Total rent expense fromcontinuing operations under operating leases amounted to $1,532million in 2005, $1,347 million in 2004 and $1,334 million in 2003.
Capital lease amounts included in plant, property and equipmentare as follows:
(dollars in millions)
At December 31, 2005 2004
Capital leases $ 313 $ 596Accumulated amortization (137) (412)Total $ 176 $ 184
The aggregate minimum rental commitments under noncancelableleases for the periods shown at December 31, 2005, are as follows:
(dollars in millions)
Capital OperatingYears Leases Leases
2006 $ 37 $ 1,1842007 28 7912008 21 6522009 13 5042010 12 316Thereafter 55 1,050Total minimum rental commitments 166 $ 4,497Less interest and executory costs (54)Present value of minimum lease payments 112Less current installments (17)Long-term obligation at December 31, 2005 $ 95
As of December 31, 2005, the total minimum sublease rentals to bereceived in the future under noncancelable operating and capitalsubleases were $46 million and $1 million, respectively.
Finance lease receivables, which are included in Prepaid Expenses and Other and Other Assets in our consolidated balance sheets arecomprised of the following:
(dollars in millions)
At December 31, 2005 2004Direct Direct
Leveraged Finance Leveraged FinanceLeases Leases Total Leases Leases Total
Minimum lease payments receivable $ 3,847 $ 123 $ 3,970 $ 4,133 $ 173 $ 4,306Estimated residual value 1,937 9 1,946 2,319 15 2,334Unearned income (2,260) (11) (2,271) (2,631) (19) (2,650)
$ 3,524 $ 121 3,645 $ 3,821 $ 169 3,990Allowance for doubtful accounts (375) (326)Finance lease receivables, net $ 3,270 $ 3,664Current $ 30 $ 43Noncurrent $ 3,240 $ 3,621
Accumulated deferred taxes arising from leveraged leases, which are included in Deferred Income Taxes, amounted to $3,049 million atDecember 31, 2005 and $3,226 million at December 31, 2004.

52
NOTE 11
DEBT
Debt Maturing Within One YearDebt maturing within one year is as follows:
(dollars in millions)
At December 31, 2005 2004
Long-term debt maturing within one year $ 4,926 $ 3,569Commercial paper 2,204 –Other short-term debt 11 24Total debt maturing within one year $ 7,141 $ 3,593
The weighted average interest rate for our commercial paper atyear-end December 31, 2005 was 4.3%. There was no commercialpaper outstanding at December 31, 2004.
Capital expenditures (primarily construction of telephone plant) arepartially financed, pending long-term financing, through bank loansand the issuance of commercial paper payable within 12 months.
At December 31, 2005, we had approximately $6.7 billion of unusedbank lines of credit. Certain of these lines of credit contain require-ments for the payment of commitment fees.
Long-Term DebtOutstanding long-term debt obligations are as follows:
Telephone Subsidiaries’ DebtOur first mortgage bonds of $172 million are secured by certaintelephone operations assets.
See Note 21 for additional information about guarantees of oper-ating subsidiary debt.
Zero-Coupon Convertible NotesIn May 2001, Verizon Global Funding Corp. (Verizon Global Funding)issued approximately $5.4 billion in principal amount at maturity ofzero-coupon convertible notes due 2021, resulting in gross pro-ceeds of approximately $3 billion. The notes are convertible into
shares of our common stock at an initial price of $69.50 per share ifthe closing price of Verizon common stock on the New York StockExchange exceeds specified levels or in other specified circum-stances. The conversion price increases by at least 3% a year. Theinitial conversion price represents a 25% premium over the May 8,2001 closing price of $55.60 per share. The zero-coupon convert-ible notes are callable by Verizon Global Funding on or after May15, 2006. In addition, the notes are redeemable at the option of theholders on May 15th in each of the years 2004, 2006, 2011 and2016. On May 15, 2004, $3,292 million of principal amount of thenotes ($1,984 million after unamortized discount) were redeemed by
(dollars in millions)
At December 31, Interest Rates % Maturities 2005 2004
Notes payable 4.00 – 8.61 2006 – 2035 $ 16,310 $ 17,481
Telephone subsidiaries – debentures and first/refunding mortgage bonds 4.63 – 7.00 2006 – 2042 11,869 12,9587.15 – 7.65 2007 – 2032 1,725 1,8257.85 – 9.67 2010 – 2031 1,926 1,930
Other subsidiaries – debentures and other 4.25 – 8.75 2006 – 2028 3,410 3,480
Zero-coupon convertible notes, net of unamortized discount of $790 and $830 3.18 2021 1,360 1,320
Employee stock ownership plan loans:NYNEX debentures 9.55 2010 113 145
Capital lease obligations (average rate 11.9% and 9.4%) 112 138
Property sale holdbacks held in escrow, vendor financing and other 3.00 – 3.25 2006 – 2009 13 21
Unamortized discount, net of premium (43) (55)Total long-term debt, including current maturities 36,795 39,243Less: debt maturing within one year (4,926) (3,569)Total long-term debt $ 31,869 $ 35,674
notes to consolidated financial statements continued

notes to consolidated financial statements continued
53
Verizon Global Funding. As of December 31, 2005, the remainingzero-coupon convertible notes were classified as debt maturingwithin one year since they are redeemable at the option of theholders on May 15, 2006.
Support AgreementsAll of Verizon Global Funding’s debt has the benefit of SupportAgreements between us and Verizon Global Funding, which giveholders of Verizon Global Funding debt the right to proceed directlyagainst us for payment of interest, premium (if any) and principaloutstanding should Verizon Global Funding fail to pay. The holdersof Verizon Global Funding debt do not have recourse to the stock orassets of most of our telephone operations; however, they do haverecourse to dividends paid to us by any of our consolidated sub-sidiaries as well as assets not covered by the exclusion. VerizonGlobal Funding’s long-term debt, including current portion, aggre-gated $14,152 million at December 31, 2005. The carrying value ofthe available assets reflected in our consolidated balance sheetswas approximately $63.9 billion at December 31, 2005.
Verizon and NYNEX Corporation are the joint and several co-obligors of the 20-Year 9.55% Debentures due 2010 previouslyissued by NYNEX on March 26, 1990. As of December 31, 2005,$113 million principal amount of this obligation remained out-standing. In addition, Verizon Global Funding has guaranteed thedebt obligations of GTE Corporation (but not the debt of its sub-sidiary or affiliate companies) that were issued and outstandingprior to July 1, 2003. As of December 31, 2005, $3,400 million prin-cipal amount of these obligations remained outstanding. NYNEXand GTE no longer issue public debt or file SEC reports. See Note21 for information on guarantees of operating subsidiary debt listedon the New York Stock Exchange.
On February 1, 2006, Verizon announced the merger of VerizonGlobal Funding into Verizon.
Debt CovenantsWe and our consolidated subsidiaries are in compliance with all ofour debt covenants.
Maturities of Long-Term DebtMaturities of long-term debt outstanding at December 31, 2005 are$4.9 billion in 2006, $4.7 billion in 2007, $2.5 billion in 2008, $1.7billion in 2009, $2.8 billion in 2010 and $20.2 billion thereafter.These amounts include the debt, redeemable at the option of theholder, at the earliest redemption dates.
NOTE 12
FINANCIAL INSTRUMENTS
DerivativesThe ongoing effect of SFAS No. 133 and related amendments andinterpretations on our consolidated financial statements will bedetermined each period by several factors, including the specifichedging instruments in place and their relationships to hedgeditems, as well as market conditions at the end of each period.
Interest Rate Risk ManagementWe have entered into domestic interest rate swaps, to achieve atargeted mix of fixed and variable rate debt, where we principallyreceive fixed rates and pay variable rates based on LIBOR. Theseswaps hedge against changes in the fair value of our debt portfolio.We record the interest rate swaps at fair value in our balance sheetas assets and liabilities and adjust debt for the change in its fair
value due to changes in interest rates. The ineffective portions ofthese hedges were recorded as gains in the consolidated state-ments of income of $4 million and $2 million for the years endedDecember 31, 2004 and 2003, respectively. During 2005, weentered into interest rate derivatives to limit our exposure to interestrate changes. In accordance with the provisions of SFAS No. 133,changes in fair value of these cash flow hedges due to interest ratefluctuations are recognized in Accumulated Other ComprehensiveLoss. As of December 31, 2005, we have recorded unrealized gainsof $5 million in Other Comprehensive Income (Loss) related to theseinterest rate cash flow hedges.
Foreign Exchange Risk ManagementOur foreign exchange risk management includes the use of foreigncurrency forward contracts and cross currency interest rate swapswith foreign currency forwards. These contracts are typically usedto hedge short-term foreign currency transactions and commit-ments, or to offset foreign exchange gains or losses on the foreigncurrency obligations and are designated as cash flow hedges.There were no foreign currency contracts outstanding as ofDecember 31, 2005. We record these contracts at fair value asassets or liabilities and the related gains or losses are deferred inshareowners’ investment as a component of Other ComprehensiveIncome (Loss). We have recorded net gains of $17 million andlosses of $21 million in Other Comprehensive Income (Loss) for theyears ended December 31, 2004 and 2003, respectively.
Net Investment HedgesDuring 2005, we entered into zero cost euro collars to hedge a por-tion of our net investment in Vodafone Omnitel. In accordance withthe provisions of SFAS No. 133 and related amendments and inter-pretations, changes in fair value of these contracts due to exchangerate fluctuations are recognized in Accumulated OtherComprehensive Loss and offset the impact of foreign currencychanges on the value of our net investment in the operation beinghedged. As of December 31, 2005, our positions in the zero costeuro collars have been settled. As of December 31, 2005, we haverecorded unrealized gains of $2 million in Accumulated OtherComprehensive Loss related to these hedge contracts.
During 2004, we entered into foreign currency forward contracts tohedge our net investment in our Canadian operations and invest-ments. In accordance with the provisions of SFAS No. 133, changesin the fair value of these contracts due to exchange rate fluctuationswere recognized in Accumulated Other Comprehensive Loss andoffset the impact of foreign currency changes on the value of ournet investment in the operations being hedged. During 2004, wesold our Canadian operations and investments. Accordingly, theunrealized losses on these net investment hedge contracts wererealized in net income along with the corresponding foreign cur-rency translation balance. We recorded realized losses of $106million ($58 million after-tax) related to these hedge contracts.
Other DerivativesOn May 17, 2005, we purchased 43.4 million shares of MCIcommon stock under a stock purchase agreement that contained aprovision for the payment of an additional cash amount determinedimmediately prior to April 9, 2006 based on the market price ofVerizon’s common stock (see Note 5). Under SFAS No. 133, thisadditional cash payment is an embedded derivative which we carryat fair value and is subject to changes in the market price of Verizonstock. Since this derivative does not qualify for hedge accountingunder SFAS No. 133, changes in its fair value are recorded in the
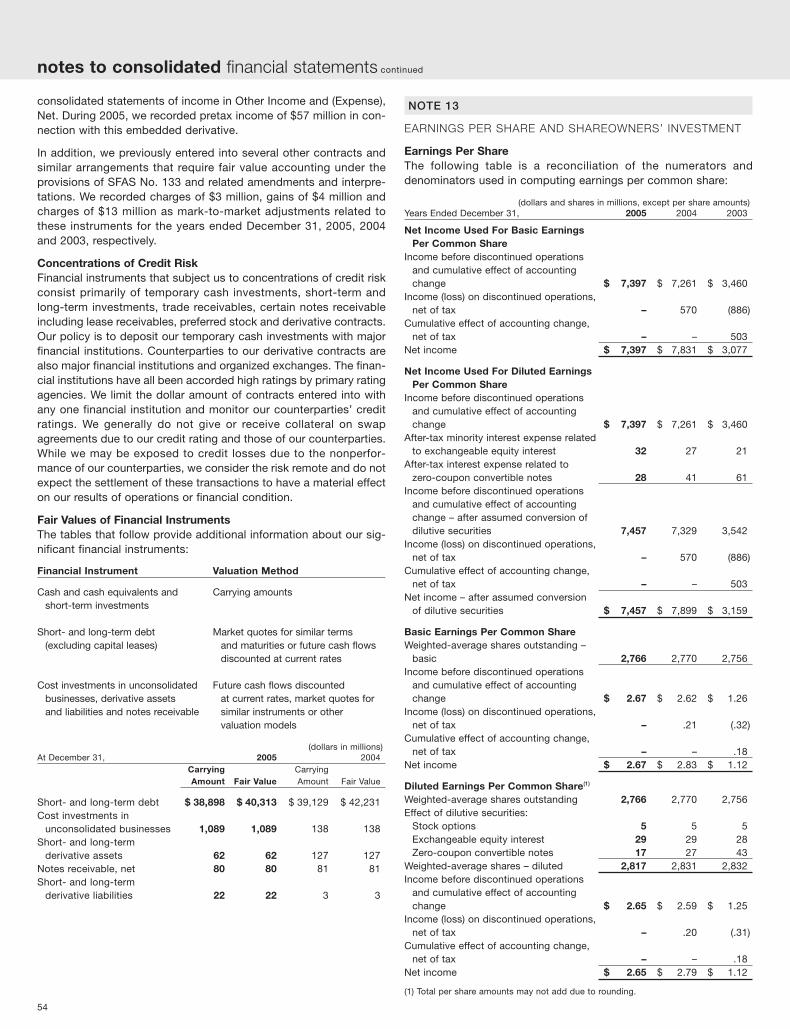
54
consolidated statements of income in Other Income and (Expense),Net. During 2005, we recorded pretax income of $57 million in con-nection with this embedded derivative.
In addition, we previously entered into several other contracts andsimilar arrangements that require fair value accounting under theprovisions of SFAS No. 133 and related amendments and interpre-tations. We recorded charges of $3 million, gains of $4 million andcharges of $13 million as mark-to-market adjustments related tothese instruments for the years ended December 31, 2005, 2004and 2003, respectively.
Concentrations of Credit RiskFinancial instruments that subject us to concentrations of credit riskconsist primarily of temporary cash investments, short-term andlong-term investments, trade receivables, certain notes receivableincluding lease receivables, preferred stock and derivative contracts.Our policy is to deposit our temporary cash investments with majorfinancial institutions. Counterparties to our derivative contracts arealso major financial institutions and organized exchanges. The finan-cial institutions have all been accorded high ratings by primary ratingagencies. We limit the dollar amount of contracts entered into withany one financial institution and monitor our counterparties’ creditratings. We generally do not give or receive collateral on swapagreements due to our credit rating and those of our counterparties.While we may be exposed to credit losses due to the nonperfor-mance of our counterparties, we consider the risk remote and do notexpect the settlement of these transactions to have a material effecton our results of operations or financial condition.
Fair Values of Financial InstrumentsThe tables that follow provide additional information about our sig-nificant financial instruments:
Financial Instrument Valuation Method
Cash and cash equivalents and Carrying amountsshort-term investments
Short- and long-term debt Market quotes for similar terms(excluding capital leases) and maturities or future cash flows
discounted at current rates
Cost investments in unconsolidated Future cash flows discountedbusinesses, derivative assets at current rates, market quotes forand liabilities and notes receivable similar instruments or other
valuation models
(dollars in millions)At December 31, 2005 2004
Carrying CarryingAmount Fair Value Amount Fair Value
Short- and long-term debt $ 38,898 $ 40,313 $ 39,129 $ 42,231Cost investments in
unconsolidated businesses 1,089 1,089 138 138Short- and long-term
derivative assets 62 62 127 127Notes receivable, net 80 80 81 81Short- and long-term
derivative liabilities 22 22 3 3
NOTE 13
EARNINGS PER SHARE AND SHAREOWNERS’ INVESTMENT
Earnings Per ShareThe following table is a reconciliation of the numerators anddenominators used in computing earnings per common share:
(dollars and shares in millions, except per share amounts)Years Ended December 31, 2005 2004 2003
Net Income Used For Basic Earnings Per Common Share
Income before discontinued operations and cumulative effect of accounting change $ 7,397 $ 7,261 $ 3,460
Income (loss) on discontinued operations, net of tax – 570 (886)
Cumulative effect of accounting change, net of tax – – 503
Net income $ 7,397 $ 7,831 $ 3,077
Net Income Used For Diluted Earnings Per Common Share
Income before discontinued operations and cumulative effect of accounting change $ 7,397 $ 7,261 $ 3,460
After-tax minority interest expense related to exchangeable equity interest 32 27 21
After-tax interest expense related to zero-coupon convertible notes 28 41 61
Income before discontinued operations and cumulative effect of accounting change – after assumed conversion of dilutive securities 7,457 7,329 3,542
Income (loss) on discontinued operations, net of tax – 570 (886)
Cumulative effect of accounting change, net of tax – – 503
Net income – after assumed conversion of dilutive securities $ 7,457 $ 7,899 $ 3,159
Basic Earnings Per Common ShareWeighted-average shares outstanding –
basic 2,766 2,770 2,756Income before discontinued operations
and cumulative effect of accounting change $ 2.67 $ 2.62 $ 1.26
Income (loss) on discontinued operations, net of tax – .21 (.32)
Cumulative effect of accounting change, net of tax – – .18
Net income $ 2.67 $ 2.83 $ 1.12
Diluted Earnings Per Common Share(1)
Weighted-average shares outstanding 2,766 2,770 2,756Effect of dilutive securities:
Stock options 5 5 5Exchangeable equity interest 29 29 28Zero-coupon convertible notes 17 27 43
Weighted-average shares – diluted 2,817 2,831 2,832Income before discontinued operations
and cumulative effect of accounting change $ 2.65 $ 2.59 $ 1.25
Income (loss) on discontinued operations, net of tax – .20 (.31)
Cumulative effect of accounting change, net of tax – – .18
Net income $ 2.65 $ 2.79 $ 1.12
(1) Total per share amounts may not add due to rounding.
notes to consolidated financial statements continued

notes to consolidated financial statements continued
55
Certain outstanding options to purchase shares were not includedin the computation of diluted earnings per common share becauseto do so would have been anti-dilutive for the period, includingapproximately 242 million shares during 2005, 253 million sharesduring 2004 and 248 million shares during 2003.
The diluted earnings per share calculation considers the assumedconversion of an exchangeable equity interest (see Note 9) andVerizon’s zero-coupon convertible notes (see Note 11).
Shareowners’ InvestmentOur certificate of incorporation provides authority for the issuanceof up to 250 million shares of Series Preferred Stock, $.10 par value,in one or more series, with such designations, preferences, rights,qualifications, limitations and restrictions as the Board of Directorsmay determine.
We are authorized to issue up to 4.25 billion shares of common stock.
On January 22, 2004, the Board of Directors authorized the repur-chase of up to 80 million common shares terminating no later than theclose of business on February 28, 2006. We repurchased 7.9 millionand 9.5 million common shares during 2005 and 2004, respectively.
On January 19, 2006, the Board of Directors authorized the repur-chase of up to 100 million common shares terminating no later thanthe close of business on February 28, 2008. The Board of Directorsalso determined that no additional common shares may be pur-chased under the previous program.
NOTE 14
STOCK INCENTIVE PLANS
We determined stock-option related employee compensationexpense for 2004 and 2003 using the Black-Scholes option-pricingmodel based on the following weighted-average assumptions:
2004 2003
Dividend yield 4.2% 4.0%Expected volatility 31.3 30.9Risk-free interest rate 3.3 3.4Expected lives (in years) 6 6
We did not grant options during 2005.
The weighted-average value of options granted during 2004 and2003 was $7.88 and $8.41, respectively. Our stock incentive plansare described below:
Fixed Stock Option PlansWe have fixed stock option plans for substantially all employees.Options to purchase common stock were granted at a price equal tothe market price of the stock at the date of grant. The options gen-erally vest over three years and have a maximum term of ten years.
This table summarizes our fixed stock option plans:
Stock Options Weighted-Average
(in thousands) Exercise Price
Outstanding, January 1, 2003 261,437 $ 48.32Granted 22,207 38.94Exercised (4,634) 31.29Canceled/forfeited (7,917) 47.87
Outstanding, December 31, 2003 271,093 47.86Granted 16,824 36.75Exercised (10,163) 29.90Canceled/forfeited (6,364) 49.69
Outstanding, December 31, 2004 271,390 47.80Granted – –Exercised (1,095) 29.74Canceled/forfeited (19,319) 51.36
Outstanding, December 31, 2005 250,976 47.62Options exercisable, December 31,
2003 233,374 48.272004 239,093 48.912005 236,158 48.27

56
Stock Options Outstanding Stock Options ExercisableShares Weighted-Average Weighted-Average Shares Weighted-Average
Range of Exercise Prices (in thousands) Remaining Life Exercise Price (in thousands) Exercise Price
$ 20.00 – 29.99 32 6.74 years $ 27.25 32 $ 27.2530.00 – 39.99 56,085 5.24 36.73 41,281 36.5240.00 – 49.99 98,448 4.65 45.33 98,435 45.3350.00 – 59.99 95,087 4.11 56.22 95,086 56.2260.00 – 69.99 1,324 3.79 62.11 1,324 62.11
Total 250,976 4.57 47.62 236,158 48.27
The following table summarizes information about fixed stock options outstanding as of December 31, 2005:
Performance-Based SharesIn 2005, stock compensation awards consisted of performance-based stock units and restricted stock units that vest over threeyears. The 2005 performance-based stock units and restrictedstock units will be paid in cash upon vesting. The expense associ-ated with these awards is disclosed as part of other stock-basedcompensation (see Note 2).
In 2004, stock compensation awards consisted of stock options,performance-based stock units and restricted stock units that vestover three years. The 2004 performance-based stock units andrestricted stock units will be paid in cash upon vesting. Theexpense associated with these awards is disclosed as part of otherstock-based compensation (see Note 2).
In 2003, stock compensation awards consisted of stock optionsand performance-based stock units that vest over three years. Thiswas the first grant of performance based shares since 2000, whencertain key Verizon employees were granted restricted stock unitsthat vest over a three to five year period.
The number of shares accrued for the performance-based shareprograms was 5,521,000, 5,993,000 and 6,707,000 at December31, 2005, 2004 and 2003, respectively.
NOTE 15
EMPLOYEE BENEFITS
We maintain noncontributory defined benefit pension plans formany of our employees. The postretirement health care and lifeinsurance plans for our retirees and their dependents are both con-tributory and noncontributory and include a limit on the company’sshare of cost for certain recent and future retirees. We also sponsordefined contribution savings plans to provide opportunities for eli-gible employees to save for retirement on a tax-deferred basis. Weuse a measurement date of December 31 for our pension andpostretirement health care and life insurance plans.
Pension and Other Postretirement BenefitsPension and other postretirement benefits for many of our employeesare subject to collective bargaining agreements. Modifications inbenefits have been bargained from time to time, and we may alsoperiodically amend the benefits in the management plans.
In December 2005, we announced that Verizon managementemployees will no longer earn pension benefits or earn servicetowards the company retiree medical subsidy after June 30, 2006.In addition, new management employees hired after December 31,2005 are not eligible for pension benefits and managers with lessthan 13.5 years of service as of June 30, 2006 are not eligible forcompany-subsidized retiree healthcare or retiree life insurance ben-efits. Beginning July 1, 2006, management employees will receivean increased company match on their savings plan contributions.
The following tables summarize benefit costs, as well as the benefitobligations, plan assets, funded status and rate assumptions asso-ciated with pension and postretirement health care and lifeinsurance benefit plans.
notes to consolidated financial statements continued

notes to consolidated financial statements continued
57
Obligations and Funded Status (dollars in millions)
Pension Health Care and LifeAt December 31, 2005 2004 2005 2004
Change in Benefit ObligationBeginning of year $ 37,395 $ 40,968 $ 27,077 $ 24,581Service cost 721 712 373 282Interest cost 2,070 2,289 1,519 1,479Plan amendments 181 (65) 59 248Actuarial loss, net 390 2,467 520 2,017Benefits paid (2,977) (2,884) (1,706) (1,532)Termination benefits 11 4 1 2Settlements (35) (6,105) – –Acquisitions and divestitures, net (194) – (34) –Other (1) 9 – –End of year 37,561 37,395 27,809 27,077
Change in Plan AssetsBeginning of year 39,106 42,776 4,549 4,467Actual return on plan assets 4,246 4,874 348 471Company contributions 852 443 1,085 1,143Benefits paid (2,977) (2,884) (1,706) (1,532)Settlements (35) (6,105) – –Acquisitions and divestitures, net (202) 2 – –End of year 40,990 39,106 4,276 4,549
Funded StatusEnd of year 3,429 1,711 (23,533) (22,528)
UnrecognizedActuarial loss, net 4,761 5,486 7,585 7,335Prior service cost 1,075 1,387 4,310 4,193Transition obligation 1 1 16 18
Net amount recognized $ 9,266 $ 8,585 $ (11,622) $ (10,982)
Amounts recognized on the balance sheetPrepaid pension cost (in Other Assets) $ 12,704 $ 12,302 $ – $ –Assets held for sale – 1 – –Other assets 478 463 – –Employee benefit obligation (5,473) (5,774) (11,622) (10,953)Liabilities related to assets held for sale – – – (29)Minority interest 168 145 – –Accumulated other comprehensive loss 1,389 1,448 – –
Net amount recognized $ 9,266 $ 8,585 $ (11,622) $ (10,982)
Changes in benefit obligations were caused by factors includingchanges in actuarial assumptions (see Assumptions below), curtail-ments and settlements.
In 2005 as a result of our announcement regarding managementretiree benefits, we recorded pre-tax expense of $441 million forpension curtailments and pre-tax income of $343 million for retireemedical curtailments (see Note 4 for additional information).
Verizon’s union contracts contain health care cost provisions thatlimit company payments toward health care costs to specific dollaramounts (known as caps). These caps pertain to both current andfuture retirees, and have a significant impact on the actuarial valua-tion of postretirement benefits. These caps have been included inunion contracts for several years, but have exceeded the annualhealth care cost every year until 2003. During the negotiation of newcollective bargaining agreements for union contracts covering79,000 unionized employees in the second half of 2003, the datehealth care caps would become effective was extended and thedollar amounts of the caps were increased. In the fourth quarter of2003, we began recording retiree health care costs as if there wereno caps, in connection with the ratification of the union contracts.
Since the caps are an assumption included in the actuarial determi-nation of Verizon’s postretirement obligation, the effect of extendingand increasing the caps increased the accumulated postretirementobligation in the fourth quarter of 2003 by $5,158 million.
In 2003 Verizon reduced its workforce using its employee severanceplans (see Note 4). Additionally, in 2005, 2004 and 2003, several ofthe pension plans’ lump-sum pension distributions surpassed thesettlement threshold equal to the sum of service cost and interestcost requiring settlement recognition for all cash settlements foreach of those years.
The accumulated benefit obligation for all defined benefit pensionplans was $36,128 million and $35,389 million at December 31,2005 and 2004, respectively.
Information for pension plans with an accumulated benefit obliga-tion in excess of plan assets follows:
(dollars in millions)
At December 31, 2005 2004
Projected benefit obligation $ 13,100 $ 12,979Accumulated benefit obligation 12,575 12,508Fair value of plan assets 8,605 7,816

Net Periodic Cost (dollars in millions)
Pension Health Care and LifeYears Ended December 31, 2005 2004 2003 2005 2004 2003
Service cost $ 721 $ 712 $ 785 $ 373 $ 282 $ 176Interest cost 2,070 2,289 2,436 1,519 1,479 1,203Expected return on plan assets (3,348) (3,709) (4,150) (353) (414) (430)Amortization of transition asset – (4) (41) 2 2 2Amortization of prior service cost 45 60 23 285 234 (9)Actuarial loss (gain), net 146 57 (337) 278 187 130Net periodic benefit (income) cost (366) (595) (1,284) 2,104 1,770 1,072Termination benefits 3 4 2,588 1 2 508Termination benefits – Hawaii operations sold 8 – – – – –Settlement loss – 815 229 – – –Settlement loss– Hawaii operations sold 80 – – – – –Curtailment (gain) loss and other, net 441 1 65 (343) 2 (130)Curtailment loss – Hawaii operations sold 6 – – – – –Subtotal 538 820 2,882 (342) 4 378Total cost $ 172 $ 225 $ 1,598 $ 1,762 $ 1,774 $ 1,450
58
The termination benefits, settlement loss and curtailment loss amounts pertaining to the Hawaii operations sold were recorded in theconsolidated statements of income in Sales of Businesses, Net.
Additional InformationWe evaluate each pension plan to determine whether any additional minimum liability is required. As a result of changes in interest ratesand changes in investment returns, an adjustment to the additional minimum pension liability was required for a small number of plans asindicated below. The adjustment in the liability is recorded as a charge or (credit) to Accumulated Other Comprehensive Loss, net of tax, inshareowners’ investment in the consolidated balance sheets.
(dollars in millions)
Years Ended December 31, 2005 2004 2003
Increase (decrease) in minimum liability included in other comprehensive income, before tax $ (59) $ 587 $ (513)
AssumptionsThe weighted-average assumptions used in determining benefit obligations follow:
Pension Health Care and LifeAt December 31, 2005 2004 2005 2004
Discount rate 5.75% 5.75% 5.75% 5.75%Rate of future increases in compensation 4.00 5.00 4.00 4.00
The weighted-average assumptions used in determining net periodiccost follow:
Pension Health Care and LifeYears Ended December 31, 2005 2004 2003 2005 2004 2003
Discount rate 5.75% 6.25% 6.75% 5.75% 6.25% 6.75%Expected return on plan assets 8.50 8.50 8.50 7.75 8.50 8.50Rate of compensation increase 5.00 5.00 5.00 4.00 4.00 4.00
notes to consolidated financial statements continued

notes to consolidated financial statements continued
59
In order to project the long-term target investment return for thetotal portfolio, estimates are prepared for the total return of eachmajor asset class over the subsequent 10-year period, or longer.Those estimates are based on a combination of factors includingthe following: current market interest rates and valuation levels,consensus earnings expectations, historical long-term risk pre-miums and value-added. To determine the aggregate return for thepension trust, the projected return of each individual asset class isthen weighted according to the allocation to that investment area inthe trust’s long-term asset allocation policy.
The assumed Health Care Cost Trend Rates follow:
Health Care and LifeAt December 31, 2005 2004 2003
Health care cost trend rate assumed for next year 10.00% 10.00% 10.00%
Rate to which cost trend rate gradually declines 5.00 5.00 5.00
Year the rate reaches level it is assumed to remain thereafter 2010 2009 2008
Assumed health care trend rates have a significant effect on theamounts reported for the health care plans. A one-percentage-pointchange in the assumed health care cost trend rate would have thefollowing effects:
(dollars in millions)
One-Percentage-Point Increase Decrease
Effect on 2005 total service and interest cost $ 295 $ (232)Effect on postretirement benefit obligation
as of December 31, 2005 3,378 (2,745)
Plan AssetsPension PlansThe weighted-average asset allocations for the pension plans byasset category follow:
At December 31, 2005 2004
Asset CategoryEquity securities 63.4% 63.0%Debt securities 17.5 18.2Real estate 3.2 3.5Other 15.9 15.3Total 100.0% 100.0%
Equity securities include Verizon common stock in the amounts of$72 million (less than 1% of total plan assets) and $121 million (lessthan 1% of total plan assets) at December 31, 2005 and 2004,respectively. Other assets include cash and cash equivalents (pri-marily held for the payment of benefits), private equity andinvestments in absolute return strategies.
Health Care and Life PlansThe weighted-average asset allocations for the other postretirementbenefit plans by asset category follow:
At December 31, 2005 2004
Asset CategoryEquity securities 71.9% 66.7%Debt securities 22.1 25.6Real estate 0.1 0.1Other 5.9 7.6Total 100.0% 100.0%
Equity securities include Verizon common stock in the amounts of $4million (less than 1% of total plan assets) and $8 million (less than 1%of total plan assets) at December 31, 2005 and 2004, respectively.
The portfolio strategy emphasizes a long-term equity orientation,significant global diversification, the use of both public and privateinvestments and professional financial and operational risk controls.Assets are allocated according to a long-term policy neutral positionand held within a relatively narrow and pre-determined range. Bothactive and passive management approaches are used dependingon perceived market efficiencies and various other factors.
Cash FlowsFederal legislation was enacted on April 10, 2004 that providestemporary pension funding relief for the 2004 and 2005 plan years.The legislation replaced the 30-year treasury rate with a higher cor-porate bond rate for determining the current liability. In 2005, wecontributed $744 million to our qualified pension trusts, $108 millionto our nonqualified pension plans and $1,085 million to our otherpostretirement benefit plans. Our estimate of the amount and timingof required qualified pension trust contributions for 2006 is basedon current regulations, including continued pension funding relief,and is approximately $100 million, primarily for the TELPRI plans.We anticipate $145 million in contributions to our non-qualified pen-sion plans in 2006 and $1,180 million to our other postretirementbenefit plans.
Estimated Future Benefit PaymentsThe benefit payments to retirees, which reflect expected futureservice, are expected to be paid as follows:
(dollars in millions)Health Care and Life
Pension Benefits Gross of Medical Subsidy
2006 $ 2,626 $ 1,6792007 2,649 1,7692008 2,607 1,8252009 2,887 1,8532010 3,187 1,9252011 – 2015 17,217 9,651
Medicare Prescription Drug subsidies expected to offset the futureHealth Care and Life benefit payments noted above are as follows:
(dollars in millions)
Health Care and Life
2006 $ 882007 932008 962009 972010 1012011 – 2015 500
Savings Plan and Employee Stock Ownership PlansWe maintain four leveraged employee stock ownership plans(ESOP). Under these plans, we match a certain percentage of eli-gible employee contributions to the savings plans with shares of ourcommon stock from these ESOPs. Common stock is allocated fromall leveraged ESOP trusts based on the proportion of principal andinterest paid on ESOP debt in a year to the remaining principal andinterest due over the term of the debt. The final debt service pay-ments and related share allocations for two of our leveraged ESOPswere made in 2004. At December 31, 2005, the number of unallo-cated and allocated shares of common stock was 5 million and 76
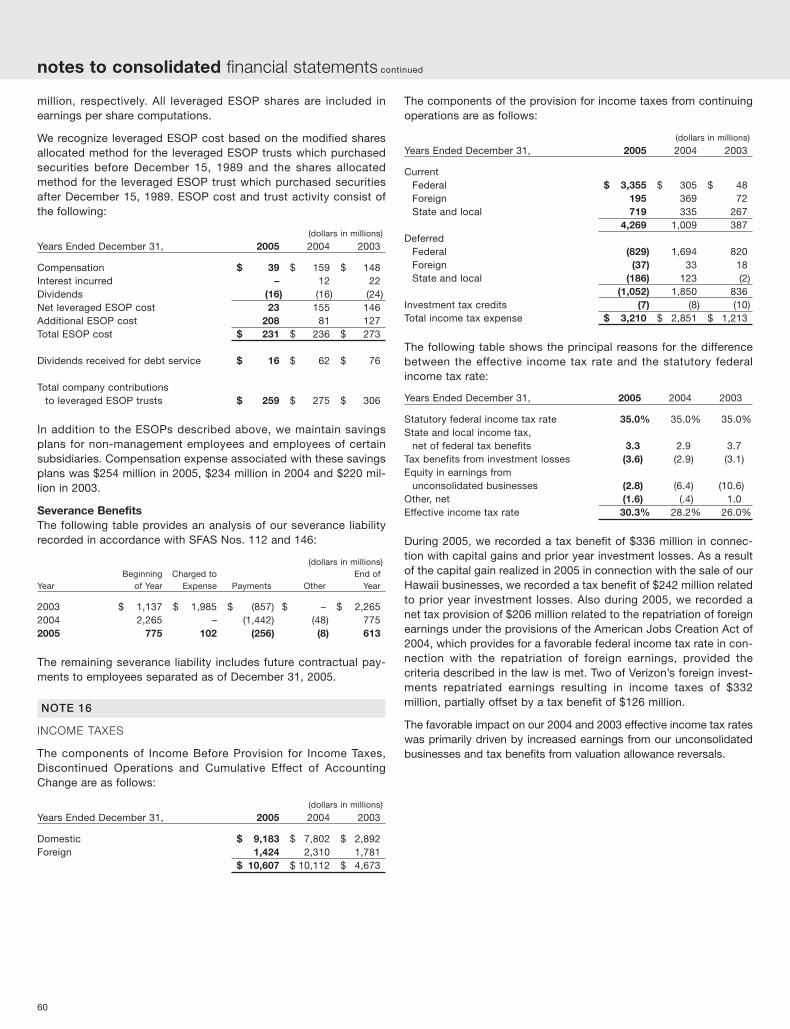
60
million, respectively. All leveraged ESOP shares are included inearnings per share computations.
We recognize leveraged ESOP cost based on the modified sharesallocated method for the leveraged ESOP trusts which purchasedsecurities before December 15, 1989 and the shares allocatedmethod for the leveraged ESOP trust which purchased securitiesafter December 15, 1989. ESOP cost and trust activity consist ofthe following:
(dollars in millions)
Years Ended December 31, 2005 2004 2003
Compensation $ 39 $ 159 $ 148Interest incurred – 12 22Dividends (16) (16) (24)Net leveraged ESOP cost 23 155 146Additional ESOP cost 208 81 127Total ESOP cost $ 231 $ 236 $ 273
Dividends received for debt service $ 16 $ 62 $ 76
Total company contributions to leveraged ESOP trusts $ 259 $ 275 $ 306
In addition to the ESOPs described above, we maintain savingsplans for non-management employees and employees of certainsubsidiaries. Compensation expense associated with these savingsplans was $254 million in 2005, $234 million in 2004 and $220 mil-lion in 2003.
Severance BenefitsThe following table provides an analysis of our severance liabilityrecorded in accordance with SFAS Nos. 112 and 146:
(dollars in millions)Beginning Charged to End of
Year of Year Expense Payments Other Year
2003 $ 1,137 $ 1,985 $ (857) $ – $ 2,2652004 2,265 – (1,442) (48) 7752005 775 102 (256) (8) 613
The remaining severance liability includes future contractual pay-ments to employees separated as of December 31, 2005.
NOTE 16
INCOME TAXES
The components of Income Before Provision for Income Taxes,Discontinued Operations and Cumulative Effect of AccountingChange are as follows:
(dollars in millions)
Years Ended December 31, 2005 2004 2003
Domestic $ 9,183 $ 7,802 $ 2,892Foreign 1,424 2,310 1,781
$ 10,607 $ 10,112 $ 4,673
The components of the provision for income taxes from continuingoperations are as follows:
(dollars in millions)
Years Ended December 31, 2005 2004 2003
CurrentFederal $ 3,355 $ 305 $ 48Foreign 195 369 72State and local 719 335 267
4,269 1,009 387Deferred
Federal (829) 1,694 820Foreign (37) 33 18State and local (186) 123 (2)
(1,052) 1,850 836Investment tax credits (7) (8) (10)Total income tax expense $ 3,210 $ 2,851 $ 1,213
The following table shows the principal reasons for the differencebetween the effective income tax rate and the statutory federalincome tax rate:
Years Ended December 31, 2005 2004 2003
Statutory federal income tax rate 35.0% 35.0% 35.0%State and local income tax,
net of federal tax benefits 3.3 2.9 3.7Tax benefits from investment losses (3.6) (2.9) (3.1)Equity in earnings from
unconsolidated businesses (2.8) (6.4) (10.6)Other, net (1.6) (.4) 1.0Effective income tax rate 30.3% 28.2% 26.0%
During 2005, we recorded a tax benefit of $336 million in connec-tion with capital gains and prior year investment losses. As a resultof the capital gain realized in 2005 in connection with the sale of ourHawaii businesses, we recorded a tax benefit of $242 million relatedto prior year investment losses. Also during 2005, we recorded anet tax provision of $206 million related to the repatriation of foreignearnings under the provisions of the American Jobs Creation Act of2004, which provides for a favorable federal income tax rate in con-nection with the repatriation of foreign earnings, provided thecriteria described in the law is met. Two of Verizon’s foreign invest-ments repatriated earnings resulting in income taxes of $332million, partially offset by a tax benefit of $126 million.
The favorable impact on our 2004 and 2003 effective income tax rateswas primarily driven by increased earnings from our unconsolidatedbusinesses and tax benefits from valuation allowance reversals.
notes to consolidated financial statements continued
notes to consolidated financial statements continued
61
Deferred taxes arise because of differences in the book and taxbases of certain assets and liabilities. Significant components ofdeferred tax liabilities (assets) are shown in the following table:
(dollars in millions)
At December 31, 2005 2004
Depreciation $ 9,445 $ 10,307Employee benefits (1,971) (1,704)Leasing activity 3,001 3,212Loss on investments (369) (752)Wireless joint venture including
wireless licenses 11,786 10,382Uncollectible accounts receivable (406) (501)Other – net (505) (837)
20,981 20,107Valuation allowance 815 1,217Net deferred tax liability $ 21,796 $ 21,324
Net long-term deferred tax liabilities $ 22,411 $ 22,532Less net current deferred tax assets
(in Prepaid Expenses and Other) 511 1,076Less deferred investment tax credit 104 132
Net deferred tax liability $ 21,796 $ 21,324
At December 31, 2005, undistributed earnings of our foreign sub-sidiaries amounted to approximately $3.0 billion. Deferred incometaxes are not provided on these earnings as it is intended that theearnings are indefinitely invested outside of the U.S. It is not prac-tical to estimate the amount of taxes that might be payable uponthe remittance of such earnings.
The valuation allowance primarily represents the tax benefits of cer-tain state net operating loss carry forwards, capital loss carryforwards and other deferred tax assets which may expire withoutbeing utilized. During 2005, the valuation allowance decreased $402million. This decrease primarily relates to the valuation allowancereversals relating to utilizing prior year investment losses to offsetthe capital gains realized on the sale of Hawaii businesses.
NOTE 17
SEGMENT INFORMATION
Reportable SegmentsWe have four reportable segments, which we operate and manageas strategic business units and organize by products and services.We measure and evaluate our reportable segments based on seg-ment income. This segment income excludes unallocated corporateexpenses and other adjustments arising during each period. Theother adjustments include transactions that the chief operatingdecision makers exclude in assessing business unit performancedue primarily to their non-recurring and/or non-operational nature.Although such transactions are excluded from the business seg-ment results, they are included in reported consolidated earnings.Gains and losses that are not individually significant are included inall segment results, since these items are included in the chief oper-ating decision makers’ assessment of unit performance. Thesegains and losses are primarily contained in Information Servicesand International since they actively manage investment portfolios.
Our segments and their principal activities consist of the following:
Domestic TelecomDomestic Telecom provides local telephone services, including voice,DSL, data transport, enhanced and custom calling features, networkaccess, directory assistance, private lines and public telephones in 28states and Washington, D.C. This segment also provides long distanceservices, customer premises equipment distribution, video services, datasolutions and systems integration, billing and collections and inventorymanagement services.
Domestic WirelessDomestic wireless products and services include wireless voice and dataservices and equipment sales across the United States. This segment pri-marily represents the operations of the Verizon Wireless joint venture withVodafone. Verizon owns a 55% interest in the joint venture and Vodafoneowns the remaining 45%. All financial results included in the tables belowreflect the consolidated results of Verizon Wireless.
Information ServicesInformation Services’ multi-platform business comprises yellow pagesdirectories, SuperPages.com, our online directory and search services,and SuperPages On the Go, our directory and information services onwireless telephones. This segment’s operations are principally in theUnited States.
InternationalInternational wireline and wireless communications operations and invest-ments in the Americas and Europe.

The following table provides operating financial information for our four reportable segments:(dollars in millions)
Domestic Domestic Information Total2005 Telecom Wireless Services International Segments
External revenues $ 36,628 $ 32,219 $ 3,452 $ 2,159 $ 74,458Intersegment revenues 988 82 – 34 1,104
Total operating revenues 37,616 32,301 3,452 2,193 75,562Cost of services and sales 15,604 9,393 593 707 26,297Selling, general & administrative expense 8,419 10,768 1,107 675 20,969Depreciation & amortization expense 8,801 4,760 92 340 13,993
Total operating expenses 32,824 24,921 1,792 1,722 61,259Operating income 4,792 7,380 1,660 471 14,303Equity in earnings of unconsolidated businesses – 27 – 807 834Income from other unconsolidated businesses – – – 56 56Other income and (expense), net 79 6 17 259 361Interest expense (1,701) (601) – (127) (2,429)Minority interest – (2,995) (7) (44) (3,046)Provision for income taxes (1,264) (1,598) (626) (171) (3,659)Segment income $ 1,906 $ 2,219 $ 1,044 $ 1,251 $ 6,420Assets $ 75,188 $ 76,729 $ 1,525 $ 11,603 $ 165,045Investments in unconsolidated businesses 2 154 1 2,767 2,924Plant, property and equipment, net 49,618 22,790 166 2,155 74,729Capital expenditures 8,267 6,484 80 283 15,114
2004
External revenues $ 37,160 $ 27,586 $ 3,549 $ 1,982 $ 70,277Intersegment revenues 861 76 – 32 969
Total operating revenues 38,021 27,662 3,549 2,014 71,246Cost of services and sales 14,830 7,747 542 626 23,745Selling, general & administrative expense 8,621 9,591 1,319 471 20,002Depreciation & amortization expense 8,910 4,486 87 324 13,807
Total operating expenses 32,361 21,824 1,948 1,421 57,554Operating income 5,660 5,838 1,601 593 13,692Equity in earnings of unconsolidated businesses – 45 – 1,031 1,076Income from other unconsolidated businesses – – – 31 31Other income and (expense), net 100 11 15 35 161Interest expense (1,602) (661) (33) (85) (2,381)Minority interest – (2,323) (6) (80) (2,409)Provision for income taxes (1,506) (1,265) (609) (300) (3,680)Segment income $ 2,652 $ 1,645 $ 968 $ 1,225 $ 6,490Assets $ 78,824 $ 68,027 $ 1,680 $ 14,885 $ 163,416Investments in unconsolidated businesses 3 148 4 4,914 5,069Plant, property and equipment, net 50,608 20,516 179 2,391 73,694Capital expenditures 7,118 5,633 87 382 13,220
2003
External revenues $ 38,281 $ 22,436 $ 3,763 $ 1,921 $ 66,401Intersegment revenues 774 53 – 28 855
Total operating revenues 39,055 22,489 3,763 1,949 67,256Cost of services and sales 14,512 6,460 554 574 22,100Selling, general & administrative expense 8,363 8,057 1,387 691 18,498Depreciation & amortization expense 9,107 3,888 79 346 13,420Sales of businesses, net – – (141) – (141)
Total operating expenses 31,982 18,405 1,879 1,611 53,877Operating income 7,073 4,084 1,884 338 13,379Equity in earnings (loss) of unconsolidated businesses – 15 (1) 1,091 1,105Income (loss) from other unconsolidated businesses (4) – – 169 165Other income and (expense), net 45 12 7 32 96Interest expense (1,648) (626) (38) (160) (2,472)Minority interest – (1,554) (8) (20) (1,582)Provision for income taxes (2,167) (848) (716) (58) (3,789)Segment income $ 3,299 $ 1,083 $ 1,128 $ 1,392 $ 6,902Assets $ 82,087 $ 65,166 $ 1,726 $ 11,872 $ 160,851Investments in unconsolidated businesses 64 288 4 4,555 4,911Plant, property and equipment, net 53,378 18,998 190 2,164 74,730Capital expenditures 6,820 4,590 74 358 11,842
62
notes to consolidated financial statements continued

notes to consolidated financial statements continued
63
Results of operations for Domestic Telecom and InformationServices exclude the effects of our wireline and directory busi-nesses in Hawaii, including Verizon Hawaii Inc. which operatedapproximately 700,000 switched access lines, as well as the serv-ices and assets of Verizon Long Distance, Verizon Online, VerizonInformation Services and Verizon Select Services in Hawaii (seeNote 3). Financial information for Information Services excludes theeffects of Verizon Information Services Canada (see Note 3).
Corporate, eliminations and other includes unallocated corporateexpenses, intersegment eliminations recorded in consolidation, theresults of other businesses such as lease financing, and assetimpairments and expenses that are not allocated in assessing seg-ment performance due to their non-recurring nature.
We generally account for intersegment sales of products and serv-ices and asset transfers at current market prices. We are notdependent on any single customer.
Geographic AreasOur foreign investments are located principally in the Americas andEurope. Domestic and foreign operating revenues are based on thelocation of customers. Long-lived assets consist of plant, propertyand equipment (net of accumulated depreciation) and investmentsin unconsolidated businesses. The table below presents financialinformation by major geographic area:
(dollars in millions)
Years Ended December 31, 2005 2004 2003
DomesticOperating revenues $ 72,701 $ 69,173 $ 65,303Long-lived assets 74,978 72,668 74,346
ForeignOperating revenues 2,411 2,110 2,165Long-lived assets 4,931 7,311 6,745
ConsolidatedOperating revenues 75,112 71,283 67,468Long-lived assets 79,909 79,979 81,091
Reconciliation To Consolidated Financial InformationA reconciliation of the results for the operating segments to the applicable line items in the consolidated financial statements is as follows:
(dollars in millions)
2005 2004 2003
Operating RevenuesTotal reportable segments $ 75,562 $ 71,246 $ 67,256Hawaii operations 202 595 614Corporate, eliminations and other (652) (558) (402)Consolidated operating revenues – reported $ 75,112 $ 71,283 $ 67,468
Operating ExpensesTotal reportable segments $ 61,259 $ 57,554 $ 53,877Hawaii operations 124 393 478Sales of businesses and investments, net (see Notes 3, 5, and 8) (530) 100 300Severance, pension and benefit charges (see Note 4) 157 815 5,523Verizon Center relocation, net (see Note 4) (18) – –MCI exposure, lease impairment and other special items (see Note 4) 125 (91) 496Corporate, eliminations and other (819) (605) (613)Consolidated operating expenses – reported $ 60,298 $ 58,166 $ 60,061
Net IncomeSegment income – reportable segments $ 6,420 $ 6,490 $ 6,902Sales of businesses and investments, net (see Notes 3, 5 and 8) 336 1,059 44Severance, pension and benefit charges (see Note 4) (95) (499) (3,399)Verizon Center relocation, net (see Note 4) 8 – –MCI exposure, lease impairment and other special items (see Note 4) (133) 2 (419)Iusacell charge (see Note 3) – – (931)Tax benefits (see Note 4) 336 234 –Tax provision on repatriated earnings (see Note 4) (206) – –Income on discontinued operations (see Note 3) – 54 46Cumulative effect of accounting change (see Note 2) – – 503Corporate and other 731 491 331Consolidated net income – reported $ 7,397 $ 7,831 $ 3,077
AssetsTotal reportable segments $ 165,045 $ 163,416 $ 160,851Reconciling items 3,085 2,542 5,117Consolidated assets $ 168,130 $ 165,958 $ 165,968

NOTE 18
COMPREHENSIVE INCOME
Comprehensive income consists of net income and other gains andlosses affecting shareowners’ investment that, under GAAP, areexcluded from net income.
Changes in the components of other comprehensive income (loss),net of income tax expense (benefit), are as follows:
(dollars in millions)
Years Ended December 31, 2005 2004 2003
Foreign Currency Translation Adjustments, net of taxes of $–, $– and $– $ (755) $ 548 $ 568Unrealized Gains (Losses) on Net Investment HedgesUnrealized gains (losses), net of taxes of $1, $(48) and $– 2 (58) –
Less reclassification adjustments for losses realized in net income, net of taxes of $–, $(48) and $– – (58) –
Net unrealized gains on net investment hedges 2 – –Unrealized Derivative Gains (Losses) on Cash Flow HedgesUnrealized gains (losses), net of taxes of $–, $(2) and $(1) 4 (9) 30
Less reclassification adjustments for gains (losses) realized in net income, net of taxes of $(2), $(2) and $(1) (6) (26) 51
Net unrealized derivative gains (losses) on cash flow hedges 10 17 (21)Unrealized Gains (Losses) on Marketable SecuritiesUnrealized gains, net of taxes of $10, $4 and $2 4 8 5
Less reclassification adjustments for gains realized in net income, net of taxes of $14, $1 and $1 25 1 4
Net unrealized gains (losses) on marketable securities (21) 7 1Minimum Pension Liability Adjustment, net of taxes of $25, $(212) and $201 34 (375) 312Other Comprehensive Income (Loss) $ (730) $ 197 $ 860
The foreign currency translation adjustment in 2005 representsunrealized losses from the decline in the functional currencies onour investments in Vodafone Omnitel, Verzion Dominicana, C. por A.(Verizon Dominicana) and CANTV. The foreign currency translationadjustment in 2004 represents unrealized gains from the apprecia-tion of the functional currencies at Verizon Dominicana and ourinvestment in Vodafone Omnitel as well as the reclassification of theforeign currency translation loss in connection with the sale of our20.5% interest in TELUS (see Note 8), partially offset by unrealizedlosses from the decline in the functional currency on our investmentin CANTV. The foreign currency translation adjustment in 2003 isprimarily driven by the impact of the euro on our investment inVodafone Omnitel and a reclassification of the foreign currencytranslation loss of Iusacell of $577 million in connection with thesale of Iusacell (see Note 3), partially offset by unrealized foreigncurrency translation losses at Verizon Dominicana and CANTV.
During 2005, we entered into zero cost euro collars to hedge a por-tion of our net investment in Vodafone Omnitel. As of December 31,2005, our positions in the zero cost euro collars have been settled.During 2004, we entered into foreign currency forward contracts to
hedge our net investment in Verizon Information Services Canadaand TELUS (see Note 12). In connection with the sales of theseinterests in the fourth quarter of 2004, the unrealized losses onthese net investment hedges were realized in net income along withthe corresponding foreign currency translation balance.
The changes in the minimum pension liability in 2005, 2004 and2003 were required by accounting rules for certain pension plansbased on their funded status (see Note 15).
The components of Accumulated Other Comprehensive Loss are as follows:
(dollars in millions)
At December 31, 2005 2004
Foreign currency translation adjustments $ (867) $ (112)Unrealized gains on net investment hedges 2 –Unrealized derivative losses
on cash flow hedges (27) (37)Unrealized gains on marketable securities 10 31Minimum pension liability adjustment (901) (935)Accumulated other comprehensive loss $ (1,783) $ (1,053)
64
notes to consolidated financial statements continued

notes to consolidated financial statements continued
65
NOTE 19
ACCOUNTING FOR THE IMPACT OF THE SEPTEMBER 11,2001 TERRORIST ATTACKS
The primary financial statement impact of the September 11, 2001terrorist attacks pertains to Verizon’s plant, equipment and adminis-trative office space located either in, or adjacent to the World TradeCenter complex, and the associated service restoration efforts. Werecorded insurance recoveries related to the terrorist attacks of$270 million in 2003 and $200 million in 2002, primarily offsettingfixed asset losses and expenses incurred in 2005 and precedingyears. Of the amounts recorded, approximately $130 million in 2003and $112 million in 2002 relate to operating expenses (primarilycost of services and sales) reported in the consolidated statementsof income, and also reported by our Domestic Telecom segment.The costs and estimated insurance recoveries were recorded inaccordance with EITF No. 01-10, “Accounting for the Impact of theTerrorist Attacks of September 11, 2001.” As of December 31,2005, we received insurance proceeds of $849 million.
NOTE 20
ADDITIONAL FINANCIAL INFORMATION
The tables that follow provide additional financial informationrelated to our consolidated financial statements:
Income Statement Information
(dollars in millions)
Years Ended December 31, 2005 2004 2003
Depreciation expense $ 12,519 $ 12,508 $ 12,210Interest expense incurred 2,533 2,561 2,941Capitalized interest (352) (177) (144)Advertising expense 1,914 1,685 1,419
Balance Sheet Information
(dollars in millions)
At December 31, 2005 2004
Accounts Payable and Accrued LiabilitiesAccounts payable $ 2,827 $ 2,827Accrued expenses 3,036 3,071Accrued vacation pay 914 842Accrued salaries and wages 2,390 2,526Interest payable 579 585Accrued taxes 2,605 3,326
$ 12,351 $ 13,177Other Current LiabilitiesAdvance billings and customer deposits $ 1,985 $ 1,899Dividends payable 1,137 1,083Other 2,449 2,852
$ 5,571 $ 5,834
Cash Flow Information
(dollars in millions)
Years Ended December 31, 2005 2004 2003
Cash PaidIncome taxes, net of amounts refunded $ 4,744 $ 597 $ (716)Interest, net of amounts capitalized 2,077 2,723 2,646
Supplemental Investing and Financing TransactionsAssets acquired in business
combinations 635 8 880Liabilities assumed in business
combinations 35 – 13Debt assumed in business
combinations 9 – 4

NOTE 21
GUARANTEES OF OPERATING SUBSIDIARY DEBT
Verizon has guaranteed the following two obligations of indirectwholly owned operating subsidiaries: $480 million 7% debenturesseries B, due 2042 issued by Verizon New England Inc. and $300million 7% debentures series F issued by Verizon South Inc. due2041. These guarantees are full and unconditional and wouldrequire Verizon to make scheduled payments immediately if eitherof the two subsidiaries failed to do so. Both of these securities wereissued in denominations of $25 and were sold primarily to retailinvestors and are listed on the New York Stock Exchange. SECrules permit us to include condensed consolidating financial infor-mation for these two subsidiaries in our periodic SEC reports ratherthan filing separate subsidiary periodic SEC reports.
Below is the condensed consolidating financial information. VerizonNew England and Verizon South are presented in separate columns.The column labeled Parent represents Verizon’s investments in all ofits subsidiaries under the equity method and the Other column rep-resents all other subsidiaries of Verizon on a combined basis. TheAdjustments column reflects intercompany eliminations.
(dollars in millions)Condensed Consolidating Statements of Income Verizon VerizonYear Ended December 31, 2005 Parent New England South Other Adjustments Total
Operating revenues $ – $ 3,936 $ 907 $ 70,766 $ (497) $ 75,112Operating expenses 8 3,628 684 56,475 (497) 60,298Operating Income (Loss) (8) 308 223 14,291 – 14,814Equity in earnings of
unconsolidated businesses 6,698 23 – 276 (6,308) 689Income from other
unconsolidated businesses 35 – – 57 – 92Other income and (expense), net 502 (4) 6 141 (408) 237Interest expense (58) (172) (63) (1,905) 18 (2,180)Minority interest – – – (3,045) – (3,045)Income before provision
for income taxes 7,169 155 166 9,815 (6,698) 10,607Income tax benefit (provision) 228 (40) (62) (3,336) – (3,210)Net Income $ 7,397 $ 115 $ 104 $ 6,479 $ (6,698) $ 7,397
66
notes to consolidated financial statements continued

notes to consolidated financial statements continued
67
(dollars in millions)Condensed Consolidating Statements of Income Verizon VerizonYear Ended December 31, 2004 Parent New England South Other Adjustments Total
Operating revenues $ – $ 3,955 $ 934 $ 66,756 $ (362) $ 71,283Operating expenses 260 3,664 717 53,887 (362) 58,166Operating Income (Loss) (260) 291 217 12,869 – 13,117Equity in earnings of
unconsolidated businesses 7,714 59 – 1,438 (7,520) 1,691Income from other
unconsolidated businesses – – – 75 – 75Other income and (expense), net 171 8 7 38 (202) 22Interest expense (20) (165) (63) (2,144) 8 (2,384)Minority interest – – – (2,409) – (2,409)Income before provision for
income taxes and discontinued operations 7,605 193 161 9,867 (7,714) 10,112
Income tax benefit (provision) 229 (50) (34) (2,996) – (2,851)Income Before Discontinued
Operations 7,834 143 127 6,871 (7,714) 7,261Gain (loss) on discontinued
operations, net of tax (3) – – 573 – 570Net Income $ 7,831 $ 143 $ 127 $ 7,444 $ (7,714) $ 7,831
(dollars in millions)Condensed Consolidating Statements of Income Verizon VerizonYear Ended December 31, 2003 Parent New England South Other Adjustments Total
Operating revenues $ – $ 4,102 $ 951 $ 62,692 $ (277) $ 67,468Operating expenses 562 4,148 808 54,820 (277) 60,061Operating Income (Loss) (562) (46) 143 7,872 – 7,407Equity in earnings (loss)
of unconsolidated businesses 3,176 (42) – 1,272 (3,128) 1,278Income (loss) from other
unconsolidated businesses (10) – – 341 – 331Other income and (expense), net 75 (1) 2 (3) (36) 37Interest expense (78) (160) (64) (2,483) (12) (2,797)Minority interest – – – (1,583) – (1,583)Income (loss) before provision for
income taxes, discontinued operations and cumulative effect of accounting change 2,601 (249) 81 5,416 (3,176) 4,673
Income tax benefit (provision) 476 82 (32) (1,739) – (1,213)Income (Loss) Before Discontinued
Operations And Cumulative Effect Of Accounting Change 3,077 (167) 49 3,677 (3,176) 3,460
Loss on discontinued operations, net of tax – – – (886) – (886)Cumulative effect of accounting
change, net of tax – 369 47 87 – 503Net Income $ 3,077 $ 202 $ 96 $ 2,878 $ (3,176) $ 3,077

(dollars in millions)Condensed Consolidating Balance Sheets Verizon VerizonAt December 31, 2005 Parent New England South Other Adjustments Total
Cash $ – $ – $ – $ 776 $ – $ 776Short-term investments – 216 32 2,250 – 2,498Accounts receivable, net 20 910 142 9,429 (1,330) 9,171Other current assets 9,365 166 185 3,784 (9,497) 4,003
Total current assets 9,385 1,292 359 16,239 (10,827) 16,448Plant, property and equipment, net 1 6,146 1,158 68,000 – 75,305Investments in unconsolidated businesses 32,593 116 – 10,017 (38,122) 4,604Other assets 532 472 390 70,609 (230) 71,773Total Assets $ 42,511 $ 8,026 $ 1,907 $ 164,865 $ (49,179) $ 168,130
Debt maturing within one year $ 22 $ 471 $ – $ 16,452 $ (9,804) $ 7,141Other current liabilities 2,511 1,049 176 15,209 (1,023) 17,922
Total current liabilities 2,533 1,520 176 31,661 (10,827) 25,063Long-term debt 92 2,702 901 28,404 (230) 31,869Employee benefit obligations 205 1,892 254 16,468 – 18,819Deferred income taxes – 537 220 21,654 – 22,411Other liabilities 1 146 27 3,360 – 3,534Minority interest – – – 26,754 – 26,754Total shareowners’ investment 39,680 1,229 329 36,564 (38,122) 39,680Total Liabilities and Shareowners’
Investment $ 42,511 $ 8,026 $ 1,907 $ 164,865 $ (49,179) $ 168,130
(dollars in millions)Condensed Consolidating Balance Sheets Verizon VerizonAt December 31, 2004 Parent New England South Other Adjustments Total
Cash $ – $ – $ – $ 2,290 $ – $ 2,290Short-term investments – 187 33 2,037 – 2,257Accounts receivable, net 6 913 151 9,751 (1,020) 9,801Other current assets 7,632 151 123 4,985 (7,760) 5,131
Total current assets 7,638 1,251 307 19,063 (8,780) 19,479Plant, property and equipment, net 1 6,444 1,204 66,475 – 74,124Investments in unconsolidated businesses 32,191 116 – 9,639 (36,091) 5,855Other assets 408 488 374 65,460 (230) 66,500Total Assets $ 40,238 $ 8,299 $ 1,885 $ 160,637 $ (45,101) $ 165,958
Debt maturing within one year $ 31 $ 168 $ – $ 11,222 $ (7,828) $ 3,593Other current liabilities 2,372 1,217 181 16,718 (952) 19,536
Total current liabilities 2,403 1,385 181 27,940 (8,780) 23,129Long-term debt 113 2,966 901 31,924 (230) 35,674Employee benefit obligations 160 1,940 235 15,606 – 17,941Deferred income taxes – 571 249 21,712 – 22,532Other liabilities 2 253 34 3,780 – 4,069Minority interest – – – 25,053 – 25,053Total shareowners’ investment 37,560 1,184 285 34,622 (36,091) 37,560Total Liabilities and Shareowners’
Investment $ 40,238 $ 8,299 $ 1,885 $ 160,637 $ (45,101) $ 165,958
68
notes to consolidated financial statements continued

notes to consolidated financial statements continued
69
(dollars in millions)Condensed Consolidating Statements of Cash Flows Verizon VerizonYear Ended December 31, 2005 Parent New England South Other Adjustments Total
Net cash from operating activities $ 7,605 $ 831 $ 284 $ 20,229 $ (6,937) $ 22,012Net cash from investing activities (913) (784) (221) (16,343) (231) (18,492)Net cash from financing activities (6,692) (47) (63) (5,400) 7,168 (5,034)Net Decrease in Cash $ – $ – $ – $ (1,514) $ – $ (1,514)
(dollars in millions)Condensed Consolidating Statements of Cash Flows Verizon VerizonYear Ended December 31, 2004 Parent New England South Other Adjustments Total
Net cash from operating activities $ 6,650 $ 1,219 $ 282 $ 20,133 $ (6,464) $ 21,820Net cash from investing activities – (655) (75) (9,559) (54) (10,343)Net cash from financing activities (6,650) (564) (207) (8,953) 6,518 (9,856)Net Increase in Cash $ – $ – $ – $ 1,621 $ – $ 1,621
(dollars in millions)Condensed Consolidating Statements of Cash Flows Verizon VerizonYear Ended December 31, 2003 Parent New England South Other Adjustments Total
Net cash from operating activities $ 8,763 $ 1,304 $ 283 $ 20,630 $ (8,513) $ 22,467Net cash from investing activities – (628) (229) (11,506) 127 (12,236)Net cash from financing activities (8,763) (676) (54) (9,852) 8,386 (10,959)Net Decrease in Cash $ – $ – $ – $ (728) $ – $ (728)
70
There are also litigation matters associated with the Hicksville siteprimarily involving personal injury claims in connection with allegedemissions arising from operations in the 1950s and 1960s at theHicksville site. These matters are in various stages, and no trial datehas been set.
In connection with the execution of agreements for the sales ofbusinesses and investments, Verizon ordinarily provides represen-tations and warranties to the purchasers pertaining to a variety ofnonfinancial matters, such as ownership of the securities beingsold, as well as financial losses.
Subsequent to the sale of Verizon Information Services Canada (seeNote 3), our Information Services segment continues to provide aguarantee to publish directories, which was issued when the direc-tory business was purchased in 2001 and had a 30-year term(before extensions). The preexisting guarantee continues, withoutmodification, following the sale of Verizon Information ServicesCanada. The possible financial impact of the guarantee, which isnot expected to be adverse, cannot be reasonably estimated sincea variety of the potential outcomes available under the guaranteeresult in costs and revenues or benefits that may offset. In addition,performance under the guarantee is not likely.
As of December 31, 2005, letters of credit totaling $140 million hadbeen executed in the normal course of business, which support sev-eral financing arrangements and payment obligations to third parties.
We have several commitments primarily to purchase network serv-ices, equipment and software from a variety of suppliers totaling $669million. Of this total amount, $486 million, $110 million, $41 million,$18 million, $4 million and $10 million are expected to be purchasedin 2006, 2007, 2008, 2009, 2010 and thereafter, respectively.
Several state and federal regulatory proceedings may require ourtelephone operations to pay penalties or to refund to customers aportion of the revenues collected in the current and prior periods.There are also various legal actions pending to which we are a partyand claims which, if asserted, may lead to other legal actions. Wehave established reserves for specific liabilities in connection withregulatory and legal actions, including environmental matters, thatwe currently deem to be probable and estimable. We do not expectthat the ultimate resolution of pending regulatory and legal mattersin future periods, including the Hicksville matters described below,will have a material effect on our financial condition, but it couldhave a material effect on our results of operations.
During 2003, under a government-approved plan, remediationcommenced at the site of a former Sylvania facility in Hicksville,New York that processed nuclear fuel rods in the 1950s and 1960s.Remediation beyond original expectations proved to be necessaryand a reassessment of the anticipated remediation costs was con-ducted. A reassessment of costs related to remediation efforts atseveral other former facilities was also undertaken. As a result, anadditional environmental remediation expense of $240 million wasrecorded in Selling, General and Administrative Expense in theconsolidated statements of income in 2003, for remedial activitieslikely to take place over the next several years. In September 2005,the Army Corps of Engineers (ACE) accepted the Hicksville siteinto the Formerly Utilized Sites Remedial Action Program. This mayresult in the ACE performing some or all of the remediation effortfor the Hicksville site with a corresponding decrease in costs toVerizon. To the extent that the ACE assumes responsibility forremedial work at the Hicksville site, an adjustment to this reservemay be made. Adjustments may also be made based upon actualconditions discovered during the remediation at any of the sitesrequiring remediation.
NOTE 22
COMMITMENTS AND CONTINGENCIES
notes to consolidated financial statements continued

notes to consolidated financial statements continued
71
NOTE 23
QUARTERLY FINANCIAL INFORMATION (UNAUDITED)
(dollars in millions, except per share amounts)
Income Before Discontinued Operations
Operating Operating Per Share- Per Share-Quarter Ended Revenues Income Amount Basic Diluted Net Income
2005March 31 $ 18,179 $ 3,382 $ 1,757 $ .63 $ .63 $ 1,757June 30(a) 18,569 4,092 2,113 .76 .75 2,113September 30(b) 19,038 3,633 1,869 .68 .67 1,869December 31 19,326 3,707 1,658 .60 .59 1,658
2004March 31(c) $ 17,056 $ 2,466 $ 1,183 $ .43 $ .42 $ 1,199June 30 17,758 3,701 1,782 .64 .64 1,797September 30 18,206 3,597 1,779 .64 .64 1,796December 31(d) 18,263 3,353 2,517 .91 .90 3,039
(a) Results of operations for the second quarter of 2005 include a $336 million net after-tax gain on the sale of our wireline and directory businesses in Hawaii, tax benefits of
$242 million associated with prior investment losses and a net tax provision of $232 million related to the repatriation of foreign earnings under the provisions of the
American Jobs Creation Act of 2004.
(b) Results of operations for the third quarter of 2005 include an impairment charge of $125 million pertaining to our leasing operations for airplanes leased to airlines experi-
encing financial difficulties.
(c) Results of operations for the first quarter of 2004 include a $446 million after-tax charge for severance and related pension settlement benefits.
(d) Results of operations for the fourth quarter of 2004 include a $500 million net after-tax gain on the sale of an investment and $234 million of tax benefits associated with
prior investment losses.
Income before discontinued operations per common share is computed independently for each quarter and the sum of the quarters may not equal the annual amount.
MCI MergerOn February 14, 2005, Verizon announced that it had agreed toacquire MCI for a combination of Verizon common shares and cash(including MCI dividends). On May 2, 2005, Verizon announced thatit agreed with MCI to further amend its agreement to acquire MCIfor cash and stock of at least $26.00 per share, consisting of cashof $5.60, which was paid as a special dividend by MCI on October27, 2005, after the October 6, 2005 approval of the transaction byMCI shareholders, plus the greater of .5743 Verizon shares for eachMCI common share or a sufficient number of Verizon shares todeliver to shareholders $20.40 of value. Under this price protectionfeature, Verizon had the option of paying additional cash instead ofissuing additional shares over the .5743 exchange ratio. This con-sideration was subject to adjustment at closing and may have beendecreased based on MCI’s bankruptcy claims-related experienceand international tax liabilities. The merger received the requiredstate, federal and international regulatory approvals by year-end2005, and on January 6, 2006, Verizon and MCI closed the merger.
Under terms of the merger agreement, MCI shareholders received.5743 shares of Verizon and cash for each of their MCI shares.Verizon elected to make a supplemental cash payment of $2.738per MCI share, $779 million in the aggregate, rather than issue addi-tional shares of Verizon common stock, so that the mergerconsideration was equal to at least $20.40 per MCI share. Verizonand MCI management mutually agreed that there was no purchaseprice adjustment related to the amount of MCI’s bankruptcy claims-related experience and international tax liabilities.
Redemption of MCI DebtOn January 17, 2006, Verizon announced offers to purchase twoseries of MCI senior notes, MCI $1,983 million aggregate principalamount of 6.688% Senior Notes Due 2009 and MCI $1,699 millionaggregate principal amount of 7.735% Senior Notes Due 2014, at101% of their par value. Due to the change in control of MCI thatoccurred in connection with the merger with Verizon on January 6,2006, Verizon is required to make this offer to noteholders within 30days of the closing of the merger of MCI and Verizon. Separately,Verizon notified noteholders that MCI is exercising its right toredeem both series of Senior Notes prior to maturity under theoptional redemption procedures provided in the indentures. The6.688% Notes were redeemed on March 1, 2006, and the 7.735%Notes were redeemed on February 16, 2006.
In addition, on January 20, 2006, Verizon announced an offer torepurchase MCI $1,983 million aggregate principal amount of5.908% Senior Notes Due 2007 at 101% of their par value. OnFebruary 21, 2006, $1,804 million of these notes were redeemed byVerizon. Verizon satisfied and discharged the indenture governingthis series of notes shortly after the close of the offer for thosenoteholders who did not accept this offer.
Issuance of DebtIn February 2006, Verizon issued $4,000 million of floating rate andfixed rate notes maturing from 2007 through 2035.
NOTE 24
SUBSEQUENT EVENTS (UNAUDITED)

72
board of directorscorporate officers andexecutive leadership
James R. BarkerChairmanThe Interlake Steamship Co. andNew England Fast Ferry Co.and Vice ChairmanMormac Marine Group, Inc. andMoran Towing Corporation
Richard L. CarriónChairman, President andChief Executive OfficerPopular, Inc.and Chairman andChief Executive OfficerBanco Popular de Puerto Rico
Robert W. LaneChairman and Chief Executive OfficerDeere & Company
Sandra O. MoosePresidentStrategic Advisory Services LLC
Joseph NeubauerChairman and Chief Executive OfficerARAMARK Corporation
Donald T. NicolaisenFormer Chief AccountantUnited States Securities and Exchange Commission
Thomas H. O’BrienRetired Chairman and Chief ExecutiveOfficerThe PNC Financial Services Group, Inc.and PNC Bank, N.A.
Clarence Otis, Jr.Chairman and Chief Executive OfficerDarden Restaurants, Inc.
Hugh B. PriceSenior FellowBrookings Institution
Ivan G. SeidenbergChairman and Chief Executive OfficerVerizon Communications Inc.
Walter V. ShipleyRetired ChairmanThe Chase Manhattan Corporation
John R. StaffordRetired Chairman of the BoardWyeth
Robert D. StoreyRetired PartnerThompson Hine LLP
Ivan G. SeidenbergChairman andChief Executive Officer
Lawrence T. Babbio, Jr.Vice Chairman and President – Domestic Telecom
Dennis F. StriglExecutive Vice President and President and Chief Executive Officer –Verizon Wireless
Doreen A. TobenExecutive Vice President andChief Financial Officer
William P. BarrExecutive Vice President andGeneral Counsel
John W. DiercksenExecutive Vice President –Strategy, Development and Planning
Marc C. ReedExecutive Vice President –Human Resources
Thomas J. TaukeExecutive Vice President – Public Affairs, Policy and Communications
Thomas A. BartlettSenior Vice President and Controller
Marianne DrostSenior Vice President, Deputy GeneralCounsel and Corporate Secretary
Ronald H. LatailleSenior Vice President – Investor Relations
Joleen D. ModenSenior Vice President – Internal Auditing
Catherine T. WebsterSenior Vice President and Treasurer
Katherine J. HarlessPresident – Information Services
Daniel S. MeadPresident – Verizon Services
Daniel C. PetriPresident – International

Registered Shareowner ServicesQuestions or requests for assistance regarding changes to ortransfers of your registered stock ownership should be directedto our transfer agent, Computershare Trust Company, N.A. at:
Verizon Communications Shareowner Servicesc/o ComputershareP.O. Box 43005Providence, RI 02940-3005Phone: 800 631-2355Website: www.verizon.equiserve.comEmail: [email protected]
Persons outside the U.S. may call: 781 575-3994
Persons using a telecommunications device for the deaf (TDD)may call: 800 524-9955
On-line Account Access – Registered shareowners can viewaccount information on-line at: www.verizon.equiserve.com
You will need your account number, a password and taxpayeridentification number to enroll. For more information, contactComputershare.
Electronic Delivery of Proxy Materials – Registered share-owners can receive their Annual Report, Proxy Statement andProxy Card on-line, instead of receiving printed materials by mail.Enroll at www.verizon.equiserve.com
Direct Dividend Deposit Service – Verizon offers an electronicfunds transfer service to registered shareowners wishing todeposit dividends directly into savings or checking accounts ondividend payment dates. For more information, contactComputershare.
Direct Invest Stock Purchase and Ownership Plan – Verizonoffers a direct stock purchase and share ownership plan. Theplan allows current and new investors to purchase commonstock and to reinvest the dividends toward the purchase of addi-tional shares. To receive a Plan Prospectus and enrollment form,contact Computershare or visit their website.
Corporate GovernanceVerizon’s Corporate Governance Guidelines are available on our website – www.verizon.com/investor
If you would prefer to receive a printed copy in the mail, pleasecontact the Assistant Corporate Secretary:
Verizon Communications Inc.Assistant Corporate Secretary140 West Street, 29th FloorNew York, NY 10007
Equal Opportunity PolicyThe company maintains a long-standing commitment to equalopportunity and valuing the diversity of its employees, suppliersand customers. Verizon is fully committed to a workplace freefrom discrimination and harassment for all persons, withoutregard to race, color, religion, age, gender, national origin, sexualorientation, marital status, citizenship status, veteran status, dis-ability or other protected classifications.
Investor ServicesInvestor Website – Get company information and news on ourwebsite – www.verizon.com/investor
VZ Mail – Get the latest investor information delivered directly toyour computer desktop. Subscribe to VzMail at our investor infor-mation website.
Stock Market InformationShareowners of record at December 31, 2005: 947,767
Verizon is listed on the New York Stock Exchange (ticker symbol: VZ)
Also listed on the Philadelphia, Boston, Chicago, Pacific, London,Swiss, Amsterdam and Frankfurt exchanges.
Common Stock Price and Dividend InformationCash
Market Price DividendHigh Low Declared
2005First Quarter $ 41.06 $ 34.38 $ 0.405Second Quarter 36.25 33.71 0.405Third Quarter 34.97 31.65 0.405Fourth Quarter 32.78 29.13 0.405
2004First Quarter $ 39.54 $ 35.08 $ 0.385Second Quarter 38.20 34.25 0.385Third Quarter 41.01 34.13 0.385Fourth Quarter 42.27 38.26 0.385
Form 10–KTo receive a copy of the 2005 Verizon Annual Report on Form10-K, which is filed with the Securities and ExchangeCommission, contact Investor Relations:
Verizon Communications Inc.Investor RelationsOne Verizon WayBasking Ridge, NJ 07920Phone: 212 395-1525
Certifications Regarding Public Disclosures & ListingStandards
The 2005 Verizon Annual Report on Form 10-K filed withthe Securities and Exchange Commission includes thecertifications required by Section 302 of the Sarbanes-Oxley Act regarding the quality of the company’s publicdisclosure. In addition, the annual certification of the chiefexecutive officer regarding compliance by Verizon with thecorporate governance listing standards of the New YorkStock Exchange was submitted without qualification following the 2005 annual meeting of shareholders.
investor information

Verizon Communications Inc.140 West StreetNew York, New York 10007212 395-1000
Printed on recycled paper
verizon.com
©2006. Verizon. All Rights Reserved.002CS-10422