Embed Size (px)
Citation preview

Ventilation rates in schools
Article
Accepted Version
Clements-Croome, D. J., Awbi, H. B., Bako-Biro, Z., Kochhar, N. and Williams, M. (2008) Ventilation rates in schools. Building and Environment, 43 (3). pp. 362-367. ISSN 0360-1323 doi: https://doi.org/10.1016/j.buildenv.2006.03.018 Available at http://centaur.reading.ac.uk/14118/
It is advisable to refer to the publisher’s version if you intend to cite from the work. See Guidance on citing .
To link to this article DOI: http://dx.doi.org/10.1016/j.buildenv.2006.03.018
Publisher: Elsevier
All outputs in CentAUR are protected by Intellectual Property Rights law, including copyright law. Copyright and IPR is retained by the creators or other copyright holders. Terms and conditions for use of this material are defined in the End User Agreement .
www.reading.ac.uk/centaur

CentAUR
Central Archive at the University of Reading
Reading’s research outputs online

1
Ventilation rates in schools and pupils’ performance
Zs. Bakó-Birób, D.J. Clements-Croomea,*, N. Kochhara, H.B. Awbia, M.J. Williamsc
a The University of Reading School of Construction Management and
Engineering, United Kingdom
b Monodraught Ltd, United Kingdom
c The University of Reading Department of Psychology, United Kingdom
Corresponding author, E-mail address: [email protected] (D.J. Clements-Croome).
Abstract
This paper is a development of our earlier work [5,6,11]. The effects of classroom
ventilation on pupils’ performance were investigated in 8 primary schools in England.
In each school the concentrations of carbon dioxide and other parameters were
monitored for three weeks in two selected classrooms. In 16 classrooms
interventions were made to improve the ventilation rate and maintain the
temperature within an acceptable range using a purpose-built portable mechanical
ventilation system. As a result of the interventions the provision of outdoor air to the
classrooms was improved from the prevailing levels of about 1 l/s per person to
about 8 l/s per person.
The pupils and teachers in the classrooms studied were usually exposed to
unacceptably poor air quality conditions, with CO2 concentrations of up to 5000
ppm, much higher than the average recommended levels of 1500 ppm and the
preferred level of 1000 ppm.
The results of computerized performance tasks performed by more than 200 pupils
showed significantly faster and more accurate responses for Choice Reaction (by
2.2%), Colour Word Vigilance (by 2.7%), Picture Memory (by 8%) and Word
Recognition (by 15%) at the higher ventilation rates compared with the low
ventilation conditions.
The present investigation provides strong evidence that low ventilation rates in
classrooms significantly reduce pupils’ attention and vigilance, and negatively affect
memory and concentration. The physical environment therefore affects teaching and
learning.

1. Background
Schools in the UK house about 10 million pupils [14,15] who spend almost 30% of their
life in schools and about 70% of their time inside a classroom during school days. As such,
classrooms are the second most important indoor environment for children, after their
homes, where they are exposed to various airborne pollutants to a much greater extent
than outdoors. Compared to adults, children are more vulnerable to environmental
pollutants as they breathe more, relative to their body weight, and are also less well
able to deal with toxic chemicals [17,32].
Former reviews on the subject of school environments indicated that ventilation is
often inadequate in classrooms, causing an increased risk for asthma and other health
related symptoms among school children [13,25]. Actions have been proposed for
existing and future school buildings to include adequate outdoor ventilation, control of
moisture, and avoidance of indoor exposures to pollutants such as microbiological
particles, allergens and chemical substances which are considered likely to have adverse
effects.
The current ventilation standards and guidelines [2,3,9] recommend a minimum
ventilation rate of 8 l/s per person in all teaching facilities. Building Bulletin 101 (2006)
[8] (the UK Regulatory Framework for schools), the European Standard pr EN15251 (not
specifically for schools but the monitoring approach here aligns with its
recommendations which are also confirmed in the work of [7]) and REHVA Guidebook
13 [1], refer to proposed performancebased standards limiting the level of carbon
dioxide (CO2) concentration to 1500 ppm over a full school day from 9:00 to 15:30 and
specify a minimum ventilation rate of 3 l/s per person in all teaching and learning
spaces when they are occupied. Furthermore, a ventilation rate of 8 l/s per person
should be achievable under the control of occupants, although it may not be required
at all times if the occupancy density decreases.
A number of studies have also reported that ventilation rates in schools are often
substandard, and it is not unusual to find CO2 levels above 3000 ppm in classrooms
[16,24]. The quality of the classroom environment not only affects health and comfort
([26,35]; Norbäck and Nordström, 2008), but it may also impair the learning performance of
pupils. Following earlier studies which indicated such a correlation [27,31], there is growing
evidence to show that impairment of learning performance and increased absenteeism are
partly due to inadequate ventilation and unsuitable thermal conditions in classrooms
[7,12,18,27,29,30,33,34].
Coley and Greeves (2007) [7] carried out a study on how ventilation rates affect
cognitive performance in a primary school and reported in their words: "The effects are
best characterised by the power of attention factor which represents the intensity of
concentration at a particular moment with faster responses reflecting higher levels of
focused attention. Increased levels of CO2 from a mean of 690 ppm to a mean of 2909 ppm

3
lead to a detriment in power of attention of about 5%."
Satish et al. (2011) [29] tested the effects of CO2 levels on decision making and concluded
that at levels of 2500 ppm and even lower the performance of decision making becomes
marginal and in some cases dysfunctional. This work is very interesting as it was carried out
by an interdisciplinary team which included people with environmental, medical and
management skills and has implications for all buildings [29]. The evidence is growing which
suggests that more generally we need to increase public awareness about limiting CO2 levels
in buildings and also on transport systems so promoting freshness and so creating less
fatiguing air environments in which we live and work.
On the other hand, achieving adequate ventilation to provide a healthy and comfortable
classroom environment without impairing the learning performance of children has
inevitable implications for the energy performance of school buildings. It is a delicate
balance for every building designer to ensure that the design meets both ventilation and
energy performance requirements. However, apart from achieving the ventilation criteria
there also seems to be a large difference between the intended (designed) levels of energy
performance and the actual performance in use. According to LessEn (an initiative of the
international Urban Land Institute), which issued a league table in 2010 showing the energy
efficiency of local authority schools in the UK, of 11,993 schools, only 29 had the top energy
rating whilst 1703 had the lowest.
Whilst recognising the importance of creating a low carbon economy, this must not
be achieved at the expense of neglecting human needs. Schools are for teaching and
learning and if these are impaired by poor environmental conditions, then these cannot
be considered as sustainable, irrespective of their energy performance.
2. Aims and objectives
The purpose of the research was to establish a direct link between pupils’ health,
well-being and cognitive performance, and the indoor air quality in a sample of primary
school classrooms near Reading in the UK and to examine the suitability of the air quality
guidelines.
This paper focuses on the indoor air quality in classrooms by using CO2 as an indicator of
ventilation and shows how it affects the performance of mental tasks using in-situ direct
measurements.
3. Methods
The field surveys were completed over a period, starting in February, 2006 to 2008.
The measurements were carried out in eight schools (referred as S1-S8 from hereon),
during winter (S1, S7), spring (S2, S8), early summer (S3, S4) and autumn (S5, S6). All
schools were built in the last 20e40 years. Except for one school, none had a mechanical
ventilation system; in most schools staff had no control over the temperature. At each

selected school, investigations were carried out in two classrooms for at least three
consecutive weeks. The first week was reserved for monitoring the classroom conditions
without modifying any of the indoor climatic parameters, and to familiarise the children
with the performance tests. During the second and third weeks, a purpose-built mobile
ventilation system was installed in each classroom to control the ventilation rate and
maintain the temperature within certain limits. The system was set either to provide
outdoor air or to re-circulate the classroom air. Although the ventilation system was
visible, the staff and the children were not informed about whether it was providing
fresh air or re-circulated air. The order of provision of fresh air/re-circulated air
conditions was made in a cross-over repeated-measures design for the two classrooms;
order of presentation of the two ventilation conditions in the weeks two and three was
balanced within the two classrooms in a school and across all schools.
The ventilation system consisted of an exterior fan placed outdoors; a ductwork with a
diameter of 200 mm supplied the air into the building through window openings, which
were covered with Perspex plates and cut to connect to the ducts (Fig. 1).
In the classrooms, the air was distributed using Softflo air terminal units, which consist
of a perforated duct with small nozzles creating confluent jets flowing into the room [10].
The temperature of the supply air was controlled by means of a duct heater (3 kW) and a
mobile air conditioning unit of 2.7 kW connected to the ventilation system. The capacity
of the supply fan was selected to provide 200 l/s, matching the prescribed level of 8 l/s
per person in a classroom holding, on average, 25 children. Sound attenuators were also
built into the system upstream and down- stream of the fan to reduce the
soundbreakout from the ductwork into the classroom. The rating for the AC unit was
based on the thermal performance of a typical classroom; the classrooms were all
similar in size and construction.
Fig. 1. Exterior fan of the mobile ventilation system (a); testing area with the measuring trolley in the background (b) and air terminal device (c).


The mobile ventilation system was fully developed only after the measurements in the
third school had been completed. Therefore in the first three schools the ventilation
system was used only to supply the outdoor air to the classrooms in a controlled
manner; the low ventilation condition was obtained with the windows closed. The
maximum concentration of CO2 in the re-circulated conditions never exceeded that
normally occurring in the classrooms prior to the interventions. During experiments, the
teachers and pupils were allowed to open the windows whenever they needed to,
without any encouragement or hindrance by the investigators. The open/closed state of
windows and classroom doors was monitored by state loggers.
Physical measurements: CO2 concentration (Vaisala GMP222; 0-5000 ppm ± 20 ppm
and ±2% of reading), air temperature, relative humidity (RH) (Eltek GD-10; +5-40o C ±
0.4 K; 10%-90%, ±2%), globe temperature (diam 36 mm, probe thermistor; -50 to +150o C
± 0.1 K), air velocity (Accusense AVS, 0-1 m/s, ± 5% of range) and light level (Skye Instr.
SL15 0e4000lx ± 3% of range) were continuously monitored in each classroom and
recorded at 3-min intervals on a central logger (Eltek Squirrel) using a wireless data
transmission technique. These sensors were fixed on a trolley (Fig. 1b) and placed close
to the testing area in the classrooms. In addition three thermistor type temperature
probes were distributed on a vertical pole fixed to the trolley to record differences in
temperature between the pupils’ head and foot levels. Separate units were placed
outdoors and in the corridors to measure CO2 concentration, temperature and RH. The
corridor units were providing information about the immediate vicinity of the measured
classes but generally there was little risk of cross contamination from corridors as doors
were closed for most of the time. The amount of supplied air to the classrooms was
measured with Venturi flow metres built into the duct system downstream of the fan. The
ventilation rate measurements were conducted using the tracer gas decay method
(Brüel&Kjaer Multi-Gas monitor Innova Type 1302) with SF6 as tracer gas (photoacustic
detection limit 0.006 ppm SF6). This tracer gas was selected due to the availability of
instrumentation. The measurements took place during school breaks in unoccupied
classrooms in schools 5e8. The monitoring procedures were compatible with ISO-16000-1.
Subjective evaluations: Simultaneous to the physical monitoring, measures of self-
assessed environmental perception, comfort and health were obtained immediately after
the performance tests had been carried out. The pupils were asked to complete a simple
questionnaire about the classroom environment, thermal sensation, mood, Sick Building
Syndrome (SBS) symptoms and life style, such as level of hunger and quality of sleep during
the previous night, factors which are believed to affect concentration and, hence, task
performance. The majority of the assessments were made on Visual Analogue scales
consisting of a continuous horizontal line with statements at the two endpoints [23] and
thermal sensation was recorded on a 7-point PMV scale [4]. With few exceptions, all pupils
participated in the testing. The targeted age group of the children was between 9 and 10
years attending Year 5. This age group of pupils was selected because they remain in their
classrooms, and are therefore in the same environment, throughout a school day.

7
New software - VISCoPe (Ventilation in Schools and Cognitive Performance) was
developed for these tests which uses algorithms that are based on the work of [19] in order
to assess changes in pupils’ cognitive performance under different air quality conditions in
classrooms. The test was designed using a flexible approach to allow pupils some control in
conducting it. The test battery included 9 different tests: Simple Reaction Time (RT), Choice
RT, Colour Word Vigilance, Addition RT, Digit Span Memory, Digit Classification, Digit-
Symbol Matching, Picture Memory and Word recognition.
The VISCoPe tests are described, in their order of presentation in Table 1. These tests were
conducted on laptops set up in the classroom, using a method similar to that of [7]. The
pupils interacted with the software on a standard numerical keypad.
Table 1 Description of VISCoPe tests in their order of presentation.
Tests were completed during the lessons at a time arranged with the teacher (which
was often before the lunch break). By the time the testing commenced, the CO2
concentrations had reached steady state level with increased ventilation or the higher
end of the achievable CO2 level of the teaching session with re-circulated ventilation.
The computer tests lasted for 20 min and were conducted consecutively with 3-4
groups, each including up to 8 children. Overall, 53 groups of children were tested in the
8 schools, and valid data was obtained from 332 children, participating in both test
conditions. During the two testing weeks the performance tasks were carried out on the
same weekday and during the same time period for each group of children. A
Performance Index (PI) was computed to reflect the error-free reaction time, i.e. the
mean processing/reaction time of valid answers divided by the accuracy of responses
within a task. Thus a high error rate would increase PI value, the time needed to provide
accurate answers.
Since the absolute measures of the individual tasks are at different levels it was
convenient to show the performance data on a relative scale, where the performance

indicator for each task is averaged across the conditions. Consequently, the performance
result of the two experimental conditions can be expressed relative to this average, denoted
as 1.
4. Data analysis
The focus of this study is on the general level of main physical parameters describing
the classroom environment during test periods. To evaluate the effect of the two levels
of ventilation rates on pupils’ performance using the computerized assessment tests,
statistical analysis was carried out using a mixed design analysis of variance (ANOVA) with
ventilation rate (low or high) as a within- participants factor, and order of presentation
and class as between-participant factors (with class nested within order of
presentation). Simple comparisons were also made using t-test or Wilcoxon matched-
pairs for related samples. All values reported in this paper represent p-values that are 1-
tailed tests because we were interested only in results showing improvement in
performance with more favourable ventilation conditions. The rejection region for
significance was set to be p < 0.05.
5. Results 5.1. Classroom conditions prior to interventions
The monitoring week was important to provide background data and guidance for the
conditions established during recirculation week. The mean values of environmental
parameters during school hours for the monitoring week are shown in Table 2. Further
details are provided for the concentration of CO2 and parameters of the thermal
environment including standard deviation (SD), and the maximum and upper quartile (75th
percentile) values. The air temperature reflects the mean values of the records received
from the temperature probes distributed on the vertical pole at the measuring trolley. Other
parameters derived from the measured data, such as the operative temperature, vertical
temperature difference between head and feet levels, predicted draught rating, predicted
mean vote (PMV) and predicted percentage of dissatisfied due to thermal environment are
also included. The PMV calculations were made for each data point (3-min intervals during
occupied period) assuming 1.2 met (school activity) and 0.9 clo (clothing insulation) for a
typical pupils’ clothing. Although the assumption of 1.2 met activity may not always be a
representative value for the whole duration of these tests, it is a value that is often used for
children under sedentary activity (ISO 7730) [21]. Unfortunately the outdoor measurements
at some schools were not available due to technical failures.
5.2. Classroom conditions during performance tests
Fig. 2 and Fig. 3 show the records of the mean CO2 concentration and globe temperature

9
in 16 classrooms of 8 schools measured during completion of the performance tests. The
classrooms with mean volume of 154 ± 15 m3 and floor area of 58 ± 5 m2 were occupied by
25 ± 4 children. The carbon dioxide production (12.4 ± 0.6 l/h per person) in the occupied
class was calculated according ISO standard 8996 based [20]] on the measured body
parameters of children (ADuBois ¼ 1.15 ± 0.05 m2) at normal activity levels of 1.2 met and
the number of children (and adults) present in the classroom.
Using the CO2 mass balance model the calculated outdoor air exchange rates
corresponding to the CO2 conditions in Fig. 2 were slightly over 4 per hour with the high
ventilation condition.
Excluding Schools 1 and 2 where no significant change in the CO2 level was obtained, the
air exchange rates in the rest of the schools were between 0.3 and 1.7 per hour at low
ventilation condition.
According to tracer gas measurements, air exchange rates of 4.0 ± 0.3 h-1 and 0.6 ± 0.1 h-
1 were obtained when the ventilation system was providing fresh and re-circulated air
respectively. The mean fresh air supply for every school as measured by a flow metre built
into the duct system during improved ventilation was at 166 ± 12 l/s, (4.0 ± 0.4 h1 air change
rates), matching well the levels calculated with the other two methods. Assuming the
classroom occupancy and the reported air change rates, the air supply rates per person
ranged between 0.6 and 4.0 l/s.pp and 5.1-9.6 l/s.pp at low and high ventilation conditions
respectively.
Deviations of the globe temperature (Fig. 3) between low and high ventilation rate
conditions were on average 0.6 ± 1.6 K.
To evaluate the main effect of ventilation on the performance indicators of the
computerized tests, data from Schools 1 and 2 were excluded from the statistical analysis
due to the very small variation of the CO2 concentrations between the tests. The results of
the ANOVAs are summarized in Table 3 for 215 pupils who were present in both
experimental conditions, out of 250 participants. The PI which denotes the accurate reaction
time for a given test was significantly reduced for Choice RT (F(1,215) =5.35), Colour Word
Vigilance (F(1,204) ¼ 4.54) and Word Recognition (F(1,215) = 8.30)
when the ventilation rate was increased from low to high levels. For the Picture Memory
task a similar trend was observed in the variation of PI F(1, 174) = 2.58, and a significant
increase was noted in task accuracy F(1,174) = 4.62 due to the intervention of increasing the
ventilation rate. Because multiple tests are reported here, there is the possibility of inflated
Type I errors, so these results should be treated with a little caution. Whenever the effect of
practice (order of presentation) was large, this counteracted the effect of ventilation. This
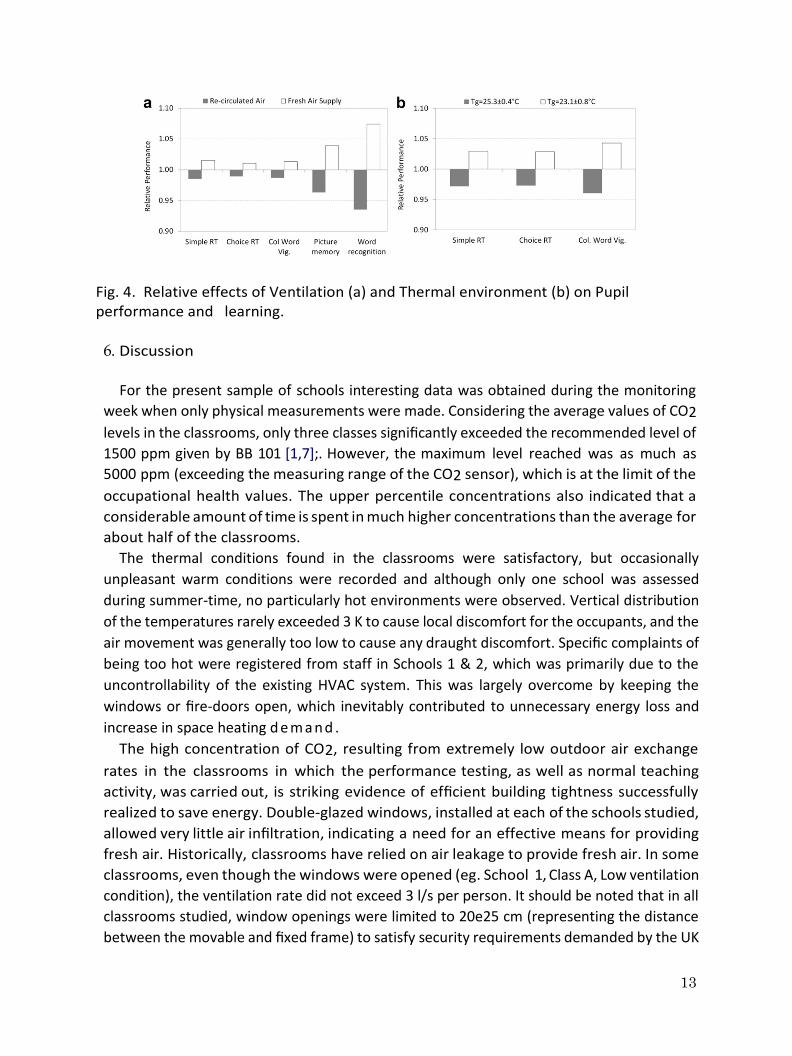
happened especially in the case of the addition and digit classification tests. Fig. 4a
summarises the results expressed in relative performance, which clearly shows the
decrement in performance with re-circulated air contrasting with the improvement
when fresh air is supplied.
Additionally, the analysis was extended for school no 2, where temperatures were lower
than the existing slightly elevated levels of 25.3 ± 0.4 oC to 23.1 ± 0.8 oC as a result of the
interventions. The CO2 level in this school was controlled by an existing mechanical
ventilation system below 1000 ppm; however, the provision of air was made at a constant
temperature of 28 oC due to system failure. The temperature reduction was obtained by
mixing preheated but slightly cool outdoor air through the mobile ventilation equipment to
bring the thermal environment to an acceptable level.
Based on the analysis of cognitive performance of 36 pupils in school no 2, the PI
significantly improved by about 6% for simple RT (p < 0.03), choice RT (p < 0.04) and by 8%
for Colour Word Vigilance (p < 0.001).
The analysis of subjective voting from 330 pupils indicated relatively small alterations
between the experimental conditions. Most of the beneficial effects of the higher
ventilation were related to air freshness, sensation of dryness in the mucous membrane,
eye dryness and alertness. However, the level of significance was achieved for a
minority of classrooms, which do not permit generalisation of the negative sensory and
health-related symptoms associated with low ventilation rates to the whole sample.
Significant alterations in thermal voting of subjects occurred only in two classrooms
(S3-A & S4-A), where the temperature difference between the conditions also justified
this outcome. In the other classrooms the pupils could not detect any significant
variations in the thermal environment, whether it was ventilated at high or low outdoor
supply rates. However, it is worth noting that, with one exception, all thermal votes were
distributed on the warm side of the scale, even though the classroom temperatures were
at the lower end of the comfort range. Most interestingly, the calculated PMV index
according to ISO 7730 was always underestimating subjective ratings which could have
been due to uncertainties in the value of the parameters used in the PMV calculations,
such us changes in activity and clothing ensembles.
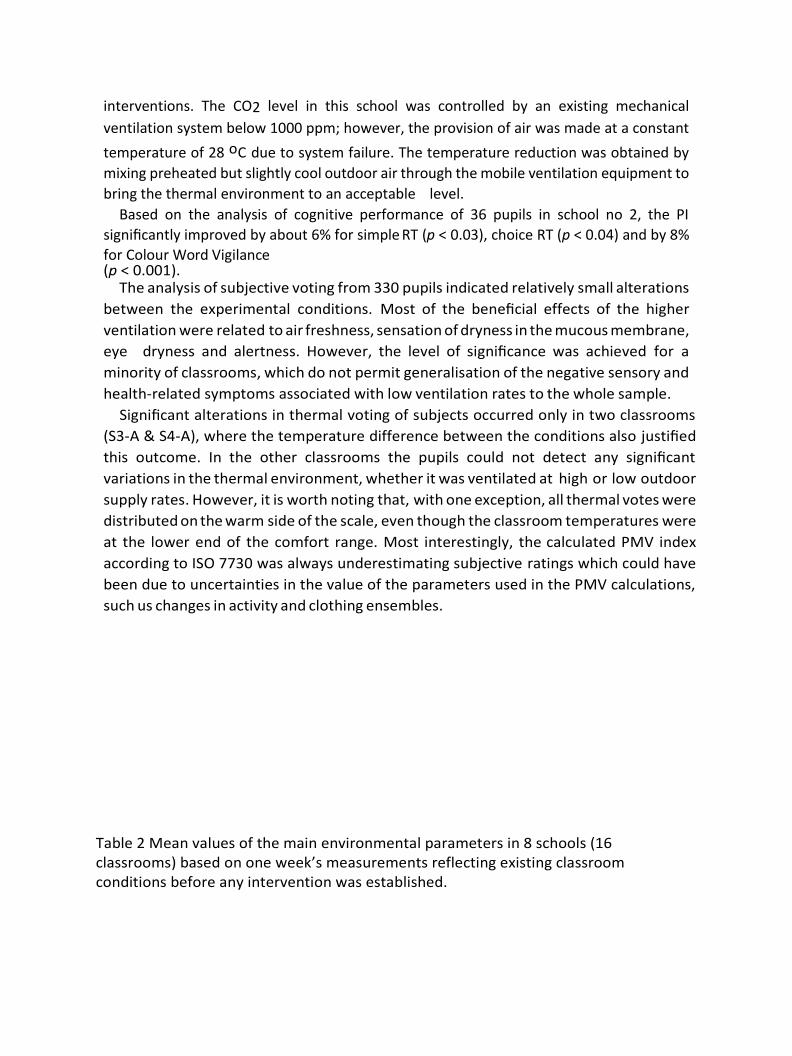
Table 2 Mean values of the main environmental parameters in 8 schools (16 classrooms) based on one week’s measurements reflecting existing classroom conditions before any intervention was established.
5
11
Table 3 Performance measures using the computerized assessment tests for
Schools 3-8.
Note: A positive relative change in the performance measures (D) indicates improvement between the conditions; pvent denotes the effect of ventilation, porder indicates the
effect of presentation order of the experimental conditions.
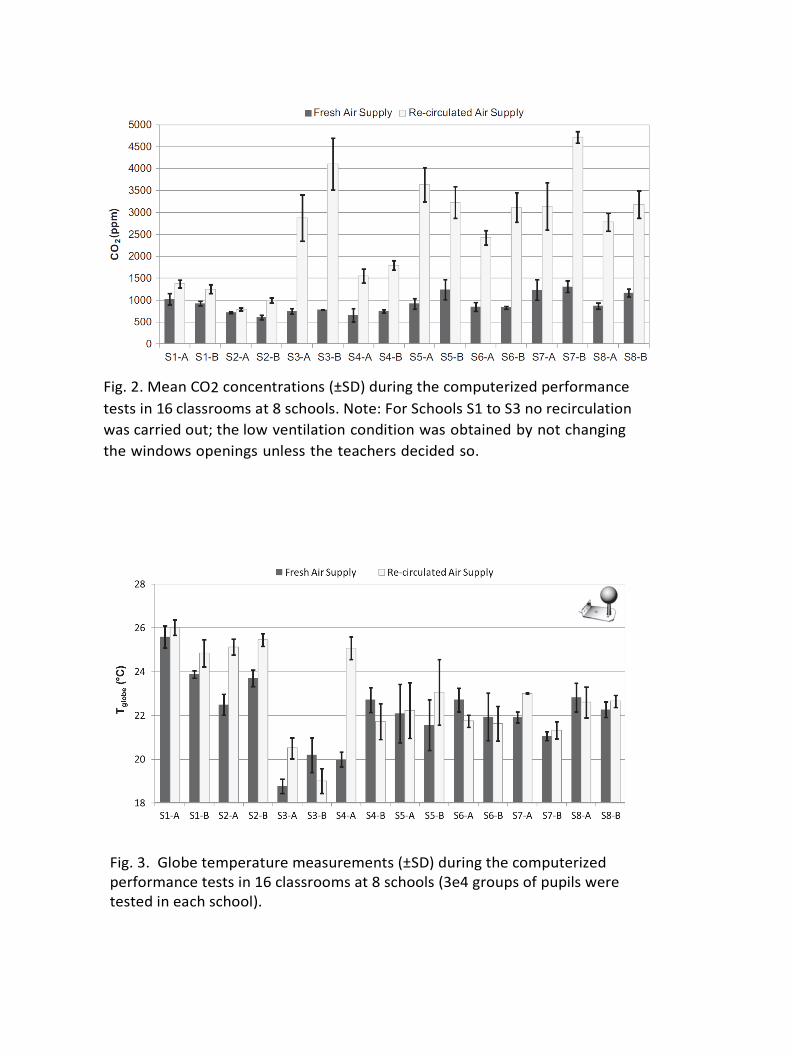
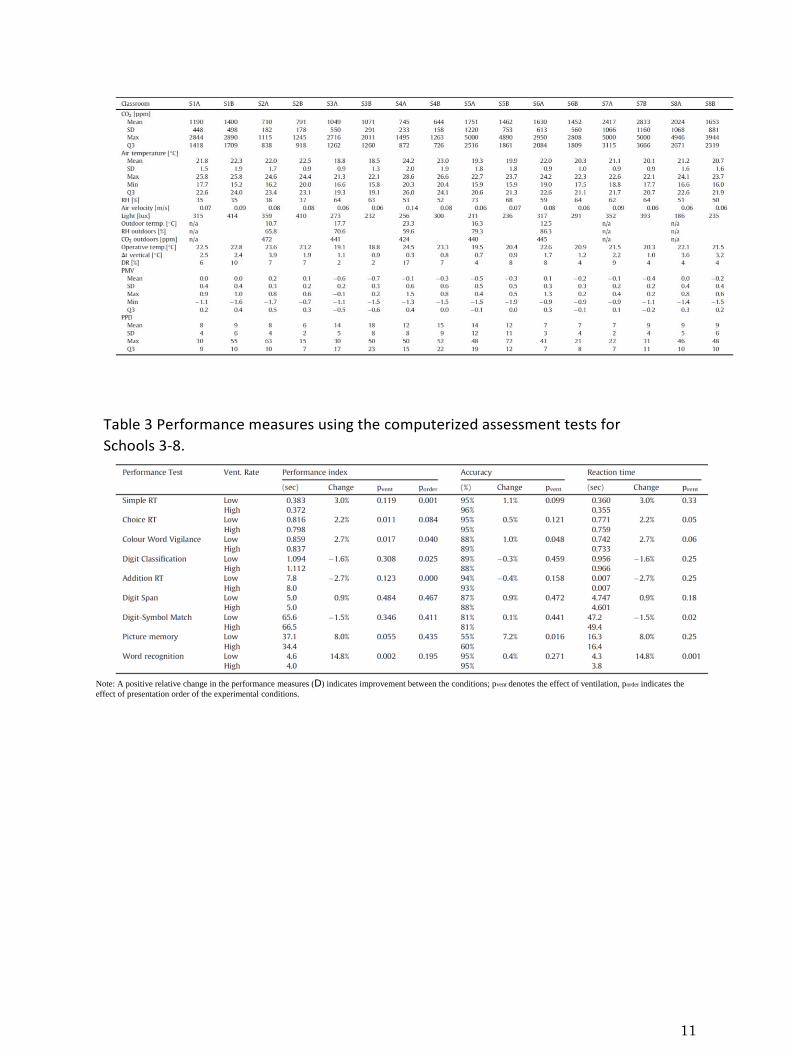
Fig. 2. Mean CO2 concentrations (±SD) during the computerized performance
tests in 16 classrooms at 8 schools. Note: For Schools S1 to S3 no recirculation
was carried out; the low ventilation condition was obtained by not changing
the windows openings unless the teachers decided so.
Fig. 3. Globe temperature measurements (±SD) during the computerized performance tests in 16 classrooms at 8 schools (3e4 groups of pupils were tested in each school).
13
Fig. 4. Relative effects of Ventilation (a) and Thermal environment (b) on Pupil performance and learning. 6. Discussion
For the present sample of schools interesting data was obtained during the monitoring
week when only physical measurements were made. Considering the average values of CO2
levels in the classrooms, only three classes significantly exceeded the recommended level of
1500 ppm given by BB 101 [1,7];. However, the maximum level reached was as much as
5000 ppm (exceeding the measuring range of the CO2 sensor), which is at the limit of the
occupational health values. The upper percentile concentrations also indicated that a
considerable amount of time is spent in much higher concentrations than the average for
about half of the classrooms.
The thermal conditions found in the classrooms were satisfactory, but occasionally
unpleasant warm conditions were recorded and although only one school was assessed
during summer-time, no particularly hot environments were observed. Vertical distribution
of the temperatures rarely exceeded 3 K to cause local discomfort for the occupants, and the
air movement was generally too low to cause any draught discomfort. Specific complaints of
being too hot were registered from staff in Schools 1 & 2, which was primarily due to the
uncontrollability of the existing HVAC system. This was largely overcome by keeping the
windows or fire-doors open, which inevitably contributed to unnecessary energy loss and
increase in space heating d e m a n d .
The high concentration of CO2, resulting from extremely low outdoor air exchange
rates in the classrooms in which the performance testing, as well as normal teaching
activity, was carried out, is striking evidence of efficient building tightness successfully
realized to save energy. Double-glazed windows, installed at each of the schools studied,
allowed very little air infiltration, indicating a need for an effective means for providing
fresh air. Historically, classrooms have relied on air leakage to provide fresh air. In some
classrooms, even though the windows were opened (eg. School 1, Class A, Low ventilation
condition), the ventilation rate did not exceed 3 l/s per person. It should be noted that in all
classrooms studied, window openings were limited to 20e25 cm (representing the distance
between the movable and fixed frame) to satisfy security requirements demanded by the UK

Health and Safety Regulations. Many professionals, such as those from the CIBSE Schools
Teachers Groups and others, complain about this restriction in hospitals as well as schools as
this constraint often prevents adequate ventilation being achieved.
In situations when the windows were left closed, in the absence of other means of
providing outdoor air (e.g. when recirculation mode was set), CO2 levels rose quickly to
3000e4500 ppm within a teaching session. Under such conditions the length of school
breaks were often too short to restore CO2 concentrations to the outdoor levels before
the next teaching session commenced. On some occasions, the morning teaching
sessions even began with residual CO2 concentration from the previous day. Similar high
levels in naturally ventilated classrooms have often been reported in schools in the UK
[12, 24] and abroad [7, 16].
In the current study, the pupils provided their own controls in a repeated-measures
design so that the observed differences in performance between conditions are unlikely
to have been due to differences between particular groups of children. When calculating
the main effect of the ventilation, the present analysis did not assess interactions due to
other factors, such as temperature, that may also have contributed in some of the
classrooms to t he performance outcomes [34]. In this experiment, an effort was made to
try to avoid thermal effects due to temperature changes by conditioning the supplied air to
maintain the classroom temperature within the comfortable range and also by using a
balanced order of presentation of the experimental conditions. In such cases if an external
factor, such as change in weather during one of the exposure weeks had affected the study,
the effect should have influenced both experimental conditions. The cooling capacity of the
portable air conditioning unit, however, was not always sufficient to handle large variations
in heat loads. Consequently, a large temperature difference between the test conditions was
observed for Class A, School 4, which was not counteracted to the same extent in the other
classroom. The observed difference in the thermal environment for this class actually
strengthened the influence of ventilation on performance, if we consider that lower
temperatures have a positive impact on the performance measures. Indeed such an effect
could be demonstrated in School 2, where the air quality conditions were equally good with
and without interventions, and the pupils were significantly quicker in performing three
different reaction tasks at lower, more comfortable temperatures. In particular, the test
session was repeated in Class A in School 4 for the fresh air supply condition at a temperature
comparable with that for the re- circulated air condition. However, the results from these
repeated tests did not show a significant alteration to the original results of the ANOVA.

15
Contrary to expectation, the improved interventions only moderately improved
pupils’ subjective voting. These interventions were made on a relatively short time scale
in order to generate strong effects on health and other symptoms. We should also note
that, due to regular school breaks, pupils have more time in each class hour to get away
from their classroom and participate in outdoor activities that can compensate for
negative health effects due to poor ventilation in the classrooms.
7. Conclusions and recommendations
The present study strengthens the evidence reported by [12], but for a larger sample
of schools and for over 200 children, that poor ventilation rates in classrooms
significantly impair children’s attention and vigilance. The faster and more accurate
responses in Choice RT and Colour Word Vigilance tasks reflect higher level of focused
attention at higher ventilation rates compared to low rates with natural ventilation. In
poorly ventilated classrooms, students are likely to be less attentive and to concentrate
less well on instructions given by teachers. The magnitude of the negative effects with
inadequate ventilation was even higher for tasks that require more complex skills such
as spatial working memory and verbal ability to recognize words and non-words.
Ventilation rates in the order of 8 l/s per person are recommended in all teaching
facilities to prevent any impairment of pupils’ performance due to inadequate
ventilation. Additionally, it was demonstrated in one of the schools which had good
ventilation background that pupils reacted significantly faster in a number of simple
tasks when the classroom temperatures were reduced from existing slightly elevated
levels to a more comfortable range. The present findings are in good agreement with
the results reported by a number of other independent studies investigating the effects
of classroom environmental quality on pupils’ learning performance [7,31,34].
Based on the outcomes and observations made during the investigations in the 8 UK
schools which involved feedback from teachers, the present study proposes the
following suggested recommendations to school managers, designers and related
personnel involved in school design and maintenance:
• suggested recommendations for UK schools managers include equipping classrooms
with a device to monitor CO2, temperature & relative humidity in classrooms;
providing additional ventilation if CO2 concentration exceeds 1000 ppm; keeping
temperatures within comfortable range of 20-22oC (winter) and 22-24oC (summer);
avoiding moisture build up in classrooms and keeping humidity levels below 60%
during winter time but preferably above 40%; creating daily windows opening
routines for the school; using odorless cleaning agents and remembering that dirty
carpets can pollute the indoor environment.

• suggested recommendations for school building designers, facilities managers and other
stake holders include: providing ventilation to limit the concentration of carbon dioxide
in all teaching and learning spaces an average of 1000 parts per million (ppm) between
the start and finish of teaching on any day, which is lower than the 1500 ppm
recommended in the UK’s Building Bulletin 101; providing a minimum fresh air supply
rate or ventilation rate in all teaching and learning spaces in the order of 8 l/s per person
which falls within the recommendations of [2,3] and other international standards;
dedicated ventilation systems may be necessary to achieve the above targets; limiting
classroom temperatures to those specified earlier; avoiding overheating by limiting solar
gain using utilising passive means such as thermal mass, orientation, fenestration and
external/internal shading devices; choice of opening windows and their location are
both important in the design of the school façade as this affects the effectiveness of
natural ventilation; the high use of computers contributes to an additional heat load
but using slim computers with cloud computing, as used by some schools, could
radically reduce internal load.
The physical environment affects people’s well-being in terms of mind and body. This
work shows that elevated level of indoor air pollutants including CO2 due to inadequate
ventilation encountered in classrooms can affect learning. We know that the air we breathe
can affect the brain via the blood oxygenation in about 4 s. CO2 is seen as a harmless gas
and so is often accorded little significance, other than as an indicator of ventilation, but if it
contributes directly to increased tiredness and a loss of concentration [22] then it might be
regarded as a very significant air pollutant. Air quality is just as important as temperature so
needs to be monitored so as to guide teachers when to open windows or switch on fans
[28].
Acknowledgements
The project was financed by The Engineering and Physicals Sciences Council (EPSRC), the
Department for Communities, Schools and Families (DCSF). Professor P Wargocki at the
Technical University of Denmark made a valuable contribution to the project. Professors
Anders Iregren (Nat. Inst. for Working Life, Sweden) and David M. Warburton (Department
of Psychology, The University of Reading) kindly provided the free use of their test systems
for further development. Thanks are also due to Lindab Ltd. for providing free of charge
ventilation equipment. The project team is grateful to the Heads of the primary schools for
opening their doors to this study and the teachers who participated and liaised with pupils
and their parents. Last but not least a special thanks to all the pupils for taking part in the
study and providing their comments and suggestions.

17
References
[1] d’Ambrosio Alfano, F.R. (ed.), Bellia, L., Boerstra, A., van Dijken, F., Ianniello, E.,
Lopardo, G., Minichiello, F., Romagnoni, P., Gameiro da Silva, M.C. (2010) Environment
and Energy Efficiency in Schools (Part 1), REHVA Guidebook Number vol. 13, REHVA,
Brussels, Belgium.
[2] ASHRAE, (2009) Indoor Air Quality Guide (ISBN 978-1-933742-59-5).
[3] ASHRAE. ASHRAE Standard 62.1e2007, Ventilation for Acceptable Indoor Air
Quality. Atlanta, GA, USA: ASHRAE; 2007.
[4] ASHRAE Handbook. Fundamentals. Atlanta, USA: American Society of Heating,
Refrigerating and Air-Conditioning Engineers, Inc.; 1997.
[5] Bakó-Biró, Zs, Kochhar, N, Clements-Croome, DJ., Awbi, HB. and Williams, M.
(2008).Ventilation rates in schools and pupils' performance using computerised
assessment tests" Indoor Air 2008, Copenhagen, The 11th International
Conference on Indoor Air Quality and Climate.
[6] Bakó-Biró, Zs., Kochhar, N., Clements-Croome, D.J., Awbi, H.B. and Williams, M.
(2007) "Ventilation rates in schools and learning performance" In: Proceedings of
CLIMA 2007 WellBeing Indoors, The 9th REHVA World Congress, Helsinki, Finland
pp. 1434-1440.
[7] Boerstra A, van Dijken Froukje. Indoor environment and energy efficiency of
schools. REHVA Journal 2010;47(5):34-8.
[8] Building Bulletin 101 Ventilation of School Buildings. Regulations, Standards,
Design Guidance, 2006 July, ISBN 011-2711642.
[9] CIBSE, (2004) CIBSE Guide B: Heating, Ventilating, Air Conditioning and
Refrigeration.
[10] Cho Y, Awbi HB, Karimipanah T. Theoretical and experimental investigation of
wall confluent jets ventilation and comparison with wall displacement
ventilation. Building and Environment 2008;43:1091-100.
[11] Clements-Croome DJ, Awbi HB, Bakó-Biró Zs, Kochhar N, Williams M.
Ventilation rates in schools. Building and Environment 2008;43(3):362-7.
[12] Coley DA, Greeves R. The Effect of Low Ventilation Rates on the Cognitive function
of a PRIMARY SCHOOL CLASS. Report R102 for DfES, Exeter University; 2004.
[13] Daisey JM, Angell WJ, Apte MG. Indoor air quality, ventilation and health
symptoms: an analysis of existing information. Indoor Air 2003;13(1):53-64.
[14] DCSF, (2007) Schools and Pupils in England, SFR30/2007.
[15] DCSF. Over one billion cash boost to improve school buildings. Press Notice
database, http://www.dcsf.gov.uk/pns/DisplayPN.cgi?pn_id¼2005_0115; 2005.
[16] Dijken FV, Bronswijk JV, Sundell J. Indoor environment in Dutch primary schools and
health of the pupils. Proceedings of Indoor Air 2005 2005;I(1): 623-7.
[17] Faustman EM, Silbernagel SM, Fenske RA, Burbacher TM, Ponce RA. Mecha-
nisms underlying children's susceptibility to environmental toxicants. Environ.
Health Perspect. 2000;108(Suppl. 1):13-21.
[18] Haverinen-Shaughnessy U, Moschandreas DJ, Shaughnessy RJ. Association between
substandard classroom ventilation rates and students' academic achievement.
Indoor Air 2011;21:121-31.
[19] Iregren A, Gamberale F, Kjellberg A. SPES: a psychological test system to
diagnose environmental hazards. Swedish Performance Evaluation System.
Neurotoxicology Teratology 1996;18(4):485-96.
[20] ISO 8996 (1990) Ergonomics e Determination of metabolic heat production.
[21] ISO 7730. Moderate Thermal Environments e Determination of the PMV and
PPD Indices and Specification of the Conditions For Thermal Comfort. Geneva,
Switzerland: International Standards Organisation; 2005.
[22] Kajtar L, Herczeg L, Lang E, Hrustinszky T, Banhidi L. Influence of carbon dioxide
pollutant on human well being and work intensity. Lisbon, Portugal. In: Healthy
Buildings 2006; 2006. p. 85e90.
[23] Kildesø J, Wyon D, Schneider T, Skov T. Visual analogue scales for detecting changes
in symptoms of the sick building syndrome in an intervention study. Scandinavian
Journal of Work Environment and Health 1999;25(4):361-7.
[24] Kukadia V, Ajiboye P, White M. Ventilation and indoor air quality in schools, BRE
Information paper IP06/05. Watford: BRE publication; 2005.
[25] Mendell MJ, Heath GA. Do indoor pollutants and thermal conditions in schools
Influence student performance? A critical review of the literature. Indoor Air
2005;15(1):27-52.
[26] Mi Y-H, Norbäck D, Tao J, Mi Y-L, Ferm M. Current asthma and respiratory symptoms
among pupils in Shanghai, China: influence of building ventilation, nitrogen dioxide,
ozone, and formaldehyde in classrooms. Indoor Air 2006; 16(6):454-64.
[27] Myhrvold AN, Olsen E, Lauridsen O. Indoor environment in schools epupils
health and performance in regard to CO2 concentrations. Proceedings of the
7th International Conference on Indoor Air Quality and Climate -Indoor Air 1996
1996;4:369-74.
[28] OSHA. In: Indoor Air Quality, Section 3, Chap. 2. Technical Manual, Occupa- tional
Safety and Health Administration US (TED 01-00-015); 1999.
[29] Satish, U., Fisk, W.B., Mendell, M.J., Eliseeva, K., Hotchi, T., Sullivan, D., Cleckner, L.B.,
Shekhar, K. and Teng, K. (2011) Impact of CO2 on Human Decision Making and

19
Productivity, Indoor Air Conference June 5-10, Austin, Texas, a 574.
[30] Shendell DG, Prill R, Fisk WJ, Apte MG. Associations between classroom CO2
concentrations and student attendance in Washington and Idaho. Indoor Air
2004;14(5):333-41.
[31] Smedje G, Norback D, Edling C. Mental performance by secondary school
pupils in relation to the quality of Indoor air. Proceedings of The 7th Inter-
national Conference on Indoor Air Quality and Climate e Indoor Air ’96 1996;
1:413-9.
[32] Suk W, Murray K, Avakian MD. Environmental hazards to children's health in
the modern world. Mutation Research 2003;544:235-42.
[33] Wargocki P, Wyon DP. The effects of outdoor air supply rate and supply air
filter condition in classrooms on the performance of schoolwork by children
(1257-RP). HVAC&R Research 2007a;13(2):165-91.
[34] Wargocki P, Wyon DP. The effects of moderately raised classroom tempera-
tures and classroom ventilation rate on the performance of schoolwork by
children (1257-RP). HVAC&R Research 2007b;13(2):193-220.
[35] Zhao ZH, Elfman L, Wang ZH, Zhang Z, Norbäck D. A comparative study of
asthma, pollen, cat and dog allergy among pupils and allergen levels in schools
in Taiyuan city, China, and Uppsala. Sweden Indoor Air 2006;16(6): 404-13.