Embed Size (px)
Citation preview
Ventilation Rates in Schools and Children’s Learning Performance
Zsolt Bakó-Zsolt Bakó-BiróBiró
School of Construction Management and School of Construction Management and EngineeringEngineering
School of Construction Management and School of Construction Management and EngineeringEngineering
Research Team
Prof. Derek Clements-Croom(SCME, University of Reading)
Dr. Hazim Awbi(SCME, University of Reading)
Dr. Marylin Williams(School of Psychology , University of Reading)
Dr. David Coley(Centre for Energy & Environment, University of Exeter)
Dr. Neena Kochhar(SCME, University of Reading)
Dr. Zsolt Bakó-Biró(SCME, University of Reading)
Objectives
To extend our knowledge about IAQ and typical ventilation rates in school environments
To determine a direct relationship between IAQ and pupils’ learning performance.
Methods
School selection: 20 primary schools in Reading & Exeter
Targeted age group:9-11 years old children
Measurements:objective & subjective evaluations (repeated design)(2-3 weeks / school for 2 years)
Intervention:to increase the ventilation rates above 8 L/s per person
Physical measurementsContinuous monitoring
Spot measurements:Noise levelOzone level (Indoors/Outdoors)
Air change rate (SF6), TVOC, Selected VOCs
Air temperature & Relative Humidity (RH)
Globe temperatureAir velocityCarbon dioxide (CO2)
Airborne particles (PM1, PM2.5, PM10) Lighting
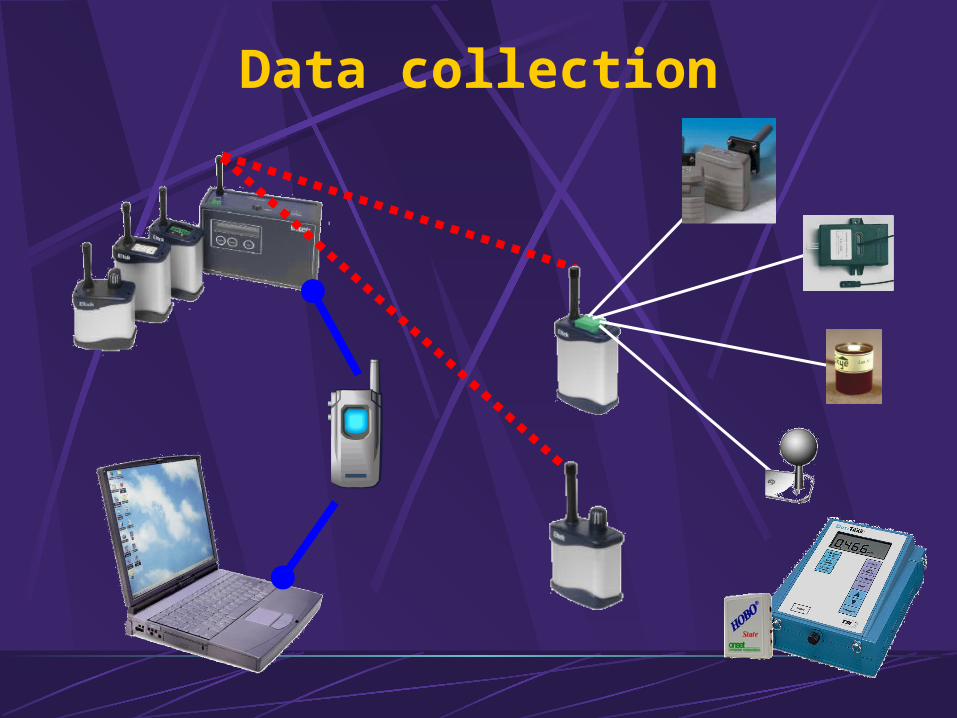
Data collection
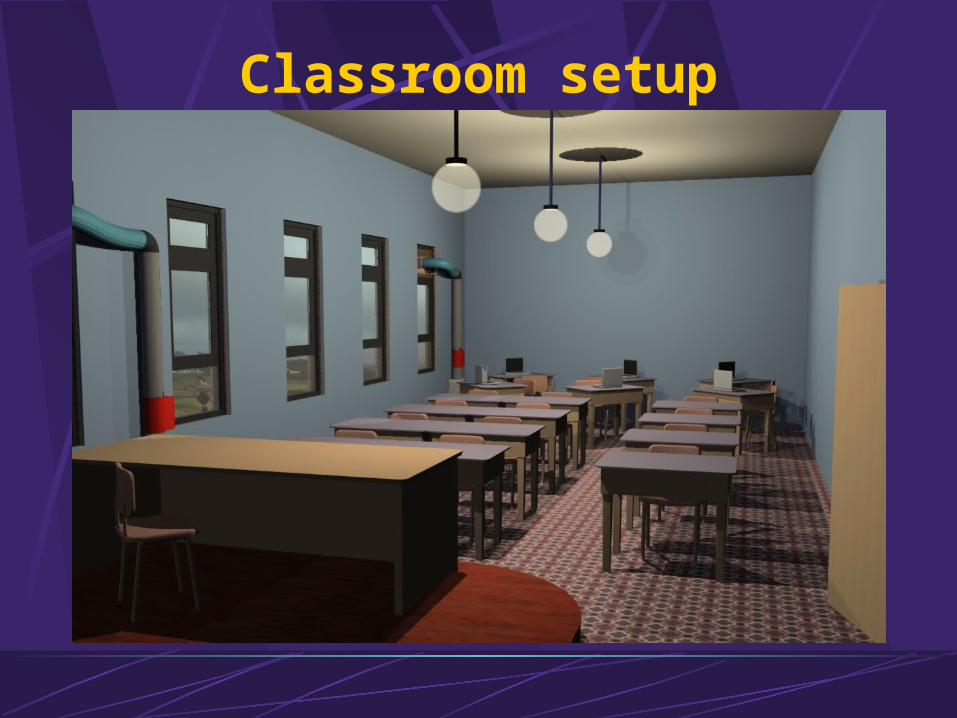
Classroom setup
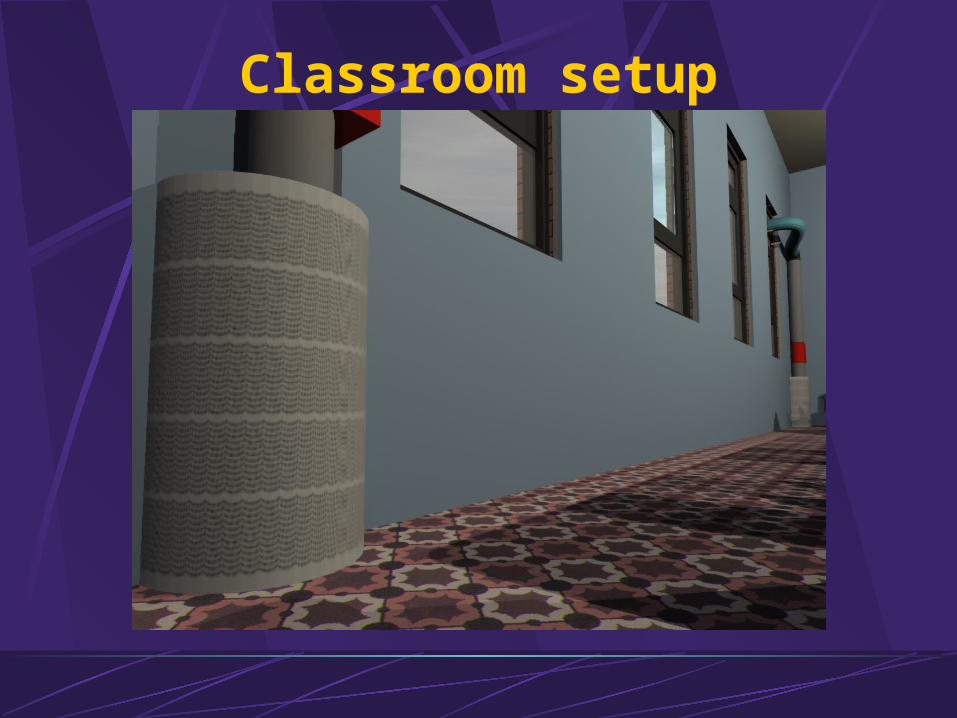
Classroom setup
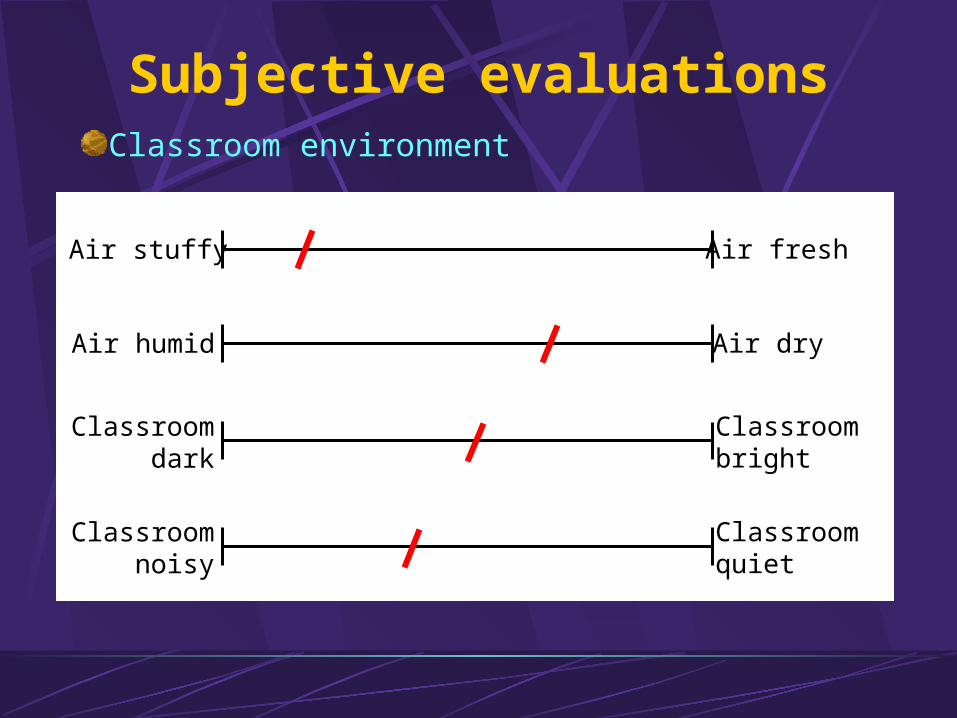
Subjective evaluations
Classroomnoisy
Classroomquiet
Air humid Air dry
Air stuffy Air fresh
Classroomdark
Classroombright
Classroom environment
Subjective evaluations
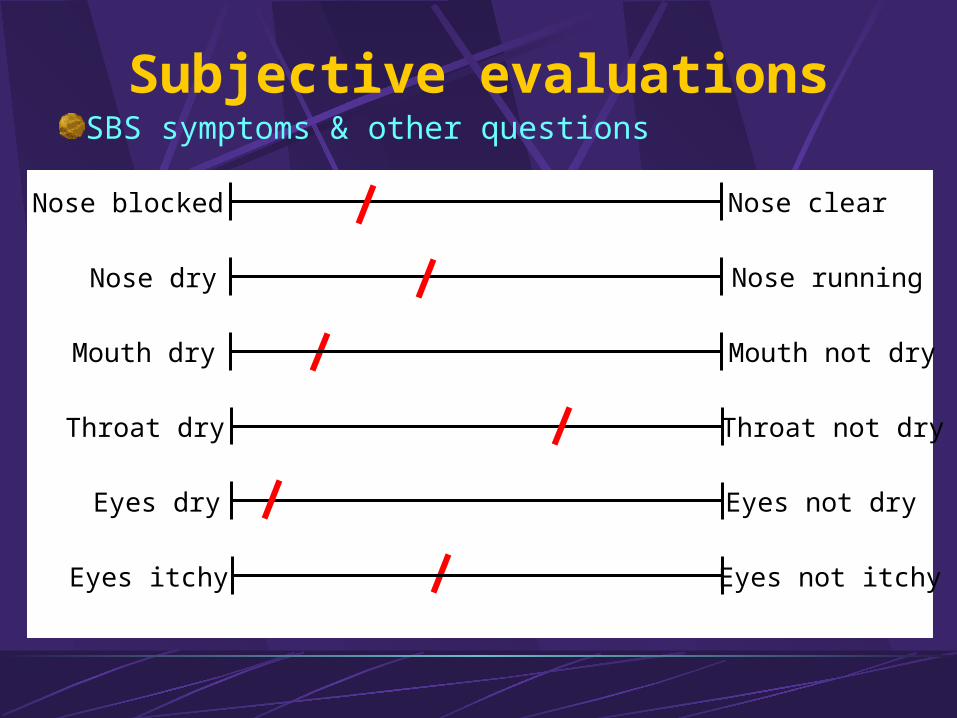
Nose dry Nose running
Nose blocked Nose clear
Throat dry Throat not dry
SBS symptoms & other questions
Eyes dry Eyes not dry
Mouth dry Mouth not dry
Eyes itchy Eyes not itchy
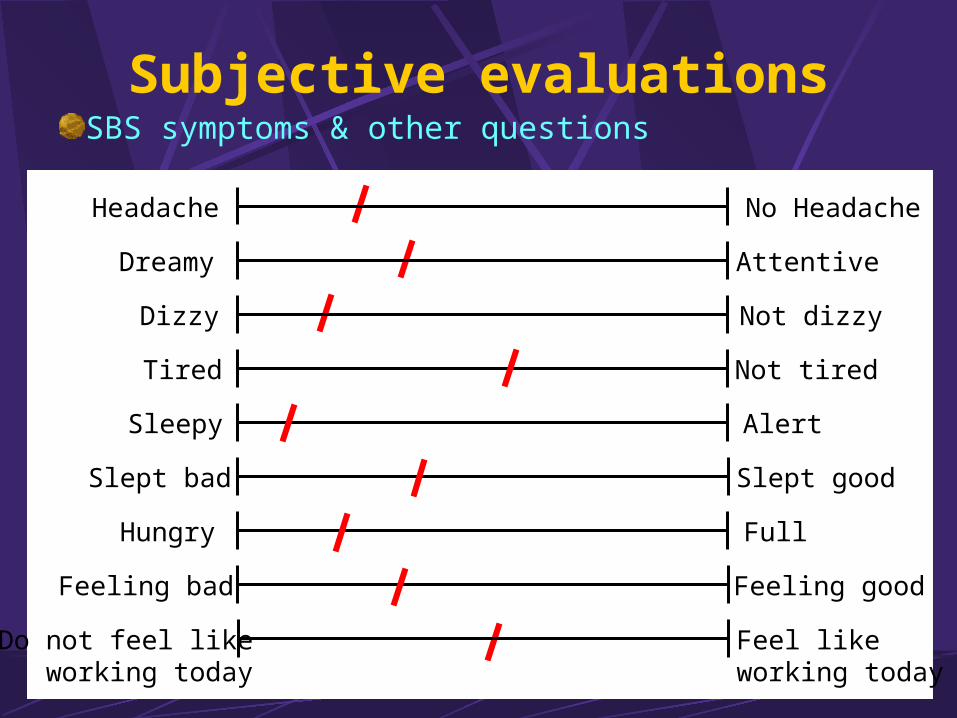
Subjective evaluationsSBS symptoms & other questions
Tired Not tired
Sleepy Alert
Slept bad Slept good
Feeling bad Feeling good
Hungry Full
Headache No Headache
Dreamy Attentive
Dizzy Not dizzy
Do not feel likeworking today
Feel likeworking today
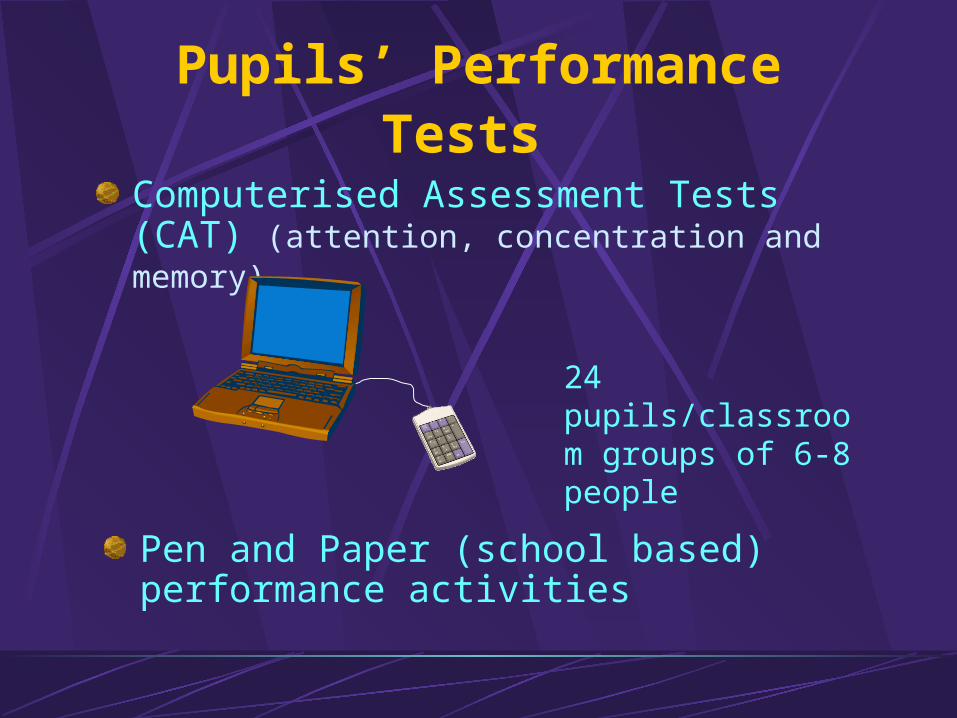
Pupils’ Performance Tests
Computerised Assessment Tests (CAT) (attention, concentration and memory)
Pen and Paper (school based) performance activities
24 pupils/classroom groups of 6-8 people
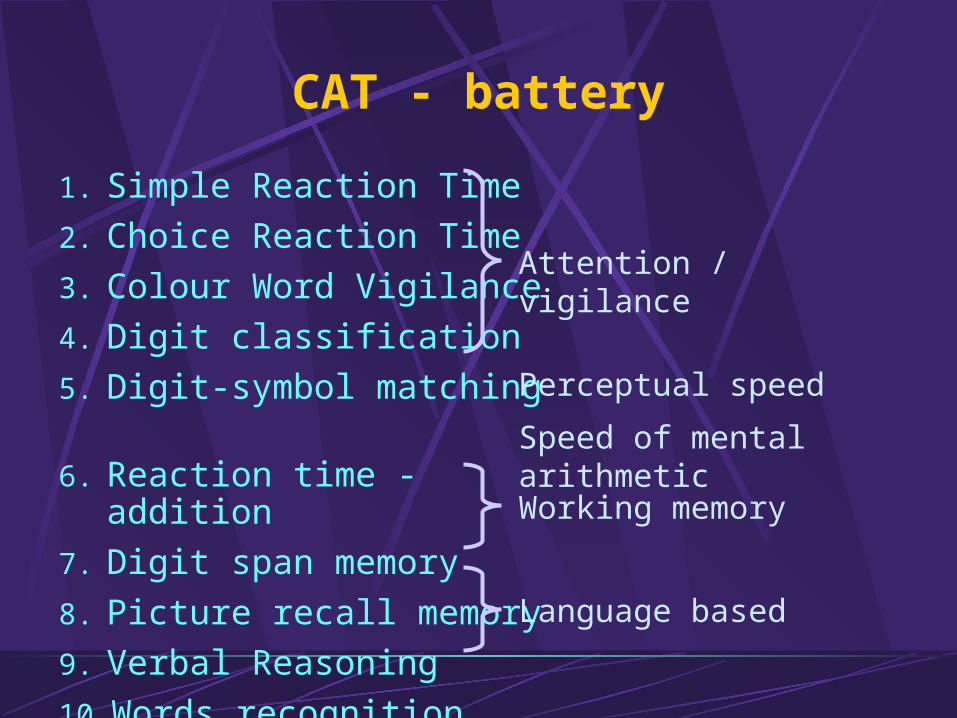
CAT - battery
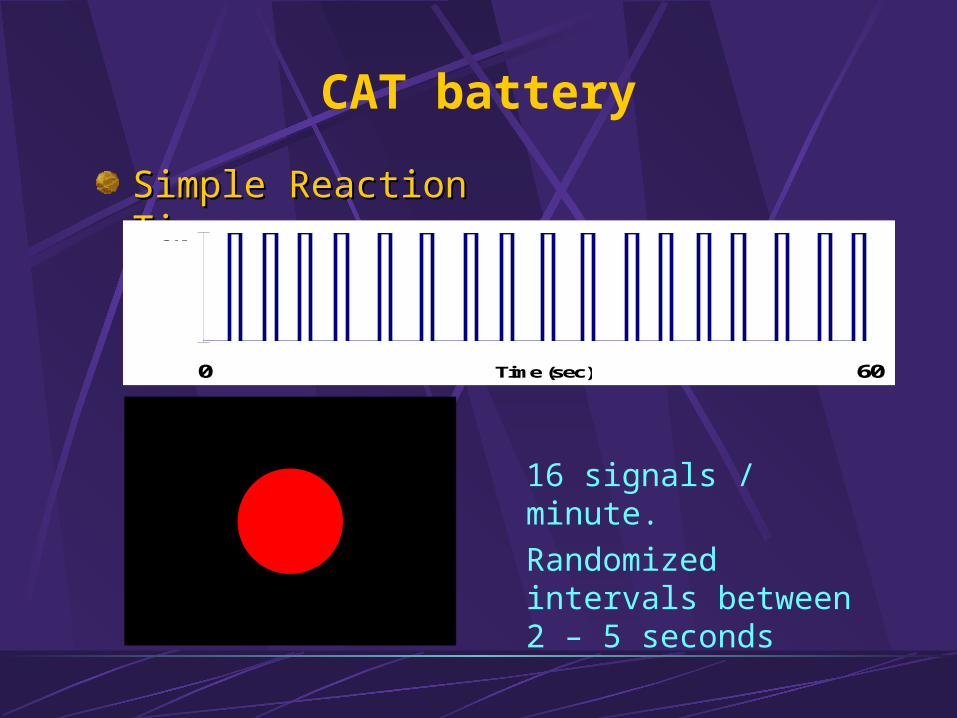
1. Simple Reaction Time
2. Choice Reaction Time
3. Colour Word Vigilance
4. Digit classification
5. Digit-symbol matching
6. Reaction time - addition
7. Digit span memory
8. Picture recall memory
9. Verbal Reasoning
10.Words recognition
Attention / vigilance
Perceptual speed
Speed of mental arithmeticWorking memory
Language based
CAT battery
Simple Reaction Simple Reaction TimeTime:
16 signals / minute. Randomized intervals between 2 – 5 seconds
0
1
0 60Time (sec)
ON
OFF
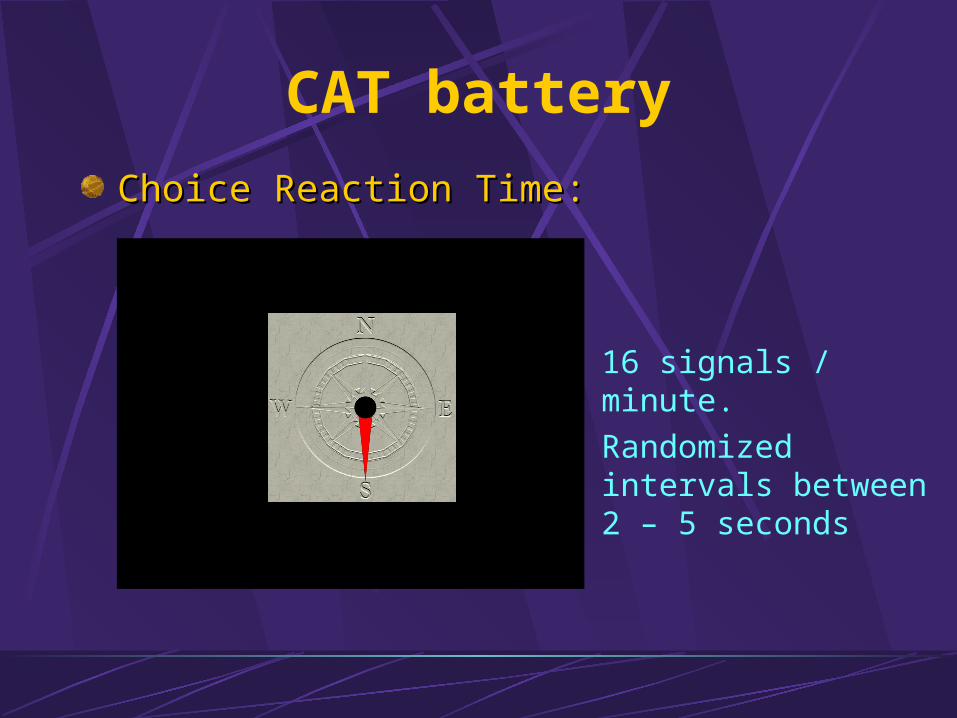
Choice Reaction Time:Choice Reaction Time:
CAT battery
16 signals / minute. Randomized intervals between 2 – 5 seconds
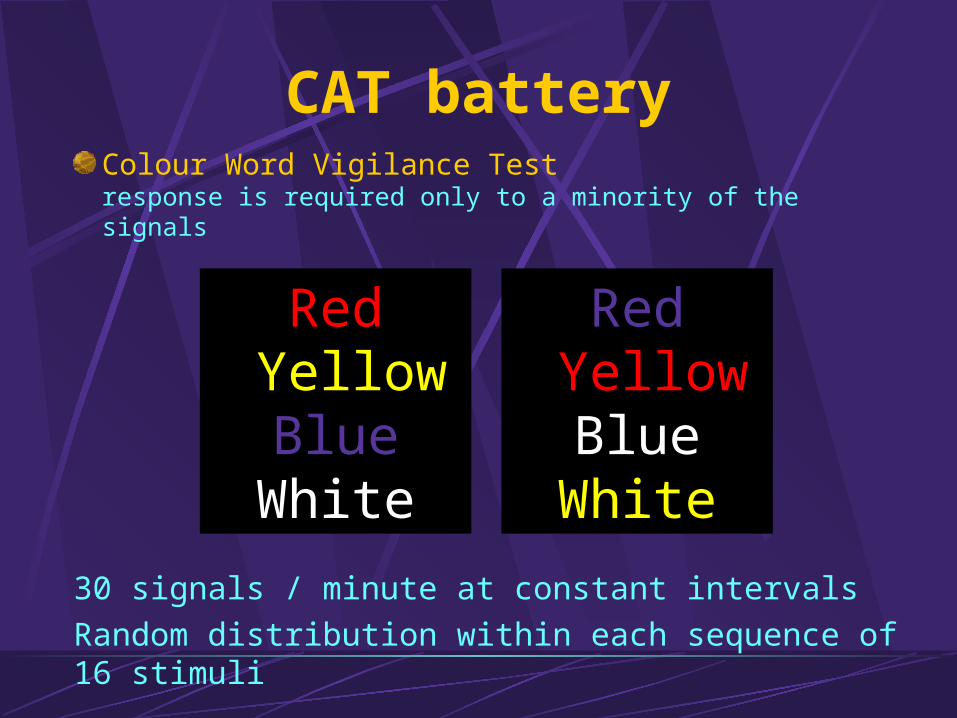
Colour Word Vigilance Test response is required only to a minority of the signals
Red Yellow
BlueWhite
Red Yellow
BlueWhite
CAT battery
30 signals / minute at constant intervals Random distribution within each sequence of 16 stimuli
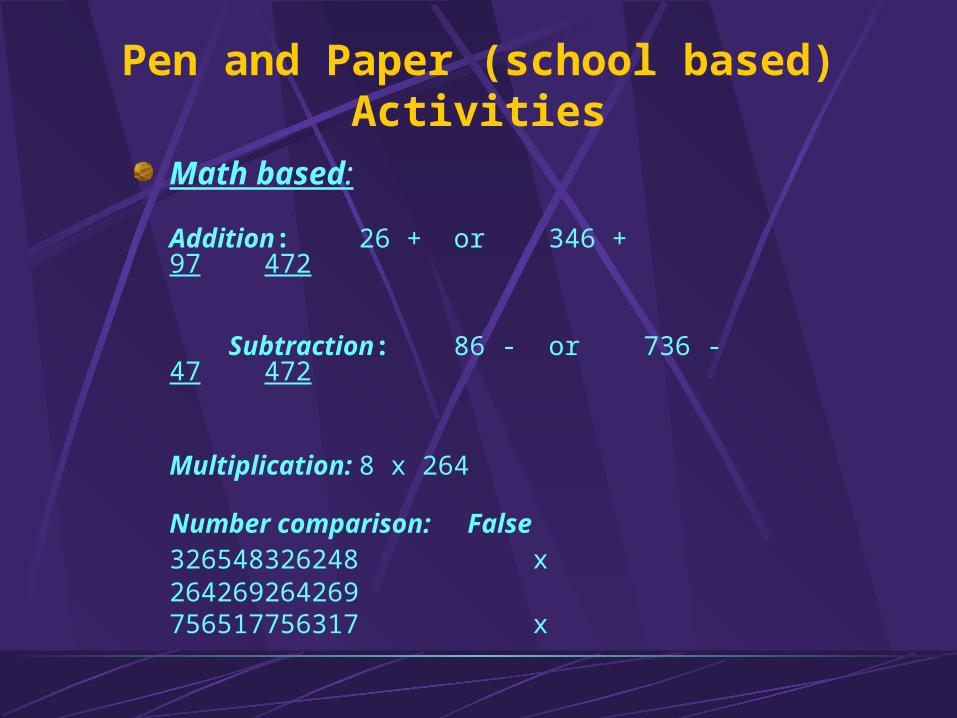
Pen and Paper (school based) Activities
Math based:
Addition: 26 + or 346 +97 472
Subtraction: 86 - or 736 -47 472
Multiplication: 8 x 264
Number comparison: False326548 326248 x264269 264269 756517 756317 x
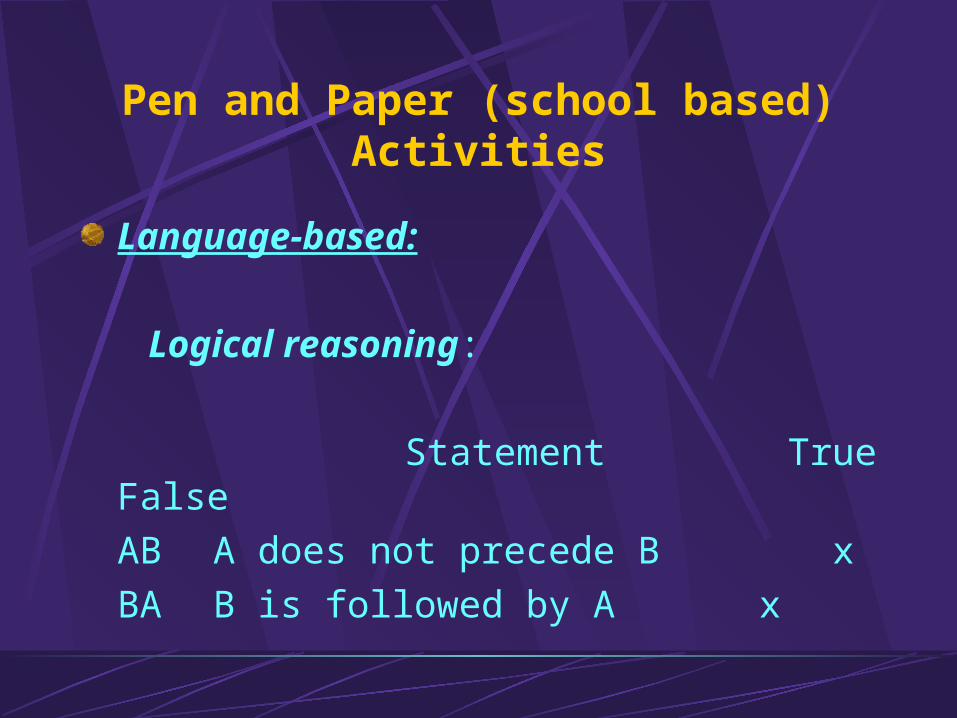
Pen and Paper (school based) Activities
Language-based:
Logical reasoning:
Statement TrueFalseAB A does not precede B xBA B is followed by A x
Outcomes
To recommend suitable ventilation rates for classrooms.
To examine the suitability of the air quality guidelines for classrooms based on the results obtained
To develop a website displaying the main research findings.

Thank You
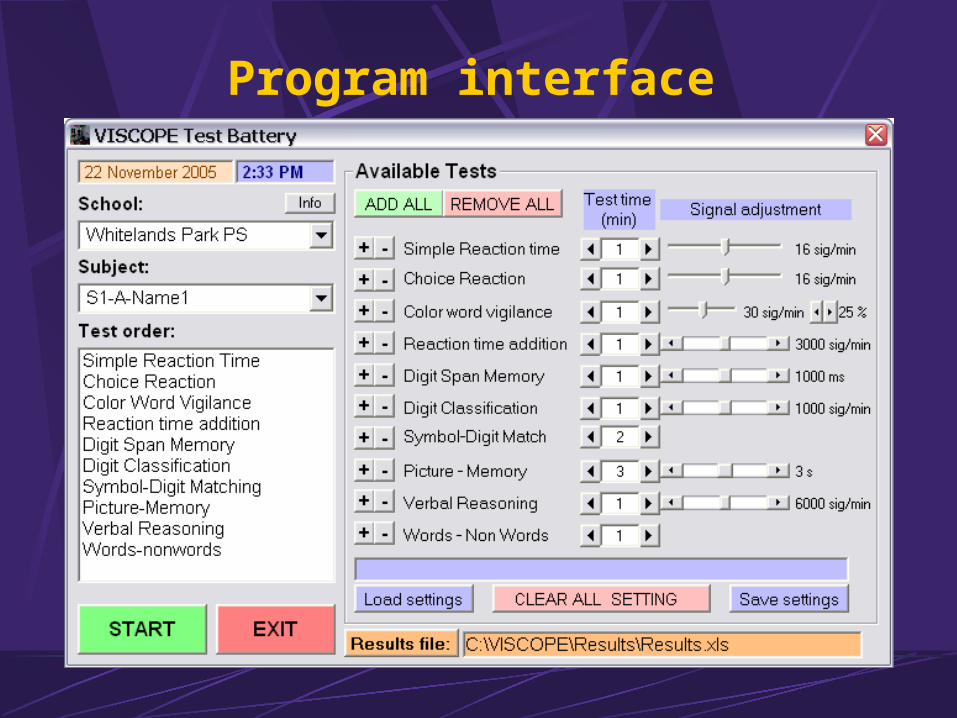
Program interface
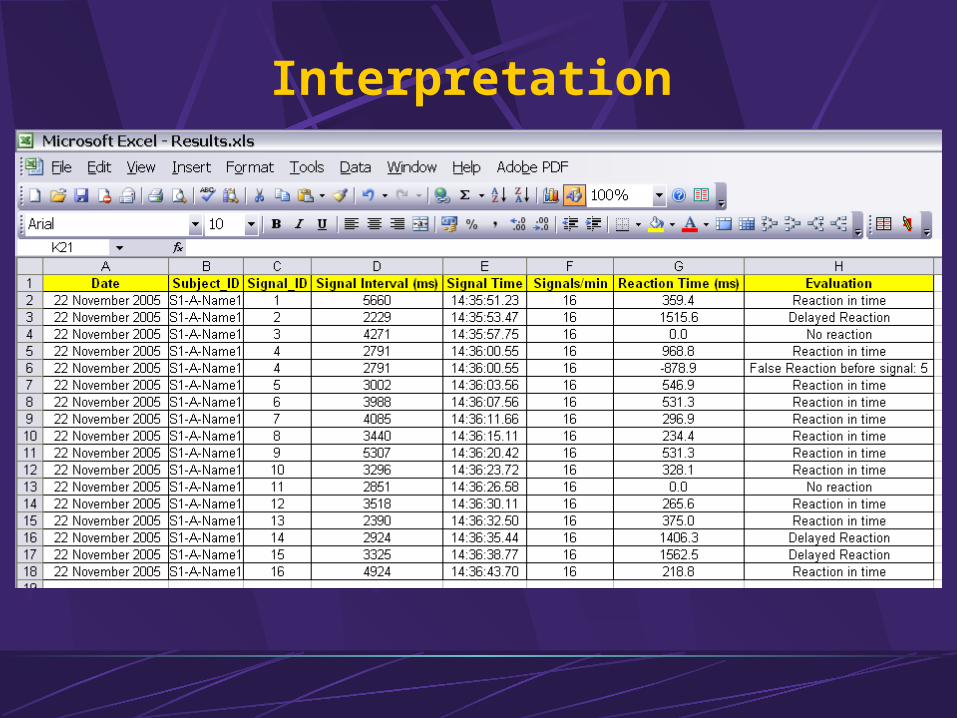
Interpretation