Embed Size (px)
DESCRIPTION
Ventilation of the E quatorial Atlantic. P. Brandt, R. J. Greatbatch , M. Claus, S.-H. Didwischus , J. Hahn GEOMAR Helmholtz Centre for Ocean Research Kiel. Oxygen Depletion in the North Atlantic OMZ. - PowerPoint PPT Presentation
Citation preview
Ventilation of the Equatorial Atlantic
P. Brandt, R. J. Greatbatch, M. Claus, S.-H. Didwischus, J. HahnGEOMAR Helmholtz Centre for Ocean Research Kiel
1
2
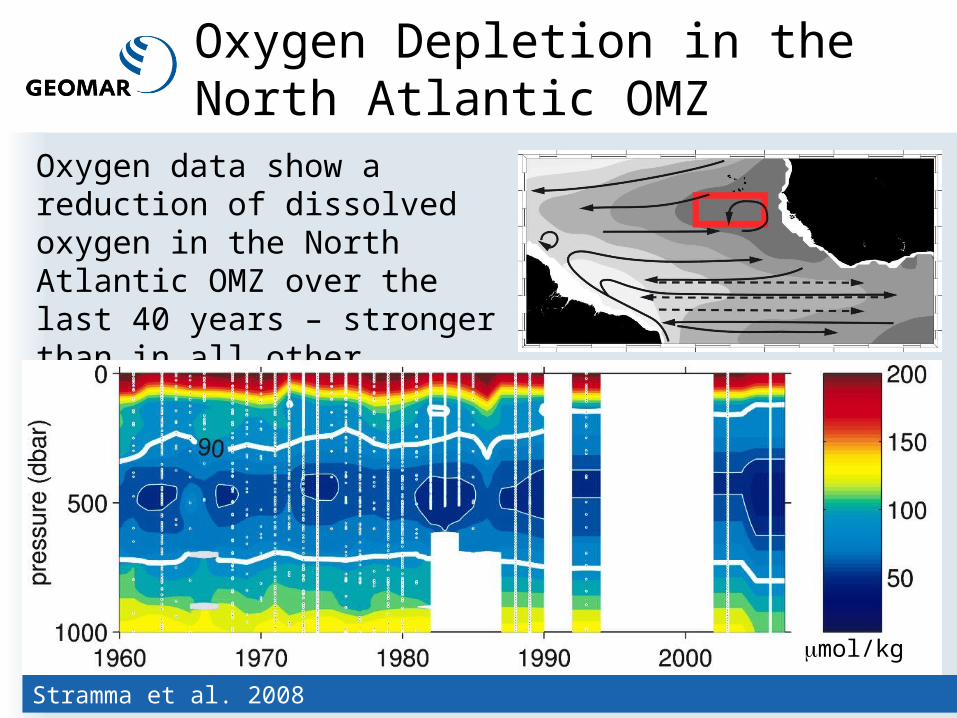
Oxygen Depletion in the North Atlantic OMZ
Oxygen data show a reduction of dissolved oxygen in the North Atlantic OMZ over the last 40 years – stronger than in all other tropical regions.
Stramma et al. 2008
mmol/kg
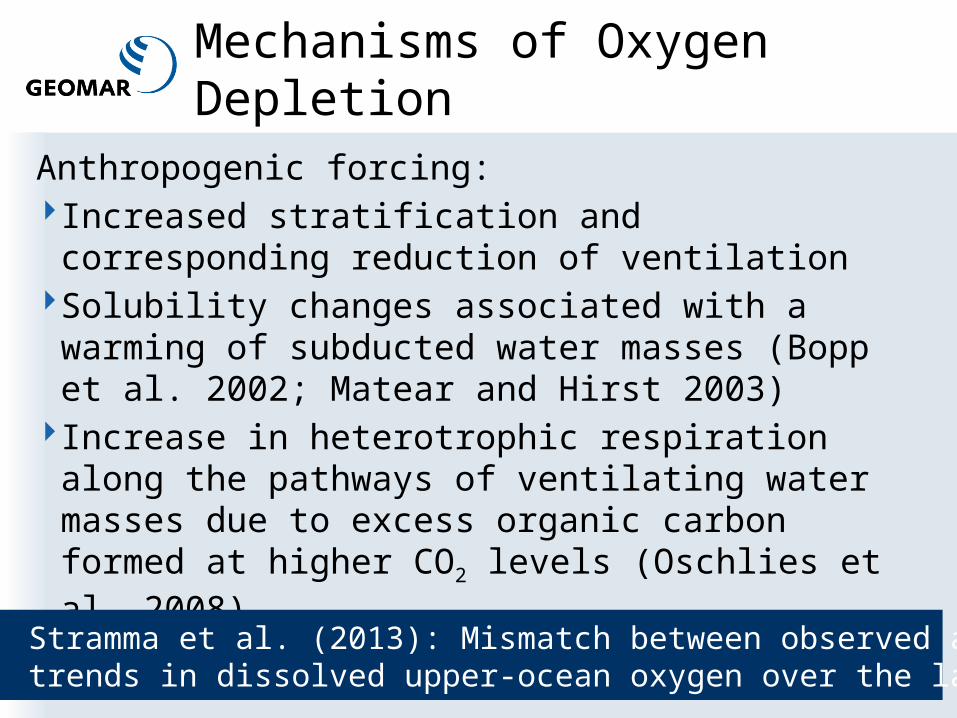
Mechanisms of Oxygen Depletion
Anthropogenic forcing:Increased stratification and corresponding
reduction of ventilationSolubility changes associated with a warming of
subducted water masses (Bopp et al. 2002; Matear and Hirst 2003)
Increase in heterotrophic respiration along the pathways of ventilating water masses due to excess organic carbon formed at higher CO2 levels (Oschlies et al. 2008)
3
Stramma et al. (2013): Mismatch between observed and modeled trends in dissolved upper-ocean oxygen over the last 50 yr
4
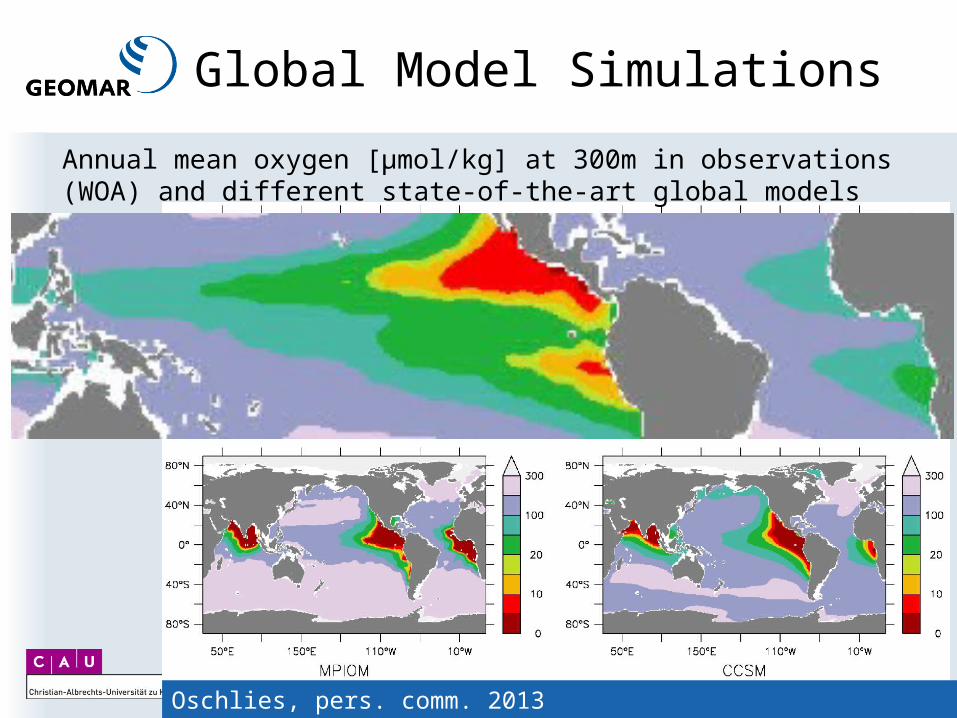
Global Model Simulations
Oschlies, pers. comm. 2013
Annual mean oxygen [μmol/kg] at 300m in observations (WOA) and different state-of-the-art global models
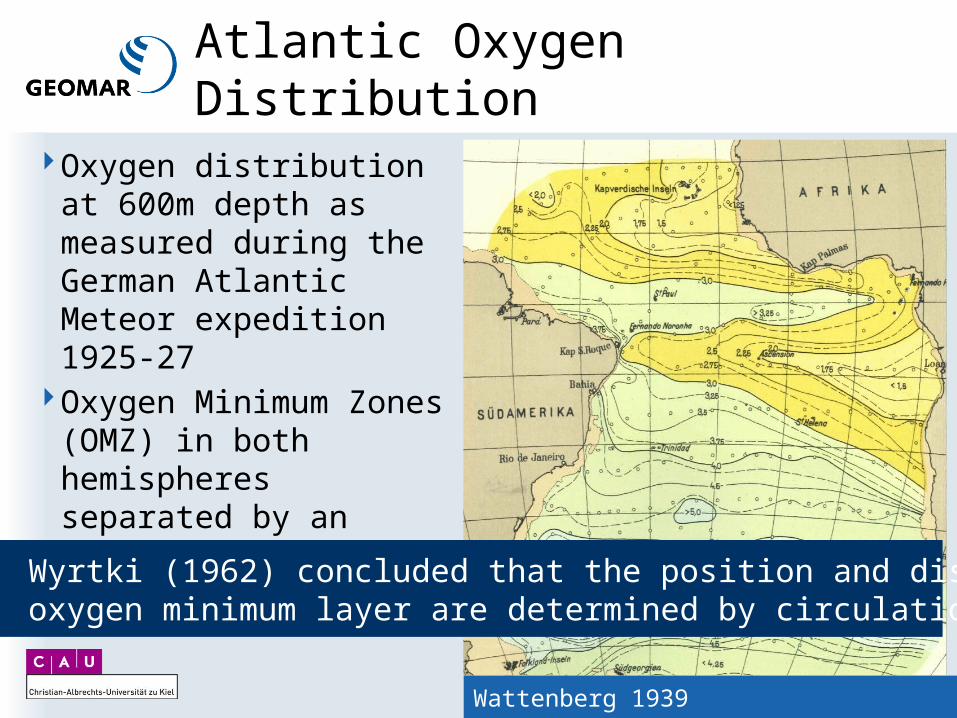
Atlantic Oxygen Distribution
Oxygen distribution at 600m depth as measured during the German Atlantic Meteor expedition 1925-27
Oxygen Minimum Zones (OMZ) in both hemispheres separated by an equatorial oxygen maximum
5Wattenberg 1939
Wyrtki (1962) concluded that the position and distribution of the oxygen minimum layer are determined by circulation
6
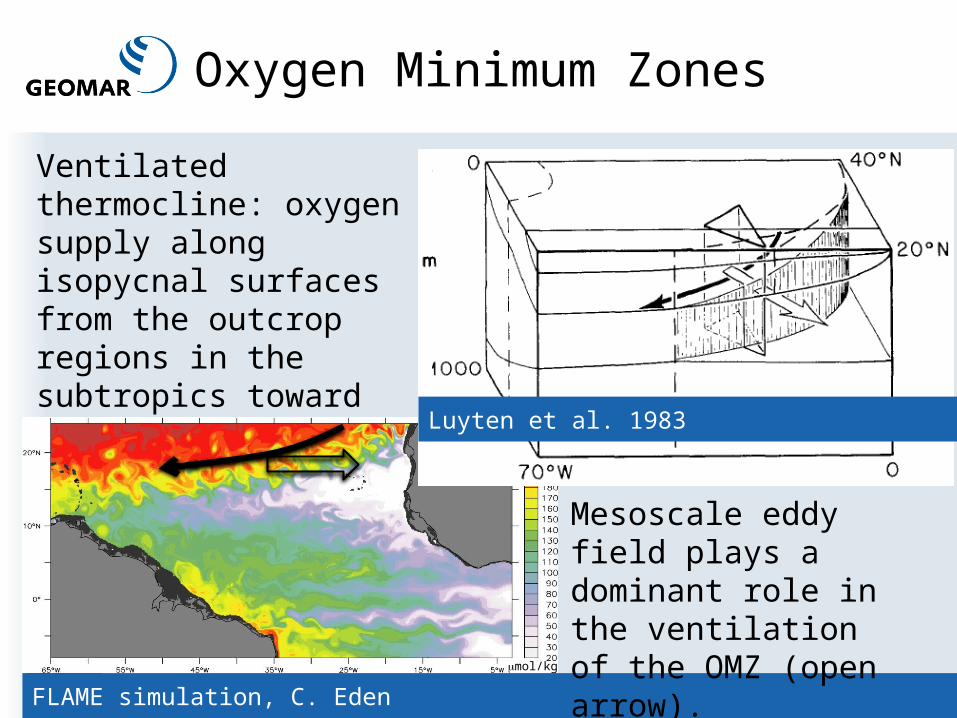
Oxygen Minimum Zones
Ventilated thermocline: oxygen supply along isopycnal surfaces from the outcrop regions in the subtropics toward the equator and the western boundary (solid arrow).
FLAME simulation, C. Eden
mmol/kg
Mesoscale eddy field plays a dominant role in the ventilation of the OMZ (open arrow).
Luyten et al. 1983
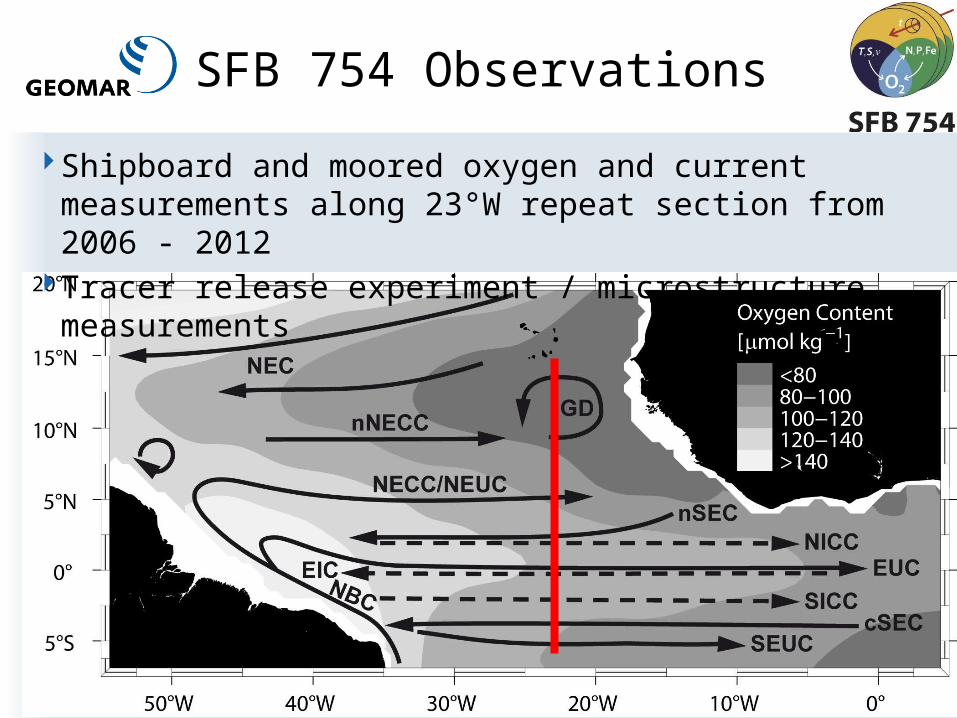
SFB 754 Observations
7
Shipboard and moored oxygen and current measurements along 23°W repeat section from 2006 - 2012
Tracer release experiment / microstructure measurements
Brandt et al. 2010 8
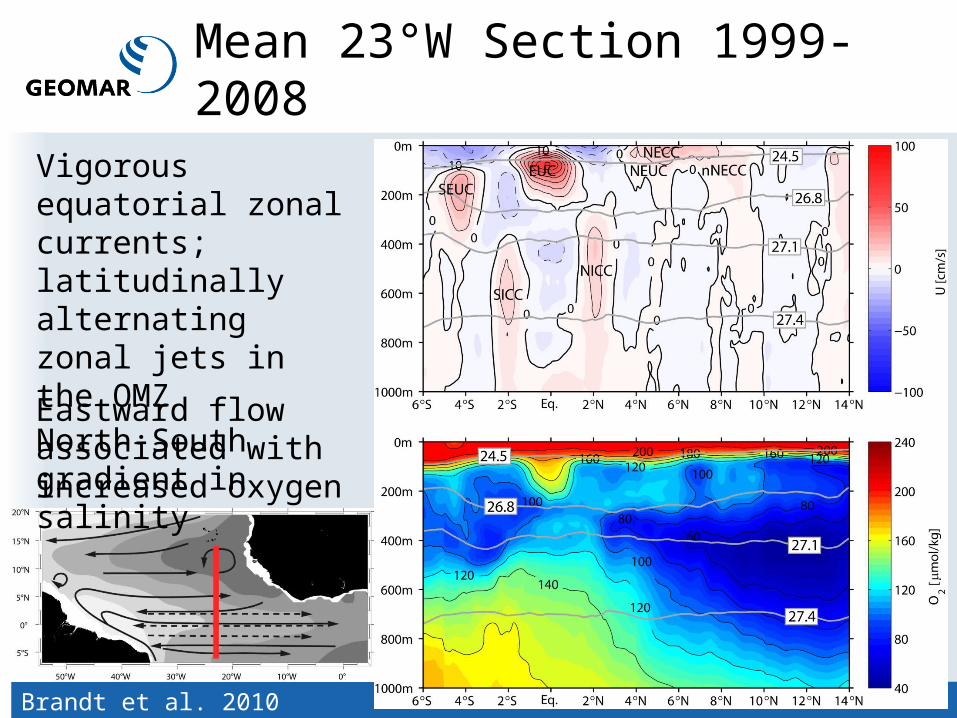
Mean 23°W Section 1999-2008
Vigorous equatorial zonal currents; latitudinally alternating zonal jets in the OMZNorth-South gradient in salinityEastward flow associated with increased oxygen
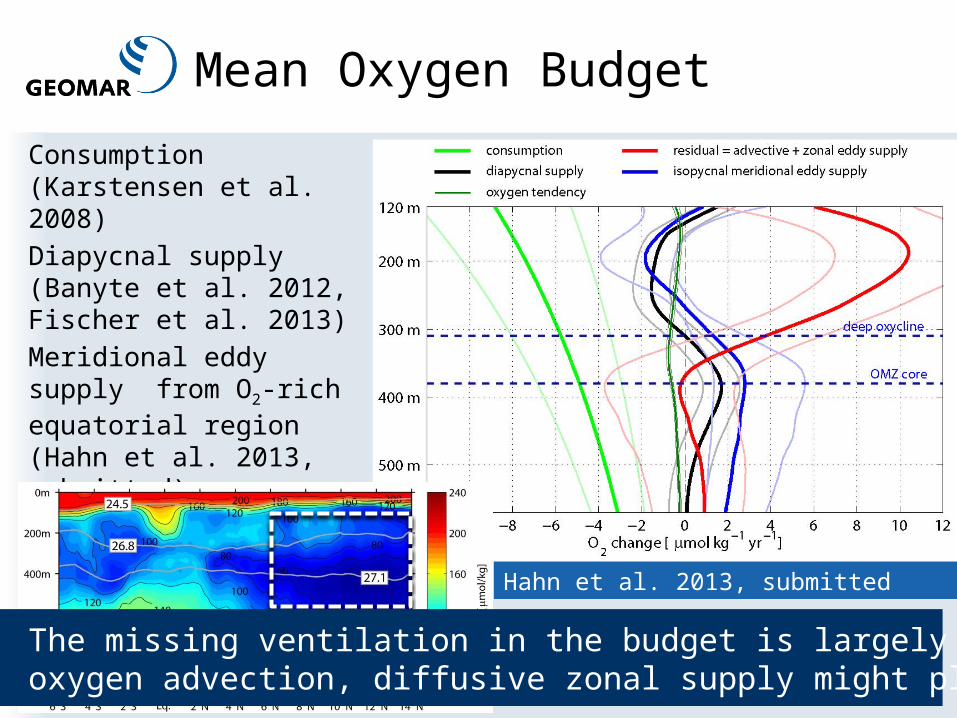
Consumption (Karstensen et al. 2008)Diapycnal supply (Banyte et al. 2012, Fischer et al. 2013) Meridional eddy supply from O2-rich equatorial region (Hahn et al. 2013, submitted)Oxygen tendency from 1972-1985 to 1999-2008 (Brandt et al. 2010)
Mean Oxygen Budget
9
Hahn et al. 2013, submitted
The missing ventilation in the budget is largely due to zonal oxygen advection, diffusive zonal supply might play a minor role
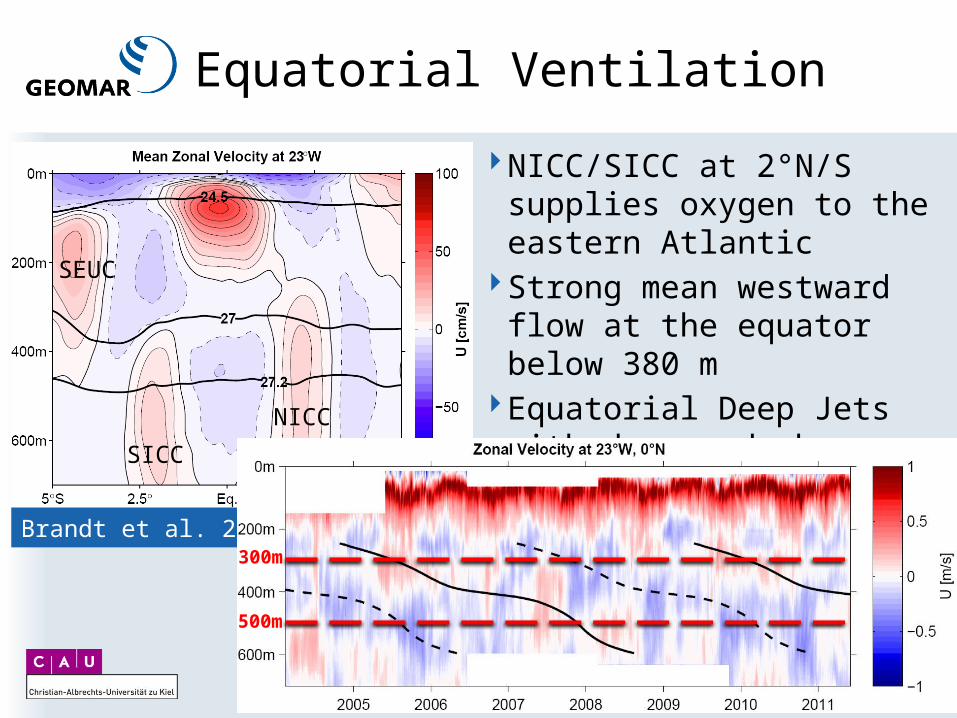
Equatorial Ventilation
NICC/SICC at 2°N/S supplies oxygen to the eastern Atlantic
Strong mean westward flow at the equator below 380 m
Equatorial Deep Jets with downward phase propagation
Brandt et al. 2012
SICC
NICC
SEUC
300m
500m
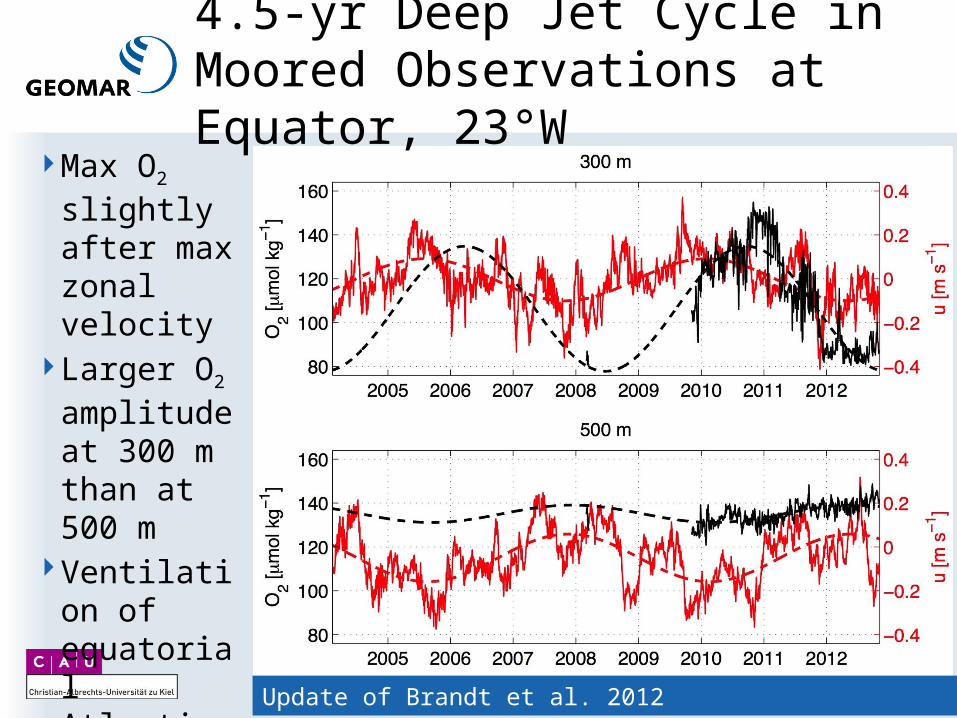
4.5-yr Deep Jet Cycle in Moored Observations at Equator, 23°W
Max O2 slightly after max zonal velocity
Larger O2 amplitude at 300 m than at 500 m
Ventilation of equatorial Atlantic by Deep Jets
11Update of Brandt et al. 2012
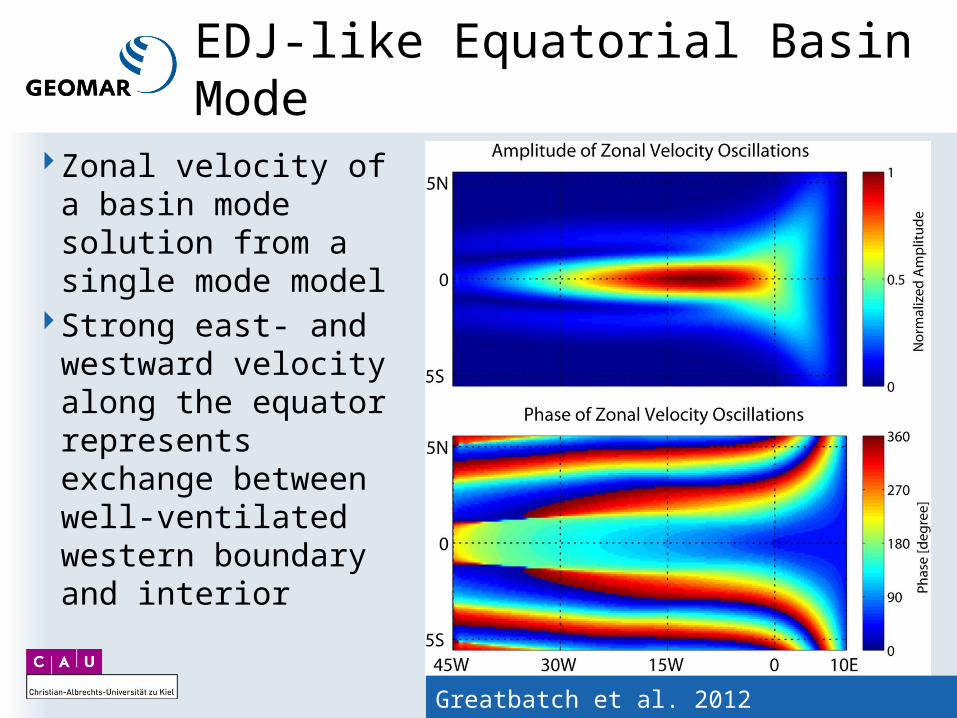
EDJ-like Equatorial Basin Mode
12Greatbatch et al. 2012
Zonal velocity of a basin mode solution from a single mode model
Strong east- and westward velocity along the equator represents exchange between well-ventilated western boundary and interior

Advection-Diffusion Model
Model forced by velocity field of equatorial basin mode, O2 source at the western boundary layer; O2 consumption
13
Consumption × 0.2
Consumption × 5
Mean relative oxygen concentration shows ventilation of the equatorial band due to basin mode oscillations
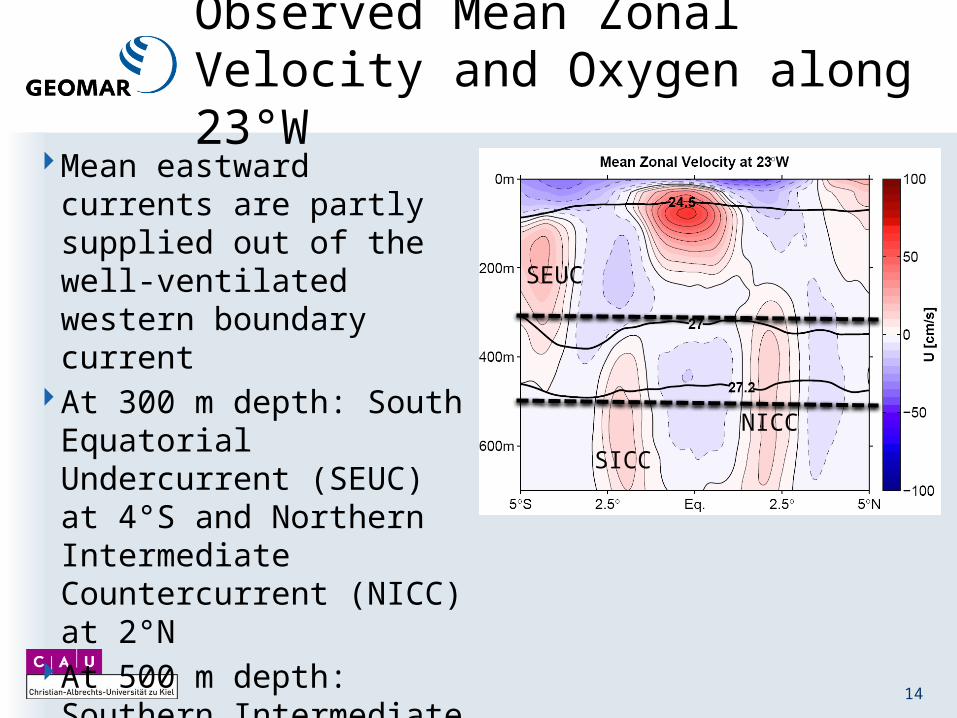
Observed Mean Zonal Velocity and Oxygen along 23°W
Mean eastward currents are partly supplied out of the well-ventilated western boundary current
At 300 m depth: South Equatorial Undercurrent (SEUC) at 4°S and Northern Intermediate Countercurrent (NICC) at 2°N
At 500 m depth: Southern Intermediate Countercurrent (SICC) at 2°S and NICC
14
SICC
NICC
SEUC
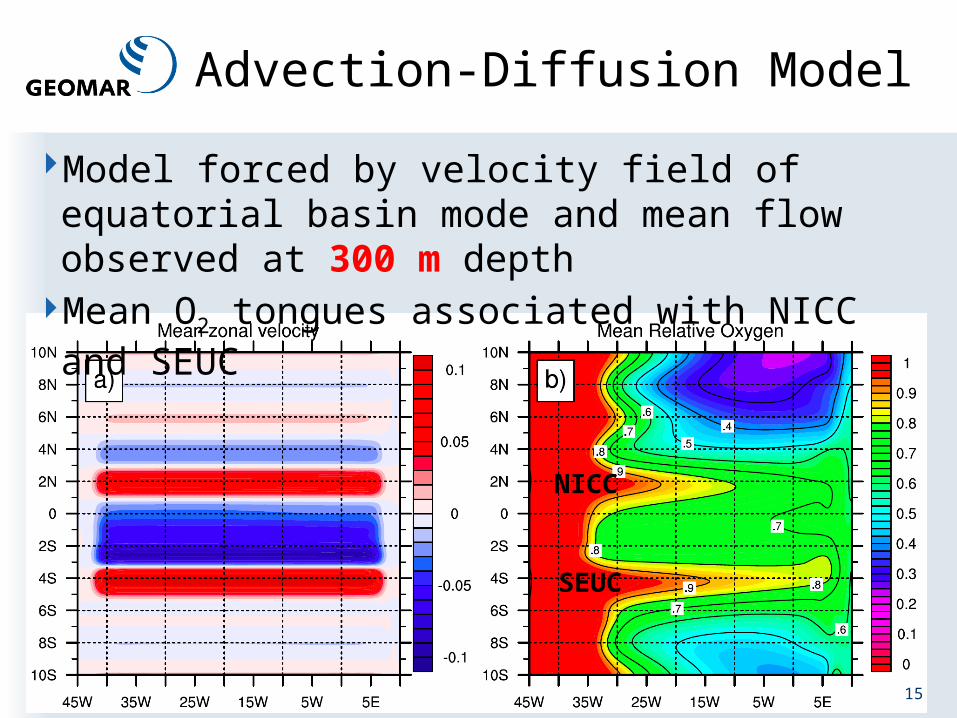
Advection-Diffusion Model
15
Model forced by velocity field of equatorial basin mode and mean flow observed at 300 m depth
Mean O2 tongues associated with NICC and SEUC
NICC
SEUC
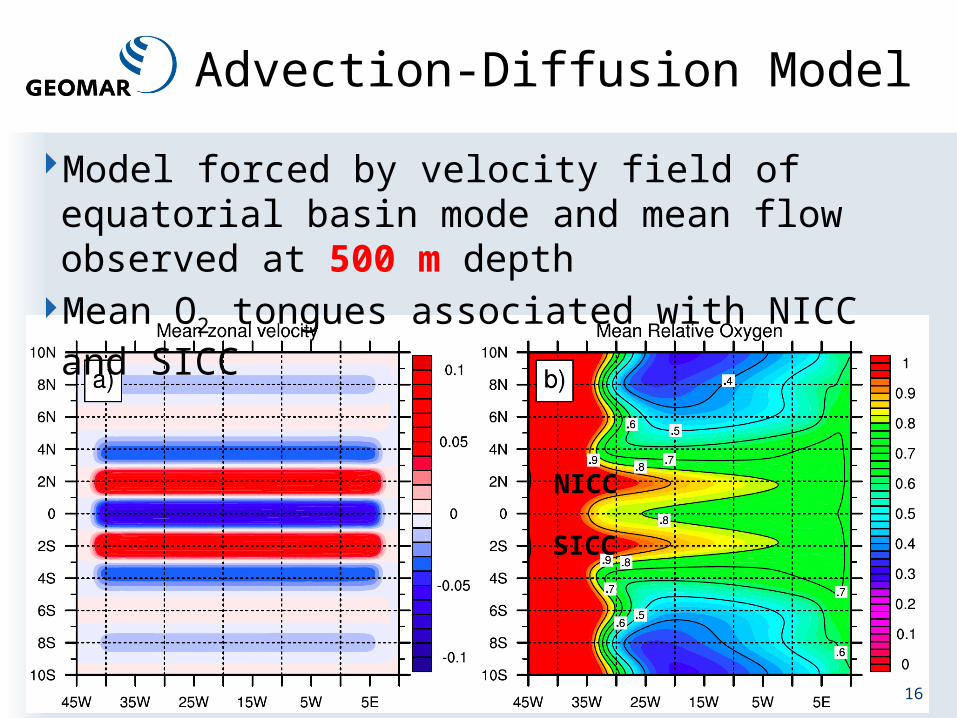
Advection-Diffusion Model
16
Model forced by velocity field of equatorial basin mode and mean flow observed at 500 m depth
Mean O2 tongues associated with NICC and SICC
NICC
SICC
17
Summary
Global models do not correctly capture location and distribution of low-oxygen layer in the tropicsOne obvious reason is the too weak mean and variable intermediate circulation in these simulationsObservations show equatorial oxygen maximum and strong poleward oxygen fluxes toward the OMZs that can be reproduced by idealized simulations with an advection-diffusion modelIf the circulation set the shape of the OMZs, long-term changes in the circulation might also contribute to long-term changes in oxygen concentration
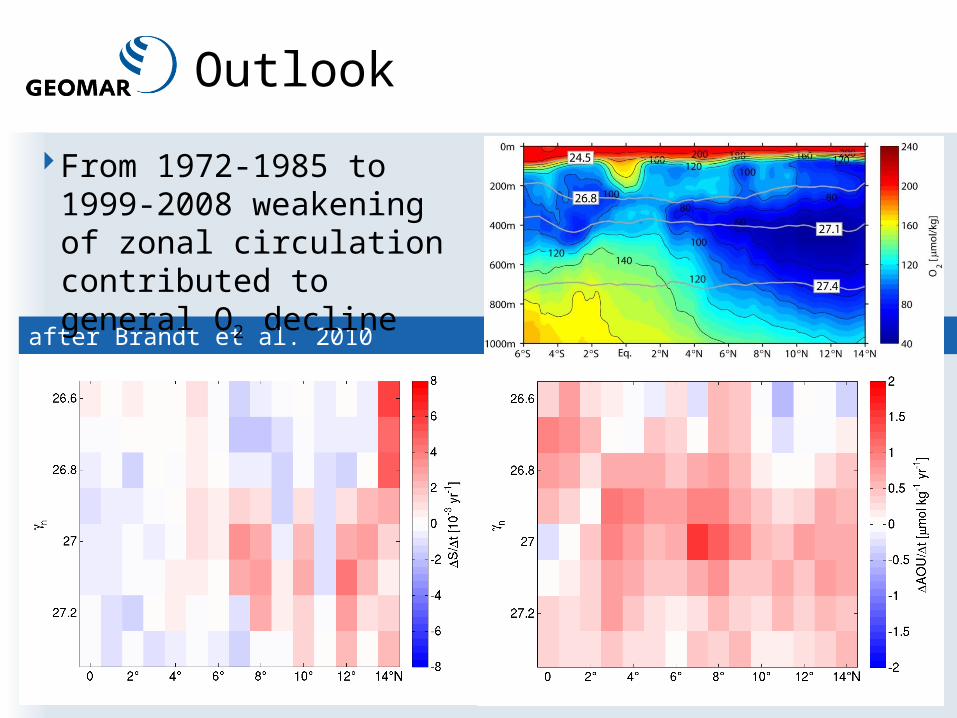
after Brandt et al. 2010
Outlook
From 1972-1985 to 1999-2008 weakening of zonal circulation contributed to general O2 decline
18
19
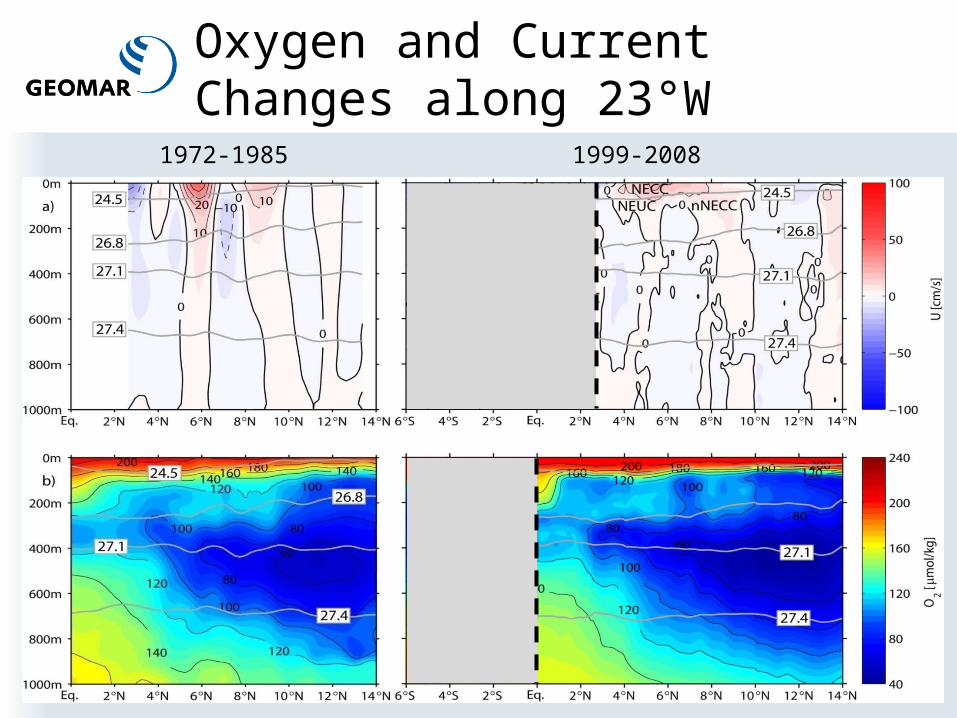
Oxygen and Current Changes along 23°W
1972-1985 1999-2008

Outlook
From 2006 to 2012 stronger changes with O2 decline at the deep oxycline
O2 increase and freshening (more AAIW) below
20
Acknowledgements
This study was supported by the German Science Foundation (DFG) as part of the Sonderforschungsbereich 754 “Climate-Biogeochemistry Interactions in the Tropical Ocean” and by the German Federal Ministry of Education and Research as part of the co-operative projects “NORDATLANTIK” and “RACE”.
Moored velocity and oxygen observations were acquired in cooperation with the PIRATA project.
21