Embed Size (px)
Citation preview

p2- United States @ Department of Agriculture
Forest Service
Northeastern Forest Experiment Station
Resource Bulletin NE-77
Veneer, 1980 -A Periodic Assessment of Regional Timber Output
Robert L. Nevel, Jr.

--
The Author
Robert L. Nevel, Jr., forest products industry specialist, received a B.S. degree in forest technology from The Pennsylvania State University in 1965 and an M.F. degree in wood technology from Yale University in 1968. He then joined the Northeastern Forest Experiment Station's Forestry Sciences Laboratory at Princeton, West Virginia. In June 1978, he transferred to the Forest Inventory and Analysis unit, Broomall, Pennsylvania.
Manuscript received for publication 11 May 1983
Abstract
This periodic evaluation of regional timber output based upon a survey of the veneer plants in the Northeast contains 1980 statistics on veneer-log production and receipts by states and species, log shipments between states and regions, and the production and disposition of the residues generated in the manufacture of veneer. The 156.8 million board feet (684,600 m3) of veneer logs produced in 1980 represented a 19 percent increase in production since 1976 when the last survey was made. The 120.5 million board feet (525,400 m3) of veneer logs received at northeastern mills was 2 percent lower in 1980 than in 1976. Trends in production and an outlook for the industry are also presented along with a list of veneer plants in the Northeast.
Cover Photo
New technologies help the northeastern veneer industry to use more of the local resource, to reduce labor costs, and to make competitive products in the face of lower log quality and higher log prices. The Rutland Plywood Corporation plant in Rutland, Vermont, uses a Morvue computer scanner with its veneer clipper to make all grades and types of hardwood plywood and veneer. The scanner shown in the foreground precisely locates defects in the veneer and relays defect information to computerized controls that monitor the clipper. The system makes fast, precise clipping with less man- power; helps maximize veneer yield; and promotes the use of lower quality logs from all northern hardwood species. (Courtesy of Rutland Plywood Corp., Rutland, Vt.)
The use of trade, firm, or corporation names in this publication is for the information and convenience of the reader. Such use does not constitute an official endorsement or approval by the U.S. Department of Agriculture or the Forest Service of any product or service to the exclusion of others that may be suitable.

Veneer. 1980 -A Periodic Assessment of Regional Timber Output
Table of Contents
Highlights . . . . . . . . . . . . . . . . . . . . . . . . . . . . . . . . . . . . . . . . . . . . . . . . . . . . . . . . 1
Background . . . . . . . . . . . . . . . . . . . . . . . . . . . . . . . . . . . . . . . . . . . . . . . . . . . . . . 1
. . . . . . . . . . . . . . . . . . . . . . . . . . . . . . . . . . . . . . . . . . . . . Veneer Industry Profile 1
. . . . . . . . . . . . . . . . . . . . . . . . . . . . . . . . . . . . . The Container Veneer Industry 2 . . . . . . . . . . . . . . . . . . . . . . . . . . . . . . . . . . . The Commercial Veneer Industry 3
. . . . . . . . . . . . . . . . . . . . . . . . . . . . . . . . . . . . . The Specialty Veneer Industry 3
The Veneer Log Harvest Continued to Rise-Plant Receipts Dropped Slightly . . 4
. . . . . . . . . . . . . . . . . . . . . . . . . . . . . . . . . . . . The Harvest Jumped 19 Percent 4 . . . . . . . . . . . . . . . . . . . . . . . . . . . . . . . . . . . . . . . . . . Harvest Characteristics 6
. . . . . . . . . . . . . . . . . . . . . . . . . . . . . . . . . . . Mill Receipts Dropped 2 Percent 7
. . . . . . . . . . . . . . . . . . . . . . . . . . . . . . . Interregional and Interstate Shipments 7
. . . . . . . . . . . . . . . . . . . . . . . . . . . . . . Nearly All Manufacturing Residues Used 8
. . . . . . . . . . . . . . . . . . . . . . . . . . . . . . . . . . . . . . . The Industry Outlook Is Mixed 8
. . . . . . . . . . . . . . . . . . . . . . . . . . . . . . . . . . . . . . . . . . . . . . Literature References 11
. . . . . . . . . . . . . . . . . . . . . . . . . . . . . . . . . . . . . . . . . . . . . . . . Definition of Terms 11
. . . . . . . . . . . . . . . . . . . . . . . . . . . . . . . . . . . . . . . . . . . . . . . . . . . . . . . . Species 11 . . . . . . . . . . . . . . . . . . . . . . . . . . . . . . . . . . . . . . . . . . . . . . . . . . . . Manufacture 11
. . . . . . . . . . . . . . . . . . . . . . . . . . . . . . . . . . . . . . . . . . . . . . . . . . . . . . . Residues 11
. . . . . . . . . . . . . . . . . . . . . . . . . . . . . . . . . . . . . . . . . . . . . . . . . . . . . . . . . . . Tables 12
. . . . . . . . . . . . . . . . . . . . . . . . . . . . . . . . . . . . . . Veneer Plants in the Northeast 16

Highlights
The 1980 veneer industry survey in the Northeast showed that since 1976:
Veneer log production rose 19 percent to 157 million board feet (684,600 m3).l
Veneer log receipts at northeastern veneer mills dropped 2 percent to 120 million board feet (525,400 m3).
There were five fewer plants operating in the Northeast.
The Northeast continued to grow as a net exporter of veneer logs, exporting more than 36 million board feet (158,300 m3) more logs than it received from outside the region.
'Based on recent timber and utilization surveys conducted by the USDA Forest Service in the Northeast, 1,000 board feet (International %-inch rule) equals 4.36 m3.
Background
The U.S. Department of Agricul- ture, Forest Service, conducts forest and forest-products industry surveys to provide current information on the timber and related resources of the Nation. Periodically in the Northeast, production and consumption of a single timber product is surveyed to determine the product's impor- tance in relation to the entire timber- products industry in the region. The manufacture of veneer ranks third in the region, as measured by annual receipts of industrial timber prod- ucts, such as sawlogs, pulpwood, veneer logs, and other roundwood. The most recent assessment of the veneer industry was in 1976. More recent evaluations of the timber- products industry conducted along with reappraisals of the entire timber resource of various states indicate change has been occurring within the veneer industry.
Recently, the Northeastern For- est Experiment Station contacted all operating veneer plants in the North- eastern states (Connecticut, Dela- ware, Kentucky, Maine, Maryland, Massachusetts, New Hampshire, New Jersey, New York, Ohio, Pennsylvania, Rhode Island, Vermont, and West Virginia) for 1980 plant receipts (see list of plants page 16). This survey was coordinated with a similar survey in the North Central region.
lnformation on wood receipts was exchanged with neighboring experiment stations to assure com- plete coverage by the Northeastern Station. Veneer mills within the region and possible out-of-state consumers of Northeastern veneer logs were mailed questionnaires. After three mailings, nonresponding plants were contacted by telephone by the Sta- tion's personnel. Veneer log ship- ments to and from Canada were similarly determined. Veneer logs harvested and exported overseas through log brokers or concentrators are difficult to trace accurately and were not included in the survey.
lnformation and analysis of veneer log use and the veneer indus- try are provided on a continuing basis. Members of the veneer, veneer log, and timber industries and those in association with these industries will find the material useful in their evaluations of state and regional timber and log supply, harvest, and use, especially for hardwoods. About one-sixth of the Nation's veneer hardwood logs are harvested and used in the Northeast as compared to less than 2 percent of all veneer logs and leas than 1 percent of the softwoods.
This report deals mainly with statistics for 1980, the calendar year
of the latest veneer-industry survey, and 1976, the calendar year of the last canvass. Reference is made to statistics of the earlier surveys in 1963, 1968, 1972, and 1976 where appropriate for comparison.
Long-term trends will be dis- closed by repeated surveys in the future. Addifional related information may be available for individual states for intervening years from reports of the Station's statewide forest- products industry surveys.
Veneer Industry Profile
Three broad classes of veneer manufacturers in the Northeast based on the industries they serve and the products they make are: (1) commer- cial and face veneer plants producing veneer for the plywood and furniture industries; (2) container veneer manu- facturers fabricating boxes, baskets, and similar containers, mostly for shipping produce; and (3) specialty veneer mills producing hundreds of miscellaneous items, such as bever- age stirrers, business cards, spoons, tongue depressors, and toothpicks.
In 1980, 36 active veneer plants were scattered throughout 10 of the northeastern states. The mills were concentrated most heavily in New England-mostly in south-central Maine and in Vermont. The mills were located near veneer-log sources or product markets, or adequate trans- portation and favorable labor-con- siderations that determine the type and location of a plant. Proximity of log sources, inexpensive labor, and product markets are more important to container plants than to manufac- turers of commercial and face veneer. The manufacture of this veneer is more exacting in its requirements, and the 20 manufacturers are willing to pay more to get the logs and to make and distribute their products. Most of the five container plants buy and sell locally in agricultural areas. The 11 specialty veneer plants are located near the required species and major transportation.

Some characteristics of the three classes of veneer plants in the Northeast in 1980 were:
Class of veneer plant
Characteristics Commercial and face Container Specialty
Volume of log receipts Major species received
Size of log procurement area Plant location
Product market areas
4.2 million board feet per plant Red and white oaks, yellow birch, and yellow pine From 3- to 16-state area Evenly scattered throughout Northeast Eastern population and Southeastern furniture industry
0.4 million board feet per plant Beech, white birch, and soft maple
From consuming or neighboring state Atlantic Coastal Plain or bordering Great Lakes Local agricultural areas
3.2 million board feet per plant White birch and hard maple
From 3- to 5-state area Mostly Maine
Nationwide
There were 33 fewer active veneer plants in the Northeast in 1980 than there were in 1963 (Fig. 1). Two-thirds of the drop resulted from the closure of container plants; the balance of the decline was due primarily to clos- ings of commercial veneer plants. The number of specialty veneer plants has remained relatively constant throughout the period.
There were 41 active veneer mills in the Northeast during the previous 1976 industry survey. Since then, the total number of active plants dropped to 36. Seven veneer plants had closed including five commercial mills, one specialty mill, and one container mill; and two commercial mills ~ p e n e d . ~
The Container Veneer Industry
In 1963, nearly 30 container veneer plants were scattered from Ohio to Vermont. After 17 years less than one-fifth as many were located only in Ohio and Pennsylvania. Six- teen plants had closed between 1963 and 1972; four more closed by 1976; and another closed by 1980.2
=The closing of the specialty and con- tainer mills is not readily obvious from the numbers in figure 1. One mill formerly classified as a container mill was consid- ered to be a specialty mill in the 1980 survey due to the unique products it manufactures.
Figure 1.-Number of veneer plants operating in the Northeast, by class of plant, for selected years.
40 Commercial
-- Container
I
\ \ \
8 * - 4 I - -'\ --.-
I I

Over the years, declining use of wooden containers and a lack of skilled labor forced the closing of most container veneer plants. Demand has dropped with the replacement of family farms by agribusinesses and the increased cost of wooden containers. Large-scale agribusi- nesses use automated harvesting and transporting equipment and cor- rugated shipping containers. The high cost of labor and material to produce wooden containers has made them uneconomical for use by fruit and vegetable producers. And, road- side produce retailers prefer to use paper bags and plastic goods to mini- mize packaging costs. The assembly of wooden containers is labor inten- sive, requiring highly skilled workers who are difficult to replace.
The Commercial Veneer Industry
The number of active commercial veneer plants rose in the mid-1960's along with plywood consumption in the United States. There were 36 such plants in the Northeast in 1968. The number of plants then dropped throughout the 1970's despite relative stable consumption, and in 1980 there were only 20 plants.
The closing of the plants was re- lated to activity surrounding the hard- wood plywood market. From 1960 to 1968, the importation of hardwood ply- wood increased slightly every year to meet increasing demand with little or no detriment to domestic shipments. From 1968 to 1980, domestic con-
sumption of hardwood plywood aver- aged 5.6 billion square feet per year,= but increased foreign dominance of the hardwood plywood market con- tinued to take its toll on domestic shipments and the commercial veneer industry in the Northeast. According to the Forest Products Review and the U.S. Bureau of the Census, U.S. consumption and importation of hard- wood plywood more than quadrupled between 1960 and 1972, but domestic shipments only more than doubled. By 1972, when domestic demand for hardwood plywood peaked at 8.1 bil- lion square feet, imported hardwood made up over three-fourths of the annual consumption, and the number of northeastern mills dropped to 26. The penetration and continued domi- nance of the United States hardwood plywood market by foreign manufac- turers brought about the closing of many domestic plants and the reloca- tion of manufacturing facilities over- seas. By 1980, as a result of the recent long-term worldwide economic slow- down, domestic hardwood plywood consumption dropped to less than 3% billion square feet, and three less commercial veneer plants were in the Northeast.
The importation of hardwood plywood dropped much more than domestic consumption. Both declined because of the drop in housing and construction requirements, the rise in hardwood plywood prices, and the
30ne square foot equals .00929 m2.
increased use of hardboard, particle- board, and medium-density fiberboard, and other laminated products. In 1980, when consumption was slightly over 40 percent of the record high 1972 level, demand for domestic hardwood plywood had dropped less than 40 percent, while demand for similar imported products dropped 63 percent.
If the economy improves over the next few years, it seems that the status of the commercial veneer industry in the Northeast will also improve, but not significantly. The industry will still be facing increasing costs and competition from manu- facturers of alternative products.
The Specialty Veneer Industry
The specialty veneer mills provide stability to the wood-using industry because the species they use and the products they make seldom change. These mills, which have remained nearly constant since 1963, make up 31 percent of all the veneer mills in the Northeast. In 1980, 7 of the 11 specialty veneer mills were located in central and southern Maine; the rest were located within 400 miles of these in New Hampshire, Vermont, and New York. For the most part, white birch and hard maple are used to make such items as toothpicks, ice cream spoons, tongue depressors, stirrers, and the like. One specialty mill used a variety of species to make parts for a manufacturer of large industrial reels.

The Veneer Log Harvest Continued to Rise- Plant Receipts Dropped Slightly
The Harvest Jumped 19 Percent
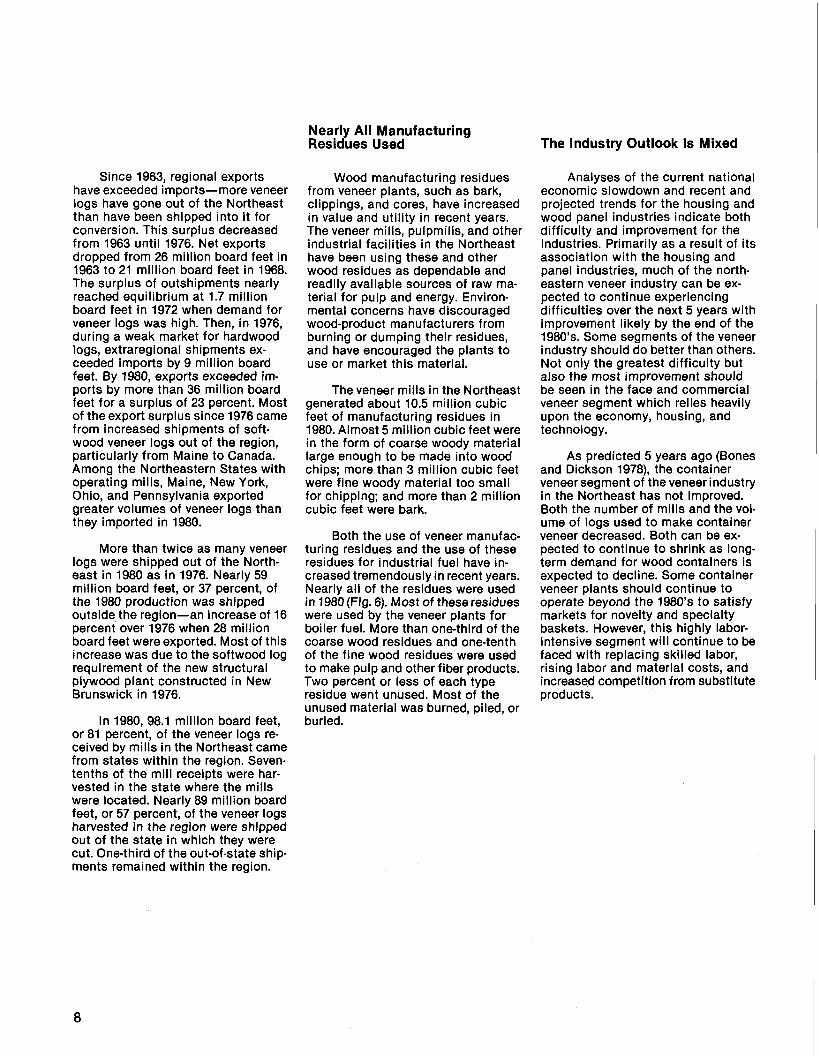
The volume of veneer logs cut in the Northeast in 1980 was nearly 157 million board feet-a jump of 19 per- cent since 1976 and over 25 percent since the recent low of 123 million board feet in 1972 (Fig. 2). The harvest was higher since 1976 in 11 of the 13 states where veneer logs were cut. Historically, veneer logs have never been produced in Rhode Island. Indi- vidual gains for the states ranged from less than 1 percent in Ohio to over 100 percent in Connecticut and West Virginia. The percentage of production decreased very slightly in Maine and significantly in New Jersey, which produced only 300,000 board feet in 1980. Maine, Maryland, New York, and Pennsylvania continued to report the largest individual har- vests. Each of these states produced at least 20 million board feet of veneer logs in 1980. Their harvests totaled 112.8 million board feet for 72 percent of the veneer logs produced in the Northeast (Fig. 3).
During the last 18 years, most of the veneer log production in the Northeast has gone to producers of commercial and face veneer (Fig. 4). Nearly 80 percent-124 million board feet-of the region's veneer logs went to these plants in 1980 (Figs. 3 and 4). The volume of logs cut for these plants was up 55 percent over 1976 when 80 million board feet, or 60 percent, of the total northeastern veneer log harvest went to these mills. In 1980, about 22 million board feet, or 14 percent, of the total har- vest went to specialty veneer mills; and half as much went to container producers.
Figure 2.-Veneer log production and receipts in the Northeast for selected years.
180
--- Receipts
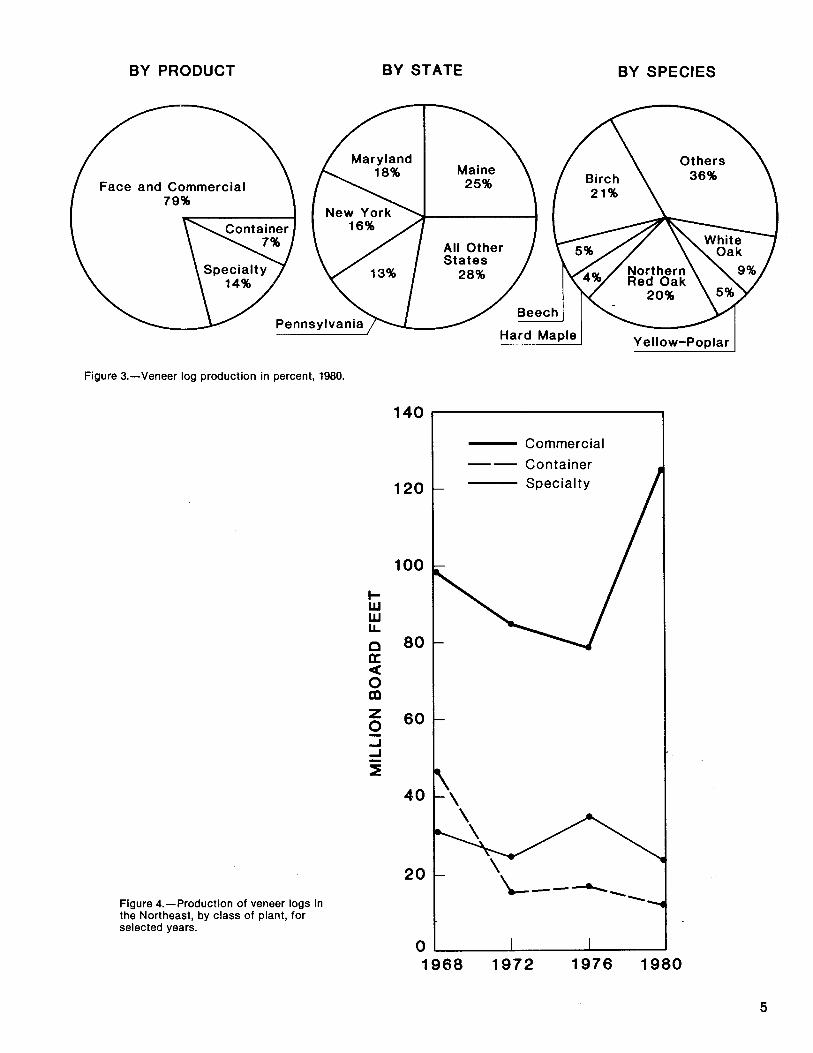
BY PRODUCT BY STATE BY SPECIES
Face and Commercial
Yellow-Poplar
Figure 3.-Veneer log production in percent, 1980.
140
- Commercial -- Container
-
- \ \
Figure 4.-Production of veneer logs in the Northeast, by class of plant, for selected years.
Harvest Characteristics
Between 1976 and 1980, the harvest of veneer logs for the com- mercial and specialty mills differed from the previous 8 years. From 1968 through 1976, veneer log production for the commercial and face veneer mills decreased. Since 1976, the harvest for these mills rose. Most of this rise resulted from increased shipments from Maine and New York to Canadian firms near the interna- tional border. By 1976, log production for the specialty veneer mills had risen to a high for the period; it fell to a new low by 1980.
Additionally, the production of veneer logs to container mills con- tinued to drop over the 12-year period since 1968. Drops in the harvests for logs for both the container and the specialty veneer mills were over 34 percent between 1976 and 1980. These drops represent a significant decrease in demand for both container and specialty veneer, resulting from de- creased demand for products from northeastern-based mills and the loss of some markets to substitute products.
About 40 million board feet of veneer logs continue to be harvested annually in Maine. In 1980, this volume made up one-fourth of the production total for the Northeast (Fig. 3). Over half (21.7 million board feet) of the state's volume went to make commer- cial veneer and the rest was used by specialty veneer mills. The 18.2 mil- lion board feet that went to specialty veneer plants comprised 82 percent of the harvest for these mills.
The logs that went to commercial mills were mostty spruce and fir, while those that went to specialty mills were mostly white birch. With all of its harvest going to commercial and face veneer mills, Maryland re- mained the second largest producer of veneer logs in 1980. Maryland produced 18 percent (28.3 million board feet) of the region's total har- vest, 53 percent of which was from
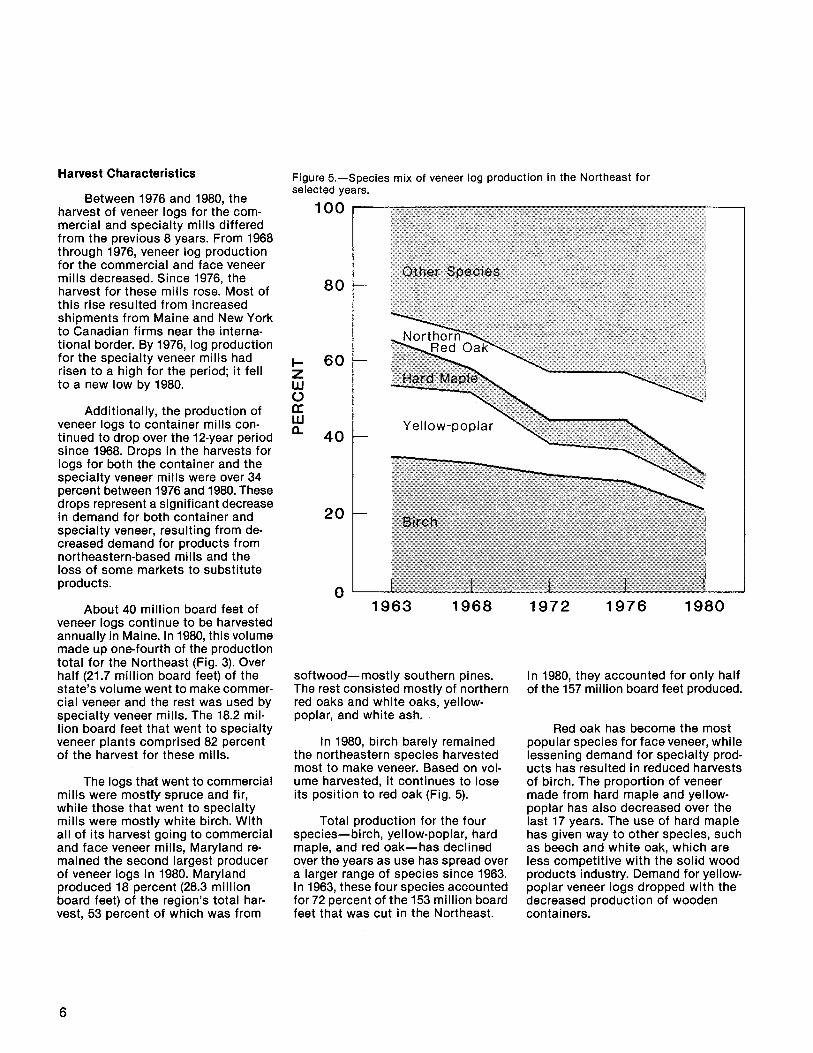
Figure 5.-Species mix of veneer log production in the Northeast for selected years.
100
softwood-mostly southern pines. The rest consisted mostly of northern red oaks and white oaks, yellow- poplar, and white ash.
In 1980, birch barely remained the northeastern species harvested most to make veneer. Based on vol- ume harvested, it continues to lose its position to red oak (Fig. 5).
Total production for the four species-birch, yellow-poplar, hard maple, and red oak-has declined over the years as use has spread over a larger range of species since 1963. In 1963, these four species accounted for 72 percent of the 153 million board feet that was cut in the Northeast.
In 1980, they accounted for only half of the 157 million board feet produced.
Red oak has become the most popular species for face veneer, while lessening demand for specialty prod- ucts has resulted in reduced harvests of birch. The proportion of veneer made from hard maple and yellow- poplar has also decreased over the last 17 years. The use of hard maple has given way to other species, such as beech and white oak, which are less competitive with the solid wood products industry. Demand for yellow- poplar veneer logs dropped with the decreased production of wooden containers.

Photo caption
All species of northern hardwood veneer logs are used throughout the Northeast to produce all types and grades of hard- wood plywood. (Courtesy of Rutland Plywood Corp., Rutland, Vermont)
In 1980, the preferred hardwood species were birch, red oak, white oak, beech, hard maple, and yellow- poplar, accounting for 64 percent of the harvest in the Northeast (Fig. 3). Softwoods made up nearly 60 percent of the balance and nearly one-fourth of the total production. Most of the softwood production was from Mary- land's southern pine and Maine's spruce forests.
Ash, basswood, and elm regis- tered production gains of 100 percent or more between 1976 and 1980. The largest volume gains were shown in red and white oak, which accounted for 29 percent of the harvest. Produc- tion for each of these two species nearly doubled, nearly reaching 32 million board feet for red oak and 14 million board feet for white oak. The largest declines in harvest occurred with beech, birch, hard maple, and yellow-poplar. The softwood veneer
log harvest rose 82 percent in the last 4 years to nearly 40 million board feet.
Mill Receipts Dropped 2 Percent
Veneer plants in the Northeast received 120.5 million board feet of veneer logs in 1980. This was about 2% million board feet, or about 2 per- cent, less than the amount received in 1976 and 1972. Veneer log receipts rose in only three states-Maryland, Ohio, and West Virginia. West Virginia registered the largest gain-increas- ing fivefold, or nearly 20 million board feet-to account for one-fifth of the region's total receipts. Over half of the logs, mostly hardwood, received by the state's three face veneer mills came from other states in the region; and about one-fifth came from within the state. Four of the-other 11 north- eastern states had no operating veneer plants.
Interregional and Interstate Shipments
The movement of veneer logs within, into, and out of the Northeast depends on the type and location of the plants receiving the logs. Most veneer logs going to container and specialty mills are harvested nearby. In 1980, most of the logs used by Maine's specialty veneer producers were cut in the state. Often, in other states, where commercial or face veneer is made, veneer log exports and imports are high. Many of the logs used to make the veneer are shipped great distances; little of the veneer log harvest may go to the local commercial or face veneer plants. These mills need a supply of quality logs of particular species not always available within the state where the veneer is made. Hard maple and yel- low birch logs from Vermont may be harvested for plants in West Virginia, which may also receive gum and yellow-poplar from Maryland and ash and black cherry from Pennsylvania.
Since 1963, regional exports have exceeded imports-more veneer logs have gone out of the Northeast than have been shipped into it for conversion. This surplus decreased from 1963 until 1976. Net exports dropped from 26 million board feet in 1963 to 21 million board feet in 1968. The surplus of outshipments nearly reached equilibrium at 1.7 million board feet in 1972 when demand for veneer logs was high. Then, in 1976, during a weak market for hardwood logs, extraregional shipments ex- ceeded imports by 9 million board feet. By 1980, exports exceeded im- ports by more than 36 million board feet for a surplus of 23 percent. Most of the export surplus since 1976 came from increased shipments of soft- wood veneer logs out of the region, particularly from Maine to Canada. Among the Northeastern States with operating mills, Maine, New York, Ohio, and Pennsylvania exported greater volumes of veneer logs than they imported in 1980.
More than twice as many veneer logs were shipped out of the North- east in 1980 as in 1976. Nearly 59 million board feet, or 37 percent, of the 1980 production was shipped outside the region-an increase of 16 percent over 1976 when 28 million board feet were exported. Most of this increase was due to the softwood log requirement of the new structural plywood plant constructed in New Brunswick in 1976.
In 1980, 98.1 million board feet, or 81 percent, of the veneer logs re- ceived by mills in the Northeast came from states within the region. Seven- tenths of the mill receipts were har- vested in the state where the mills were located. Nearly 89 million board feet, or 57 percent, of the veneer logs harvested in the region were shipped out of the state in which they were cut. One-third of the out-of-state ship- ments remained within the region.
Nearly All Manufacturing Residues Used
Wood manufacturing residues from veneer plants, such as bark, clippings, and cores, have increased in value and utility in recent years. The veneer mills, pulpmills, and other industrial facilities in the Northeast have been using these and other wood residues as dependable and readily available sources of raw ma- terial for pulp and energy. Environ- mental concerns have discouraged wood-product manufacturers from burning or dumping their residues, and have encouraged the plants to use or market this material.
The veneer mills in the Northeast generated about 10.5 million cubic feet of manufacturing residues in 1980. Almost 5 million cubic feet were in the form of coarse woody material large enough to be made into wood chips; more than 3 million cubic feet were fine woody material too small for chipping; and more than 2 million cubic feet were bark.
Both the use of veneer manufac- turing residues and the use of these residues for industrial fuel have in- creased tremendously in recent years. Nearly all of the residues were used in 1980(Fig. 6). Most of theseresidues were used by the veneer plants for boiler fuel. More than one-third of the coarse wood residues and one-tenth of the fine wood residues were used to make pulp and other fiber products. Two percent or less of each type residue went unused. Most of the unused material was burned, piled, or buried.
The Industry Outlook Is Mixed
Analyses of the current national economic slowdown and recent and projected trends for the housing and wood panel industries indicate both difficulty and improvement for the industries. Primarily as a result of its association with the housing and panel industries, much of the north- eastern veneer industry can be ex- pected to continue experiencing difficulties over the next 5 years with improvement likely by the end of the 1980's. Some segments of the veneer industry should do better than others. Not only the greatest difficulty but also the most improvement should be seen in the face and commercial veneer segment which relies heavily upon the economy, housing, and technology.
As predicted 5 years ago (Bones and Dickson 1978), the container veneer segment of the veneer industry in the Northeast has not improved. Both the number of mills and the vol- ume of logs used to make container veneer decreased. Both can be ex- pected to continue to shrink as long- term demand for wood containers is expected to decline. Some container veneer plants should continue to operate beyond the 1980's to satisfy markets for novelty and specialty baskets. However, this highly labor- intensive segment will continue to be faced with replacing skilled labor, rising labor and material costs, and increased competition from substitute products.

COARSE RESIDUE FINE RESIDUE BARK RESIDUE
Not Used I%\
Industrial Fuel
Other 1 % Not Used 1%
Figure 6.-Disposition of veneer plant residues in percent, 1980.
The volume of logs used to make specialty veneer has decreased in recent years, but the number of pro- ducers of specialty veneer products has remained constant. Although this segment has not done as well as expected over the last several years, stability is expected. The northeastern manufacturers of these unique and superior products have nationwide distribution, a wide range of market and product alternatives, and proxim- ity to adequate wood supply. Also, no new major competition or additional loss of markets is expected. Markets and consumer preference for these products should remain steady, and potential competitors will continue to be reluctant to enter this nongrowth area.
I believe the face and commercial veneer segment of the northeastern veneer industry will face the greatest difficulty over the next few years; and the segment will have the greatest impact on the veneer industry in the Northeast. improvements in this segment will depend much on an economic upturn, additional markets, innovative marketing efforts, an im- proved housing market, improved technology, the ability to compete with substitute and foreign products, and improved export markets. Al- though it is unlikely that certain parts of the face and commercial veneer segment will return to previous levels by the end of the 1980's, any improve- ment in this segment will have a significant effect on Northeastern
I / Not Used 2% 1 Other
veneer log production and consump- tion. The commercial and face veneer industry in the Northeast currently use over 3 times as many veneer logs as the specialty veneer segment, over 7 times as many as the container veneer segment, and about one- seventh of the nation's hardwood veneer logs.
The health of the face and com- mercial veneer segment depends mostly on the general health of the economy and the housing market. A good housing market is required for strong or increased demand for ply- wood and veneer, especially hard- wood. Historically, the housing market comprises about half of the plywood market. Prolonged high inflation and
high interest rates brought about record-low housing starts, and high costs and reduced product demand to the commercial veneer industry. Housing starts have dropped steadily from over 2 million in 1978 to 1.1 million in 1981. It is estimated that housing starts for 1982 will be at least as low as the record low of 1,050,000 in 1946. U.S. shipments of domes- tically produced hardwood plywood have similarly dropped from nearly 1.4 billion square feet in 1978 to 1.1 in 1981 (U.S. Bureau of the Census 1978-81).
Until the nation's economy and the housing market improve signifi- cantly, the northeastern commercial veneer industry will continue to find some relief in the continued relative strength of markets other than new housing. These markets, including home repair and remodeling, nonresi- dential and industrial construction, and exports to other countries, have remained fairly stable throughout the recession. Plywood manufacturers and associations have been succeed- ing in joint efforts in these markets. Exports of hardwood plywood have risen from 33 million square feet in 1979 to 55 million square feet in 1981, while imports dropped by half from 4 billion square feet for the same period (U.S. Bureau of the Census 1980 and 1982). Plywood demand dropped 12 percent in 1981, while
demand for new housing dropped 35 percent (Lewis 1982). Even if fewer and smaller single-family houses are built in the future, the houses and multi-family dwellings will require hardwood plywood products such as paneling, doors, cabinets, and floor- ing, which use most of the Northeast's veneer output.
New technologies must continue to be developed in the commercial and face veneer industry to use more of the local resource, to reduce labor costs, and to make more competitive products in the face of lower log qual- ity and higher log prices. To augment both quantity and quality in produc- tion, work has been aimed at the handling of small logs, automation and computerizing equipment, and varying veneer thickness.
One major advance in technology has been the use of a paper face or vinyl laminate on a hardwood plywood substrate to simulate clear veneers. The use of the laminates has opened additional market areas; prompted the use of lower quality hardwoods for interior paneling; permitted more use of domestic species such as walnut, pecan, and cherry for quality paneling; and provided competition for laminated hardboard and other substrates while maintaining the inherent quality and other advantages
of hardwood plywood. While annual shipments of prefinished hardwood plywood generally have decreased during the last decade, the proportion of lauan or similar species printed and embossed or laminated with a vinyl or paper overlay increased to 78 percent. Since 1972, only about 22 percent of the plywood made from domestic and the more expensive foreign hardwoods has had a natural finish. In 1980, 20 percent of the pre- finished hardwood plywood had a vinyl laminate or paper face (McDonald 1982). In 1976, this percentage was about 15 percent; and in 1972 it was only 6 percent; and for 1981 it rose to 27 p e r ~ e n t . ~
On the negative side, hauling veneer-quality logs greater distances and rising transportation costs con- tinue to increase their cost. Addi- tionally, the manufacture of structural composite panel products from low- cost hardwood resources will have to be reckoned with. These products are likely to gain more of the hardwood and softwood plywood markets in the Northeast as their acceptance increases. There is currently one manufacturer of these products in the Northeast and several more are planning to resume production soon.
4From data compiled by Clark E. McDon- ald, President, Hardwood Plywood Manu- facturers Association.

Literature References Definition of Terms
Bones, James, T.; Dickson, David R. Veneer, 1976-A periodic assess- ment of regional timber output. Resour. Bull. NE-55. Broomall, PA: U.S. Department of Agriculture, Forest Service, Northeastern Forest Experiment Station; 1978. 13 p.
The Commercial Bulletin. End to deep forestry slump seems distant de- spite improved housing. Commer. Bull. 6650:8; 1982.
The Commercial Bulletin. Housing starts in 1981 plunged to 35-year low. Commer. Bull. 6612:8; 1982.
Forest Industries Newsletter. Sep- tember housing starts up sharply. For. Indus. Newsl. 184-LL-42:l; 1982.
Forest Products Review. Commodity trends: solid wood products 1977-78. U.S. Department of Commerce, Bureau of lndustrial Economics 35(1):15-17. 1979.
Forest Products Review. Solid wood products. U.S. Department of Com- merce, Bureau of lndustrial Eco- nomics 35(1):56-64; 1979.
Forest Products Review. Commod- ity trends: solid wood products. January-September 1979-80. U.S. Department of Commerce. Bureau of lndustrial Economics 36(4):7-8; 1981.
Forests Products Review. Commod- ity trends: solid wood products 1979-80. U.S. Department of Com- merce. Bureau of lndustrial Eco- nomics 37(1):14-15; 1981.
Forest Products Review. Economic forecast: lumber and wood panel products. U.S. Department of Com- merce. Bureau of lndustrial Eco- nomics 36(4):10-15; 1981.
Forest Products Review. Solid wood products. U.S. Department of Com- merce. Bureau of lndustrial Eco- nomics 37(1):39-47; 1981.
Forest Products Review. Review and outlook: lumber and panel products. U.S. Department of Commerce. Bureau of lndustrial Economics 37(4):18-22; 1982.
Forest Products Review. Solid wood products. U.S. Department of Com- merce. Bureau of lndustrial Eco- nomics 37(4):42-50; 1982.
Frye, Larry R. Veneer business "Fair at Best". Commer. Bull. 6610:5,32; 1982.
Lewis, Bronson J. 1982: a hard year to call, but there's a reasonable chance of better times ahead. Commer. Bull. 6610:15,30; 1982.
Marcin, Thomas C. Changes in wood- based panel products use for new houses and prospects for the future. Unpublished paper presented at the Northeast fall section meeting of the Forest Products Research Society, West Lebanon, NH, Nov 3, 1982.
McDonald, Clark E. Trends and events in hardwood plywood-1981 and the future. Commer. Bull. 6610:4; 1982.
Stone, Robert N.; McSwain, George A. Wood-based panel products: a changing industry in the United States. Unasylva 32(127):8-15; 1980.
U.S. Bureau of the Census. Current industrial reports. Hardwood ply- wood 1968-1981. MA-24F(68)-1 through MA24(81)-1. Washington, DC: U.S. Department of Commerce, Bureau of the Census; 1969-1982.
Species
Softwoods. Coniferous trees, usually evergreen, with needles or scale-like leaves.
Hardwoods. Dicotyledonous trees, usually broad-leaved and deciduous.
Manufacture
Veneer log or bolt. A roundwood prod- uct from which veneer is sliced or sawn that usually meets certain mini- mum standards of diameter, length, and defect.
Veneer log production. The manufac- ture of roundwood (round timber) products, such as logs and bolts, generated from harvesting trees for conversion into veneer products.
Veneer log receipts. Roundwood (round timber) products, such as logs and bolts, received by veneer mills for conversion into veneer products.
Residues
Manufacturing plant residues. Wood materials that are generated when round timber (roundwood) is converted into wood products; includes coarse residues, such as veneer cores, slabs, and edgings suitable for chipping, and fine residues, such as shavings, sawdust, clippings, and other material not suitable for chipping.
Forest Products Review. Solid wood products. U.S. Department of Com- merce. Bureau of lndustrial Eco- nomics 36(4):40-49; 1981.

Table 1.-Veneer log production and receipts in the Northeast, 1976 and 1980 1 Production Receipts
State 1976 1980 Change 1976 1980 Change
Mil l ion board feeta Percent Mil l ion board feeta Percent
Connecticut Delaware Kentucky Maine Maryland Massachusetts New Hampshire New Jersey New York Ohio Pennsylvania Rhode Island Vermont West Virginia
All states 131.7 156.8 + 19 122.9 120.5 - 2
alnternational %-inch rule. 'Greater than 100 percent increase. (D)Data withheld to avoid disclosure for individual plants.
Table 2.-Species composition of veneer log harvest in the Northeast, 1976 and 1980
Species 1976 1980 Change
Ash Basswood Beech Birch Cherry Cottonwood Elm Hickory Maple, hard Maple, soft Oak, red Oak, white Sycamore Walnut, black Yellow-poplar Other hardwoodsC
Mil l ion board feeta
1.6 .3
11.7 36.8 3.4 .2 .2 2.2 11.0 3.0 16.8 7.1 .5 2.3 10.4 3.5
Percent
1.2 .2 8.9 27.9 2.6 .2 .2 1.7 8.3 2.3 12.7 5.4
.4 1.7 7.9 2.7
Mill ion board feeta
5.6 .6 7.6 32.7 5.9 .2 .4 .8 6.2 2.0 31.9 13.7 .5 1.6 7.3 2.1
Percent
3.6 .4 4.8 20.9 3.8 .1 .3 .5 4.0 1.3 20.3 8.7 .3
1 .o 4.7 1.3
Percent
(b) +I00 - 35 - 11 + 73 - +I00 - 64 - 44 - 33 + 90 + 93 - - 30 - 30 - 40
Total hardwoods 11 1 .O 84.3 119.1 76.0 + 7 Total softwoods 20.7 15.7 37.7 24.0 + 82
All species 131.7 100.0 156.8 100.0 + 19 alnternational %-inch rule. bMore than 100 percent change. Clncludes aspen, chestnut, hackberry, pecan, tupelo, and other miscellaneous hardwoods.
12

Table 3.-Production of veneer logs in the Northeast, by states and receiving plant classes, 1980
(Million board feet)"
State
Class of receiving veneer plant
Container Specialty and face
Connecticut Delaware Kentucky Maine Maryland Massachusetts New Hampshire New Jersey New York Ohio Pennsylvania Rhode Island Vermont West Virginia
All states 123.7 11.0 22.1
alnternational %-inch rule. 'Less than 100,000 board feet.
Table 4.-Receipts of veneer logs in the Northeast, by states and receiving plant classes, 1980
(Million board feet)a
Class of receiving veneer plant
Stateb Container Specialty and face
Kentucky Maine Maryland New Hampshire New Jersey New York Ohio Pennsylvania Vermont West Virginia
All states 82.9 11.2 26.4
alnternational %-inch rule. bStates with no operating veneer plants are omitted. (D)Data withheld to avoid disclosure for individual plants. "Less than 100,000 board feet.

Table 5.-Production, shipment, and consumption of veneer logs for the Northeast, by state, in 1980
(Million board feet)"
Out-shipments In-shipments Cut and - Total
State retained To To other From From other receipts Total
in state other Northeastern production other Northeastern (apparent statesb states statesb states consumption)
Connecticut Delaware Kentucky Maine Maryland Massachusetts New Hampshire New Jersey New York Ohio Pennsylvania Rhode Island Vermont West Virginia
All states
alnternational %-inch rule. blncludes shipments to or from Canada and other states outside the region. (D)Data withheld to avoid disclosure for individual plants. 'Less than 50.000 board feet.
Table 6.-Extraregional recipients of veneer logs from the Northeast, 1980
(Million board feet)"
State of Province Volume received
Indiana Missouri North Carolina New Brunswick, Canada Ontario, Canada Quebec, Canada Tennessee Virginia
All states and provinces
alnternational %-inch rule. Less than 100,000 board feet.

Table 7.-Disposition of veneer plant residues in the Northeast by states and type of residue and use, 1980
(Thousand cubic feet)
Class of residue Kentucky New New New Ohio Pennsyl- West All and type of use Maine Maryland Hampshire Jersey York vania Virginia states
Coarsea Fi berb lndustrial fuel Domestic fuel Other
Total used Total unused
FineC Fiber lndustrial fuel Domestic fuel Agriculturald
Total used Total unused
Bark lndustrial fuel Agricultural
Total used Total unused
All residues Fiber lndustrial fuel Domestic fuel All other
Total used Total unused
alncludes veneer cores and trimmings suitable for chipping. blncludes woodpulp and composite p[oducts. Clncludes clipping, shavings, and rounding waste unsuitable for chipping. d lnc l~des livestock bedding and farm and horticultural mulch. *Includes 6,000 cubic feet for chemical and charcoal use.

Veneer Plants in the Northeast-1980
Kentucky: New York: 1. Central States Veneer Co., Paducah *15. Koppers Co., Bernhard Bay 2. The Freeman Corp., Winchester 16. W. J. Cowee, Berlin 3. Wood Mosaic Corp., Louisville 17. Knight and Robbins Veneer Corp., Falconer
18. Riverside Veneer Corp., Heuvelton Maine: *19. Tupper Lake Veneer Corp., Tupper Lake
4. Diamond International Corp., Oakland 5. Forster Manufacturing Co., Inc. Ohio:
(Plants in E. Wilton and Strong) 20. Asplin Basket Co. Inc., Hartville 6. Hardwood Products Co., Guilford 21. Berlin Fruit Box Co., Berlin Heights 7. Columbia Plywood Corp., Presque Isle 22. Dimension Veneers, Edon 8. PCI, Brownville 23. Hartzell Industries, Inc., Piqua 9. Solon Manufacturing Co., Solon 24. Mclntire Basket Co., Creston
10. Strong Wood Products Inc., Strong 25. Universal Veneer, Newark
Maryland: Pennsylvania: 11. Chesapeake Plywood Corp., Pocomoke City 26. Greenfield Basket Co., Northeast 12. Stenerson Mahogany Corp., Cockeysville 27. Weyerhaeuser Co.
(Plants in Jefferson and New Freedom) New Hampshire:
13. Plymouth Manufacturing Co., Plymouth Vermont: 28. Bradford Veneer and Panel Co., Bradford
New Jersey: 29. Columbia Plywood Corp., Newport 14. Califon Basket Co., Califon 30. Lewis Brothers Inc., West Rupert
31. Rutland Plywood Corp., Rutland
West Virginia 32. Breece Veneer Co., Kenova 33. The Dean Co., Princeton 34. Erath Veneer Corp., Martinsburg
'Acquired since 1980 by Rutland Plywood Corporation.

Classes of Veneer Plants
Commercial or Face
A Container
Specialty

Nevel, Robert L., Jr. Veneer, 1980-A periodic assessment of regional timber output. Resour. Bull. NE-77. Broomall, PA: U.S. Department of Agriculture, Forest Service, Northeastern Forest Experiment Station; 1983. 17 p.
Evaluates regional timber output based on a canvass of the veneer plants in the Northeast and contains statistics for 1980 on the veneer-log production and receipts by states and species, log shipments between states and regions, and the disposition of manufacturing residues. Between 1976 and 1980, veneer log production jumped 19 percent and northeastern veneer plant receipts dropped slightly. Trends in production and an outlook for the industry are presented along with a list and map of veneer plants in the Northeast.
792:832.2(74):721 .I
Keywords: Timber output, veneer logs, Northeast, primary manufacturing residues.
a U.S. GOVERNMENT PRINTING OFFICE: 1983-605-024121

Headquarters of the Northeastern Forest Experiment Station are in Broomall, Pa. Field laboratories are maintained at:
Amherst, Massachusetts, in cooperation with the University of Massachusetts. Berea, Kentucky, in cooperation with Berea College. Burlington, Vermont, in cooperation with the University of Vermont. Delaware, Ohio. Durham, New Hampshire, in cooperation with the University of New Hampshire. Hamden, Connecticut, in cooperation with Yale University.
Morgantown, West Virginia, in cooperation with West Virginia University, Morgantown. Orono, Maine, in cooperation with the University of Maine, Orono. Parsons, West Virginia. Princeton, West Virginia.
@ Syracuse, New York, in cooperation with the State University of New York College of Environmental Sciences and Forestry at Syracuse University, Syracuse.
e University Park, Pennsylvania, in cooperation with the Pennsylvania State University. Warren, Pennsylvania.