Embed Size (px)
Citation preview
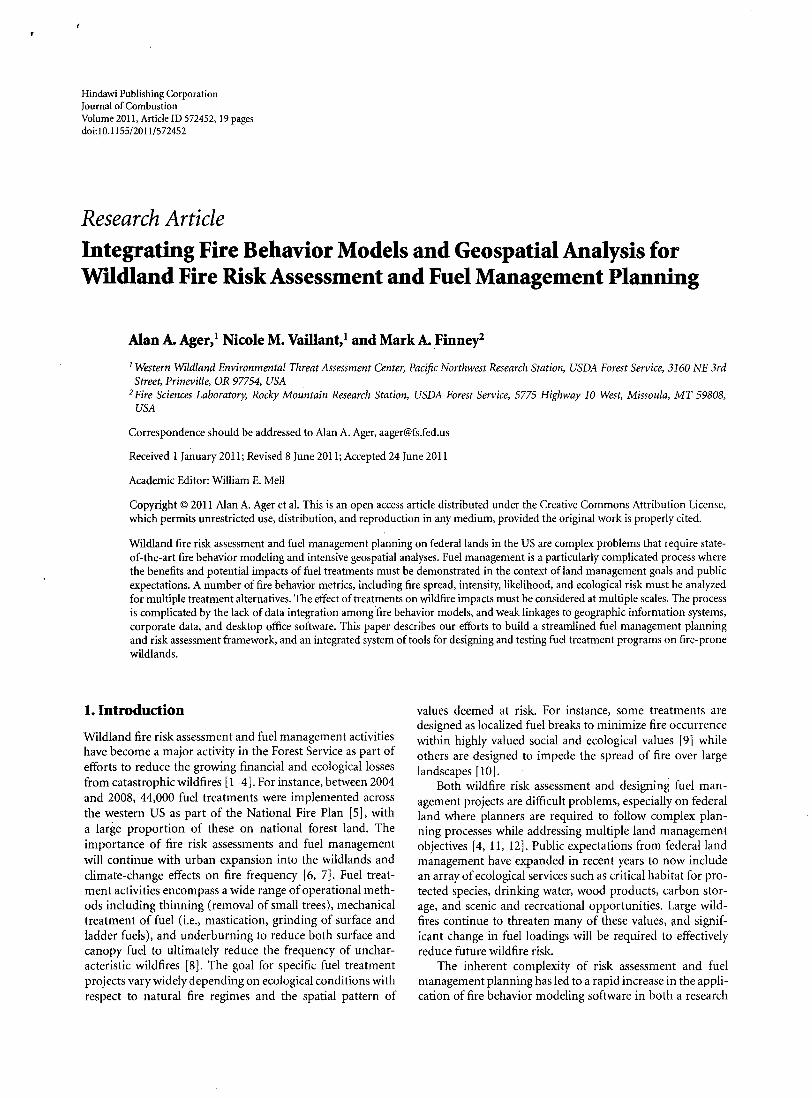
Hindawi Publishing Corporation Journal of Combustion Volume 20ll, Article ID 572452, 19 pages doi:I0.1155/2011/572452
Research Article Integrating Fire Behavior Models and Geospatial Analysis for Wildland Fire Risk Assessment and Fuel Management Planning
Alan A. Ager, 1 Nicole M. Vaillant, 1 and Mark A. _Finney2
1 Western Wildland Environmental Threat Assessment Center, Pacific Northwest Research Station, USDA Forest Service, 3160 NE 3rd Street, Prineville, OR 97754, USA
2 Fire Sciences Laboratory, Rocky Mountain Research Station, USDA Forest Service, 5775 Highway 10 West, Missoula, MT 59808, USA
Correspondence should be addressed to Alan A. Ager, [email protected]
Received 1 January 2011; Revised 8 June 2011; Accepted 24 June 2011
Academic Editor: William E. Mell
Copyright © 2011 Alan A. Ager et a!. This is an open access article distributed under the Creative Commons Attribution License, which permits unrestricted use, distribution, and reproduction in any medium, provided the original work is properly cited.
Wildland fire risk assessment and fuel management planning on federal lands in the US are complex problems that require stateof-the-art fire behavior modeling and intensive geospatial analyses. Fuel management is a particularly complicated process where the benefits and potential impacts of fuel treatments must be demonstrated in the context of land management goals and public expectations. A number of fire behavior metrics, including fire spread, intensity, likelihood, and ecological risk must be analyzed for multiple treatment alternatives. The effect oftreatments on wildfire impacts must be considered at multiple scales. The process is complicated by the lack of data integration among fire behavior models, and weak linkages to geographic information systems, corporate data, and desktop office software. This paper describes our efforts to build a streamlined fuel management planning and risk assessment framework, and an integrated system of tools for designing and testing fuel treatment programs on fire-prone wildlands.
1. Introduction
Wildland fire risk assessment and fuel management activities have become a major activity in the Forest Service as part of efforts to reduce the growing financial and ecological losses from catastrophic wildfires [ 1-4]. For instance, between 2004 and 2008, 44,000 fuel treatments were implemented across the western US as part of the National Fire Plan [ 5), with a large proportion of these on national forest land. The importance of fire risk assessments and fuel management will continue with urban expansion into the wildlands and climate-change effects on fire frequency [6, 7]. Fuel treatment activities encompass a wide range of operational methods including thinning (removal of small trees), mechanical treatment of fuel (i.e., mastication, grinding of surface and ladder fuels), and under burning to reduce both surface and canopy fuel to ultimately reduce the frequency of uncharacteristic wildfires [8). The goal for specific fuel treatment projects vary widely depending on ecological conditions with respect to natural fire regimes and the spatial pattern of
values deemed at risk. For instance, some treatments are designed as localized fuel breaks to minimize fire occurrence within highly valued social and ecological values [9) while others are designed to impede the spread of fire over large landscapes [ 10 ].
Both wildfire risk assessment and designing fuel management projects are difficult problems, especially on federal land where planners are required to follow complex planning processes while addressing multiple land management objectives [4, 11, 12]. Public expectations from federal land management have expanded in recent years to now include an array of ecological services such as critical habitat for protected species, drinking water, wood products, carbon storage, and scenic and recreational opportunities. Large wildfires continue to threaten many of these values, i}nd significant change in fuel loadings will be required to effectively reduce future wildfire risk.
The inherent complexity of risk assessment and fuel management planning has led to a rapid increase in the application of fire behavior modeling software in both a research
2
and operational context [1, 13-16]. Simulation models are routinely used to characterize fire behavior under specific fuel and weather conditions, and examine the potential effectiveness and ecological impacts of fuel treatment programs. Models are used to study fire behavior over a range of scales, from a localized fuel type (e.g., "forest stand", 5-50 ha), to large landscapes (1,000-50,000 ha). Simulation of multiple fires at local and landscape scales are often performed to analyze uncertainty associated with wildfire events in terms of the timing, location, intensity, and duration. Fire behavior models used in recent studies include NEXUS [17], Fire and Fuels Extension to the Forest Vegetation Simulator (FVSFFE) [18], FARSITE [19], FlamMap [20], BehavePlus [21], and FSIM [ 22]. A number of supporting models and software are used to estimate appropriate weather, fuel moisture, and other input variables required to run the fire behavior models [ 23-26]. Operational application of the models by planners and fuel specialists in land management organizations concerns quantitative assessment and mapping of fire risk to important social and ecological values, and the design of fuel treatment projects in terms of where, how much, and how to treat surface and canopy fuel to meet wildland fire management objectives. For instance, wildfires are modeled in treated stands to examine how different thinning regimes (intensity, size distribution, and species) affect crown fire ignition, fire intensity, postfire tree mortality, wildlife habitat, soil erosion, and other factors. Landscape fire spread models are used to examine how fuel treatment patterns change spatial patterns in burn probability and large fire spread [27].
The deployment of fire behavior modeling software from developers to research and application communities has largely been ad hoc, and strategic proposals that address systems integration of models have been slow to emerge. While the field application of nonspatial fire behavior models (e.g., BehavePlus) for a single fuel type and constant weather conditions is relatively straightforward, the design and evaluation of large-scale risk assessment and fuel management activities requires more complex landscape fire modeling to fully understand the potential benefits of fuel management proposals [28]. Landscape modeling of fire risk is increasingly expected of fuel treatment planners and is required to receive funding under newer federal planning initiatives [ 29]. The planning process must consider and evaluate multiple treatment alternatives, as well as cumulative impacts on a range of human and ecological values within proposed treatment areas [30].
The above issues and a host of other factors have created a strong demand in the fire modeling user community for an integrated modeling system to assess current wildfire risk, and analyze the potential benefits of proposed fuel management activities. Integrated approaches to fire modeling and fuel management planning have not evolved at the same pace as fire simulation models, mostly because integration issues are a technology transfer problem that is beyond the scope of the research community. The result is that many fire behavior and supporting vegetation models were developed without a concise understanding of the operational context and constraints for application within the management community.
Journal of Combustion
In this paper, we describe a geospatial interface that integrates a number of fire behavior models and facilitates their application for landscape risk assessment and fuel management activities. Although the system was designed to specifically address wildfire risk issues on US national forests, the architecture and analysis framework has relevance to a broad range of fire risk management issues in other fireprone regions of the world as well. The system creates a transscale interface to apply the various models within a geospatial analysis platform and eliminates a number of tedious data transformations and repetitive processes that have plagued the operations and research community as they apply the models to solve fuel management problems. The system integrates geographic information system (GIS), spatial databases, stand and landscape fire behavior models, vegetation growth models, and a streamlined process for developing and testing fuel treatment alternatives using risk-based metrics. The system enables collaborative planning for fuel management activities [ 14], an important part of developing landscape fuel treatment programs that span public and adjacent private lands. We describe the development history, core fire behavior models, and provide example applications of the system for landscape fuel planning and wildfire risk assessment.
2. Review of Existing Models and Information Systems
This work was initiated in 2004 with an ad hoc review of existing fire behavior modeling and spatial analysis systems in use by fuel management analysts. We observed Forest Service planning teams in the Pacific Northwest, Southwest, and Rocky Mountain Regions (Oregon, Washington, California, Montana, and northern Idaho) and the analytical process used to design fuel treatment projects at the ca. 1,000-50,000 ha scale. We assessed fire behavior and vegetation models in use, and the context (scale and purpose) for which they were applied in the planning process. Data sources, formats, outputs, and other aspects of the models were examined as well in terms of their potential contribution to analyzing wildfire risk and fuel management issues. The fire behavior models were all derived from the same lineage of systems that model one-dimensional behavior as part of a spreading line fire, including spread rate [31], fire shape [32, 33], spot fire distance [32], and crown fire spread rate [34, 35]. These models included NEXUS [36], Fire and Fuels Extension to the Forest Vegetation Simulator (FVS-FFE) [37], FARSITE [19], FlamMap [38], and BehavePlus [21]. We also examined published reviews that organized and cataloged fire behavior models and their practical application [15, 39, 40]. We concluded the following: (1) despite the existence of numerous fire behavior models and review papers describing them, very few models were actually developed specifically for fuel management planning; but rather were developed as part of basic fire behavior research; (2) relatively few of the existing fire behavior models could be easily adopted to address specific analysis requirements for risk assessment and fuel management projects; (3) every fire behavior model
Journal of Combustion
had a unique data input and output format and these data were not widely available for many of the models; ( 4) planners require both stand and landscape fire behavior modeling tools to test stand prescriptions and landscape effectiveness of fuel treatment packages [14]; (5) reviews attempting to organize and catalog the models included fire behavior and vegetation models that were never intended for operational planning in the first place; ( 6) most fuel treatment projects have multiple objectives and constraints that must be integrated with the analysis of fuels and fire behavior; and (7) the bulk of the analysis process for fuel treatment projects did not involve fire behavior modeling, but rather organization and processing of a wide spectrum of data within GIS to meet the broader resource analysis requirements of the project. We specifically found that the software foundation for a wide range of risk assessment and fuel management planning tasks was the ArcMap (ESRI, Redlands CA) geographic information system. Moreover, we found a robust development environment within ArcMap [ 41] that was being leveraged by some analysts to customize the system for project planning. Microsoft Office software (Access and Excel) was also an important component in the organization and analysis of data for operational projects. These and other observations led us to propose, develop, and deploy a system (''ArcFuels") of integrated spatial analysis and fire behavior modeling tools within ArcMap. This work did not address the many limitations and criticisms of fire behavior models used by the fuel management community [ 42-44], but rather focused on the demands of users for better integration of data and models within a streamlined planning framework.
2.1 .. Description of Selected Fire Behavior Model, Functionality, and Limitations. As noted above, the majority of fire behavior models used for fuel management planning were derived from the same lineage of systems that model onedimensional fire behavior as part of a spreading line fire [31-33, 35, 45]. All the aforementioned models linked or integrated (or both) Rothermel's [35] models for predicting surface and crown fire rates of spread with VanWagner's [34, 46] or Scott's [47] crown fire transition and propagation models in various ways, and provided outputs of several fire behavior characteristics (e.g., rate of fire spread, fireline intensity, and crown fire activity). In depth discussions of these models and their limitations can be found in several recent papers [ 40, 42-44]. Fire effects models are also important in the context of fuel management planning, and are used to examine the potential impacts of modeled fuel management activities and fire in terms of tree mortality, carbon, soil, and other ecosystem services [13, 48-51]. Additionally, several ancillary programs are used to determine appropriate weather inputs [26]. While many of the fire behavior models have some unique functionality and context, we concentrated our efforts on integrating two comprehensive fire modeling systems (FVS-FFE and Flam Map) that together provide the analytical capacity required to address a broad array of fuel management problems. The core functionality of these two systems is described below,
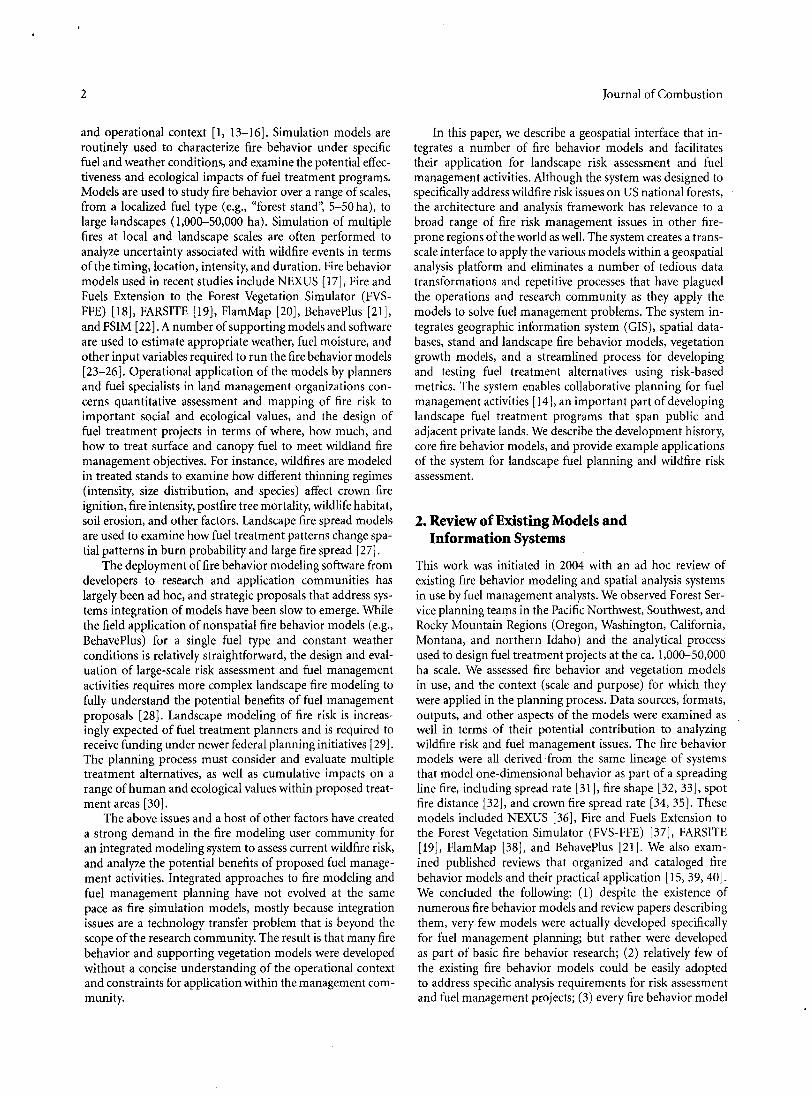
Elevation Slope Aspect Fuel model Canopy cover Canopy height Crown base height Crown bulk density
3
FIGURE 1: Fuel and topographic grid data used for wildfire simulations by FlamMap, FARSITE, and FSIM. The data are available from the national LANDFIRE project as ArcGIS grids. After adjustments and validation, the data are converted with ArcFuels scripts to the binary format ("LCP file") required by these fire models.
including detailed descriptions of the basis for fire behavior predictions. The complete list of all the fire models linked within ArcFuels, and selected case studies describing their application, are described in Table 1.
2.1.1. FlamMap. The FlamMap program has previously been described by Finney [ 20] and the description below was adopted from that paper. We also discuss FlamMap inputs, outputs, and types of application. FlamMap is a widely used landscape fire behavior model for both researchers and fuel treatment planners in US federal land management agencies. The program was originally developed to incorporate spatial variation in fuel loading, fuel moisture, wind speed, and wind direction to calculate landscape fire behavior. FlamMap utilizes the same set of gridded spatial inputs as the FARSITE [19] simulation system. The spatial inputs include eight grid themes that describe fuel canopy characteristics, surface fuel model, and topography, which are combined into a binary landscape (LCP) file (Figure 1). Canopy fuel is described by crown bulk density, canopy closure, height to live crown, and average height. Surface fuel is described by a fuel model [72, 73] that characterizes fuel load of live and dead fuels (by size class), surface-area-to-volume ratio for live and dead fuels, the fuel bed depth, moisture of extinction, and heat content. Fuel models are classified into groups depending on the dominant carrier of fire (grass, grass and brush, brush, timber with vegetative understory, timber litter, and slash). Each classification then has subcategories primarily based on fuel load among the fuel classes and typical fire behavior is described for each fuel model. For example TL1 (timberlitter 1, 181, or low load compact conifer litter) represents a fuel model where the primary carrier of fire is compact forest litter with a shallow fuel bed depth and is characteristic of slow fire spread. Fuel models are either selected in the field using guides or obtained from data sources such as Landfire [74].
4 Journal of Combustion
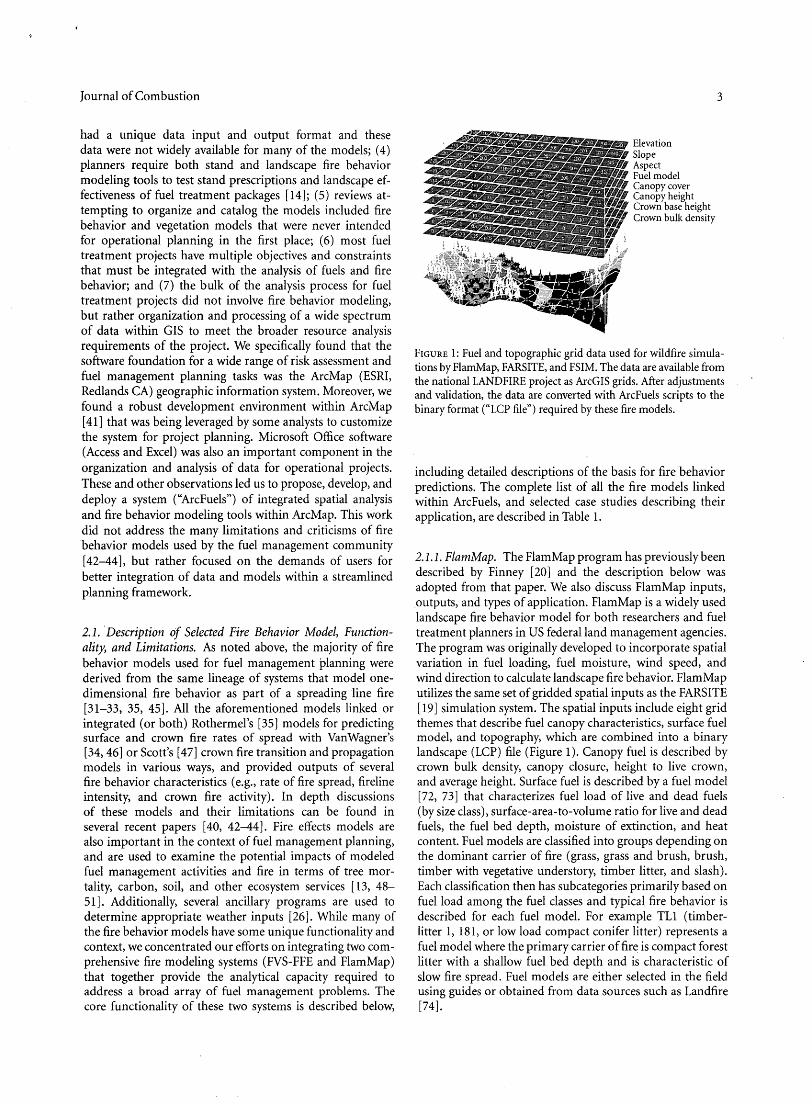
TABLE 1: Vegetation and fire behavior models used in conjunction with ArcFuels.
Model and citation
Forest Vegetation Simulator (FVS) [52]
Description
Individual-tree, distance-independent
growth and yield model
Stand-level simulations of Fire and Fuels Extension to FVS (FVS-FFE) [18] fuel dynamics and potential
fire behavior over time
Stand Visualization System (SVS) [59]
NEXUS (17]
BehavePlus [63]
BehavePlus (SURFACE module) [68]
FlamMap [20]
FARSITE [19]
FOFEM [13]
N/ A denotes not available.
Generates graphics depicting stand conditions
Stand -level spreadsheet that links surface and crown fire prediction
models
Stand -level fire behavior, fire effects, and fire
environment modeling system
Stand-level fire behavior, fire effects, and fire
environment modeling system
Landscape-level fire behavior mapping and
analysis program
Fire spread simulator
Stand-level first order fire effects modeling system
Linkage within ArcFuels
Calls the program, creates input data, processes
output data, plus allows interaction in execution
Calls the program, creates input data, processes
output data, plus allows interaction in execution
Calls the program, creates input data
Calls the program, creates input data
Calls the program
Fully integrated (Behave calculator in Wildfire
Models tool)
Calls the program, creates input data, processes
output data
Calls the program, creates input data, processes
output data
Calls the program
Case studies
[53-56]
(57, 58]
N/A
[60-62]
[64-67]
N/A
[69]
[62, 67, 69]
[70]
There are three distinct types of fire simulation procedures within FlamMap: ( 1) basic fire behavior for each pixel, (2) minimum travel time fire spread (MTT) [75] for an individual fire, and (3) multiple fires to generate burn probabilities. Modeled outputs are ASCII grid and shapefile (vector) format and are created for a number of variables (Table 2).
is calculated from the Wilson [77] modification of Byram's [78] equation:
In the first type of simulation, basic fire behavior is calculated by independently burning each pixel on the landscape (Figure 2(a) ). Primary modeled outputs include rate of spread, flame length, fireline intensity, and crown fire activity which are all described below. Surface fire rate of spread (R, m min-I) is calculated using the Rothermel spread equation:
R = lR~(l + <Dw + <Ds) pbt:Q;g
(1)
where IR is the reaction intensity (kJ min-I m-2), ~ is the propagation flux ratio, <Dw and <Ds are coefficients to account for wind and slope, Pb is the oven dry bulk density (kg m - 3 ),
e is the effective heating number, and Q;g is the heat of preignition (kJ kg- I). Surface ·fireline intensity (IB, kW m -I)
lR 12.6R 18 = 60_a_' (2)
where IR is the reaction intensity and R is the surface fire rate of spread as described above, and a is the characteristic surface area to volume ratio of the fuel bed (m-I ). Flame length (LJ, m) was calculated using the Wilson modification of Byram's equation for SI units:
(3)
where 18 is the fireline intensity described above. Within FlamMap, crown fire activity has three categories:
surface fire, passive crown fire, and active crown fire. The values are derived for each cell independently so active crown fire does not spread from cell to cell. Surface fire occurs when the surface fireline intensity (/B) is less than the critical threshold. The critical fireline intensity for crown fire initiation (/0 , kW m-I) is calculated from Van Wagner (46):
Ia = (0.010CBH( 460 + 25.9M) )312, ( 4)
where CBH was the canopy base height (m) and M was the foliar moisture content specified by the user. If the critical
Journal of Combustion 5
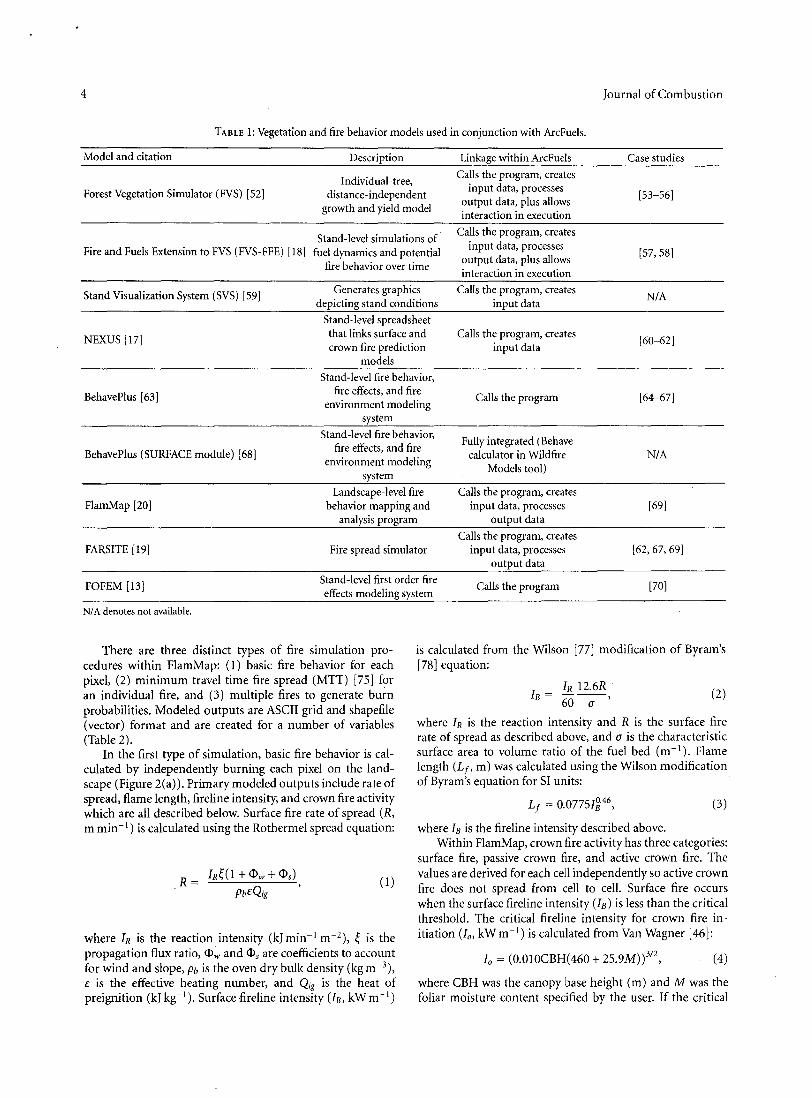
TABLE 2: Fire behavior output variables from FlamMap for a static simulation where fire is simulated for all pixels on the input landscape file. ·
Fire behavior value Simulation type Output type Units
Spread vectors Static Vector mmin- 1
Major paths MTT Vector N/A
Flow paths MTT Vector N/A
Flame length Static Grid morft
Rate of spread Static/MTT Grid mmin- 1 or ftmin- 1 or chhr- 1
Fireline intensity Static/MTT Grid kwm-1 or BTU ft- 1 sec- 1
Heat per unit area Static Grid kwm-2 or BTU ft-2 sec- 1
Crown fire activity Static Grid Index (0, 1, 2, or 3)
Midflame windspeed Static Grid mihr- 1 or kmhr- 1
Horizontal movement rate Static Grid mmin- 1 or ftmin- 1 or ch hr- 1
Max spread direction Static Grid Radians or degrees
Elliptical dimension Static/MTT Grid mmin- 1 or ftmin- 1 or chhr- 1
Arrival time MTT Grid rmn
Node influence MTT Grid Frequency
Burn probability MTT Grid Interval [76]
N/ A denotes not available.
(a) (b) (c) (d)
FIGURE 2: Images from FlamMap showing selected wildfire behavior outputs for the Mt. Emily study area. Panel (a) shows flame length from a static FlamMap run, (b) is single fire simulation from a point ignition, (c) is burn probability simulation of 10,000 wildfire ignitions and outlines of proposed treatment areas, (d) burn probability map as in (c) with fuel treatments simulated. All images were adapted from [71].
threshold is surpassed UB > ! 0 ), the type of crown fire is determined using Van Wagner's [34] definitions: passive crown fire when IB = 10 but Rcactual < RAC and active crown fire when IB 2:. 10 , Rcactual 2:. RAC. Where RAC is the threshold for active crown fire spread [79] rate and is calculated using the following equations:
3.0 RAC = CBD' (5)
where CBD is canopy bulk density (kgm-3). Rcactual
(m min -I) is the actual active crown fire spread rate and
is determined from the maximum crown fire spread rate (Rcmax' m min-I), surface fire spread rate (R) and crown fraction burned ( CFB, proportion [ 46])
Rcactual = R + CFB(Rcmax- R), (6)
where
(7)
-ln(O.l) (8) ac = 0.9(RAC- R
0)'
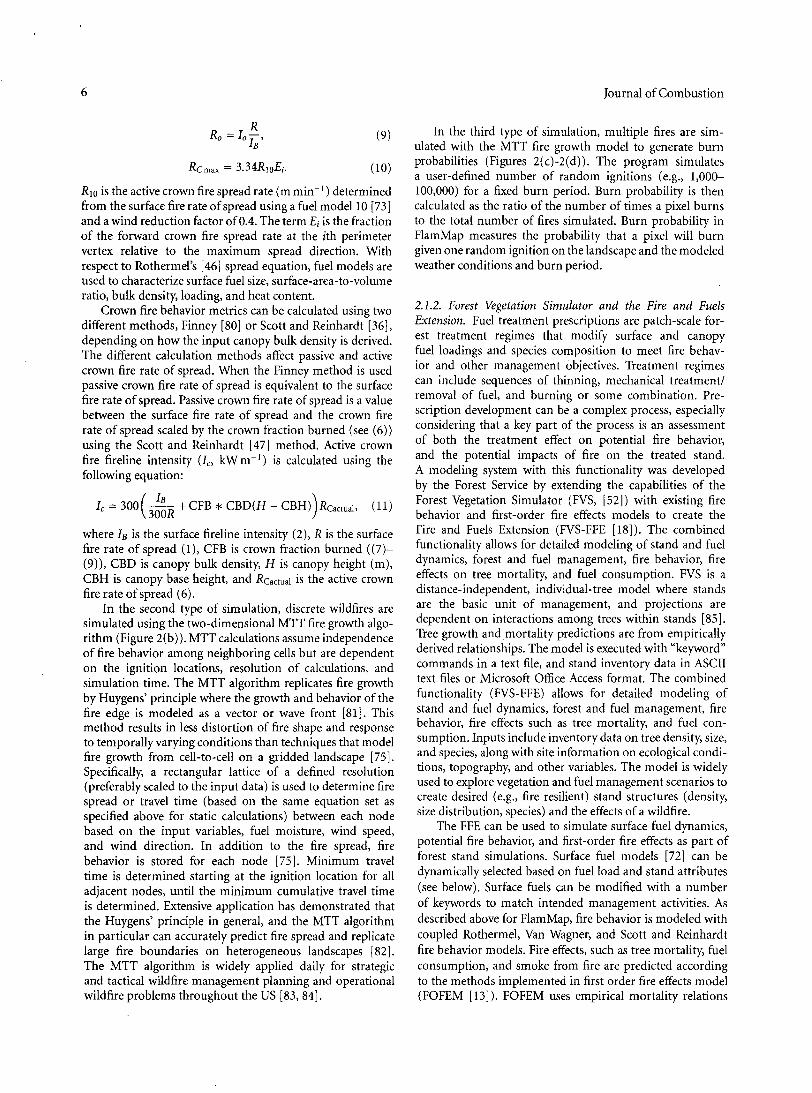
6
(9)
Rcmax = 3.34RwEi. (10)
Rw is the active crown fire spread rate (m min- 1) determined from the surface fire rate of spread using a fuel model10 [73] and a wind reduction factor of 0.4. The term Ei is the fraction of the forward crown fire spread rate at the ith perimeter vertex relative to the maximum spread direction. With respect to Rothermel's [ 46] spread equation, fuel models are used to characterize surface fuel size, surface-area-to-volume ratio, bulk density, loading, and heat content.
Crown fire behavior metrics can be calculated using two different methods, Finney [80] or Scott and Reinhardt [36], depending on how the input canopy bulk density is derived. The different calculation methods affect passive and active crown fire rate of spread. When the Finney method is used passive crown fire rate of spread is equivalent to the surface fire rate of spread. Passive crown fire rate of spread is a value between the surface fire rate of spread and the crown fire rate of spread scaled by the crown fraction burned (see ( 6)) using the Scott and Reinhardt [ 47] method. Active crown fire fireline intensity Un kW m- 1) is calculated using the following equation:
lc = 300 c~~R + CFB * CBD(H - CBH)) Rcactuah ( 11)
where IB is the surface fireline intensity (2), R is the surface fire rate of spread (1 ), CFB is crown fraction burned ( (7)(9)), CBD is canopy bulk density, H is canopy height (m), CBH is canopy base height, and Rcactual is the active crown fire rate of spread (6).
In the second type of simulation, discrete wildfires are simulated using the two-dimensional MTT fire growth algorithm (Figure 2(b) ). MTT calculations assume independence of fire behavior among neighboring cells but are dependent on the ignition locations, resolution of calculations, and simulation time. The MTT algorithm replicates fire growth by Huygens' principle where the growth and behavior of the fire edge is modeled as a vector or wave front [81]. This method results in less distortion of fire shape and response to temporally varying conditions than techniques that model fire growth from cell-to-cell on a gridded landscape [75]. Specifically, a rectangular lattice of a defined resolution (preferably scaled to the input data) is used to determine fire spread or travel time (based on the same equation set as specified above for static calculations) between each node based on the input variables, fuel moisture, wind speed, and wind direction. In addition to the fire spread, fire behavior is stored for each node [75]. Minimum travel time is determined starting at the ignition location for all adjacent nodes, until the minimum cumulative travel time is determined. Extensive application has demonstrated that the Huygens' principle in general, and the MTT algorithm in particular can accurately predict fire spread and replicate large fire boundaries on heterogeneous landscapes [ 82]. The MTT algorithm is widely applied daily for strategic and tactical wildfire management planning and operational wildfire problems throughout the US [83, 84].
Journal of Combustion
In the third type of simulation, multiple fires are simulated with the MTT fire growth model to generate burn probabilities (Figures 2(c)-2(d)). The program simulates a user-defined number of random ignitions (e.g., 1,000-100,000) for a fixed burn period. Burn probability is then calculated as the ratio of the number of times a pixel burns to the total number of fires simulated. Burn probability in FlamMap measures the probability that a pixel will burn given one random ignition on the landscape and the modeled weather conditions and burn period.
2.1.2. Forest Vegetation Simulator and the Fire and Fuels Extension. Fuel treatment prescriptions are patch-scale forest treatment regimes that modify surface and canopy fuel loadings and species composition to meet fire behavior and other management objectives. Treatment regimes can include sequences of thinning, mechanical treatment/ removal of fuel, and burning or some combination. Prescription development can be a complex process, especially considering that a key part of the process is an assessment of both the treatment effect on potential fire behavior, and the potential impacts of fire on the treated stand. A modeling system with this functionality was developed by the Forest Service by extending the capabilities of the Forest Vegetation Simulator (FVS, [52]) with existing fire behavior and first-order fire effects models to create the Fire and Fuels Extension (FVS-FFE [18]). The combined functionality allows for detailed modeling of stand and fuel dynamics, forest and fuel management, fire behavior, fire effects on tree mortality, and fuel consumption. FVS is a distance-independent, individual-tree model where stands are the basic unit of management, and projections are dependent on interactions among trees within stands [85]. Tree growth and mortality predictions are from empirically derived relationships. The model is executed with "keyword" commands in a text file, and stand inventory data in ASCII text files or Microsoft Office Access format. The combined functionality (FVS-FFE) allows for detailed modeling of stand and fuel dynamics, forest and fuel management, fire behavior, fire effects such as tree mortality, and fuel consumption. Inputs include inventory data on tree density, size, and species, along with site information on ecological conditions, topography, and other variables. The model is widely used to explore vegetation and fuel management scenarios to create desired (e.g., fire resilient) stand structures (density, size distribution, species) and the effects of a wildfire.
The FFE can be used to simulate surface fuel dynamics, potential fire behavior, and first-order fire effects as part of forest stand simulations. Surface fuel models [72] can be dynamically selected based on fuel load and stand attributes (see below). Surface fuels can be modified with a number of keywords to match intended management activities. As described above for FlamMap, fire behavior is modeled with coupled Rothermel, Van Wagner, and Scott and Reinhardt fire behavior models. Fire effects, such as tree mortality, fuel consumption, and smoke from fire are predicted according to the methods implemented in first order fire effects model (FOFEM [13]). FOFEM uses empirical mortality relations
Journal of Combustion
based on scorch height to calculate tree mortality. The FFE also contains models of snag and fuel dynamics, down wood accumulation, and decomposition. These models were built from an array of data sources and the mechanics are described in detail in [18]. Model outputs include predicted fuel loadings over time, and measures of fire hazard including potential flame length, canopy base height, and canopy bulk density, torching and crowning indices, and potential stand mortality over the simulation period. If a prescribed fire or wildland fire is simulated, output also includes predicted fire behavior, fuel consumption, smoke production, and tree mortality. Additional output includes the amount of stored carbon and coarse woody debris. FVS can be implemented in a spatial context with the Parallel Processing Extension (FVS-PPE). Landscapes are composed of stands and the simulation is executed for all stands before cycling to the next time period. FVS-PPE recognizes stand contagion, and can model management constraints (area treated) and dynamic treatment goals much like other spatial forest planning models. This system was used to explore long-term spatial fuel management problems in several studies [27, 53, 71].
2.1.3. Limitation of Fire Models. The bulk of recent criticisms [44, 86] are aimed at the semiempirical family of fire behavior models (including FlamMap) that couple Rothermel's [35, 45] models for predicting surface and crown fire rates of spread and Van Wagner's [34, 46] crown fire transition and propagation models. While these models continue to be widely used by researchers and practitioners, the assumptions and limitations are important to consider in model integration efforts like the one described in this paper. One of the primary problems with semiempirically derived models are they do not account for fire-atmospheric interactions, and they do not explicitly include fire-fuel interactions such as the combustion and heat transfer processes.' Additionally they model a quasisteady state fire spread, which is inconsistent with active spreading crown fire conditions and characteristics. It has been suggested that another class of theoretical or physics-based models, which include FIRETECH [87] and WFDS [86] are more robust at characterizing fire propagation. However, these models are in the research domain, and require computing resources that are not yet widely available to fuel management analysts.
Another major concern with the fire behavior models discussed in this paper is the modeling of crown fire. Crown fires are a substantial challenge and remain poorly understood [88]. A recent paper by Cruz and Alexander [ 44] discusses factors that lead to underpredictions in the crown models. These stem from (1) incompatible linkages between the Rothermel's [45] surface fire spread model and the Van Wagner [34] crown fire ignition model, (2) the inherent underprediction of rate of spread associated with the Rothermel's surface and crown [35] fire spread models, and (3) using crown fraction burned to reduce crown fire rate of spread [44]. In FlamMap, fireline intensity is calculated from Rothermel's [ 45] reaction intensity which is lower by a factor of 2-3, [44] compared with Byram's [78]
7
fireline intensity. This results in an overall underprediction of crown fire occurrence. The rate of crown fire spread is underpredicted as well. Observed versus predicted crown fire rate of spread for experimental fires and wildfires in the US and Canada have also shown an underprediction of 2.6- to 3.75-times (Figure 5 in [ 44]). This may be the result of applying crown fire models beyond the realm intended [47]. The Rothermel crown fire rate of spread model was derived from linear correlation of eight wind-driven crown fire events in the northern Rocky Mountains and is directly linked to a surface fire spread rate calculated with a fuel model 10, and thus the use of different fuel models creates a disconnect between the surface fuel model and crown fire rate of spread [36]. Finally, the Van Wagner crown fire model [46] assumes gradual progression from surface to active crown fire that can be scaled by the crown fraction burned. However, observational evidence suggests that the transition from surface to crown fire is not gradual [ 44, 88].
Finally, it should be noted that fire behavior models discussed in this paper implement crown fire transitions differently, and thus can yield different results. The current understanding of crown fire behavior is inadequate to determine the most defensible way to integrate the various crown fire models. Depending on the intended purpose of modeled outputs, this may or may not be a limitation. In a planning or research context where models are used to assess relative fire behavior under different treatment alternatives, the important point is that the predicted change in fire behavior is captured in the modeling effort [89]. However, when absolute fire behavior metrics are required to determine fire hazard and locate potential treatment locations, the outputs should be compared with observation and experience to determine which model is more accurately depicting expected results [ 89].
The above limitations in models and input data are well known by the user community, and careful application of the fire behavior models has been stressed in recent papers [26, 40]. While many issues are apparent, the main fire behavior models used by practitioners continue to generate reasonable results for many applications. As more advanced fire models are developed and made computationally efficient, these models will filter to the field and improve modeling accuracy for all phases of their application, especially modeling wildfire risk to WUI where models discussed here are not capable of modeling structure to structure ignition [ 43].
2.1.4. Limitations of FVS-FFE. Limitations discussed above for FlamMap apply to the FVS-FFE model since surface and crown fire modeling is implemented with a similar framework. Additional limitations of the model in terms of modeling vegetation and fuel dynamics are described below. One of the most significant limitations with FVSFFE is that nonforest live vegetation and associated fuel is not modeled, except for one FVS version that pertains to northern Idaho State. The calculation of fuel model from live and dead surface and canopy fuel is handled with coarse
8
rule sets that determine fuel model based on overall stand characteristics, including habitat type, tree canopy cover, tree species, and other variables. Thus careful examination of the fuel model selection is required by users. Likewise, fuel model selection in long-term simulations can be suspect, and user intervention in the process requires detailed keyword statements. Decay of fuel pools over time is also based on a limited set of empirically derived relationships as described in Rebain [18], and changes in these parameters can have dramatic effects on fuel model selection.
2.1.5. Data Considerations for Fire Behavior Modeling. Two widely recognized data issues with the application of the fire behavior models discussed in this paper are the choice of fuel model and the quantification of canopy fuels. All fire behavior models described in this paper require a surface fuel model which is typically chosen from a predefined set or a custom model defined with field fuel data. Custom fuel models are difficult to calibrate [ 4 7] and are rarely validated with observed fire behavior; uncalibrated custom fuel models should only be used to compare relative differences and not absolute fire behavior [60]. Improvements have been made with the new set of standard fuel models [72] relative to the original 13 fuel models [73]. These improvements include (1) more fuel model choices to fine tune modeled surface fire behavior which in turn will improve crown fire prediction, (2) increased applicability for more diverse fire conditions such as prescribed fire and less severe wildfire conditions, (3) increased ability to represent posttreatment surface fuel conditions, and ( 4) addition of dynamic fuel moisture for all fuel models including live fuels [72]. Despite these improvements, fuel models still rely on the Rothermal surface fire equations, and fire behavior is only represented for frontal combustion. In addition to the limitations of the fuel models themselves, the process of selecting an appropriate fuel model is difficult when fuel inventory data are not recorded in stand data.
Known limitations exist with estimates of canopy fuel characteristics critical to modeling crown fire behavior [36]. Canopy base height and foliar moisture content are both used to calculate the critical fire line intensity ( 4 ), and canopy bulk density is used to determine active crown fire rate of spread (5). For multistrata stands neither a single crown measurement nor the average of the crowns in a stand are a good representation of the stand as a whole [47]. Because destructive measuring on canopy fuels is not feasible, indirect methods using tree inventory data are necessary [90]. Vegetation modeling systems such as FVSFFE are used to process inventory data to determine the effective canopy base height and canopy bulk density using a running mean. Effective canopy base height is the lowest height where a minimum bulk density of fine fuel is found and effective canopy bulk density is the maximum mean for a given window [91]. Foliar moisture content is rarely gathered in the field and sparse data exists on what moisture levels to use when modeling. Foliar moisture content varies among
Journal of Combustion
species, age of needles, and season, and typically straddle 100% [36], which is the default value in many fire behavior models such as FlamMap.
3. Integration and Systems Analysis with ArcFuels
We built ArcFuels using the ArcObjects library [41] and Visual Basic for Applications (VBA, [92]) within ArcMap. The ArcFuels scripts link selected fire behavior models with vegetation databases and Microsoft Office software (Table 1). The ArcFuels system provided a logical flow from stand scale to landscape analyses of vegetation, fuel, and fire behavior, using a number of different models and a simple user interface within ArcMap (Figures 3, 4, Table 1). Extensive use was made of the FVS database extension [ 93] to leverage Microsoft Office Access and Excel software. Specific functionality of ArcFuels includes (1) an interactive system within ArcMap to simulate fuel treatment prescriptions with FVS-FFE, (2) an automated generation of data plots within Excel showing how stand fuel treatments change wildfire behavior and stand conditions over time (Figure 5(d)), (3) scale-up of stand-specific treatments to simulate landscape changes in vegetation and fuel from proposed management activities (Figure 6), ( 4) data linkages to FlamMap to simulate landscape-scale fire behavior and measure the treatment performance in terms of wildfire probabilities, spread rates, and fire line intensity (Figure 6), (5) the ability to easily modify and reevaluate fuel treatment scenarios, and ( 6) viewing and analyzing spatial fire behavior outpl!tS in ArcMap. The system was built to process both the national LANDFIRE grid data [74] and tree list inventory data that are widely available in some regions of the US for fire behavior analysis (Figures 2 and 6). A prototype system was summarized by Ager [94].
The ArcFuels scripts are distributed within an ArcMap project file for ArcMap versions 9.0, 9.1, 9.2, 9.3, and 10.0. The scripts are accessed via a toolbar when the project file is loaded (Figure 4, Table 3). An extensive demonstration data set and accompanying user guide were developed for distribution with ArcFuels that covered a wide range of fuel management and planning problems [95]. The suite was posted for download at http://www.fs.fed.us/wwetac/arcfuels/ along with supporting literature and case study examples. We also completed case study publications on fuel treatment problems to demonstrate application of the system [ 96].
As ArcFuels was implemented in the field on fuel treatment projects and employed for fuel management research, we continued enhancing the system and eliminating bottlenecks in the analysis process. Most of the major issues were related to awkward user interfaces and weak data linkages. We focused development efforts on five key areas: (1) modeling fuel treatments with FVS-FFE, (2) repetitive testing and adjusting landscape fuel treatment scenarios, (3) · using burn probability modeling and risk analysis to measure the performance of fuel treatments, ( 4) landscape analysis of carbon offsets, and (5) spatially optimizing fuel treatments. These individual focal areas are described below.
Journal of Combustion
weather scenarios and
files:WTR, WND, FMS, SCN
9
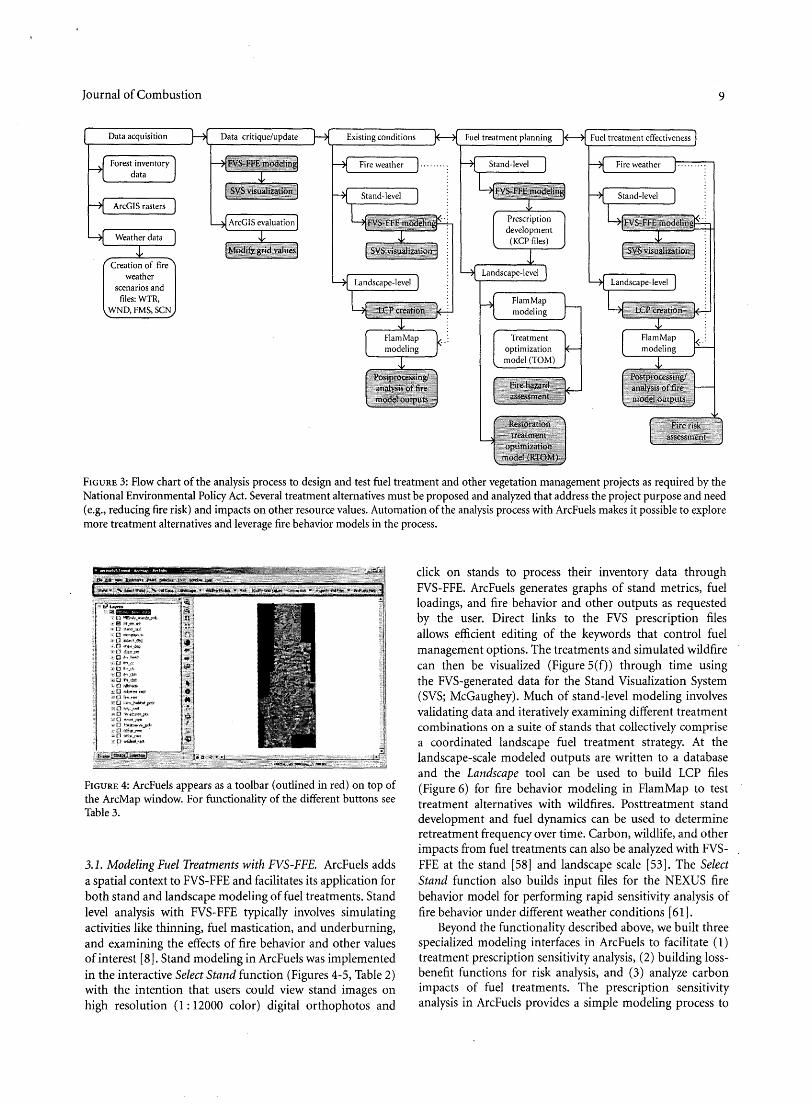
FIGURE 3: Flow chart of the analysis process to design and test fuel treatment and other vegetation management projects as required by the National Environmental Policy Act. Several treatment alternatives must be proposed and analyzed that address the project purpose and need (e.g., reducing fire risk) and impacts on other resource values. Automation of the analysis process with ArcFuels makes it possible to explore more treatment alternatives and leverage fire behavior models in the process.
FIGURE 4: ArcFuels appears as a toolbar (outlined in red) on top of the ArcMap window. For functionality of the different buttons see Table 3.
3.1. Modeling Fuel Treatments with FVS-FFE. ArcFuels adds a spatial context to FVS-FFE and facilitates its application for both stand and landscape modeling of fuel treatments. Stand level analysis with FVS-FFE typically involves simulating activities like thinning, fuel mastication, and underburning, and examining the effects of fire behavior and other values of interest [ 8]. Stand modeling in ArcFuels was implemented in the interactive Select Stand function (Figures 4-5, Table 2) with the intention that users could view stand images on high resolution (I: 12000 color) digital orthophotos and
click on stands to process their inventory data through FVS-FFE. ArcFuels generates graphs of stand metrics, fuel loadings, and fire behavior and other outputs as requested by the user. Direct links to the FVS prescription files allows efficient editing of the keywords that control fuel management options. The treatments and simulated wildfire can then be visualized (Figure 5(f)) through time using the FVS-generated data for the Stand Visualization System (SVS; McGaughey). Much of stand-level modeling involves validating data and iteratively examining different treatment combinations on a suite of stands that collectively comprise a coordinated landscape fuel treatment strategy. At the landscape-scale modeled outputs are written to a database and the Landscape tool can be used to build LCP files (Figure 6) for fire behavior modeling in FlamMap to test treatment alternatives with wildfires. Posttreatment stand development and fuel dynamics can be used to determine retreatment frequency over time. Carbon, wildlife, and other impacts from fuel treatments can also be analyzed with FVSFFE at the stand [58] and landscape scale [53]. The Select Stand function also builds input files for the NEXUS fire behavior model for performing rapid sensitivity analysis of fire behavior under different weather conditions [ 61].
Beyond the functionality described above, we built three specialized modeling interfaces in ArcFuels to facilitate ( 1) treatment prescription sensitivity analysis, (2) building lossbenefit functions for risk analysis, and (3) analyze carbon impacts of fuel treatments. The prescription sensitivity analysis in ArcFuels provides a simple modeling process to
10 Journal of Combustion
.... ,,,.-
/'\ /·,,
I \ / \ l \ / \
/ \_,/ ''''>,•ww'/ j \
\ •. /'''W.M .... ,.,,,,
(f) Thinning treatment Surface fuel reduction Undcrbum Wildfire
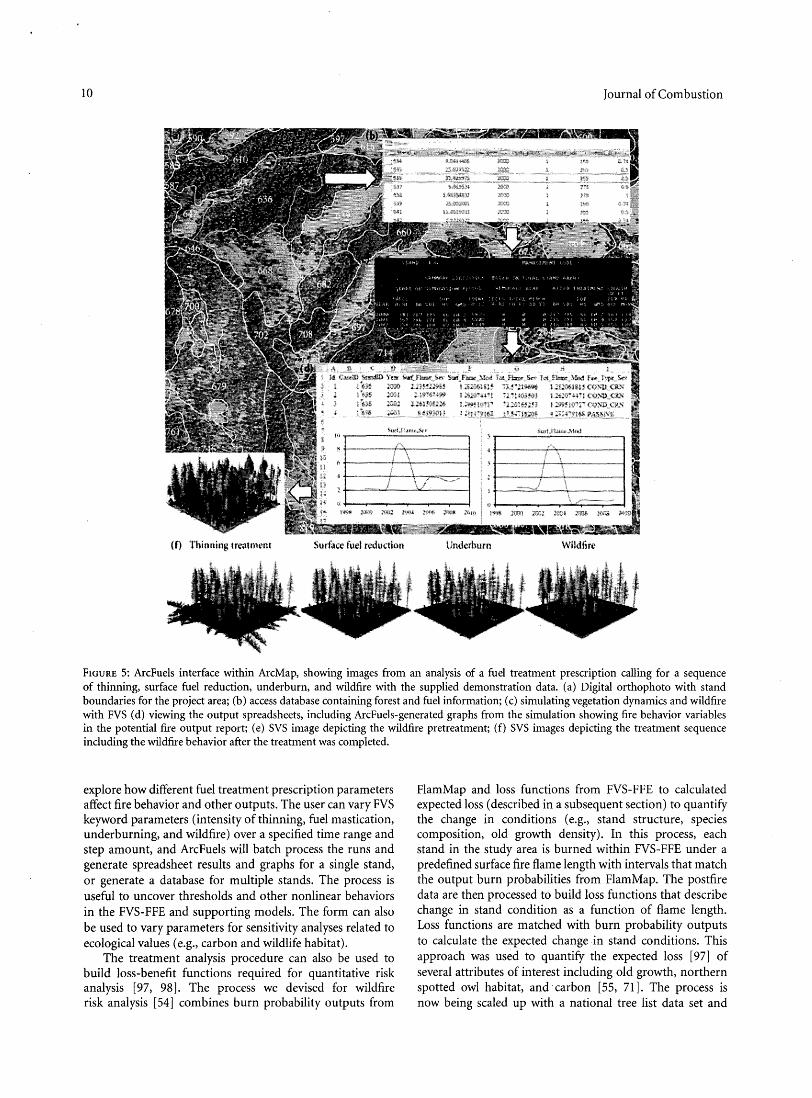
FIGURE 5: ArcFuels interface within ArcMap, showing images from an analysis of a fuel treatment prescription calling for a sequence of thinning, surface fuel reduction, underburn, and wildfire with the supplied demonstration data. (a) Digital orthophoto with stand boundaries for the project area; (b) access database containing forest and fuel information; (c) simulating vegetation dynamics and wildfire with FVS (d) viewing the output spreadsheets, including ArcFuels-generated graphs from the simulation showing fire behavior variables in the potential fire output report; (e) SVS image depicting the wildfire pretreatment; (f) SVS images depicting the treatment sequence including the wildfire behavior after the treatment was completed.
explore how different fuel treatment prescription parameters affect fire behavior and other outputs. The user can vary FVS keyword parameters (intensity of thinning, fuel mastication, under burning, and wildfire) over a specified time range and step amount, and ArcFuels will batch process the runs and generate spreadsheet results and graphs for a single stand, or generate a database for multiple stands. The process is useful to uncover thresholds and other nonlinear behaviors in the FVS-FFE and supporting models. The form can also be used to vary parameters for sensitivity analyses related to ecological values (e.g., carbon and wildlife habitat).
The treatment analysis procedure can also be used to build loss-benefit functions required for quantitative risk analysis [97, 98]. The process we devised for wildfire risk analysis [54] combines burn probability outputs from
FlamMap and loss functions from FVS-FFE to calculated expected loss (described in a subsequent section) to quantify the change in conditions (e.g., stand structure, species composition, old growth density). In this process, each stand in the study area is burned within FVS-FFE under a predefined surface fire flame length with intervals that match the output burn probabilities from FlamMap. The postfire data are then processed to build loss functions that describe change in stand condition as a function of flame length. Loss functions are matched with burn probability outputs to calculate the expected change in stand conditions. This approach was used to quantify the expected loss [97] of several attributes of interest including old growth, northern spotted owl habitat, and carbon [55, 71]. The process is now being scaled up with a national tree list data set and
Journal of Combustion
(a)
(b)
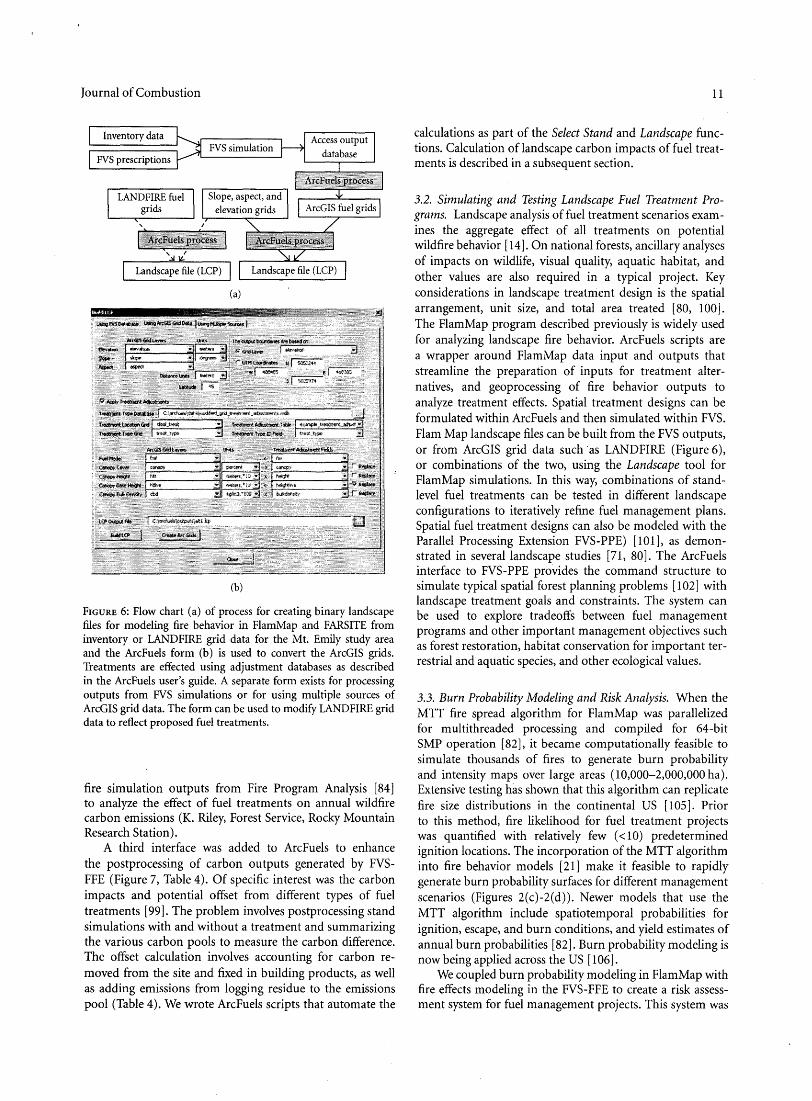
FIGURE 6: Flow chart (a) of process for creating binary landscape files for modeling fire behavior in FlamMap and FARSITE from inventory or LANDFIRE grid data for the Mt. Emily study area and the ArcFuels form (b) is used to convert the ArcGIS grids. Treatments are effected using adjustment databases as described in the ArcFuels user's guide. A separate form exists for processing outputs from FVS simulations or for using multiple sources of ArcGIS grid data. The form can be used to modify LAND FIRE grid data to reflect proposed fuel treatments.
fire simulation outputs from Fire Program Analysis [84] to analyze the effect of fuel treatments on annual wildfire carbon emissions (K. Riley, Forest Service, Rocky Mountain Research Station).
A third interface was added to ArcFuels to enhance the postprocessing of carbon outputs generated by FVSFFE (Figure 7, Table 4). Of specific interest was the carbon impacts and potential offset from different types of fuel treatments [99]. The problem involves postprocessing stand simulations with and without a treatment and summarizing the various carbon pools to measure the carbon difference. The offset calculation involves accounting for carbon removed from the site and fixed in building products, as well as adding emissions from logging residue to the emissions pool (Table 4). We wrote ArcFuels scripts that automate the
11
calculations as part of the Select Stand and Landscape functions. Calculation of landscape carbon impacts of fuel treatments is described in a subsequent section.
3.2. Simulating and Testing Landscape Fuel Treatment Programs. Landscape analysis of fuel treatment scenarios examines the aggregate effect of all treatments on potential wildfire behavior [14]. On national forests, ancillary analyses of impacts on wildlife, visual quality, aquatic habitat, and other values are also required in a typical project. Key considerations in landscape treatment design is the spatial arrangement, unit size, and total area treated [80, 100]. The FlamMap program described previously is widely used for analyzing landscape fire behavior. ArcFuels scripts are a wrapper around FlamMap data input and outputs that streamline the preparation of inputs for treatment alternatives, and geoprocessing of fire behavior outputs to analyze treatment effects. Spatial treatment designs can be formulated within ArcFuels and then simulated within FVS. Flam Map landscape files can be built from the FVS outputs, or from ArcGIS grid data such ·as LANDFIRE (Figure 6), or combinations of the two, using the Landscape tool for FlamMap simulations. In this way, combinations of standlevel fuel treatments can be tested in different landscape configurations to iteratively refine fuel management plans. Spatial fuel treatment designs can also be modeled with the Parallel Processing Extension FVS-PPE) [101], as demonstrated in several landscape studies [71, 80]. The ArcFuels interface to FVS-PPE provides the command structure to simulate typical spatial forest planning problems [102] with landscape treatment goals and constraints. The system can be used to explore tradeoffs between fuel management programs and other important management objectives such as forest restoration, habitat conservation for important terrestrial and aquatic species, and other ecological values.
3.3. Burn Probability Modeling and Risk Analysis. When the MTT fire spread algorithm for FlamMap was parallelized for multithreaded processing and compiled for 64-bit SMP operation [82), it became computationally feasible to simulate thousands of fires to generate burn probability and intensity maps over large areas (10,000-2,000,000 ha). Extensive testing has shown that this algorithm can replicate fire size distributions in the continental US [ 1 OS]. Prior to this method, fire likelihood for fuel treatment projects was quantified with relatively few ( < 10) predetermined ignition locations. The incorporation of the MTT algorithm into fire behavior models [21] make it feasible to rapidly generate burn probability surfaces for different management scenarios (Figures 2(c)-2(d)). Newer models that use the MTT algorithm include spatiotemporal probabilities for ignition, escape, and burn conditions, and yield estimates of annual burn probabilities [82]. Burn probability modeling is now being applied across the US [ 106].
We coupled burn probability modeling in FlamMap with fire effects modeling in the FVS-FFE to create a risk assessment system for fuel management projects. This system was
12 Journal of Combustion
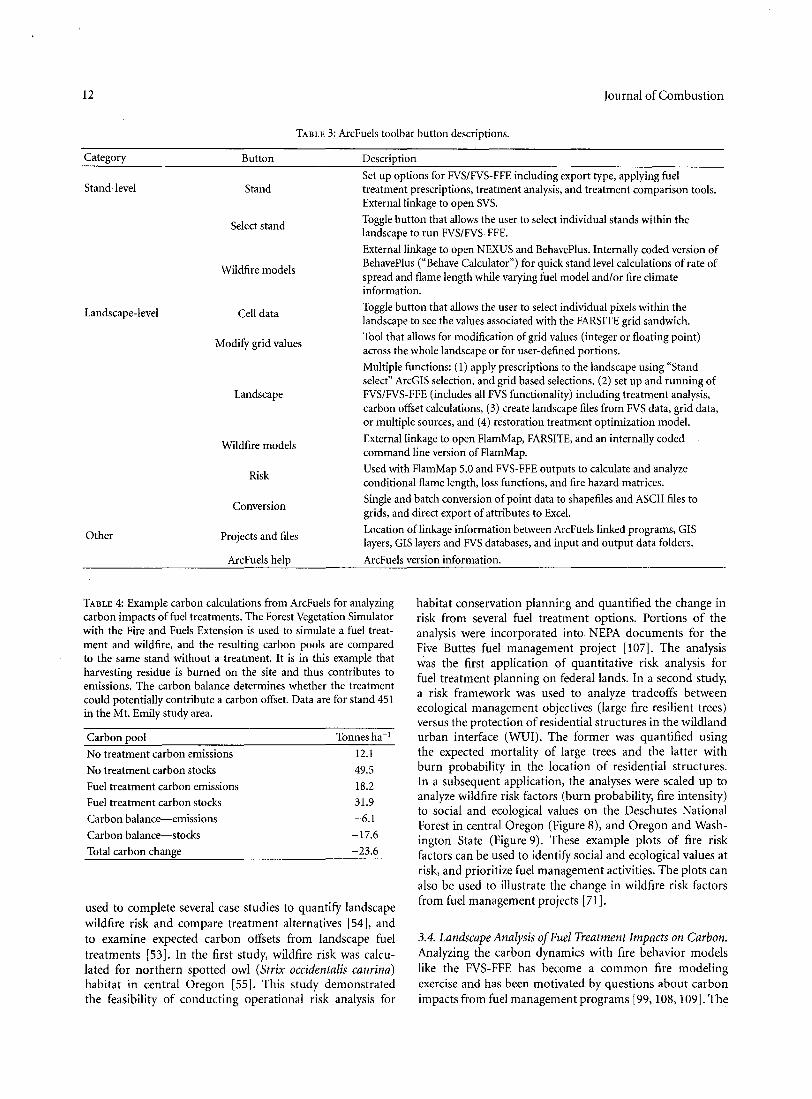
TABLE 3: ArcFuels toolbar button descriptions.
Category Button
Stand-level Stand
Select stand
Wildfire models
Landscape-level Cell data
Modify grid values
Landscape
Wildfire models
Risk
Conversion
Other Projects and files
ArcFuels help
Description
Set up options for FVS/FVS-FFE including export type, applying fuel treatment prescriptions, treatment analysis, and treatment comparison tools. External linkage to open SVS.
Toggle button that allows the user to select individual stands within the landscape to run FVS/FVS-FFE.
External linkage to open NEXUS and BehavePlus. Internally coded version of BehavePlus ("Behave Calculator") for quick stand level calculations of rate of spread and flame length while varying fuel model and/or fire climate information.
Toggle button that allows the user to select individual pixels within the landscape to see the values associated with the FARSITE grid sandwich. Tool thatallows for modification of grid values (integer or floating point) across the whole landscape or for user-defined portions.
Multiple functions: ( 1) apply prescriptions to the landscape using "Stand select" ArcGIS selection, and grid based selections, (2) set up and running of FVS/FVS-FFE (includes all FVS functionality) including treatment analysis, carbon offset calculations, (3) create landscape files from FVS data, grid data, or multiple sources, and (4) restoration treatment optimization model.
External linkage to open FlamMap, FARSITE, and an internally coded command line version of FlamMap.
Used with FlamMap 5.0 and FVS-FFE outputs to calculate and analyze conditional flame length, loss functions, and fire hazard matrices.
Single and batch conversion of point data to shapefiles and ASCII files to grids, and direct export of attributes to Excel.
Location of linkage information between ArcFuels linked programs, GIS layers, GIS layers and FVS databases, and input and output data folders.
ArcFuels version information.
TABLE 4: Example carbon calculations from ArcFuels for analyzing carbon impacts of fuel treatments. The Forest Vegetation Simulator with the Fire and Fuels Extension is used to simulate a fuel treatment and wildfire, and the resulting carbon pools are compared to the same stand without a treatment. It is in this example that harvesting residue is burned on the site and thus contributes to emissions. The carbon balance determines whether the treatment could potentially contribute a carbon offset. Data are for stand 451 in the Mt. Emily study area.
habitat conservation planning and quantified the change in risk from several fuel treatment options. Portions of the analysis were incorporated into NEPA documents for the Five Buttes fuel management project [107]. The analysis was the first application of quantitative risk analysis for fuel treatment planning on federal lands. In a second study, a risk framework was used to analyze tradeoffs between ecological management objectives (large fire resilient trees) versus the protection of residential structures in the wildland urban interface (WUI). The former was quantified using the expected mortality of large trees and the latter with burn probability in the location of residential structures. In a subsequent application, the analyses were scaled up to analyze wildfire risk factors (burn probability, fire intensity) to social and ecological values on the Deschutes National Forest in central Oregon (Figure 8), and Oregon and Washington State (Figure 9). These example plots of fire risk factors can be used to identify social and ecological values at risk, and prioritize fuel management activities. The plots can also be used to illustrate the change in wildfire risk factors from fuel management projects [71].
Carbon pool
No treatment carbon emissions
No treatment carbon stocks
Fuel treatment carbon emissions Fuel treatment carbon stocks
Carbon balance--emissions
Carbon balance--stocks Total carbon change
Tonnesha-1
12.1
49.5
18.2 31.9
-6.1
-17.6
-23.6
used to complete several case studies to quantify landscape wildfire risk and compare treatment alternatives [54], and to examine expected carbon offsets from landscape fuel treatments [53]. In the first study, wildfire risk was calculated for northern spotted owl (Strix occidentalis caurina) habitat in central Oregon [55]. This study demonstrated the feasibility of conducting operational risk analysis for
3.4. Landscape Analysis of Fuel Treatment Impacts on Carbon. Analyzing the carbon dynamics with fire behavior models like the FVS-FFE has become a common fire modeling exercise and has been motivated by questions about carbon impacts from fuel management programs [99, 108, 109]. The

Journal of Combustion
300.---------------------------------,
250 ~\ ============--\\-' ~ :::~~~~~:~~:~~~~~~~~~~~~~~~~:\::;~~~~~~~:: ~ ~------~J----~ ~ A ~ 100+---------~---,-,-----------------~~:\--------~
so+-----~--~~----------~-4------~
----~-~~.~~~~,~~;~~~-~-~-~~-~;:_~'{:.2\:~~~:::;;. o+-~~~~~~~~~~~~~~~--~
-50~------------------------------~ 2000 2002 2004
(year)
Unthinned aboveground live - Thinned aboveground live · · · · · · Unthinned standing dead
2006 2008
Thinned standing dead Unthinned down dead Thinned down dead
FIGURE 7: ArcFuels-generated graph of fuel treatment and wildfire impacts on selected carbon pools generated with FVS-FFE simulation and ArcFuels scripts for stand 1020 in the Mt. Emily study area. The graph was generated with the process as described in Figure 3, where users can model stand dynamics within ArcMap while viewing remotely sensed imagery such as digital orthophotos. The simulation included thinning (2002), underburning (2003), fuel removal (2004), and wildfire (2005).
potential carbon impact from fuel treatments is dependent on the distribution of carbon in different pools (live, dead,
surface, canopy, etc.) and the contribution of the pools to
fire behavior. Fuel management activities differentially affect carbon pools, and result in emissions from underburning and the wood manufacturing process. Both positive [110] and negative [ 109, 111] carbon impacts from fuel treatments have been reported. These carbon studies used stand-scale simulation (one fuel type) to model fuel treatments and wildfire, and assumed carbon effects from fuel treatments are confined to the treatment units, and wildfires will burn the treated stands (i.e., burn probability= 1.0). To demonstrate a landscape risk approach to the problem that incorporates actual burn probability estimates, we used ArcFuels, FVSFFE, and FlamMap to model carbon dynamics on a large fire prone landscape [53]. The study area was a 160,000ha watershed on the Fremont-Winema National Forest in southern Oregon, US. Carbon loss functions were built within ArcFuels and FVS-FFE by burning each stand in the study area at a range of fire intensities, and recording emissions and changes in carbon pools. We estimated burn probability by simulating 50,000 wildfires in FlamMap and recording the probability of a fire at a given intensity. To calculate the expected carbon change from fuel treatments we combined the carbon loss functions with the flame length probability outputs, yielding a probabilistic estimate
13
7
] 0~,
6 OWL OWL ~L ..<: 0 OWL
bo 5 om OWL OWl.
OWL ~ o\W' 2 0~, 0~\&l"A'L <!) 4 E "' .:;::
3 "' ~ :E 2
"" ~ 0 u
0.004 0.005 0.006
Burn probability
FIGURE 8: Scatter plot of burn probability versus conditional flame length estimated with FlamMap simulations for wildland urban interface (WUI) and northern spotted owl nesting sites on the 0.6 million ha Deschutes National Forest in central Oregon. Data points are average values for polygons (ca. 100-3,000 ha). The figure shows relative risk in terms of likelihood (burn probability) and potential intensity (average flame length) for the individual WUis and nest sites.
13
12 • 11
] 10
"to 9 ~ 8
2 <!) 7 E "' 6 <:;:::
"' 5 ~
.9 4 ~ ~ 3 0 u 2
1
0 -1
0 0.001 0.002 0.003 0.004 0.005 0.006 0.007 0.008
Annual burn probability
Forest WUI Ill Colville Rogue River • High.Dens..Interface
Crooked river Siskiyou • High.Dens_Intermix Deschutes s Siuslaw • Low_Dens..Interface Fremont Snoqualmie * Low_Dens..Intermix
r.l Gifford Pinchot Cl Umatilla a Med_Dens..Interface Kaniksu Umpqua v Med_Dens..Intermix
1111 Malheur Wallowa • Very _Low _Dens_ Veg Mt. Baker 1111 Wenatchee
111 Mt. Hood ··~ Whitman Ochoco iil Willamette
1111 Okanogan Winema Olympic
FIGURE 9: Scatter plot of annual burn probability versus conditional flame length estimated with for wildland urban interface (WUI) adjacent to national forests in Oregon and Washington State, US WUI definitions were obtained from the SILVIS project [103]. Fire simulation outputs obtained from [104]. Each point represents the average value for the WUI polygon. The figure shows relative risk in terms of likelihood (annual burn probability) and potential intensity (average flame length) for the individual WUis.
14
of carbon impacts that accounted for the uncertainty about future wildfire events. The results suggested that landscape effects of treatments on expected carbon as manifested in lower burn probabilities, intensity, and a reduction in the loss of carbon outside the treated areas. Even though landscape effects of fuel treatment were observed, a net carbon loss was still observed due largely to emissions from underburns in the fuel treatments, and from manufacturing of wood products. The study contributes towards a full accounting of carbon impacts from fuel management activities that have been omitted in other studies [99, 109].
3.5. Fuel Treatment Spatial Optimization. The concept of strategically placing fuel treatments to block the progression of wildfire was demonstrated in simulation studies by Finney [56, 100]. Treatments located in a staggered, overlapping pattern perpendicular to the prevailing wind are most effective at reducing rates of spread. Moreover, there exist optimal dimensions of the individual treatment units such that the time required to burn through the unit equals the time to burn around it. Although the concept is largely theoretical, empirical data from controlled fires in rangelands have supported the simulation results, and the concept itself is useful for landscape fuel management. The concepts were institutionalized by planners in Region 5 (California) of the Forest Service as a key component of their collaborative "Fireshed Assessment" process [112]. ArcFuels became the analytical engine for the Fireshed Assessment process [94] and a Region-specific version of ArcFuels was developed for that purpose. The Forest Service created a national program to promote wider application of the concept [113], and facilitate the use of an automated treatment optimization model (TOM) developed for FlamMap [56]. The TOM system located treatments to block the fastest routes of travel and maximize the reduction in spread rate across a landscape per area treated. The process required two input landscapes, one untreated, and the other containing the fuel characteristics if all possible treatments were implemented, given administrative and other operational restrictions. Building these input data required significant geospatial processing to correctly locate treatment units and simulate changes in fuel from proposed management activities. Within ArcFuels, we developed a number of interfaces and scripts that allow both interactive and geospatial rule-based treatment assignments to facilitate input data preparation for TOM. We also built a system to build a new FlamMap landscape based on the optimal treatment location grids generated by TOM, thereby permitting more detailed analyses of the TOM treatment alternative.
4. ArcFuels Workshops-Teaching Integrated Landscape Analysis
There is a growing demand for broader training on landscape planning for fuel management and restoration projects [ 114]. The bulk of current fire modeling training sponsored by US land management agencies focuses on the application of specific fire behavior models, and lacks integration with
Journal of Combustion
the landscape planning process used by fuel management planners. To address this gap, we built training curricula and a user guide for ArcFuels that was designed to provide instructions on solving a wide range of realistic fuel management problems, including examples of measuring fuel treatment effects on social and ecological values. The tutorial includes a demonstration of risk concepts to test fuel treatment effectiveness. The data for the tutorial contain a complete set of both grid (e.g., LANDFIRE [74]) and standbased [ 115, 116] information to allow the development of different data scenarios and models. For instance, with grid data [74], the fuel planning process is conducted using the combined functionality of ArcFuels scripts, ArcGIS functionality, and FlamMap. For stand-based data, students use ArcFuels scripts, FVS-FFE, SVS, and FlamMap. In a third scenario, the tutorials mix the two data types and show how to inform grid-based analyses with stand data that are available for only portions of the landscape. Specifically, the tutorial demonstrates how to use FVS to develop adjustment factors to modify grid data to reflect posttreatment conditions. Ancillary documentation for ArcFuels includes a GIS appendix that describes spatial analyses and data manipulations that are particularly useful in the landscape fuel planning process. We have conducted over 15 workshops in the past five years attended by planning teams from around the US including over 200 fuel specialists, and academic institutions involving both students and faculty.
5. Discussion and Conclusions
Although many of our example applications were derived from case studies on US national forests, the architecture of the system and the methods for integration are relevant to risk assessment and fuel management planning efforts elsewhere. We addressed a major gap in the integration of tools for operational application to address wildfire risk issues. An important end product of the work is providing an efficient working environment that allows users to interact with fire behavior models in a geospatial context, and thus gain a better understanding of their limitations and biases [ 44]. Application of the system continues to grow among planners and researchers alike, especially as federal land management agencies like the Forest Service require integrated landscape analyses to be eligible for funding from new national initiatives. Controversial Forest Service fuel treatment projects have been completed with ArcFuels, FlamMap, and FVS, and the analyses have withstood court challenges. The gap in fuel management planning tools addressed in this work was largely an artifact of the decentralized and uncoordinated research programs on fire behavior models and, more importantly, the lack of operational context in the model development process. Although recent reviews have catalogued and compiled information on numerous wildfire behavior and vegetation models (Table 1 and Table 2 in [ 13 ]), we note that the vast majority of models described have never been used in a federal NEPA planning effort at any scale, primarily because the model or tool was never designed for that purpose in the first place. Our work
Journal of Combustion
with ArcFuels has demonstrated a framework for model integration that focused on the operational context for modeling. The approach, which leveraged ArcObjects and ArcMap, recognized that geospatial analyses are at the core of fuel management problems. Since the initial release of ArcFuels, a number of other wildfire modeling tool developers has adopted the same ArcGIS integration approach [117-119) and made use of ArcFuels code.
We have also eliminated some, but not all of the barriers to adopting a risk-based framework for wildfire management, a recommendation by oversight agencies [120). Our analysis framework contributes to a consistent analytical process for assessing the level of risk that communities face from wildland fire [121). Risk provides a comprehensive index of likelihood, intensity, and potential effects. Burn probability modeling and risk analyses will play an important role in research to address a number of management problems, including analyzing carbon offsets, understanding temporal and spatial tradeoffs of fuel treatments [27), and wildfire impacts to ecological conservation reserves.
We continue to develop ArcFuels and conduct workshops on wildfire risk assessment and fuel management planning. The ArcFuels code is being updated to the Microsoft NET framework for improved portability and compatibility with the newer versions of ArcGIS. Other efforts are underway to build a distributed system similar to ArcFuels, such as the Integrated Fuels Treatment Decision Support System (IFT-DSS [13, 114)). This system is designed to deliver analytical tools for fuel treatment planning over the internet using server-based fire models and geoprocessing. Our observation working with field units over the past decade is that the complexity of issues and diversity of data issues that are brought to bear on forest fuel planning demand a level of flexibility in geoprocessing that will be difficult to meet outside of a GIS such as ArcMap. Moreover, ArcGIS remains the corporate spatial data system for most public land management agencies in the US, and replicating its functionality in an online, noncommercial system will require considerable programming resources. These issues, combined with expanding requirements for fuel treatment planning that include climate change impacts and carbon accounting, will collectively require increasing flexibility at local scales to respond to the issues at hand. With multiple and varied objectives, including ecosystem restoration, wildlife habitat management, carbon sequestration, and responding to climate change issues, a fully prescripted and fuel management-specific environment for landscape planning will lack integration with these other management concerns. There are numerous ArcMap applications used by Forest Service specialists for a range of resource management problems, and it seems that integrated resource analysis for proposed management projects is best served in the ArcMap geospatial environment. Bandwidth issues and access to interagency corporate data centers are additional potential problems with an interagency system described in (114), and significant changes in agency infrastructure will be required to fully deploy an internet-based systems approach. Migrating ArcFuels scripts to a cloud-based GIS computing environment and the USDA Forest Service Citrix GIS server
15
system is in progress, which eliminates many of the presumed accessibility issues [ 114) with the current desktop AreFuels.
There are many modeling needs to keep pace with the demands of planners facing an increasingly complex array of wildfire risk issues on large fire-prone landscapes. The numerous issues and limitations with the current fire behavior models as discussed in several papers needs to be addressed. Physics-based fire models [86] to replace the wildland fire spread models described in this paper will contribute to improved wildfire simulation methods, especially in the WUI areas. Until improved models are developed, case studies need to include detailed reporting of parameters and assumptions so that accurate comparisons of results can be made. Calibration with empirical data and sensitivity analyses should accompany all modeling efforts to help ensure appropriate application of the modeling tools to the fuel management and wildfire risk assessment problems.
Acknowledgments
The authors thank John Anderson for his programming contributions to ArcFuels. Dana Simon, Geoff Babb, Bridget Naylor, Berni Bahro, Joe Sherlock, Deanna Wall, Lauren Miller, and Nathan Amboy have contributed to the development of ArcFuels and the ideas presented in this paper. Michele Bounopane provided editorial suggestions to an earlier draft. Funding from the Joint Fire Science Program (03-4-1-04), and the US Forest Service Western Wildland Environmental Threat Assessment Center is gratefully acknowledged.
References
[ 1] D. C. Calkin, M. A. Finney, A. A. Ager, M. P. Thompson, and K. M. Gebert, "Progress towards and barriers to implementation of a risk framework for US federal wildland fire policy and decision making;' Forest Policy and Economics, vol. 13, no. 5, pp. 378-389, 2011.
[2] USDA-USDI, "(United States Department of Agriculture and United States Department of Interior) National Fire Plan. A collaborative approach for reducing wildland fire risks to communities and the environment;' Washington, DC, USA, December 2006.
[3] HFRA, "Healthy forest restoration act," H.R. 1904. United States Congress, Washington, DC, USA, 2003.
[4] T. Sexton, "U.S. Federal fuel management programs: reducing risk to communities and increasing ecosystem resilience and sustainability," in Proceedings of the Fuels ManagementHow to Measure Success, Proceedings RMRS-P-41, pp. 9-12, USDA Forest Service, Rocky Mountain Research Station, Portland, Ore, USA, March 2006.
[5] T. Schoennagel, C. R. Nelson, D. M. Theobald, G. C. Carnwath, and T. B. Chapman, "Implementation of National Fire Plan treatments near the wildland-urban interface in the western United States," Proceedings of the National Academy of Sciences of the United States of America, vol. 106, no. 26, pp. 10706-10711,2009.
[6] A. L. Westerling, H. G. Hidalgo, D. R. Cayan, and T. W. Swetnam, "Warming and earlier spring increase Western U.S. forest wildfire activity," Science, vol. 313, no. 5789, pp. 940-943,2006.
16
[7) S. W. Running, "Is global warming causing more, larger wildfires?" Science, vol. 313, no. 5789, pp. 927-928,2006.
[8) J. K. Agee and C. N. Skinner, "Basic principles of forest fuel reduction treatments," Forest Ecology and Management, vol. 211, no. 1-2, pp. 83-96, 2005.
[9) J. K. Agee, B. Bahro, M. A. Finney et al., "The use of shaded fuelbreaks in landscape fire management;' Forest Ecology and Management, vol. 127, no. 1-3, pp. 55-66,2000.
[ 10) M.A. Finney and J. D. Cohen, "Expectation and evaluation of fuel management objectives," in Proceedings of the Fire, Fuel Treatments, and Ecological Restoration, Proceedings RMRSP-29, pp. 353-366, USDA Forest Service, Rocky Mountain Research Station, 2003.
[11) J. F. Johnson, D. N. Bengston, D. P. Fan, and K. C. Nelson, "US policy response to the fuels management problem: an analysis of the public debate about the Healthy Forests Initiative and the Healthy Forests Restoration Act," in Proceedings of the Fuels Management-How to Measure Success, Proceedings RMRS-P-41, pp. 59-66, U.S. Department of Agriculture, Forest Service, Rocky Mountain Research Station, Portland, Ore, USA, March 2006.
[12) D. L. Peterson and M. C. Johnson, "Science-based strategic planning for hazardous fuel treatment," Fire Management Today, vol. 67, pp. 13-18, 2007.
[13) E. D. Reinhardt and M. B. Dickinson, "First-order fire effects models for land management: overview and issues," Fire Ecology, vol. 6, no. 1, pp. 131-142,2010.
[14) B. M. Collins, S. L. Stephens, J. J. Moghaddas, and J. Battles, "Challenges and approaches in planning fuel treatments across fire-excluded forested landscapes," Journal of Forestry, vol. 108, no. 1, pp. 24-31, 2010.
[15) P. Andrews, M. Finney, and M. Fischetti, "Predicting wildfires," Scientific American, vol. 297, no. 2, pp. 47-55, 2007.
[16) J. McDaniel, "The emergence and potential of new wildfire risk assessment tools," Wildfire Lessons Learned, pp. 1-7, 2009.
[ 17) J. H. Scott, "NEXUS: a system for assessing crown fire hazard;' Fire Management Notes, vol. 59, pp. 21-24, 1999.
[18) S. A. Rebain, "The fire and fuels extension to the forest vegetation simulator: updated model documentation;' Tech. Rep., U. S. Department of Agriculture, Forest Service, Forest Management Service Center, Fort Collins, Colo, USA, 2010.
[19) M.A. Finney, "FARSITE: fire area simulator-model development and evaluation;' Tech. Rep. RMRS-RP-4, U.S. Department of Agriculture, Forest Service, Rocky Mountain Forest and Range Experiment Station, Ogden, Utah, USA, 1998.
[20) M.A. Finney, "An overview of FlamMap fire modeling capabilities," in Proceedings of the Fuels Management-How to Measure Success, pp. 213-220, Portland, Ore, USA, March 2006.
[21) P. L. Andrews, "BehavePlus fire modeling system: past, present, and future," in Proceedings of 7th Symposium on Fire and Forest Meteorological Society, pp. 1-13, Bar Harbor, Maine, October 2007.
[22) M.A. Finney, I. C. Grenfell, C. W. McHugh et al., "A method for ensemble wildland.fire simulation," Environmental Modeling and Assessment, vol. 16, no. 2, pp. 153-167,2011.
[23) J. Zachariassen, K. F. Zeller, N. Nikolov, and T. McClelland, "Are view of the Forest Service remote automated weather station (RAWS) network;' Tech. Rep. RMRS-GTR-119, U.S. Department of Agriculture, Forest Service, Rocky Mountain Research Station, Fort Collins, Colo, USA, 2003.
Journal of Combustion
[24) B. Butler, M. Finney, L. Bradshaw et al., "WindWizard: a new tool for fire management decision support;' in Proceedings of the Fuels Management-How to Measure Success, Proceedings RMRS-P-41, p. 809, U.S. Department of Agriculture, Forest Service, Rocky Mountain Research Station, Portland, Ore, USA, March 2006.
[25) USDA, "(United States Department of Agriculture) KCFAST: Kansas City fire access software user's guide," U.S. Department of Agriculture, Forest Service, Fire and Aviation Management, Washington, DC, USA, 1996.
[26) R. D. Stratton, "Guidance on spatial wildland fire analysis: models, tools, and techniques," Tech. Rep. RMRS-GTR-183, U.S. Department of Agriculture, Forest Service, Rocky Mountain Research Station, Fort Collins, Colo, USA, 2006.
[27) M.A. Finney, R. C. Seli, C. W. McHugh, A. A. Ager, B. Bahro, and J. K. Agee, "Simulation of long-term landscape-level fuel treatment effects on large wildfires," International Journal of Wildland Fire, vol. 16, no. 6, pp. 712-727,2007.
[28) M.A. Finney, "Chapter 9, Landscape fire simulation and fuel treatment optimization," Methods for Integrated Modeling of Landscape Change: Interior Northwest Landscape Analysis, System PNW-GTR 610, US Forest Service, Portland, Ore, USA, 2004.
[29) USDA, "(United States Department of Agriculture) Omnibus Public Land Management Act of 2009;' Title IV: Landscape Restoration. PL 111-11,2009.
[30) NEPA, "National Environmental Policy Act," 42 U.S.C., USA, 1969.
[31) F. A. Albini, "Estimating wildfire behavior and effects;' Tech. Rep. INT-GTR-30, U.S. Department of Agriculture, Forest Service, Intermountain Forest and Range Experiment Station, Ogden, Utah, USA, 1976.
[32) F. A. Albini, "Spot fire distance from burning trees- a predictive model," Tech. Rep. INT-56, USDA Forest Service, Intermountain Forest and Range Experiment Station, Ogden, Utah, USA, 1979.
[33) H. E.· Anderson, "Predicting wind-driven wildland fire size and shape;' Tech. Rep. INT-305, U.S. Department of Agriculture, Forest Service, Intermountain Forest and Range Experiment Station, Ogden, Utah, USA, 1983.
[34) C. E. Van Wagner, "Conditions for the start and spread of crown fire," Canadian Journal of Forest Research, vol. 7, pp. 23-34, 1977.
[35) R. C. Rothermel, "Predicting behavior and size of crown fires in the Northern Rocky Mountains," Tech. Rep. INT-438, U.S. Department of Agriculture, Forest Service, Intermountain Rearch Station, Ogden, Utah, USA, 1991.
[36) J. H. Scott and E. D. Reinhardt, "Assessing crown fire potential by linking models of surface and crown fire behavior;' Tech. Rep. RMRS-RP-29, U.S. Department of Agriculture, Forest Service, Rocky Mountain Research Station, Fort Collins, Colo, USA, 2001.
[37) E. D. Reinhardt and N. L. Crookston, "The fire and fuels extension to the forest vegetation simulator," Tech. Rep. RMRSGTR-116, USDA Forest Service, Rocky Mountain Research Station, Ogden, Utah, USA, 2003.
[38) M.A. Finney, "An overview of FlamMap fire modeling capabilities;' in Proceedings of the Fuels Management-How to Measure Success, pp. 28-30, USDA, Forest Service, Rocky Mountain Research Station, Portland, Ore, USA, March 2006.
[39) D. L. Peterson, L. Evers, R. A. Gravenmier, and E. Eberhardt, "A consumer guide: tools to manage vegetation and fuels," Tech. Rep. PNW-GTR-690, U.S. Department of Agriculture,
Journal of Combustion
Forest Service, Pacific Northwest Research Station, Portland, Ore, USA, 2007.
[ 40] C. W. McHugh, "Considerations in the use of models available for fuel treatment analysis;' in Proceedings of the Fuels Management-How to Measure Success, Proceedings RMRSP-41, pp. 81-105, U.S. Department of Agriculture, Forest Service, Rocky Mountain Research Station, Portland, Ore, USA, March 2006.
[41] K. T. Chang, Programming ArcObjects with VBA: A Task Oriented Approach, CRC Press, Boca Raton, Fla, USA, 2004.
[42] J. M. Varner and C. R. Keyes, "Fuels treatments and fire models: errors and corrections;' Fire Management Today, vol. 69,pp.47-50,2009.
[43] W. E. Mell, S. L. Manzella, A. Maranghides, D. Butry, and R. G. Rehm, "The wildland-urban interface fire problemcurrent approaches and research-needs;' International Journal of Wildland Fire, vol. 19, no. 2, pp. 238-251, 2010.
[44] M. G. Cruz and M. E. Alexander, "Assessing crown fire potential in coniferous forests of western North America: a critique of current approaches and recent simulation studies:' International Journal of Wildland Fire, vol. 19, no. 4, pp. 377-398, 2010.
[45] R. C. Rothermel, "A mathematical model for predicting fire spread in wildland fuels;' Tech. Rep. INT-1 15, U.S. Department of Agriculture, Forest Service, Intermountain Forest and Range Experiment Station Research, 1972.
[ 46] C. E. Van Wagner, "Prediction of crown fire behavior in two stands of jack pine," Canadian Journal of Forest Research, vol. 23,pp.442-449, 1993.
[47] J. Scott and E. Reinhardt, "Assessing crown fire potential by linking models of surface and crown fire behavior," Tech. Rep. RMRS-RP-29, U.S. Department of Agriculture, Forest Service, Rocky Mountain Research Station, Fort Collins, Colo, USA, 200 I.
[48] K. Stephan, M. Miller, and M. B. Dickinson, "First-order fire effects on herbs and shrubs: present knowledge and process modeling needs;' Fire Ecology, vol. 6, no. 1, pp. 95-114,2010.
[49] K. L. Kavanagh, M. B. Dickinson, and A. S. Bova, "A way forward for fire-caused tree mortality prediction: modeling a physiological consequence of fire;' Fire Ecology, vol. 6, no. 1, pp. 80-94,2010.
[50] B. W. Butler and M. B. Dickinson, "Tree injury and mortality in fires: developing process-based models;' Fire Ecology, vol. 6,no. l,pp.55-79,2010.
[51] W. J, Massman, J, M. Frank, and S. J, Mooney, "Advancing investigation and physical modeling of first-order fire effects on soils," Fire Ecology, vol. 6, no. 1, pp. 36-54, 2010.
[52] N. L. Crookston and G. E. Dixon, "The forest vegetation simulator: a review of its structure, content, and applications," Computers and Electronics in Agriculture, vol. 49, no. 1, pp. 60-80, 2005.
[53] A. A. Ager, M. A. Finney, A. Mcmahan, and J, Cathcart, "Measuring the effect of fuel treatments on forest carbon using landscape risk analysis;' Natural Hazards and Earth System Science, vol. 10, no. 12, pp. 2515-2526, 2010.
[54] A. A. Ager, A. J. McMahan, J. J. Barrett, and C. W. McHugh, "A simulation study of thinning and fuel treatments on a wildland-urban interface in eastern Oregon, USA," Landscape and Urban Planning, vol. 80, no. 3, pp. 292-300, 2007.
[55] A. A. Ager, M.A. Finney, B. K. Kerns, and H. Maffei, "Modeling wildfire risk to northern spotted owl (Strix occidentalis caurina) habitat in Central Oregon, USA;' Forest Ecology and Management, vol. 246, no. 1, pp. 45-56, 2007.
17
[56] M.A. Finney, "A computational method for optimising fuel treatment locations," International Journal of Wildland Fire, vol. 16, no. 6, pp. 702-711, 2007.
[57] R. J, Derose and J, N. Long, "Wildfire and spruce beetle outbreak: simulation of interacting disturbances in the central rocky mountains;' Ecoscience, vol. 16, no. 1, pp. 28-38, 2009.
[58] M. Hurteau and M. North, "Fuel treatment effects on treebased forest carbon storage and emissions under modeled wildfire scenarios;' Frontiers in Ecology and the Environment, vol. 7, no. 8, pp. 409-414,2009.
[59] R. McGaughey, "Visualizing forest stand dynamics using the Stand Visualization System;' in Proceedingsof the ACSM/ASPRS Annual Convention and Exposition, American Society for Photogrammetry and Remote Sensing, Bethesda, Md, USA, 1997.
[60] J, K. Agee and M. R. Lolley, "Thinning and prescribed fire effects on fuels and potential fire behavior in an Eastern Cascades forest, Washington, USA;' Fire Ecology, vol. 2, pp. 3-19, 2006.
[61] D. A. Perry, H. Jing, A. Youngblood, and D. R. Oetter, "Forest structure and fire susceptibility in volcanic landscapes of the eastern high Cascades, Oregon;' Conservation Biology, vol. 18,no.4,pp.913-926,2004.
[ 62] J. P. Roccaforte, P. Z. Fule, and W. W. Covington, "Landscapescale changes in canopy fuels and potential fire behaviour following ponderosa pine restoration treatments;' International Journal of Wildland Fire, vol. 17, no. 2, pp. 293-303, 2008.
[63] F. A. Heinsch and P. L. Andrews, "BehavePlus fire modeling system, version 5.0: design and features," Tech. Rep. RMRSGTR-249, U.S. Department of Agriculture, Forest Service, Rocky Mountain Research Station, Fort Collins, Colo, USA, 2010.
[64] N. M. Vaillant, J, Fites-Kaufman, A. L. Reiner, E. K. NoonanWright, and S. N. Dailey, "Effect of fuel treatments on fuels and potential fire behavior in California, USA, national forests," Fire Ecology, vol. 5, no. 2, pp. 14-29, 2009.
[65] J, S. Glitzenstein, D. R. Streng, G. L. Achtemeier, L. P. Naeher, and D. D. Wade, "Fuels and fire behavior in chipped and unchipped plots: implications for land management near the wildland/urban interface:' Forest Ecology and Management, vol. 236, no. 1, pp. 18-29, 2006.
[ 66] W. Page and M. J. Jenkins, "Predicted fire behavior in selected mountain pine beetle-infested lodgepole pine," Forest Science, vol. 53, no. 6, pp. 662-674, 2007.
[67] D. A. Schmidt, A. H. Taylor, and C. N. Skiimer, "The influence of fuels treatment and landscape arrangement on simulated fire behavior, Southern Cascade range, California;' Forest Ecology and Management, vol. 255, no. 8-9, pp. 3170-3184, 2008.
[68] P. L. Andrews, C. D. Bevins, and R. C. Seli, "BehavePlus fire modeling system, version 3.0: user's guide," Tech. Rep. RMRS-GTR-106WWW, U.S. Department of Agriculture, Forest Service, Ogden, Utah, USA, 2005.
[69] J. J. Moghaddas, B. M. Collins, K. Menning, E. E. Y. Moghaddas, and S. L. Stephens, "Fuel treatment effects on modeled landscape-level fire behavior in the northern Sierra Nevada;' Canadian Journal of Forest Research, vol. 40, no. 9, pp. 1751-1765,2010.
[70] R. E. Keane, S. A. Drury, E. C. Karau, P. F. Hessburg, and K. M. Reynolds, "A method for mapping fire hazard and risk across multiple scales and its application in fire management," Ecological Modelling, vol. 221, no. 1, pp. 2-18, 2010.
18
[71] A. A. Ager, N. M. Vaillant, and M.A. Finney, "A comparison of landscape fuel treatment strategies to mitigate wildland fire risk in the urban interface and preserve old forest structure," Forest Ecology and Management, vol. 259, no. 8, pp. 1556-1570,2010.
[72] }. H. Scott and R. E. Burgan, "Standard fire behavior fuel models: a comprehensive set for use with Rothermel's surface fire spread model," Tech. Rep. RMRS-GTR-153, USDA Forest Service General Technical Report, Rocky Mountain Research Station, 2005.
[73] H. E. Anderson, "Aids to determining fuel models for estimating fire behavior," Tech. Rep. INT-122, U.S. Department of Agriculture, Forest Service, Intermountain Forest and Range Experiment Station, Ogden, Utah, USA, 1982.
[74] M. G. Rollins, "LANDFIRE: a nationally consistent vegetation, wildland fire, and fuel assessment," International Journal of Wildland Fire, vol. 18, no. 3, pp. 235-249,2009.
[75] M. A. Finney, "Fire growth using minimum travel time methods;' Canadian Journal of Forest Research, vol. 32, no. 8,pp. 1420-1424,2002.
[76] W. W. Hargrove, J. P. Spruce, G. E. Gasser, and F. M. Hoffman, "Toward a national early warning system for forest disturbances using remotely sensed canopy phenalogy;' Photogrammetric Engineering and Remote Sensing, vol. 75, no. 10, pp. 1150-1156,2009.
[77] R. A. Wilson, "Reformulation for forest fire spread equations in SI units;' Tech. Rep. INT-292, U.S. Department of Agriculture, Forest Service, Ogden, Utah, USA, 1980.
[78] G. M. Byram, "Combustion of forest fuels;' Forest Fire: Control and Use, McGraw-Hill, New York, NY, USA, 1959.
[79] M. E. Alexander, "Help with making crown fire hazard assessments," in Proceedings of the Symposium and Workshop on Protecting People and Homes from Wildfire in the Interior West, pp. 147-156, USDA Forest Service, 1988, General Technical Report INT-251.
[80] M.A. Finney, R. C. Seli, C. W. McHugh, A. A. Ager, B. Bahro, and J. K. Agee, "Simulation of long-term landscape-level fuel treatment effects on large wildfires," in Proceedingsof the Fuels Management-How to Measure Success, pp. 125-148, USDA Forest Service, Rocky Mountain Research Station, Portland, Ore, USA, 2006, Proceedings RMRS-P-41.
[81] I. Knight and J. Coleman, "A fire perimeter expansion algorithm based on Huygens' wavelet propagation;' International Journal of Wildland Fire, vol. 3, pp. 73-84, 1993.
[ 82] M. A. Finney, "A method for Fnsemble Wildland Five Simulation," Environmental Modeling and Assessment, vol. 16, pp. 153-167.
[83] WFDSS, "Wildland fire decision support systems," 2010. [84] FPA, "Fire Program Analysis," 2010, http://www.fpa.nifc
.gov/. [85] G. E. Dixon, "Essential FVS: A user's guide to the Forest
Vegetation Simulator;' Tech. Rep., U.S. Department of Agriculture, Forest Service, Forest Management Service Center, Fort Collins, Colo, USA, 2003.
[86] W. Mell, M.A. Jenkins, J. Gould, and P. Cheney, ''A physicsbased approach to modelling grassland fires;' International Journal of Wildland Fire, vol. 16, no. 1, pp. 1-22, 2007.
[87] R. Linn, J. Reisner, J. J. Colman, and J. Winterkamp, "Studying wildfire behavior using FIRETEC," International Journal of Wildland Fire, vol. 11, no. 3-4, pp. 233-246, 2002.
[88] J.D. Cohen, M.A. Finney, and K. M. Yedinak, ''Active spreading crown fire characteristics: implications for modeling," in Proceedings of the 5th International Conference on Forest Fire Research, Figueira da Foz, Portugal, November 2006.
Journal of Combustion
[89] J. H. Scott, "Comparison of crown fire modeling systems used in three fire management applications;' Tech. Rep. RMRSRP-58, USDA Forest Service Research, 2006.
[90] E. Reinhardt, J. Scott, K. Gray, and R. Keane, "Estimating canopy fuel characteristics in five conifer stands in the western United States using tree and stand measurements;' Canadian Journal of Forest Research, vol. 36, no. 11, pp. 2803-2814, 2006.
[91] R. W. Sando and C. H. Wick, ''A method of evaluating crown fuels in forest stands;' Tech. Rep. NC-84, United States Department of Agriculture Forest Service, North Central Forest Experiment Station, St. Paul, Minn, USA, 1972.
[92] T. Pattison, Programming Distributed Applications with COM and Microsoft Visual Basic 6.0, Microsoft Press, Redmond, Wash, USA, 1998.
[93] N. L. Crookston, D. L. Gammel, and S. Rebain, "User's guide to the database extension of the forest vegetation simulator version 2.0," Tech. Rep., U.S. Department of Agriculture, Forest Service, Forest Management Service Center, Fort Collins, Colo, USA, 2004.
[94] A. A. Ager, "Automating the fireshed assessment process with ArcGIS;' in Proceedings of the Fuels Management-How to Measure Success, Proceedings RMRS-P41, pp. 163-168, U.S. Department of Agriculture, Forest Service, Rocky Mountain Research Station, Portland, Ore, USA, March 2006.
[95] A. A. Ager, N. M. Vaillant, J. Anderson, and L. Miller, ''ArcFuels User Guide: for use with ArcGIS 9.X;' Tech. Rep., US Department of Agriculture, Forest Service, Pacific Northwest Research Station, Western Wildland Environmental Threat Assessment Center, Prineville, Ore, USA, 2011.
[96] D. Calkin, A. Ager, M. Thompson et a!., "Comparative risk assessment framework for wildland fire management: the 2010 cohesive strategy science report;' Tech. Rep. RMRSGTR-262, Rocky Mountain Research Station, Missoula, Mont, USA, 2011, p. 62. .
[97] M.A. Finney, "The challenge of quantitative risk analysis for wildland fire," Forest Ecology and Management, vol. 211, no. 1-2,pp.97-108,2005.
[98] M.A. Finney, C. W. McHugh, and I. C. Grenfell, "Stand- and landscape-level effects of prescribed burning on two Arizona wildfires;' Canadian Journal of Forest Research, vol. 3S, no. 7, pp. 1714-1722,2005.
[99] M. D. Hurteau, G. W. Koch, and B. A. Hungate, "Carbon protection and fire risk reduction: toward a full accounting of forest carbon offsets;' Frontiers in Ecology and the Environment, vol. 6, no. 9, pp. 493-498, 2008.
[100] M.A. Finney, "Design of regular landscape fuel treatment patterns for modifying fire growth and behavior;' Forest Science, vol. 47, no. 2, pp. 219-228, 2001.
[101] N. L. Crookston and A. R. Stage, "User's guide to the parallel processing extension of the prognosis model;' Tech. Rep. IN-281, U.S. Department of Agriculture, Forest Service, Intermountain Research Station, Ogden, Utah, USA, 1991.
[102] E. Z. Baskent and S. Keles, "Spatial forest planning: a review;' Ecological Modelling, vol. 188, no. 2-4, pp. 145-173, 2005.
[103] V. C. Radeloff, R. B. Hammer, S. I. Stewart, J. S. Fried, S. S. Holcomb, and J. F. McKeefry, "The wildland-urban interface in the United States," Ecological Applications, vol. 15, no. 3, pp. 799-805,2005.
[104] D. E. Calkin, A. A. Ager, J. Gilbertson-Day et al., "Wildfire risk and hazard: procedures for the first approximation," Tech. Rep. GTR-RMRS-235, U.S. Department of Agriculture, Forest Service, Rocky Mountain Research Station, Fort Collins, Colo, USA, 2010.
Journal of Combustion
[105] M. A. Finney, C. W. McHug, I. C. Grenfell, K. L. Riley, and K. C. Short, "A simulation of probabilistic wildfire risk components for the continental United States;' Stochastic Environmental Research and Risk Assessment, 20 ll.
[106] M.P. Thompson, D. E. Calkin, M.A. Finney, A. A. Ager, and J. W. Gilbertson-Day, "Integrated national-scale assessment of wildfire risk to human and ecological values;' Stochastic Environmental Research and Risk Assessment, vol. 25, pp. 761-780, 2011.
[107] USDA, "(United States Department of Agriculture) Environmental impact statement: Five Buttes project;' Forest Service. Crescent Ranger District, Deschutes National Forest, Oregon, USA, June 2007.
[108] M. North, M. Hurteau, and J. Innes, "Fire suppression and fuels treatment effects on mixed-conifer carbon stocks and emissions," Ecological Applications, vol. 19, no. 6, pp. 1385-1396,2009.
[109] E. Reinhardt and L. Holsinger, "Effects of fuel treatments on carbon-disturbance relationships in forests of the northern Rocky Mountains;' Forest Ecqlogy and Management, vol. 259, no.8,pp. 1427-1435,2010.
[110] A. J. Finkral and A. M. Evans, "The effects of a thinning treatment on carbon stocks in a northern Arizona ponderosa pine forest:' Forest Ecology and Management, vol. 255, no. 7, pp.2743-2750,2008.
[Ill] S. R. Mitchell, M. E. Harmon, and K. E. B. O'Connell, "Forest fuel reduction alters fire severity and long-term carbon storage in three Pacific Northwest ecosystems;' Ecological Applications, vol. 19, no. 3, pp. 643-655, 2009.
[112] B. Bahro, K. H. Barber, J. W. Sherlock, and D. A. Yasuda, "Stewardship and fireshed assessment: a process for designing a landscape fuel treatment strategy;' Tech. Rep. PSWGTR-203, USDA Forest Service Pacific Southwest Research Station, 2007.
[113] D. M. Gercke and S. A. Stewart, "Strategic placement of treatments (SPOTS): maximizing the effectiveness of fuel and vegetation treatments on problem fire behavior and effects;' in Proceedings of the 1st Fire Behavior and Fuels Conference: Fuels Management-How to Measure Success, Portland, Ore, USA, March 2006.
[ 114] G. Wells, "A powerful new planning environment for fuels managers: the Interagency Fuels Treatment Decision Support System," Fire Science Digest, vol. 7, p. 11, 2009.
[ 115] S. A. Drury and J. M. Herynk, "The national tree-list layer: a seamless, spatially explicit tree-list layer for the continental United States;' Tech. Rep. GTR-254, USDA Forest Service, Rocky Mountain Research Station, 2011.
[116] J. L. Ohmann and M. J. Gregory, "Predictive mapping of forest composition and structure with direct gradient analysis and nearest-neighbor imputation in coastal Oregon, U.S.A," Canadian Journal of Forest Research, vol. 32, no. 4, pp. 725-741, 2002.
[117] D. Hamilton, J. Jones, and W. Hann, "Fire behavior assessment tool (FBAT) for ArcGIS 9.2-9.3 (version 1.3.0);' National Interagency Fuels Technology Team, 2007, http:// www.niftt.gov/.
[118] D. Hamilton, J. Bramel, D. Helmbrecht, J. Jones, and W. Hann, "First order fire effects model mapping tool (FOFEMMT) for ArcGIS 9.2-9.3 (version 1.1.0)," National Interagency Fuels, Fire, and Vegetation Technology Transfer, 2009, http://www.niftt.gov/.
[119] L. Hutter, J. Jones, W. Hann, and M. Levesque, "Area Change Tool (ACT) for ArcGIS 9.2-9.3 (version 3.0.2)," National
19
Interagency Fuels, Fire, & Vegetation Technology Transfer, 2009, http:/ /www.niftt.gov/. ·
[120] GAO, "(Government Accounting Office) Wildland fires: Forest Service and BLM need better information and a systematic approach for assessing the risks of environmental effects," Tech. Rep. GA0-04-705, GAO, Washington, DC, USA, June 2004.
[121] OIG, "(Office oflnspector General) Audit report: implementation of the healthy forests initiative;' Tech. Rep. 08601-6-AT, OIG, Washington, DC, USA, September 2006.


![Conifer expansion [Chapter M.] - fs.fed.us](https://img.pdfslide.us/doc/110x75/61cace1c98ffe14ced450e01/conifer-expansion-chapter-m-fsfedus.jpg)