Embed Size (px)
Citation preview
Utility Led Electric Vehicle Charging Programs 1
Consumer Insights For Electric Vehicle Charging Programs-
Delhi
Consumer perception and behaviors will determine the success of EV charging facilities
India E-Mobility Finance Facility
May, 2020
Consumer Insights For Electric Vehicle Charging Programs- Delhi 2
The “BSES Consumer Centric Electric Vehicle Charging
Program Study” has been conducted for BSES Rajdhani Power
Limited (BRPL) one of Delhi’s electricity utilities, by the India E-
Mobility Finance Facility (IEMF) which is a not for profit initiative
for accelerating Electric Vehicle adoption in India. This study has
been completed in 2 parts. The first part is a consumer survey to
understand consumer requirements. The second is the program
design study that followed the results of the consumer survey to
make recommendations on feasible programs for the city. This
report covers the first part- insights into consumer perceptions
about EVs.
This study has been completed by a joint team of BRPL and
IEMF
India E-mobility Finance Facility is a not for profit Project
Preparatory Facility (PPF) for catalyzing flow of finance into
electric mobility projects. Our beneficiaries include utilities,
financing institutions, private and public companies working
towards bringing innovative electric mobility services for public
good. IEMF supports projects through all stages of
development. IEMF selects projects for support through an
interactive platform. It then develops these projects, bringing
together the right skills to create implementable projects, garner
financial support, and identify and partner with the right partners
to create a winning ecosystem of public good. Finally it also
supports public awareness building programs for EVs.
BSES Rajdhani is Delhi’s largest electricity Distribution Company
(DISCOMs). BRPL distributes power to an area spread over 750
sq. km with a customer density of ~3100 per sq km. It's over
~2.4 million customers are spread in 21 districts across South
and West areas including Alaknanda, Dwarka, Hauz Khas,
Jaffarpur, Janak Puri, Khanpur, Mundka, Najafgarh, Nangloi,
Nehru Place, Nizamuddin, Palam, Punjabi Bagh, R.K. Puram,
Saket, Sarita Vihar, Tagore Garden, Vasant Kunj, Vikas Puri,
Uttam Nagar & Mohan Garden. BRPL is among the most
successful electricity utilities in the country and has launched a
number of highly beneficial programs for reducing its climate
change impacts including promotion of energy efficiency
appliances, promotion of residential solar rooftop installations
etc. BRPL is known to be a highly consumer focused DISCOM,
always striving to improve its services for its customers.
About This Study
India E Mobility
Finance Facility (IEMF)
BSES Rajdhani Power Limited
3
Content 1. Executive summary .................................................................................................................................................... 6
2. Introduction ................................................................................................................................................................ 9
3. Process of this study ................................................................................................................................................ 10
4. Main results of the study .......................................................................................................................................... 12
4.1. Personal use vehicles ........................................................................................................................................ 12
Drivers and hurdles for EV adoption ........................................................................................................... 14 4.1.3.
Parking & charging options ........................................................................................................................ 14 4.1.4.
EV charging plans ....................................................................................................................................... 15 4.1.5.
DISCOM engagement ................................................................................................................................. 15 4.1.6.
Resident Welfare Associations (RWA) response ........................................................................................ 16 4.1.7.
4.2. Fleet operator segment ...................................................................................................................................... 17
Respondent profile ..................................................................................................................................... 18 4.2.3.
Drivers and barriers for EV adoption ........................................................................................................... 18 4.2.4.
Parking & charging options ........................................................................................................................ 19 4.2.5.
EV performance .......................................................................................................................................... 19 4.2.6.
DISCOM engagement ................................................................................................................................. 20 4.2.7.
Manufacturers’ response ............................................................................................................................ 20 4.2.8.
4.1. Commercial spaces segment ............................................................................................................................. 21
Respondent profile ..................................................................................................................................... 22 4.1.3.
Drivers and barriers for EV adoption ........................................................................................................... 22 4.1.4.
Parking & charging options ........................................................................................................................ 22 4.1.5.
DISCOM engagement ................................................................................................................................. 23 4.1.6.
Conclusion .................................................................................................................................................. 23 4.1.7.
4.2. 3-Wheeler (3WH) segment ................................................................................................................................ 24
Respondent profile ..................................................................................................................................... 24 4.2.3.
Drivers And barriers for EV adoption .......................................................................................................... 25 4.2.4.
Parking & charging options ........................................................................................................................ 27 4.2.5.
EV performance .......................................................................................................................................... 29 4.2.6.
5. Conclusions .............................................................................................................................................................. 31
6. Acknowledgements ................................................................................................................................................... 33
Survey information ....................................................................................................................................................... 34
Consumer Insights For Electric Vehicle Charging Programs- Delhi 4
Table of figures Figure 1 Key findings from consumers in different vehicle use segments ....................................................................... 6
Figure 2 Highlights of findings from commercial spaces survey ..................................................................................... 7
Figure 3 User reported DISCOM engagement needs ....................................................................................................... 8
Figure 4 Sales penetration of EVs in 2Wh and 4Wh segment (India) ............................................................................. 9
Figure 5 Respondent profile: personal use vehicles ...................................................................................................... 12
Figure 6 EV plans & preferences ................................................................................................................................... 13
Figure 7 Drivers and hurdles for EV adoption for personal use segment ....................................................................... 14
Figure 8 Daily parking practices .................................................................................................................................... 14
Figure 9 Indicative charging distribution- spaces + timing ............................................................................................ 15
Figure 10 Enquiries into DISCOM engagement - personal use ...................................................................................... 15
Figure 11 Fleet specifications ........................................................................................................................................ 17
Figure 12 Drivers and barriers for EV adoption ordered by fleet operator responses .................................................... 18
Figure 13 Charging preferences of fleet operators ........................................................................................................ 19
Figure 14 Fleet operator’s expectations on DISCOM engagement ................................................................................. 20
Figure 15 Driver and barriers for EV adoption as reported by manufacturers ................................................................ 21
Figure 16 Respondent profile - commercial spaces ..................................................................................................... 22
Figure 17 Barriers & drivers for EV adoption- commercial spaces ................................................................................ 22
Figure 18 Openness to allowing full public access to avail special EV tariff ................................................................... 23
Figure 19 Commercial spaces' on DISCOM engagement .............................................................................................. 23
Figure 20 Respondent profile -3WH survey .................................................................................................................. 25
Figure 21 Drivers and barriers for ICE and EV 3WH drivers .......................................................................................... 26
Figure 22 Images from Delhi's e-rickshaw charging hubs, metering arrangement, charging practices ......................... 28
Figure 23 Bad operating practices of e-rickshaw owners & chargers- corroding e-rickshaw batteries .......................... 29
5
Acronyms 2WH 2 Wheelers, like Bikes, scooters etc.
3WH 3Wheelers, like autos, rickshaws, e-rickshaws
4WH 4 Wheelers, like cars, vans etc.
Avg. Average
BRPL BSES Rajdhani Power Limited, a Delhi DISCOM
CEA Central Electricity Authority of India
DERC Delhi Electricity Regulatory Commission
DISCOM Electricity Distribution Companies, electric utilities
DSM Demand side management
e-2WH Electric 2 Wheelers, like Bikes, scooters etc.
e-3WH Electric 3Wheelers, like autos, rickshaws, e-rickshaws
e-4WH Electric 4 Wheelers, like cars, vans etc.
EV Electric vehicles
FAME Faster adoption and manufacturing of (Hybrid and ) Electric Vehicles Scheme
hrs hours
ICE Internal Combustion Engine Vehicles
IEMF India E-Mobility Finance Facility
km kilometers
kW kilowatt, unit for load/power
lacs One hundred thousand
OEMs Original Equipment Manufacturers
PCS Public Charging Stations
Rs/INR India Rupees
RWAs Residential Welfare Associations
Yrs Years
Definitions
Curbside
Charging EV Charger is installed by the roadside for charging the vehicle, not in a private garage
Poleside
Charging
EV Charger is installed along existing electricity poles on roads, without a strictly private
or strictly public mode of usage
Swapping
Stations
A place where an EV user can replace/swap out his discharged battery with a charged
battery, this is model for battery ownership as well as charging
Consumer Insights For Electric Vehicle Charging Programs- Delhi 6
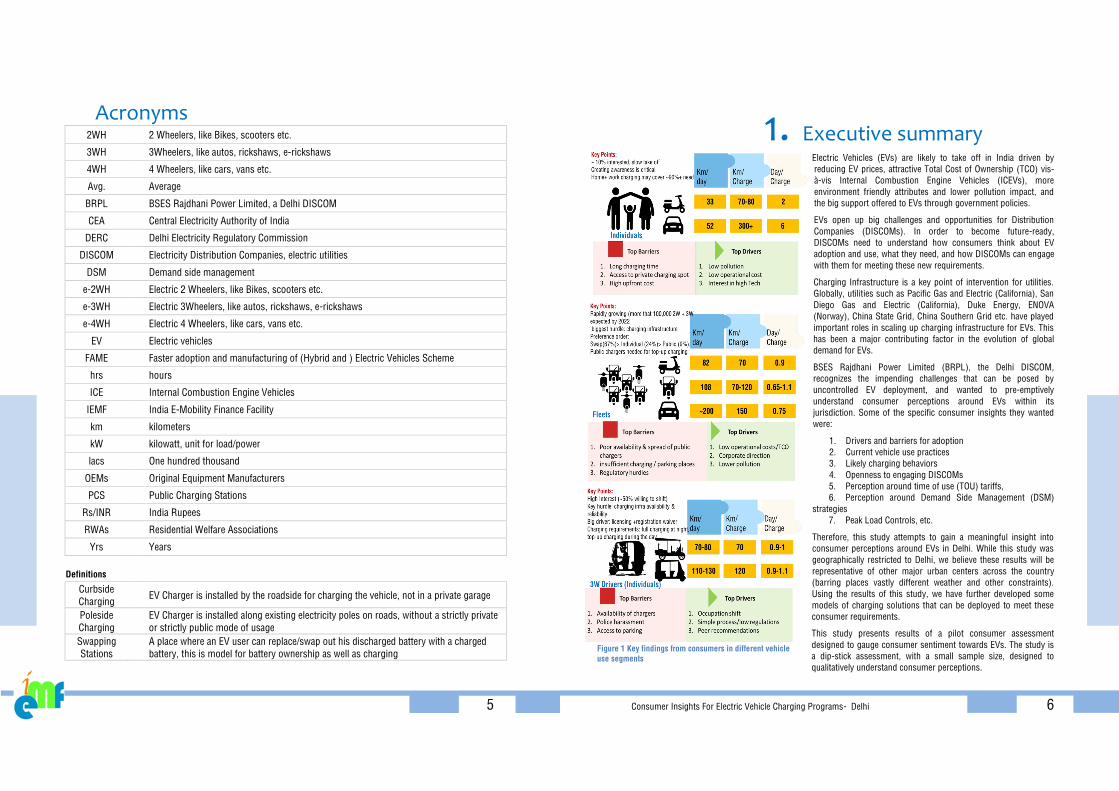
Figure 1 Key findings from consumers in different vehicle
use segments
1. Executive summary Electric Vehicles (EVs) are likely to take off in India driven by
reducing EV prices, attractive Total Cost of Ownership (TCO) vis-
à-vis Internal Combustion Engine Vehicles (ICEVs), more
environment friendly attributes and lower pollution impact, and
the big support offered to EVs through government policies.
EVs open up big challenges and opportunities for Distribution
Companies (DISCOMs). In order to become future-ready,
DISCOMs need to understand how consumers think about EV
adoption and use, what they need, and how DISCOMs can engage
with them for meeting these new requirements.
Charging Infrastructure is a key point of intervention for utilities.
Globally, utilities such as Pacific Gas and Electric (California), San
Diego Gas and Electric (California), Duke Energy, ENOVA
(Norway), China State Grid, China Southern Grid etc. have played
important roles in scaling up charging infrastructure for EVs. This
has been a major contributing factor in the evolution of global
demand for EVs.
BSES Rajdhani Power Limited (BRPL), the Delhi DISCOM,
recognizes the impending challenges that can be posed by
uncontrolled EV deployment, and wanted to pre-emptively
understand consumer perceptions around EVs within its
jurisdiction. Some of the specific consumer insights they wanted
were:
1. Drivers and barriers for adoption
2. Current vehicle use practices
3. Likely charging behaviors
4. Openness to engaging DISCOMs
5. Perception around time of use (TOU) tariffs,
6. Perception around Demand Side Management (DSM)
strategies
7. Peak Load Controls, etc.
Therefore, this study attempts to gain a meaningful insight into
consumer perceptions around EVs in Delhi. While this study was
geographically restricted to Delhi, we believe these results will be
representative of other major urban centers across the country
(barring places vastly different weather and other constraints).
Using the results of this study, we have further developed some
models of charging solutions that can be deployed to meet these
consumer requirements.
This study presents results of a pilot consumer assessment
designed to gauge consumer sentiment towards EVs. The study is
a dip-stick assessment, with a small sample size, designed to
qualitatively understand consumer perceptions.
7
The segments surveyed in this study include
1. Personal use vehicles or Individual Users and Residential Welfare Association (RWAs)
2. Commercial Spaces
3. Fleet Operators, & Original Equipment Manufacturers (OEMs), and
4. Three Wheeler Drivers
Through this survey we also reached out to some emerging charging network providers to understand their working
models and projections. In this report, we also bring light to some of their concerns and challenges.
Individual EV users are beginning to evaluate EVs (~10% showed an interest in adoption), decisions are driven
primarily by environment friendly attributes of EVs.
The personal use vehicle segment is primarily motivated by the low pollution profile of these vehicles, along with the
cost advantage.
The main hurdles for adoption in this segment include uncertainties around charging availability and charging time, as
well as the high upfront cost
Some key vehicle use patterns for this segment are particularly insightful:
– Regular travel needs: more than 1.5 hours and 50 km daily, on an average they reported spending ~ 4000
Rs/month on fuel
– Home Loads: Typically, sanctioned home loads is ~3kW, will need to increase it for charging e-cars
– Customer acceptability: For e-4WHs a price level of INR 17.5 lacs with 300km range and for e-2WHs price
of around INR 75 thousand with 70km range
Resident Welfare Associations (RWAs) had a complex response
Less than 1% residents in RWAs had discussed EV or personal charging needs with their RWAs. RWAs were primarily
excited to explore charging as an additional revenue stream for the complex.
Parking spaces in RWAs are overloaded and resident cars already outnumber available parking slots by ~40%. As far
as available electrical infrastructure is concerned, they reported average sanctioned load per home as 4.2 kW. Some
reported having additional spare capacity on common meters, which could be used for charging infrastructure, but
space was scarce and it would be hard to dedicate it for charging use.
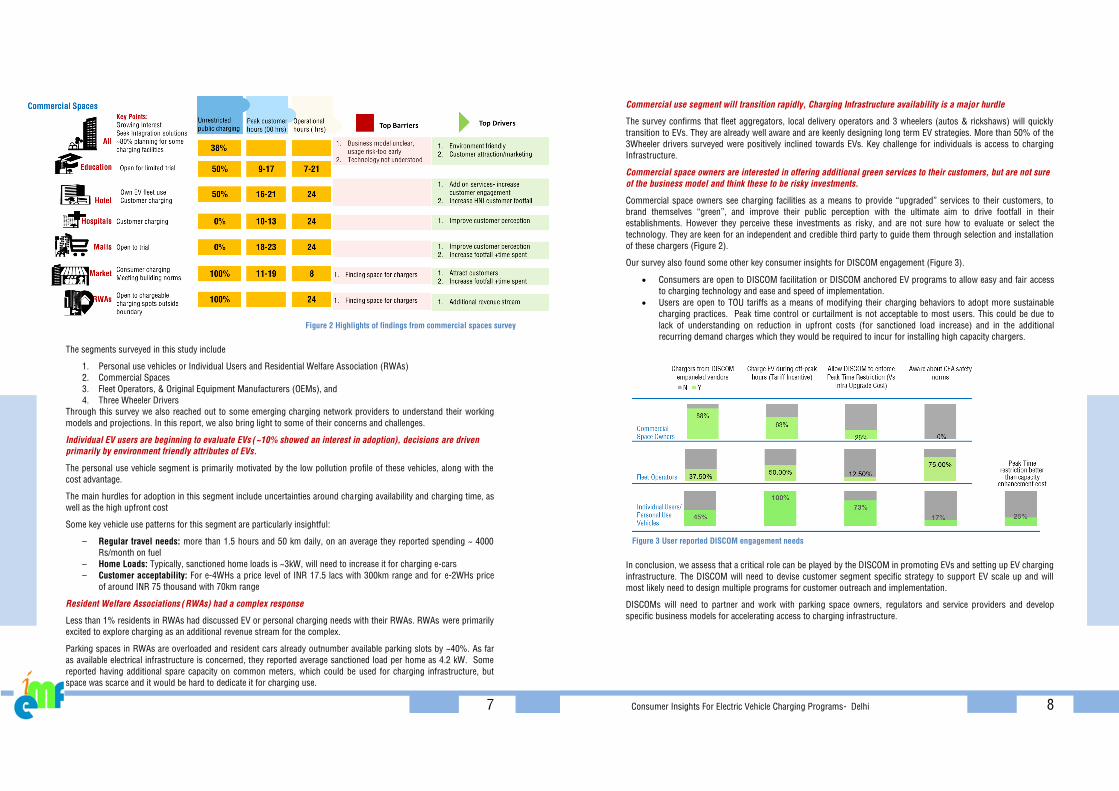
Figure 2 Highlights of findings from commercial spaces survey
Consumer Insights For Electric Vehicle Charging Programs- Delhi 8
Commercial use segment will transition rapidly, Charging Infrastructure availability is a major hurdle
The survey confirms that fleet aggregators, local delivery operators and 3 wheelers (autos & rickshaws) will quickly
transition to EVs. They are already well aware and are keenly designing long term EV strategies. More than 50% of the
3Wheeler drivers surveyed were positively inclined towards EVs. Key challenge for individuals is access to charging
Infrastructure.
Commercial space owners are interested in offering additional green services to their customers, but are not sure
of the business model and think these to be risky investments.
Commercial space owners see charging facilities as a means to provide “upgraded” services to their customers, to
brand themselves “green”, and improve their public perception with the ultimate aim to drive footfall in their
establishments. However they perceive these investments as risky, and are not sure how to evaluate or select the
technology. They are keen for an independent and credible third party to guide them through selection and installation
of these chargers (Figure 2).
Our survey also found some other key consumer insights for DISCOM engagement (Figure 3).
Consumers are open to DISCOM facilitation or DISCOM anchored EV programs to allow easy and fair access
to charging technology and ease and speed of implementation.
Users are open to TOU tariffs as a means of modifying their charging behaviors to adopt more sustainable
charging practices. Peak time control or curtailment is not acceptable to most users. This could be due to
lack of understanding on reduction in upfront costs (for sanctioned load increase) and in the additional
recurring demand charges which they would be required to incur for installing high capacity chargers.
In conclusion, we assess that a critical role can be played by the DISCOM in promoting EVs and setting up EV charging
infrastructure. The DISCOM will need to devise customer segment specific strategy to support EV scale up and will
most likely need to design multiple programs for customer outreach and implementation.
DISCOMs will need to partner and work with parking space owners, regulators and service providers and develop
specific business models for accelerating access to charging infrastructure.
Figure 3 User reported DISCOM engagement needs
9
2. Introduction Electric Vehicles (EVs) have developed at a rapid pace over the last 5 years globally and are fast gaining traction across
India. Globally, supportive government policies and technological innovations have made EVs attractive. Increasingly
Total Cost of Ownership (TCO) advantage and significant environmental benefits are driving rapid adoption. In all cases
availability of charging infrastructure has been a key driver or hurdle for rapid adoption.
There are many barriers to EV adoption too. In early consumer studies globally, the top three reasons for non-adoption
of EVs were high upfront cost, concern over driving range, and low availability of charging infrastructure1. Since then,
with declining battery costs and higher regulatory restrictions on ICE vehicles, leading automobile manufacturers along
with venture funded start-ups have brought new electric models to market. This has increased awareness among
consumers. However, adoption remains low (at less than 10% of sales, in most geographies).
More recent consumer behavior studies from developed markets show that top three drivers for EV adoption include
improvements in driving experience, monetary subsidies and benefits, and TCO advantage2. Thus, it is evident that
market response and consumer requirements are rapidly changing with changing technology trends and government
regulations.
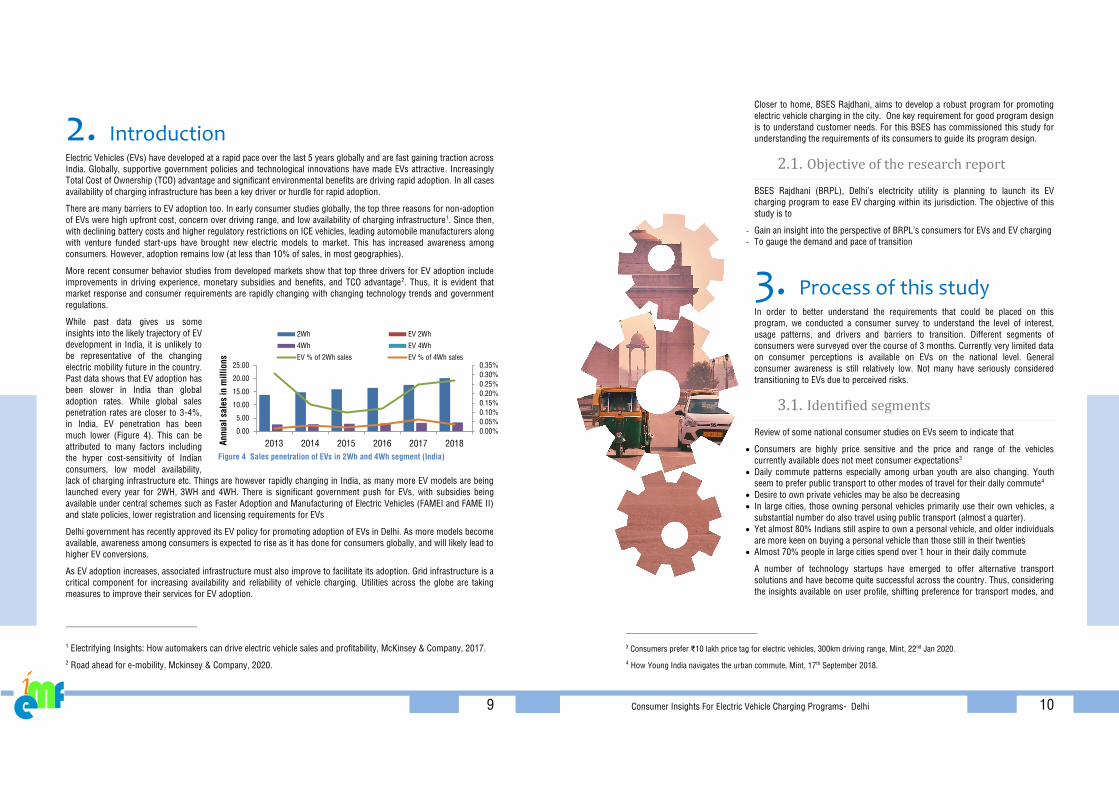
While past data gives us some
insights into the likely trajectory of EV
development in India, it is unlikely to
be representative of the changing
electric mobility future in the country.
Past data shows that EV adoption has
been slower in India than global
adoption rates. While global sales
penetration rates are closer to 3-4%,
in India, EV penetration has been
much lower (Figure 4). This can be
attributed to many factors including
the hyper cost-sensitivity of Indian
consumers, low model availability,
lack of charging infrastructure etc. Things are however rapidly changing in India, as many more EV models are being
launched every year for 2WH, 3WH and 4WH. There is significant government push for EVs, with subsidies being
available under central schemes such as Faster Adoption and Manufacturing of Electric Vehicles (FAMEI and FAME II)
and state policies, lower registration and licensing requirements for EVs
Delhi government has recently approved its EV policy for promoting adoption of EVs in Delhi. As more models become
available, awareness among consumers is expected to rise as it has done for consumers globally, and will likely lead to
higher EV conversions.
As EV adoption increases, associated infrastructure must also improve to facilitate its adoption. Grid infrastructure is a
critical component for increasing availability and reliability of vehicle charging. Utilities across the globe are taking
measures to improve their services for EV adoption.
1 Electrifying Insights: How automakers can drive electric vehicle sales and profitability, McKinsey & Company, 2017.
2 Road ahead for e-mobility, Mckinsey & Company, 2020.
0.00%
0.05%
0.10%
0.15%
0.20%
0.25%
0.30%
0.35%
0.00
5.00
10.00
15.00
20.00
25.00
2013 2014 2015 2016 2017 2018An
nu
al
sale
s in
mil
lio
ns
2Wh EV 2Wh
4Wh EV 4Wh
EV % of 2Wh sales EV % of 4Wh sales
Figure 4 Sales penetration of EVs in 2Wh and 4Wh segment (India)
Consumer Insights For Electric Vehicle Charging Programs- Delhi 10
Closer to home, BSES Rajdhani, aims to develop a robust program for promoting
electric vehicle charging in the city. One key requirement for good program design
is to understand customer needs. For this BSES has commissioned this study for
understanding the requirements of its consumers to guide its program design.
2.1. Objective of the research report
BSES Rajdhani (BRPL), Delhi’s electricity utility is planning to launch its EV
charging program to ease EV charging within its jurisdiction. The objective of this
study is to
- Gain an insight into the perspective of BRPL’s consumers for EVs and EV charging
- To gauge the demand and pace of transition
3. Process of this study In order to better understand the requirements that could be placed on this
program, we conducted a consumer survey to understand the level of interest,
usage patterns, and drivers and barriers to transition. Different segments of
consumers were surveyed over the course of 3 months. Currently very limited data
on consumer perceptions is available on EVs on the national level. General
consumer awareness is still relatively low. Not many have seriously considered
transitioning to EVs due to perceived risks.
3.1. Identified segments
Review of some national consumer studies on EVs seem to indicate that
Consumers are highly price sensitive and the price and range of the vehicles
currently available does not meet consumer expectations3
Daily commute patterns especially among urban youth are also changing. Youth
seem to prefer public transport to other modes of travel for their daily commute4
Desire to own private vehicles may be also be decreasing
In large cities, those owning personal vehicles primarily use their own vehicles, a
substantial number do also travel using public transport (almost a quarter).
Yet almost 80% Indians still aspire to own a personal vehicle, and older individuals
are more keen on buying a personal vehicle than those still in their twenties
Almost 70% people in large cities spend over 1 hour in their daily commute
A number of technology startups have emerged to offer alternative transport
solutions and have become quite successful across the country. Thus, considering
the insights available on user profile, shifting preference for transport modes, and
3 Consumers prefer ₹10 lakh price tag for electric vehicles, 300km driving range, Mint, 22nd Jan 2020.
4 How Young India navigates the urban commute, Mint, 17th September 2018.
11
the existing segmentation within BRPL consumers, we identified 4 distinct segments for consultations within this
study.
- Personal use vehicle owners-BRPL’s residential consumers (living in condominiums or independent houses)
- BRPL’s commercial consumers (hotels, hospitals, educational institutes, malls, community markets and offices)
- Fleet operators considering expanding their operations in Delhi
- Individual commercial drivers (3Wheeler drivers).
These groups were contacted for one-on-one guided surveys with about 30 questions on travel patterns, parking
preferences and overall interest in EVs.
3.2. Survey design
One-on-one guided surveys were considered appropriate for this study, since it was expected that users would likely
have many questions and may not be fully aware of recent developments in electric mobility. During these surveys,
information regarding electric vehicle model choices available, their range, their price etc. was shared with
respondents to gain more meaningful responses.
The survey was slightly modified for different segments, considering differing levels of awareness. For example for
fleet operators the questions were centered more on how they had planned their transition, while for individuals the
questions were focused on their current travel preferences. Nevertheless, all modifications of the survey contained the
same common themes of current transportation needs, modes in play, parking preferences, perceived drivers and
hurdles for EV adoption and for those having experience with electric vehicles the questions were designed to
understand how their experience has been and how they are using the vehicles. Relevant questions on tariff incentives,
peak time restrictions were also included. In all cases, one key enquiry was in respect of their interest in EVs and
whether they were seeing any specific difficulty in transitioning.
To conduct the surveys, different approaches were adopted for contacting users within different segments. Individual
residential users were contacted using information available with BRPL within its existing consumer data-base.
Responses were also taken from those willing to offer their response at BSES market-kiosks. Those willing to offer a
response were considered in the results of this study. “No responses” were excluded from analysis. For commercial
drivers (3Wheelers), the survey was done with individual drivers in high concentration areas identified by BRPL by
directly approaching them. For fleet operators, discussions were held on call to record their response. For commercial
spaces, existing commercial consumers of BRPL were contacted from BRPL’s database, their responses were noted in
one-on-one interviews on their premises to gain more insights into space availability, level of occupancy etc. more
respondent information provided in Annexure I.
The numbers of respondents in this study is small due to the highly interactive mode of interaction. The results are
therefore not amenable to statistical analysis but provide an initial insight into how users within BRPL’s jurisdiction in
Delhi are currently considering EVs. The study also provides an insight into their travel behavior so as to inform
predictions on what the patterns for EV use could emerge in the near future. Using this is as the basis, BRPL can
design a more relevant and consumer centric program for EV charging within its jurisdiction.
Consumer Insights For Electric Vehicle Charging Programs- Delhi 12
4. Main results of the study
4.1. Personal use vehicles
SUMMARY 4.1.1.
Only 10% of individual respondent showed an interest in owning
EVs. The Top Reasons for adoption include
Low Pollution Index
Low Operational Cost (including Total Cost of Ownership-
TCO).
While Hurdles to EV adoption include
Long charging times
Lack of access to private charging places
High upfront cost of the vehicle.
Another reason, which was not included in our survey but
commonly cited, was that users already owned vehicles and were
not keen on buying another or replacing the current vehicle before
its time.
In terms of parking and charging patterns, as anticipated most
respondents are looking at home charging as the primary mode of
charging, work place charging and mall charging are other modes,
in the order of priority. Public charging and street charging is not
frequently rated highly by individual respondents. While this could
be taken as prediction of future behaviors, it could also be a
reflection of the fact that home and work place charging may be
easier concepts to understand in terms of reliability and efficiency
since the equivalent parking solutions are already visible, when
compared with public and street charging which may seem
logistically more challenging in the absence of equivalent existing
models.
INTRODUCTION 4.1.2.
Personal Use Electrical Vehicle transformation is the most
important segment for creating a large-scale interest in EVs. This
is the largest automobile sale segment in India and globally, thus
is the most relevant for driving manufacturer interests and creating
a respectable share of EVs in the annual vehicle sale numbers.
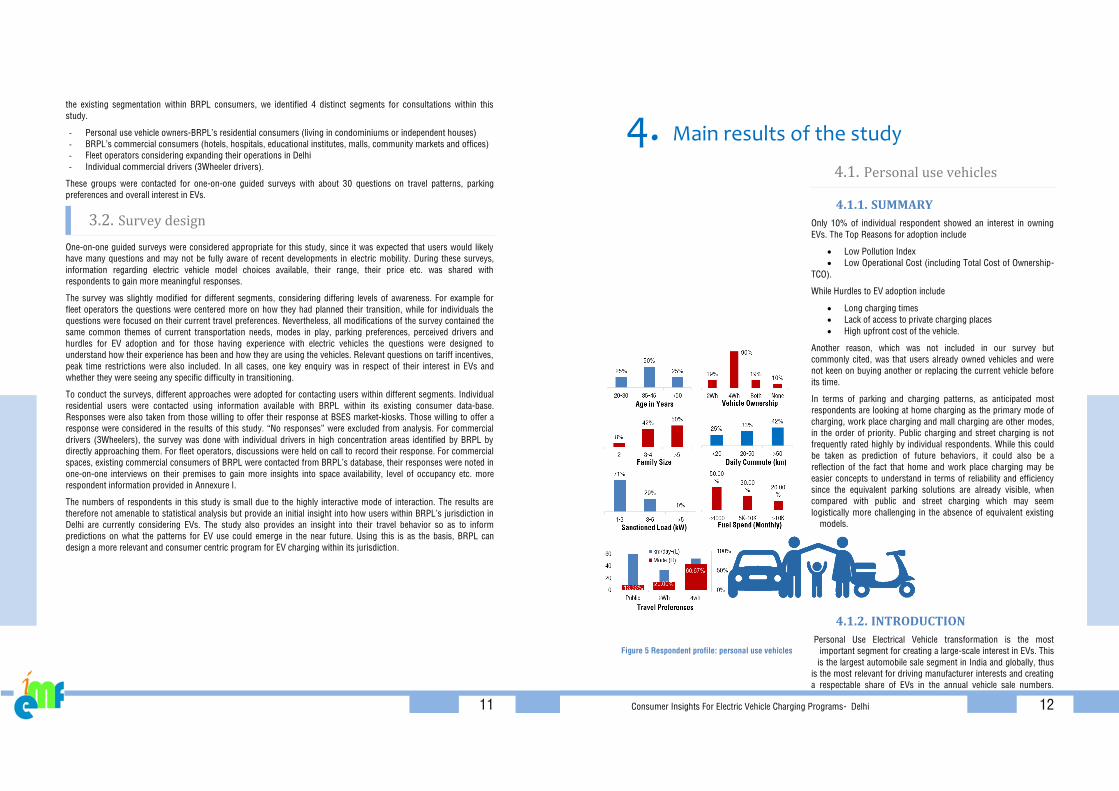
Figure 5 Respondent profile: personal use vehicles
13
While, EV adoption can be mandated within commercial fleets, regulators cannot
create such mandates for personal use vehicles as it would most likely lead to public
outcry. Therefore, understanding individual perceptions, drivers and hurdles to
adoption, and likely plans, are critical for designing successful programs for
meeting the requirements of this segment.
Personal use vehicle segment is the segment that global EV charging programs
primarily cater to. The demand for chargers for personal use EVs is large but
distributed. Thus, the challenges of meeting the requirements of this segment are
more diverse and need closer examination.
In this segment of our study, we engaged with individuals to better understand how
they use their vehicles and to gauge if they had any EV plans. Respondent Profile
The average respondent profile is presented in Figure 5
Age
The typical respondents in our study were aged between 35-45 (yrs), this may be
the result of the methodology followed for reaching out to respondents, since we
used information on existing customers of BRPL, these connection holders would
likely be home owners which makes it more likely for them to be older. Considering
the demographics, this may also make them more likely to already own a vehicle.
Family Size
The average respondent in this study had 4 family members in their family and on
average two were driving family members.
Vehicle Ownership
Most respondents in the study owned a vehicle, in some cases more than 1 vehicle,
~20% respondents owned both 2Wheelers and 4Wheelers. Nearly 90% of
respondents owned cars. Only about 10% did not own any vehicles.
Daily Commute Distance
Nearly half of our respondents reported travelling more than 50km a day. They also
reported that most of their travel was during peak office traffic times, thus on
average, respondents of this study travelled for well over 1.5 hours in a day.
Monthly Fuel Spend
About 50% of our respondents reported spending less than 4000 Rs/month on fuel.
Sanctioned Load
Majority of our respondents have electricity connections with sanctioned loads of
3kW, none of the respondents reported having electricity connections at their homes
over 5kW.
Travel Preferences
A majority (over 60%) reported using cars as their primary mode of travel, only
20% reported 2Wheeler use and less than 15% reported using public transport.
Commercial vehicle use was not indicated by respondents, as it was reported to be
used only in specific instances and not regularly.
EV plans
Only 10% respondents reported an interest in owning an EV (Figure 6). Among
these, for cars the desirable range was indicated as 300km/charge and the price
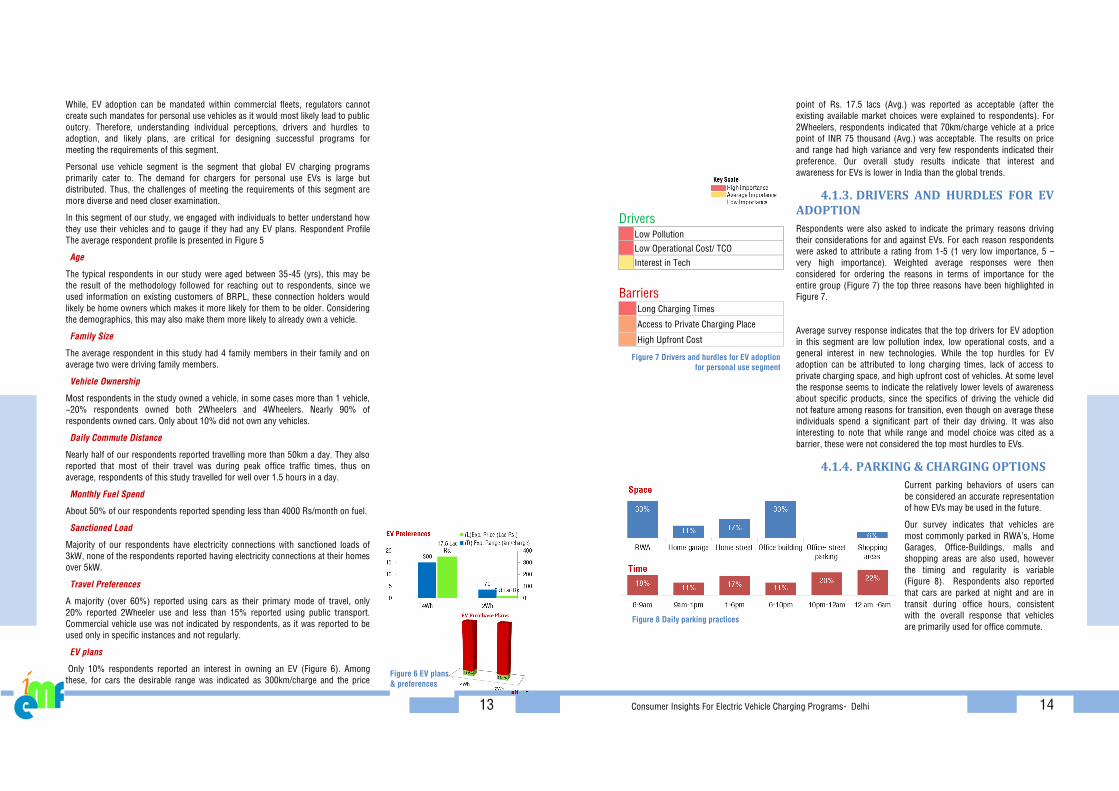
Figure 6 EV plans
& preferences
Consumer Insights For Electric Vehicle Charging Programs- Delhi 14
point of Rs. 17.5 lacs (Avg.) was reported as acceptable (after the
existing available market choices were explained to respondents). For
2Wheelers, respondents indicated that 70km/charge vehicle at a price
point of INR 75 thousand (Avg.) was acceptable. The results on price
and range had high variance and very few respondents indicated their
preference. Our overall study results indicate that interest and
awareness for EVs is lower in India than the global trends.
DRIVERS AND HURDLES FOR EV 4.1.3.ADOPTION
Respondents were also asked to indicate the primary reasons driving
their considerations for and against EVs. For each reason respondents
were asked to attribute a rating from 1-5 (1 very low importance, 5 –
very high importance). Weighted average responses were then
considered for ordering the reasons in terms of importance for the
entire group (Figure 7) the top three reasons have been highlighted in
Figure 7.
Average survey response indicates that the top drivers for EV adoption
in this segment are low pollution index, low operational costs, and a
general interest in new technologies. While the top hurdles for EV
adoption can be attributed to long charging times, lack of access to
private charging space, and high upfront cost of vehicles. At some level
the response seems to indicate the relatively lower levels of awareness
about specific products, since the specifics of driving the vehicle did
not feature among reasons for transition, even though on average these
individuals spend a significant part of their day driving. It was also
interesting to note that while range and model choice was cited as a
barrier, these were not considered the top most hurdles to EVs.
PARKING & CHARGING OPTIONS 4.1.4.
Current parking behaviors of users can
be considered an accurate representation
of how EVs may be used in the future.
Our survey indicates that vehicles are
most commonly parked in RWA’s, Home
Garages, Office-Buildings, malls and
shopping areas are also used, however
the timing and regularity is variable
(Figure 8). Respondents also reported
that cars are parked at night and are in
transit during office hours, consistent
with the overall response that vehicles
are primarily used for office commute.
Figure 8 Daily parking practices
Drivers Low Pollution
Low Operational Cost/ TCO
Interest in Tech
Barriers Long Charging Times
Access to Private Charging Place
High Upfront Cost
Figure 7 Drivers and hurdles for EV adoption
for personal use segment
15
EV CHARGING PLANS 4.1.5.
When asked to predict what kind of charging infrastructure they would
use, on average, respondents indicated that Private charging would
meet most of their charging needs, and public charging would most
likely form only ~14% of their charging mix.
While current parking patterns can be considered to be a good proxy
for how users may charge their vehicle, we included a specific set of
questions on how individuals were thinking about where and when
they would charge. We enquired that if adequate charging was
available in these spaces in which spaces would users use for
charging. The responses indicate that home charging would be used
by all, a few would also use office charging and fewer still would use
shopping malls for meeting their charging needs, there seemed to be
few takers for public charging options. On timing of charging, as
expected most users indicated their preference to charge their vehicle
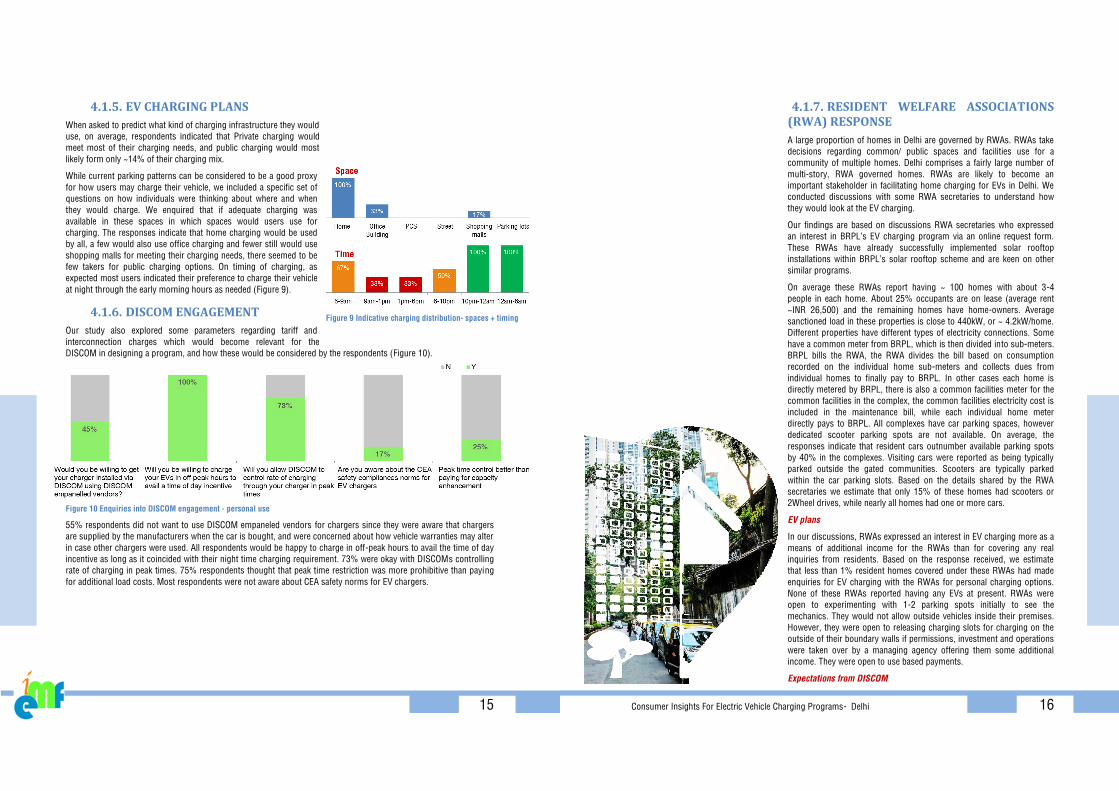
at night through the early morning hours as needed (Figure 9).
DISCOM ENGAGEMENT 4.1.6.
Our study also explored some parameters regarding tariff and
interconnection charges which would become relevant for the
DISCOM in designing a program, and how these would be considered by the respondents (Figure 10).
Figure 10 Enquiries into DISCOM engagement - personal use
55% respondents did not want to use DISCOM empaneled vendors for chargers since they were aware that chargers
are supplied by the manufacturers when the car is bought, and were concerned about how vehicle warranties may alter
in case other chargers were used. All respondents would be happy to charge in off-peak hours to avail the time of day
incentive as long as it coincided with their night time charging requirement. 73% were okay with DISCOMs controlling
rate of charging in peak times. 75% respondents thought that peak time restriction was more prohibitive than paying
for additional load costs. Most respondents were not aware about CEA safety norms for EV chargers.
Figure 9 Indicative charging distribution- spaces + timing
Consumer Insights For Electric Vehicle Charging Programs- Delhi 16
RESIDENT WELFARE ASSOCIATIONS 4.1.7.(RWA) RESPONSE
A large proportion of homes in Delhi are governed by RWAs. RWAs take
decisions regarding common/ public spaces and facilities use for a
community of multiple homes. Delhi comprises a fairly large number of
multi-story, RWA governed homes. RWAs are likely to become an
important stakeholder in facilitating home charging for EVs in Delhi. We
conducted discussions with some RWA secretaries to understand how
they would look at the EV charging.
Our findings are based on discussions RWA secretaries who expressed
an interest in BRPL’s EV charging program via an online request form.
These RWAs have already successfully implemented solar rooftop
installations within BRPL’s solar rooftop scheme and are keen on other
similar programs.
On average these RWAs report having ~ 100 homes with about 3-4
people in each home. About 25% occupants are on lease (average rent
~INR 26,500) and the remaining homes have home-owners. Average
sanctioned load in these properties is close to 440kW, or ~ 4.2kW/home.
Different properties have different types of electricity connections. Some
have a common meter from BRPL, which is then divided into sub-meters.
BRPL bills the RWA, the RWA divides the bill based on consumption
recorded on the individual home sub-meters and collects dues from
individual homes to finally pay to BRPL. In other cases each home is
directly metered by BRPL, there is also a common facilities meter for the
common facilities in the complex, the common facilities electricity cost is
included in the maintenance bill, while each individual home meter
directly pays to BRPL. All complexes have car parking spaces, however
dedicated scooter parking spots are not available. On average, the
responses indicate that resident cars outnumber available parking spots
by 40% in the complexes. Visiting cars were reported as being typically
parked outside the gated communities. Scooters are typically parked
within the car parking slots. Based on the details shared by the RWA
secretaries we estimate that only 15% of these homes had scooters or
2Wheel drives, while nearly all homes had one or more cars.
EV plans
In our discussions, RWAs expressed an interest in EV charging more as a
means of additional income for the RWAs than for covering any real
inquiries from residents. Based on the response received, we estimate
that less than 1% resident homes covered under these RWAs had made
enquiries for EV charging with the RWAs for personal charging options.
None of these RWAs reported having any EVs at present. RWAs were
open to experimenting with 1-2 parking spots initially to see the
mechanics. They would not allow outside vehicles inside their premises.
However, they were open to releasing charging slots for charging on the
outside of their boundary walls if permissions, investment and operations
were taken over by a managing agency offering them some additional
income. They were open to use based payments.
Expectations from DISCOM
17
Having had a successful experience with the solar rooftop
implementation program, they were happy to engage in a DISCOM
led program for EV charging if additional income or saving could be
given to RWAs for the same.
4.2. Fleet operator segment
SUMMARY 4.2.1.
Fleet operators are an important category of EV users, they are
expected to form the bulk of early adopters for EVs. Therefore,
when planning for short term charging requirements their usage
patterns are important for planning purposes. Unlike personal
use vehicles, fleet charging requirements are more concentrated
and are indicated as primed for rapid expansion. Our discussions
with fleet operators indicate that most of the early adoption and
planning is geared for 2WH and 3WH vehicle fleets. In India
travel and intra-city logistics businesses, including e-com
deliveries, are seeking ways to integrate EVs in their fleets to
benefit fit from the TCO advantage and the potential branding
advantages that come by going electric.
Our survey respondents included operators with mixed business
models including rentals, taxis, and deliveries businesses, all of
whom had already made electric transformation plans for Delhi.
The main hurdles to adoption was reported as being availability
of adequate charging options, difficulties faced in setting up
charging points, and the high upfront cost of these vehicles and
associated infrastructure. Technology risks are not the top
hurdles stopping EV adoption among fleets. This may be
because of better awareness and information availability with
businesses.
In our discussions, respondents indicated that they would
appreciate DISCOM support in site identification and for securing
required permissions from various departments and municipal
bodies for setting up charging facilities. Further, if the DISCOM
can take measures that increase the availability of public
charging spots in high usage areas, this would help these
businesses in expanding their operations and improving their
services.
INTRODUCTION 4.2.2.
The TCO benefits of electrical vehicles are much more prominent
for commercial fleets than for private vehicles due to the higher
asset utilization (distance travelled/day) in commercial vehicles.
Therefore from a pure cost advantage point of view commercial
fleets would benefit more from transforming from Internal
Combustion Engine Vehicles (ICEV) to Electric Vehicles (EVs).
Each commercial fleet has a large number of vehicles with
concentrated ownership, thus these are more amenable to
Figure 11 Fleet specifications
Consumer Insights For Electric Vehicle Charging Programs- Delhi 18
planning exercises. In our discussions, we approached a number of fleet
operators in Delhi to understand how they are looking at the electric
transformation. In most cases, fleet managers were already seriously engaged
in making their EV plans. Awareness about EVs in the fleet segments is high.
Most of our responding fleet operators had electric fleets running, our
respondents also included a number of operators creating charging
infrastructure (currently for commercial fleets, later to also serve private
vehicles). Among the respondents were corporate leasing fleets, delivery
fleets, last mile connectivity fleets, driver leasing fleets, charging operators,
swapping operators etc.
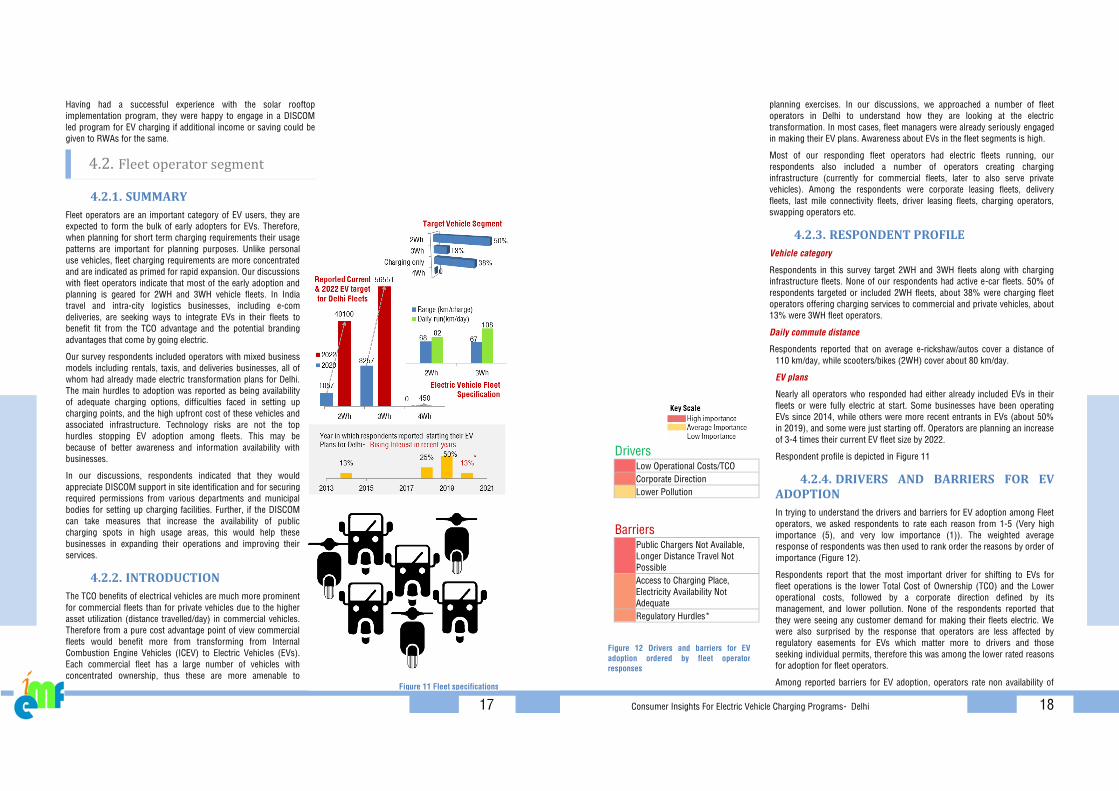
RESPONDENT PROFILE 4.2.3.
Vehicle category
Respondents in this survey target 2WH and 3WH fleets along with charging
infrastructure fleets. None of our respondents had active e-car fleets. 50% of
respondents targeted or included 2WH fleets, about 38% were charging fleet
operators offering charging services to commercial and private vehicles, about
13% were 3WH fleet operators.
Daily commute distance
Respondents reported that on average e-rickshaw/autos cover a distance of
110 km/day, while scooters/bikes (2WH) cover about 80 km/day.
EV plans
Nearly all operators who responded had either already included EVs in their
fleets or were fully electric at start. Some businesses have been operating
EVs since 2014, while others were more recent entrants in EVs (about 50%
in 2019), and some were just starting off. Operators are planning an increase
of 3-4 times their current EV fleet size by 2022.
Respondent profile is depicted in Figure 11
DRIVERS AND BARRIERS FOR EV 4.2.4.ADOPTION
In trying to understand the drivers and barriers for EV adoption among Fleet
operators, we asked respondents to rate each reason from 1-5 (Very high
importance (5), and very low importance (1)). The weighted average
response of respondents was then used to rank order the reasons by order of
importance (Figure 12).
Respondents report that the most important driver for shifting to EVs for
fleet operations is the lower Total Cost of Ownership (TCO) and the Lower
operational costs, followed by a corporate direction defined by its
management, and lower pollution. None of the respondents reported that
they were seeing any customer demand for making their fleets electric. We
were also surprised by the response that operators are less affected by
regulatory easements for EVs which matter more to drivers and those
seeking individual permits, therefore this was among the lower rated reasons
for adoption for fleet operators.
Among reported barriers for EV adoption, operators rate non availability of
Figure 12 Drivers and barriers for EV
adoption ordered by fleet operator
responses
Drivers 1
Low Operational Costs/TCO 1
Corporate Direction 1
Lower Pollution
Barriers 1
Public Chargers Not Available,
Longer Distance Travel Not
Possible 1
Access to Charging Place,
Electricity Availability Not
Adequate 1
Regulatory Hurdles*
19
public chargers and charging sites with required permissions as their top barriers for EV
adoption, followed closely by regulatory hurdles and delays, and high upfront cost of EVs.
Unlike for personal use vehicles, operators also report non availability of good financing
solutions as important in their responses. Since the market is dominated by 2WHand
3WH currently, the perception that charging time is not a barrier to EV adoption may be
due to the fact that charging these smaller battery capacities (2-4 hours) is not as time
consuming as the larger car batteries (which can take up to 8 hours for full charge). The
response also indicates that operators are more concerned about battery performance
rather than vehicle performance.
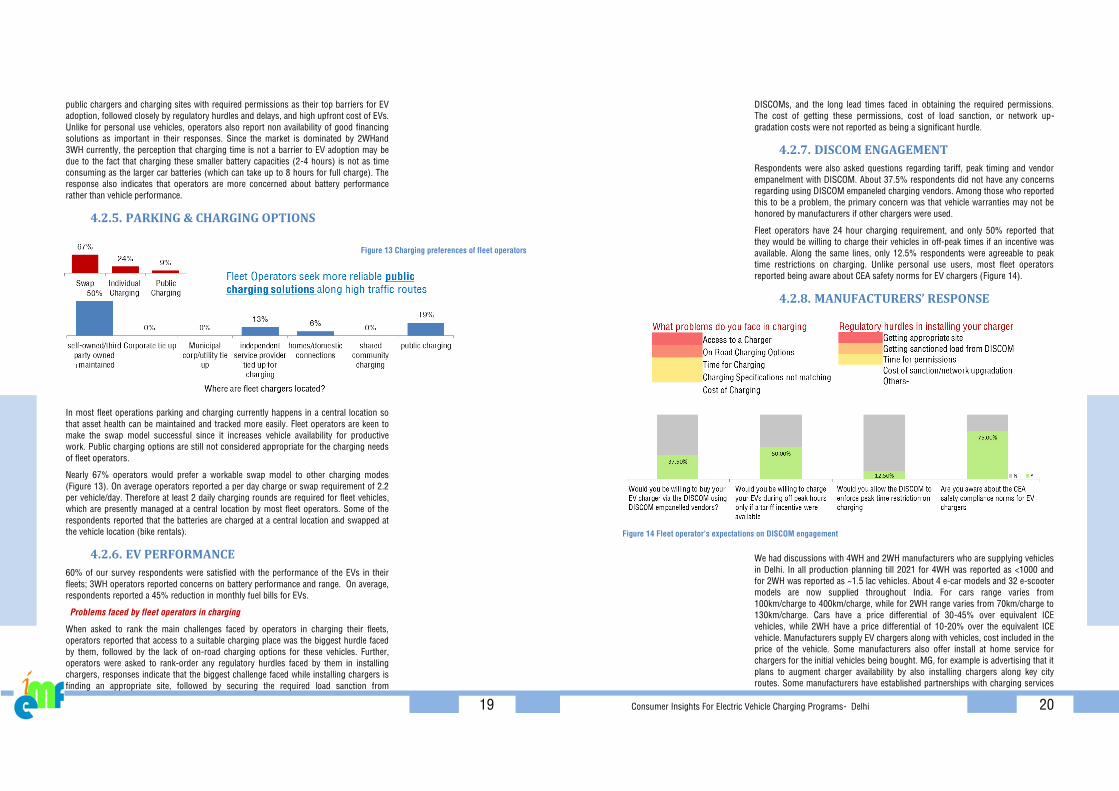
PARKING & CHARGING OPTIONS 4.2.5.
In most fleet operations parking and charging currently happens in a central location so
that asset health can be maintained and tracked more easily. Fleet operators are keen to
make the swap model successful since it increases vehicle availability for productive
work. Public charging options are still not considered appropriate for the charging needs
of fleet operators.
Nearly 67% operators would prefer a workable swap model to other charging modes
(Figure 13). On average operators reported a per day charge or swap requirement of 2.2
per vehicle/day. Therefore at least 2 daily charging rounds are required for fleet vehicles,
which are presently managed at a central location by most fleet operators. Some of the
respondents reported that the batteries are charged at a central location and swapped at
the vehicle location (bike rentals).
EV PERFORMANCE 4.2.6.
60% of our survey respondents were satisfied with the performance of the EVs in their
fleets; 3WH operators reported concerns on battery performance and range. On average,
respondents reported a 45% reduction in monthly fuel bills for EVs.
Problems faced by fleet operators in charging
When asked to rank the main challenges faced by operators in charging their fleets,
operators reported that access to a suitable charging place was the biggest hurdle faced
by them, followed by the lack of on-road charging options for these vehicles. Further,
operators were asked to rank-order any regulatory hurdles faced by them in installing
chargers, responses indicate that the biggest challenge faced while installing chargers is
finding an appropriate site, followed by securing the required load sanction from
Figure 13 Charging preferences of fleet operators
Consumer Insights For Electric Vehicle Charging Programs- Delhi 20
DISCOMs, and the long lead times faced in obtaining the required permissions.
The cost of getting these permissions, cost of load sanction, or network up-
gradation costs were not reported as being a significant hurdle.
DISCOM ENGAGEMENT 4.2.7.
Respondents were also asked questions regarding tariff, peak timing and vendor
empanelment with DISCOM. About 37.5% respondents did not have any concerns
regarding using DISCOM empaneled charging vendors. Among those who reported
this to be a problem, the primary concern was that vehicle warranties may not be
honored by manufacturers if other chargers were used.
Fleet operators have 24 hour charging requirement, and only 50% reported that
they would be willing to charge their vehicles in off-peak times if an incentive was
available. Along the same lines, only 12.5% respondents were agreeable to peak
time restrictions on charging. Unlike personal use users, most fleet operators
reported being aware about CEA safety norms for EV chargers (Figure 14).
MANUFACTURERS’ RESPONSE 4.2.8.
We had discussions with 4WH and 2WH manufacturers who are supplying vehicles
in Delhi. In all production planning till 2021 for 4WH was reported as <1000 and
for 2WH was reported as ~1.5 lac vehicles. About 4 e-car models and 32 e-scooter
models are now supplied throughout India. For cars range varies from
100km/charge to 400km/charge, while for 2WH range varies from 70km/charge to
130km/charge. Cars have a price differential of 30-45% over equivalent ICE
vehicles, while 2WH have a price differential of 10-20% over the equivalent ICE
vehicle. Manufacturers supply EV chargers along with vehicles, cost included in the
price of the vehicle. Some manufacturers also offer install at home service for
chargers for the initial vehicles being bought. MG, for example is advertising that it
plans to augment charger availability by also installing chargers along key city
routes. Some manufacturers have established partnerships with charging services
Figure 14 Fleet operator’s expectations on DISCOM engagement
21
providers to enhance availability of chargers. Manufacturers report that the order of priority for charging solutions
would be as follows: Home charging, Public charging, Curb-side charging, Group Charging, Commercial space
charging.
Manufacturers report that the main drivers for EV adoption would likely be
Low TCO and ease of driving, while the top hurdles would be the high upfront
cost, restriction on long distance travel, and access to charging places (Figure
15). Manufacturers do not believe that the positive environmental attributes of
EV would become a major reason for adoption. They also attribute a lot of
impact of government incentives of EV adoption. Manufacturers do not
believe that technology risk perceptions would be a major hurdle for EV
adoption.
When questioned about DISCOM empanelment of vendors 66% were
agreeable to using DISCOM empanelled vendors for chargers. They think that
off peak incentive will drive users to charge in off peak times. They are not
agreeable with peak time curtailment. Most manufacturers are aware of CEA
safety norms. When questioned if their chargers could be made tamper proof,
one responded that they were not sure, one responded that it could be done,
one responded that tampering is possible with their chargers. Manufacturers
are in general willing to work with DISCOM to cover any points of concerns.
4.1. Commercial spaces segment
SUMMARY 4.1.1.
Commercial spaces around Delhi have a positive outlook for EV charging and are keen to upgrade their services to
include EV charging facilities for their customers/users. EV charging can also become another revenue stream for the
asset and investment heavy commercial space segment.
A number of spaces already have plans for installing EV chargers and are looking for appropriate service providers
who can run these services within their premises. The main driver for adoption in commercial spaces is the
environmental friendliness of EVs, and the potential for marketing advantage (better services for their customers) that
commercial spaces gain by installing these chargers and becoming EV ready, while the main hurdle for adoption is the
lack of well-defined and tested business models for charging and the perceived technology risk. Commercial spaces
would benefit greatly by DISCOM led external validation of charging specifications and vendors since awareness
regarding specification of this technology is low among managers of these spaces.
INTRODUCTION 4.1.2.
Commercial spaces are uniquely placed as space-for-hire providers. Space for charging is an important parameter for
identifying successful charging options. While even residences in some cases may not have sufficient space for
reliable charging, commercial spaces may easily offer their parking spaces for EV charging. Commercial spaces also
have high concentration of commuters. Vehicle services such as taxis and local delivery drivers frequent these spots.
Therefore, commercial spaces can become critical stakeholders that enable reliable charging options for EV users
across segments.
For commercial spaces we conducted on-one-one interviews with facilities managers of different commercial spaces
around Delhi.
Drivers 1
Low TCO 1
Ease of driving 1
Regulatory norms
Barriers 2
High upfront cost
1
Long distance travel restricted
1
Access to charging place
Figure 15 Driver and barriers for EV
adoption as reported by manufacturers
Consumer Insights For Electric Vehicle Charging Programs- Delhi 22
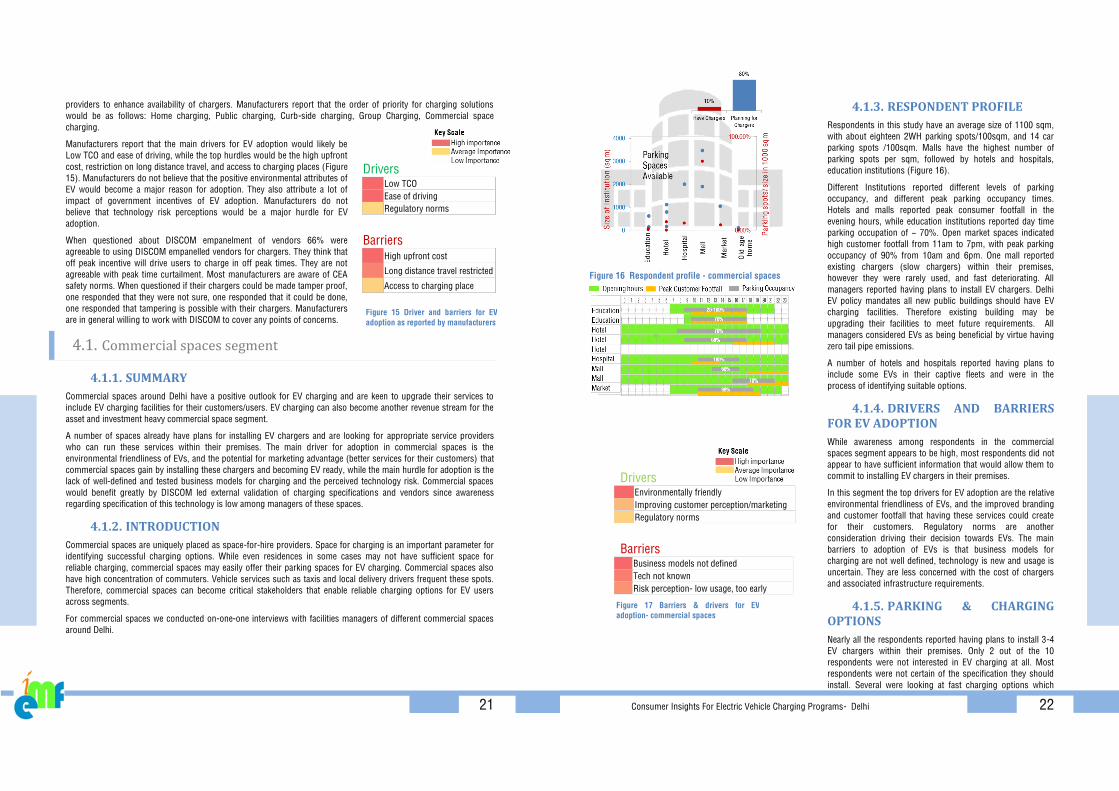
RESPONDENT PROFILE 4.1.3.
Respondents in this study have an average size of 1100 sqm,
with about eighteen 2WH parking spots/100sqm, and 14 car
parking spots /100sqm. Malls have the highest number of
parking spots per sqm, followed by hotels and hospitals,
education institutions (Figure 16).
Different Institutions reported different levels of parking
occupancy, and different peak parking occupancy times.
Hotels and malls reported peak consumer footfall in the
evening hours, while education institutions reported day time
parking occupation of ~ 70%. Open market spaces indicated
high customer footfall from 11am to 7pm, with peak parking
occupancy of 90% from 10am and 6pm. One mall reported
existing chargers (slow chargers) within their premises,
however they were rarely used, and fast deteriorating. All
managers reported having plans to install EV chargers. Delhi
EV policy mandates all new public buildings should have EV
charging facilities. Therefore existing building may be
upgrading their facilities to meet future requirements. All
managers considered EVs as being beneficial by virtue having
zero tail pipe emissions.
A number of hotels and hospitals reported having plans to
include some EVs in their captive fleets and were in the
process of identifying suitable options.
DRIVERS AND BARRIERS 4.1.4.FOR EV ADOPTION
While awareness among respondents in the commercial
spaces segment appears to be high, most respondents did not
appear to have sufficient information that would allow them to
commit to installing EV chargers in their premises.
In this segment the top drivers for EV adoption are the relative
environmental friendliness of EVs, and the improved branding
and customer footfall that having these services could create
for their customers. Regulatory norms are another
consideration driving their decision towards EVs. The main
barriers to adoption of EVs is that business models for
charging are not well defined, technology is new and usage is
uncertain. They are less concerned with the cost of chargers
and associated infrastructure requirements.
PARKING & CHARGING 4.1.5.OPTIONS
Nearly all the respondents reported having plans to install 3-4
EV chargers within their premises. Only 2 out of the 10
respondents were not interested in EV charging at all. Most
respondents were not certain of the specification they should
install. Several were looking at fast charging options which
Figure 16 Respondent profile - commercial spaces
Drivers
Environmentally friendly
Improving customer perception/marketing
Regulatory norms
Barriers 2
Business models not defined
1
Tech not known
1
Risk perception- low usage, too early
Figure 17 Barriers & drivers for EV
adoption- commercial spaces
23
were more future ready. While others were not aware of the charging options available or even what parameters
should be considered while selecting chargers.
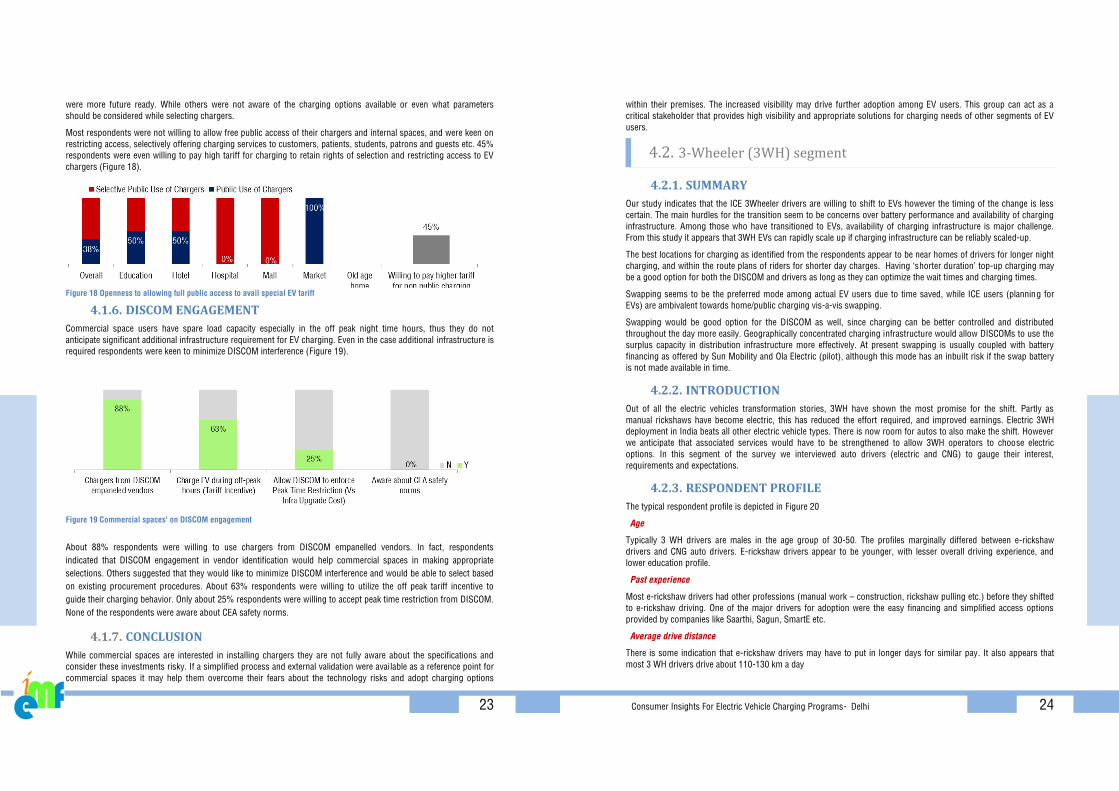
Most respondents were not willing to allow free public access of their chargers and internal spaces, and were keen on
restricting access, selectively offering charging services to customers, patients, students, patrons and guests etc. 45%
respondents were even willing to pay high tariff for charging to retain rights of selection and restricting access to EV
chargers (Figure 18).
DISCOM ENGAGEMENT 4.1.6.
Commercial space users have spare load capacity especially in the off peak night time hours, thus they do not
anticipate significant additional infrastructure requirement for EV charging. Even in the case additional infrastructure is
required respondents were keen to minimize DISCOM interference (Figure 19).
About 88% respondents were willing to use chargers from DISCOM empanelled vendors. In fact, respondents
indicated that DISCOM engagement in vendor identification would help commercial spaces in making appropriate
selections. Others suggested that they would like to minimize DISCOM interference and would be able to select based
on existing procurement procedures. About 63% respondents were willing to utilize the off peak tariff incentive to
guide their charging behavior. Only about 25% respondents were willing to accept peak time restriction from DISCOM.
None of the respondents were aware about CEA safety norms.
CONCLUSION 4.1.7.
While commercial spaces are interested in installing chargers they are not fully aware about the specifications and
consider these investments risky. If a simplified process and external validation were available as a reference point for
commercial spaces it may help them overcome their fears about the technology risks and adopt charging options
Figure 18 Openness to allowing full public access to avail special EV tariff
Figure 19 Commercial spaces' on DISCOM engagement
Consumer Insights For Electric Vehicle Charging Programs- Delhi 24
within their premises. The increased visibility may drive further adoption among EV users. This group can act as a
critical stakeholder that provides high visibility and appropriate solutions for charging needs of other segments of EV
users.
4.2. 3-Wheeler (3WH) segment
SUMMARY 4.2.1.
Our study indicates that the ICE 3Wheeler drivers are willing to shift to EVs however the timing of the change is less
certain. The main hurdles for the transition seem to be concerns over battery performance and availability of charging
infrastructure. Among those who have transitioned to EVs, availability of charging infrastructure is major challenge.
From this study it appears that 3WH EVs can rapidly scale up if charging infrastructure can be reliably scaled-up.
The best locations for charging as identified from the respondents appear to be near homes of drivers for longer night
charging, and within the route plans of riders for shorter day charges. Having ‘shorter duration’ top-up charging may
be a good option for both the DISCOM and drivers as long as they can optimize the wait times and charging times.
Swapping seems to be the preferred mode among actual EV users due to time saved, while ICE users (planning for
EVs) are ambivalent towards home/public charging vis-a-vis swapping.
Swapping would be good option for the DISCOM as well, since charging can be better controlled and distributed
throughout the day more easily. Geographically concentrated charging infrastructure would allow DISCOMs to use the
surplus capacity in distribution infrastructure more effectively. At present swapping is usually coupled with battery
financing as offered by Sun Mobility and Ola Electric (pilot), although this mode has an inbuilt risk if the swap battery
is not made available in time.
INTRODUCTION 4.2.2.
Out of all the electric vehicles transformation stories, 3WH have shown the most promise for the shift. Partly as
manual rickshaws have become electric, this has reduced the effort required, and improved earnings. Electric 3WH
deployment in India beats all other electric vehicle types. There is now room for autos to also make the shift. However
we anticipate that associated services would have to be strengthened to allow 3WH operators to choose electric
options. In this segment of the survey we interviewed auto drivers (electric and CNG) to gauge their interest,
requirements and expectations.
RESPONDENT PROFILE 4.2.3.
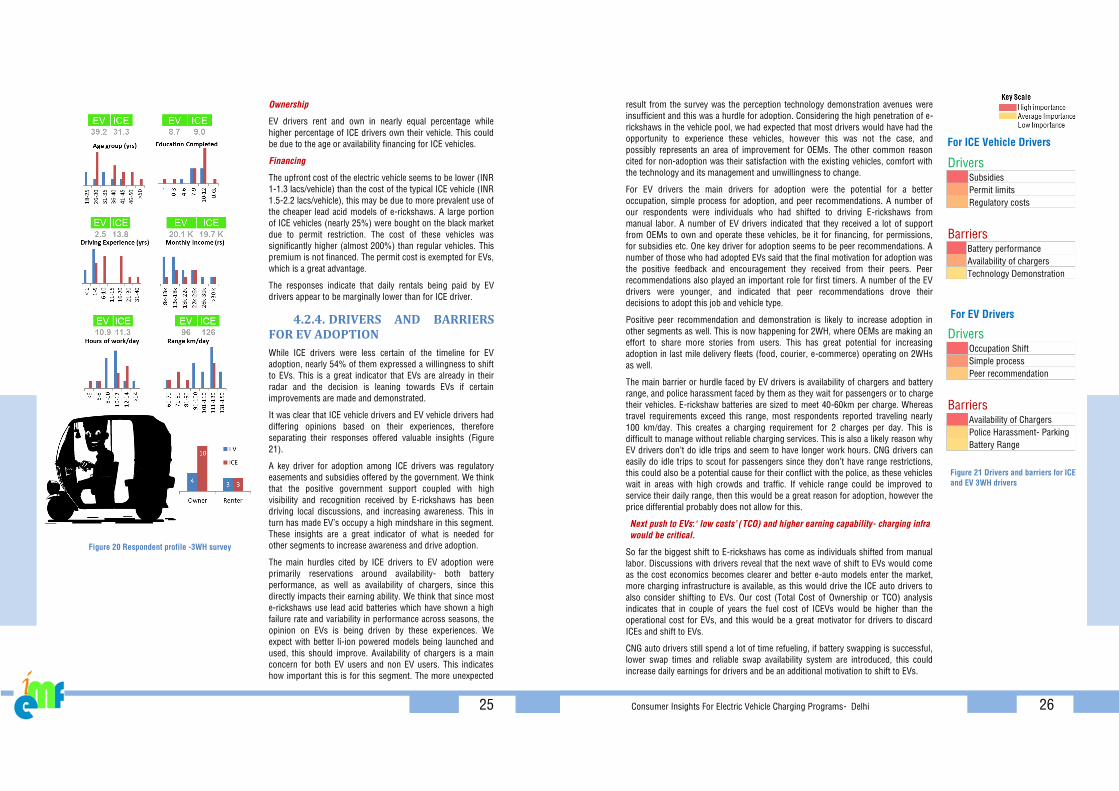
The typical respondent profile is depicted in Figure 20
Age
Typically 3 WH drivers are males in the age group of 30-50. The profiles marginally differed between e-rickshaw
drivers and CNG auto drivers. E-rickshaw drivers appear to be younger, with lesser overall driving experience, and
lower education profile.
Past experience
Most e-rickshaw drivers had other professions (manual work – construction, rickshaw pulling etc.) before they shifted
to e-rickshaw driving. One of the major drivers for adoption were the easy financing and simplified access options
provided by companies like Saarthi, Sagun, SmartE etc.
Average drive distance
There is some indication that e-rickshaw drivers may have to put in longer days for similar pay. It also appears that
most 3 WH drivers drive about 110-130 km a day
25
Ownership
EV drivers rent and own in nearly equal percentage while
higher percentage of ICE drivers own their vehicle. This could
be due to the age or availability financing for ICE vehicles.
Financing
The upfront cost of the electric vehicle seems to be lower (INR
1-1.3 lacs/vehicle) than the cost of the typical ICE vehicle (INR
1.5-2.2 lacs/vehicle), this may be due to more prevalent use of
the cheaper lead acid models of e-rickshaws. A large portion
of ICE vehicles (nearly 25%) were bought on the black market
due to permit restriction. The cost of these vehicles was
significantly higher (almost 200%) than regular vehicles. This
premium is not financed. The permit cost is exempted for EVs,
which is a great advantage.
The responses indicate that daily rentals being paid by EV
drivers appear to be marginally lower than for ICE driver.
DRIVERS AND BARRIERS 4.2.4.FOR EV ADOPTION
While ICE drivers were less certain of the timeline for EV
adoption, nearly 54% of them expressed a willingness to shift
to EVs. This is a great indicator that EVs are already in their
radar and the decision is leaning towards EVs if certain
improvements are made and demonstrated.
It was clear that ICE vehicle drivers and EV vehicle drivers had
differing opinions based on their experiences, therefore
separating their responses offered valuable insights (Figure
21).
A key driver for adoption among ICE drivers was regulatory
easements and subsidies offered by the government. We think
that the positive government support coupled with high
visibility and recognition received by E-rickshaws has been
driving local discussions, and increasing awareness. This in
turn has made EV’s occupy a high mindshare in this segment.
These insights are a great indicator of what is needed for
other segments to increase awareness and drive adoption.
The main hurdles cited by ICE drivers to EV adoption were
primarily reservations around availability- both battery
performance, as well as availability of chargers, since this
directly impacts their earning ability. We think that since most
e-rickshaws use lead acid batteries which have shown a high
failure rate and variability in performance across seasons, the
opinion on EVs is being driven by these experiences. We
expect with better li-ion powered models being launched and
used, this should improve. Availability of chargers is a main
concern for both EV users and non EV users. This indicates
how important this is for this segment. The more unexpected
Figure 20 Respondent profile -3WH survey
Consumer Insights For Electric Vehicle Charging Programs- Delhi 26
result from the survey was the perception technology demonstration avenues were
insufficient and this was a hurdle for adoption. Considering the high penetration of e-
rickshaws in the vehicle pool, we had expected that most drivers would have had the
opportunity to experience these vehicles, however this was not the case, and
possibly represents an area of improvement for OEMs. The other common reason
cited for non-adoption was their satisfaction with the existing vehicles, comfort with
the technology and its management and unwillingness to change.
For EV drivers the main drivers for adoption were the potential for a better
occupation, simple process for adoption, and peer recommendations. A number of
our respondents were individuals who had shifted to driving E-rickshaws from
manual labor. A number of EV drivers indicated that they received a lot of support
from OEMs to own and operate these vehicles, be it for financing, for permissions,
for subsidies etc. One key driver for adoption seems to be peer recommendations. A
number of those who had adopted EVs said that the final motivation for adoption was
the positive feedback and encouragement they received from their peers. Peer
recommendations also played an important role for first timers. A number of the EV
drivers were younger, and indicated that peer recommendations drove their
decisions to adopt this job and vehicle type.
Positive peer recommendation and demonstration is likely to increase adoption in
other segments as well. This is now happening for 2WH, where OEMs are making an
effort to share more stories from users. This has great potential for increasing
adoption in last mile delivery fleets (food, courier, e-commerce) operating on 2WHs
as well.
The main barrier or hurdle faced by EV drivers is availability of chargers and battery
range, and police harassment faced by them as they wait for passengers or to charge
their vehicles. E-rickshaw batteries are sized to meet 40-60km per charge. Whereas
travel requirements exceed this range, most respondents reported traveling nearly
100 km/day. This creates a charging requirement for 2 charges per day. This is
difficult to manage without reliable charging services. This is also a likely reason why
EV drivers don’t do idle trips and seem to have longer work hours. CNG drivers can
easily do idle trips to scout for passengers since they don’t have range restrictions,
this could also be a potential cause for their conflict with the police, as these vehicles
wait in areas with high crowds and traffic. If vehicle range could be improved to
service their daily range, then this would be a great reason for adoption, however the
price differential probably does not allow for this.
Next push to EVs: ‘low costs’ (TCO) and higher earning capability- charging infra
would be critical.
So far the biggest shift to E-rickshaws has come as individuals shifted from manual
labor. Discussions with drivers reveal that the next wave of shift to EVs would come
as the cost economics becomes clearer and better e-auto models enter the market,
more charging infrastructure is available, as this would drive the ICE auto drivers to
also consider shifting to EVs. Our cost (Total Cost of Ownership or TCO) analysis
indicates that in couple of years the fuel cost of ICEVs would be higher than the
operational cost for EVs, and this would be a great motivator for drivers to discard
ICEs and shift to EVs.
CNG auto drivers still spend a lot of time refueling, if battery swapping is successful,
lower swap times and reliable swap availability system are introduced, this could
increase daily earnings for drivers and be an additional motivation to shift to EVs.
Figure 21 Drivers and barriers for ICE
and EV 3WH drivers
Drivers
Subsidies
Permit limits
Regulatory costs
Barriers
Battery performance
Availability of chargers
Technology Demonstration
Drivers
Occupation Shift
Simple process
Peer recommendation
Barriers
Availability of Chargers
Police Harassment- Parking
Battery Range
For ICE Vehicle Drivers
For EV Drivers
27
PARKING & CHARGING OPTIONS 4.2.5.
In our bid to identify the best spots for installing charging infrastructure we
attempted to understand the parking preferences of auto drivers (ICE) along with the
current charging practices of EV drivers.
Home charging at night
Nearly all drivers park their vehicles at their home at night from 10PM to 8 AM
(Depending on their work hours). EV drivers describe that chargers are installed near
or at their home and over-night charging is common, typically done using 230V
home plugs at rented rooms with a sub-meter. Those working in e-fleets like Smart-E
park their vehicles in the Smart-E station where the vehicle is fully charged in 2
hours.
Renters need swap or strong Public Charging Station (PCS) network
The story differs for rented vehicles. Many CNG autos day-drivers return the vehicle
to the owner at night, and the owner lets a second driver run the vehicle for the night.
Such usage will require strong access to PCS or Swapping Options.
Day-parking/charging
Day parking and charging times are more variable. It depends on occupancy of the
vehicles. Vehicle drivers reported parking in auto parking spots or pre-paid parking
spots for 5min to 2 hours in the day time in the noon to 5PM lull. Some of the
reported parking spots included – Ambience Mall, DLF promenade malls (Vasant
Kunj), auto stands at metro exit (Nehru Place, Dwarka).
Lead acid battery operated e-rickshaws reported that they do not charge their
vehicles in the day and only charge at night.
Drivers attached to fleet operators like Smart-E report charging their vehicles at least
once in the day as well, usually at lunch time. Charging is free at Smart-E stations
creating a great incentive for drivers to return to the charging station for their breaks.
Day parking for e-rickshaws as they await customers was reported to be mostly at
metro stations
Preference for swapping
In our discussions, nearly 70% of e-3WH drivers expressed a preference for
swapping due to the time saved. Whereas the response was more ambivalent from
ICE vehicle drivers, who seemed equally inclined towards both swapping and
home/PCS charging. Their main concern on swapping was quality of batteries, their
state of charge, availability and range.
Charging costs
CNG auto drivers on an average spend ~150 INR/day on fuel (reported mileage of 30-
50 km/kg) and are satisfied with the operational costs and efficiency of their vehicles.
E- rickshaw drivers reported spending 100 INR/day. Smart-E does not charge for
parking or charging at their station, the daily rental of the vehicle ~ 350 INR/day
covers operational and capital costs of the vehicle.
If more authorized charging options were available at parking spots near driver
residences or at waiting spots on their daily routes (e.g. metro stations, malls, curb-
side charging at auto stands etc.) then reservations around charging availability as a
hurdle for EV adoption can be overcome entirely.
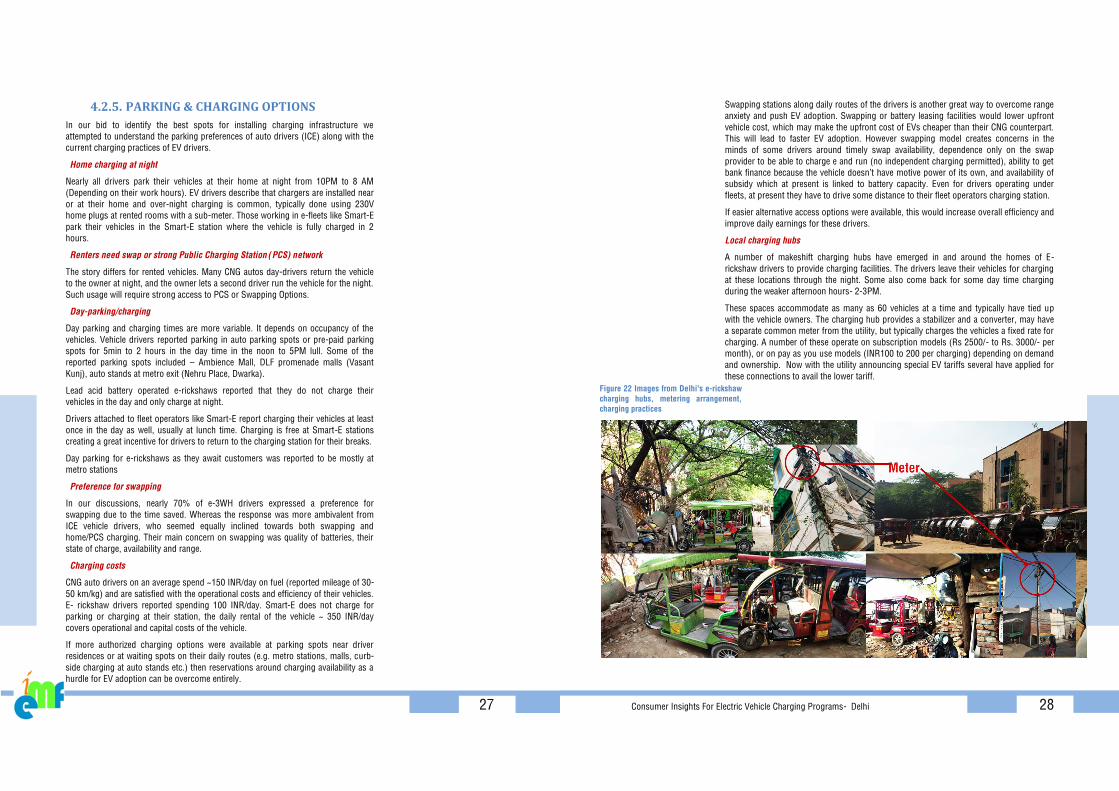
Consumer Insights For Electric Vehicle Charging Programs- Delhi 28
Figure 22 Images from Delhi's e-rickshaw
charging hubs, metering arrangement,
charging practices
Swapping stations along daily routes of the drivers is another great way to overcome range
anxiety and push EV adoption. Swapping or battery leasing facilities would lower upfront
vehicle cost, which may make the upfront cost of EVs cheaper than their CNG counterpart.
This will lead to faster EV adoption. However swapping model creates concerns in the
minds of some drivers around timely swap availability, dependence only on the swap
provider to be able to charge e and run (no independent charging permitted), ability to get
bank finance because the vehicle doesn’t have motive power of its own, and availability of
subsidy which at present is linked to battery capacity. Even for drivers operating under
fleets, at present they have to drive some distance to their fleet operators charging station.
If easier alternative access options were available, this would increase overall efficiency and
improve daily earnings for these drivers.
Local charging hubs
A number of makeshift charging hubs have emerged in and around the homes of E-
rickshaw drivers to provide charging facilities. The drivers leave their vehicles for charging
at these locations through the night. Some also come back for some day time charging
during the weaker afternoon hours- 2-3PM.
These spaces accommodate as many as 60 vehicles at a time and typically have tied up
with the vehicle owners. The charging hub provides a stabilizer and a converter, may have
a separate common meter from the utility, but typically charges the vehicles a fixed rate for
charging. A number of these operate on subscription models (Rs 2500/- to Rs. 3000/- per
month), or on pay as you use models (INR100 to 200 per charging) depending on demand
and ownership. Now with the utility announcing special EV tariffs several have applied for
these connections to avail the lower tariff.
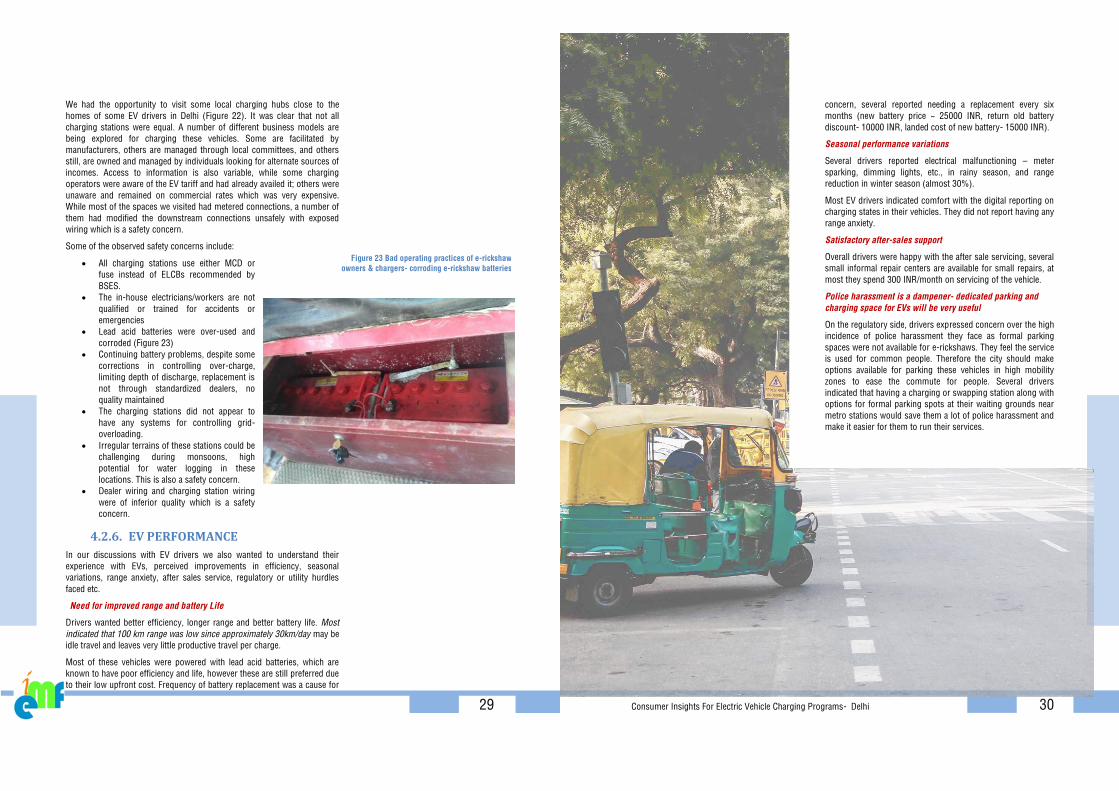
29
We had the opportunity to visit some local charging hubs close to the
homes of some EV drivers in Delhi (Figure 22). It was clear that not all
charging stations were equal. A number of different business models are
being explored for charging these vehicles. Some are facilitated by
manufacturers, others are managed through local committees, and others
still, are owned and managed by individuals looking for alternate sources of
incomes. Access to information is also variable, while some charging
operators were aware of the EV tariff and had already availed it; others were
unaware and remained on commercial rates which was very expensive.
While most of the spaces we visited had metered connections, a number of
them had modified the downstream connections unsafely with exposed
wiring which is a safety concern.
Some of the observed safety concerns include:
All charging stations use either MCD or
fuse instead of ELCBs recommended by
BSES.
The in-house electricians/workers are not
qualified or trained for accidents or
emergencies
Lead acid batteries were over-used and
corroded (Figure 23)
Continuing battery problems, despite some
corrections in controlling over-charge,
limiting depth of discharge, replacement is
not through standardized dealers, no
quality maintained
The charging stations did not appear to
have any systems for controlling grid-
overloading.
Irregular terrains of these stations could be
challenging during monsoons, high
potential for water logging in these
locations. This is also a safety concern.
Dealer wiring and charging station wiring
were of inferior quality which is a safety
concern.
EV PERFORMANCE 4.2.6.
In our discussions with EV drivers we also wanted to understand their
experience with EVs, perceived improvements in efficiency, seasonal
variations, range anxiety, after sales service, regulatory or utility hurdles
faced etc.
Need for improved range and battery Life
Drivers wanted better efficiency, longer range and better battery life. Most
indicated that 100 km range was low since approximately 30km/day may be
idle travel and leaves very little productive travel per charge.
Most of these vehicles were powered with lead acid batteries, which are
known to have poor efficiency and life, however these are still preferred due
to their low upfront cost. Frequency of battery replacement was a cause for
Figure 23 Bad operating practices of e-rickshaw
owners & chargers- corroding e-rickshaw batteries
Consumer Insights For Electric Vehicle Charging Programs- Delhi 30
concern, several reported needing a replacement every six
months (new battery price ~ 25000 INR, return old battery
discount- 10000 INR, landed cost of new battery- 15000 INR).
Seasonal performance variations
Several drivers reported electrical malfunctioning – meter
sparking, dimming lights, etc., in rainy season, and range
reduction in winter season (almost 30%).
Most EV drivers indicated comfort with the digital reporting on
charging states in their vehicles. They did not report having any
range anxiety.
Satisfactory after-sales support
Overall drivers were happy with the after sale servicing, several
small informal repair centers are available for small repairs, at
most they spend 300 INR/month on servicing of the vehicle.
Police harassment is a dampener- dedicated parking and
charging space for EVs will be very useful
On the regulatory side, drivers expressed concern over the high
incidence of police harassment they face as formal parking
spaces were not available for e-rickshaws. They feel the service
is used for common people. Therefore the city should make
options available for parking these vehicles in high mobility
zones to ease the commute for people. Several drivers
indicated that having a charging or swapping station along with
options for formal parking spots at their waiting grounds near
metro stations would save them a lot of police harassment and
make it easier for them to run their services.
31
5. Conclusions This survey has brought to light some interesting insights on consumer perceptions and
expectations for EVs for different vehicle segments. It is clear that
Each consumer segment will evaluate EV economics differently, look for
products that meet their needs and then decide to transition or adopt EVs.
It is also clear that viable charging option availability is a concern for all
potential users.
Different segments reflected a different level of awareness and interest towards EVs.
In the personal use vehicle segment awareness and interest was low.
In the fleet segment awareness and interest was high. EVs are considered as
the next big thing in mobility by commercial users.
Among 3WH drivers awareness and interest was highest, this is also the
segment with highest levels of adoption.
Manufacturers are gearing up for scaling EVs. A number of manufacturers have
already launched models or at least made announcements, recognizing that EVs
could bring in a disruption and must be addressed. However capacity plans are
low, considering the low vehicle demand in general, and low awareness levels
in the largest market segment which is personal use.
Commercial spaces expressed an interest in EV charging for its branding value
and are exploring what kind of business models can be built around it.
Different drivers and hurdles govern the decision in different segments.
Individuals with personal use vehicle are primarily driven to EVs for their “Clean
and Green” attributes. Low operational cost and technological advancements
are the other positive arguments in their EV decision matrix, while long
charging times, uncertainties around access to private charging and high
upfront cost are hurdles.
A number of fleet operators have already decided to make the full transition to
EVs for their better cost economics. They are also driven by a corporate
direction towards EVs and the clean attributes associated with EVs. Lack of
public charging, poor access to good charging locations and regulatory hurdles
are the major barriers faced by them.
Commercial spaces are looking at adopting EVs for their own fleets and also
setting up charging facilities for their customers or users of their other
facilities. They are primarily driven by the environmentally friendly attributes
and branding value that would come from enabling EVs. They are also mindful
of the regulatory norms for new buildings that require EV facilities and are keen
to upgrade their infrastructure. The main barriers faced by commercial spaces
is identifying business models, selecting technology and vendors, low
penetration of EVs creates a high risk perception. 3WH drivers had the highest
level of awareness.
As expected, different segments presented different parking and charging needs in terms
of location, type of chargers, and timing of charging.
Consumer Insights For Electric Vehicle Charging Programs- Delhi 32
The personal use vehicle segment would most likely largely be met by home
chargers for its charging needs.
The form of the home chargers is still malleable. A lot of people especially in
Indian cities do not have access to private dedicated parking spaces, therefore the role of
RWAs or municipalities in allowing private charging would be critical for their adoption.
For fleets it is clear that night charging would be an important source which is
being developed in central hubs, however well placed public charging facilities along driver
routes is a major requirement for fleet adoption. Fleets would charge at night to full charge
and recharge through their wait times in the day when feasible. This could be a great way to
spread out demand loads.
Commercial spaces indicated that while parking spaces are in use in the day, these
are mostly available through the night, if EV charging can become a feasible method to
monetize this space at night this could become a great option for the space and users.
3WH driver have already had some experience with EVs. Since availability of the
vehicle directly impacts their livelihood, good charging options are a critical need for this
segment. Currently charging happens at night at charging hubs close to their home. Most
drivers also needed a day charging option, since two charging cycles are needed for these
vehicles per day. Swap options show a lot of promise for meeting their needs.
When it comes to level of DISCOM interventions, customer responses differed widely
Individuals and RWAs are happy for the DISCOM to manage all the technical and
quality parameters facilitate the connection if the manufacturer guarantees remain
unaffected. They are also keen to utilize the off peak tariffs for charging. They are less aware
about technical specifications and safety requirements of these chargers. They are also
hesitant to allow curtailment of electricity for charging in peak times.
Fleet operators are less willing to use DISCOM empanelled vendors since a
number of them already have experience buying and using chargers, they feel the
additional interventions from DISCOM will make things more difficult. They are also willing
to use off peak tariffs for charging, but are less open to DISCOM curtailments in peak
times. Unlike individual users, fleets are more aware about technical specifications and
safety requirements and standards.
Commercial spaces reflected an interest in using DISCOM empanelled vendors to
select vendors for installation. They are also interested in using off peak tariffs to further
lower their electricity costs for charging, but are less open to curtailments. They are not
aware about the safety and specification standards prescribed for chargers by CEA.
It is clear from this study that different vehicle and consumer segments have differing
levels of awareness and interest, differing expectations around charging needs, and
different needs of engagement with the DISCOM for selecting and installing chargers.
Therefore, segment and consumer specific programs will have to be designed by the
DISCOM to meet the differing requirements.
DISCOMs must design the program to drive more sustainable behaviors around
charging times and locations so as to lower the burden on the existing infrastructure.
DISCOMs are in a position to solve some consumer pain points by engaging
stakeholders like municipality and charging services providers to design supportive
charging programs that are easy to implement across segments.
DISCOMs are going to play a critical role is solving the charging piece of the EV puzzle and
should be supported in doing the same.
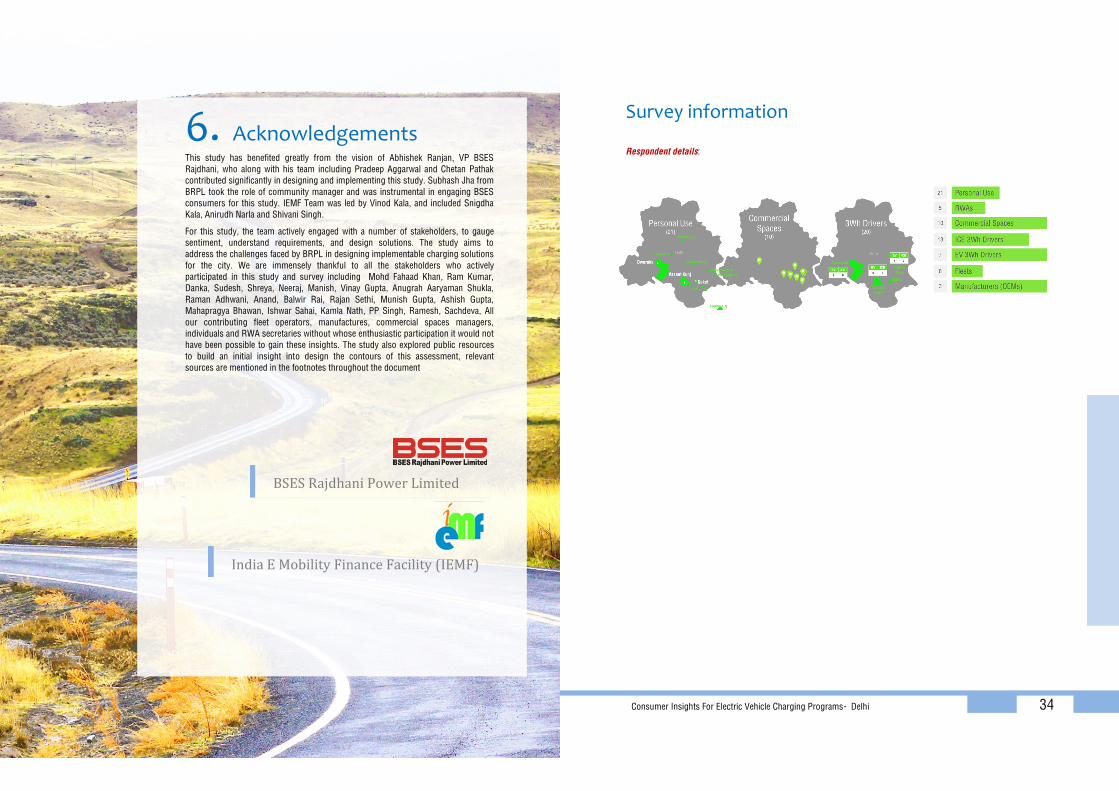
33
6. Acknowledgements This study has benefited greatly from the vision of Abhishek Ranjan, VP BSES
Rajdhani, who along with his team including Pradeep Aggarwal and Chetan Pathak
contributed significantly in designing and implementing this study. Subhash Jha from
BRPL took the role of community manager and was instrumental in engaging BSES
consumers for this study. IEMF Team was led by Vinod Kala, and included Snigdha
Kala, Anirudh Narla and Shivani Singh.
For this study, the team actively engaged with a number of stakeholders, to gauge
sentiment, understand requirements, and design solutions. The study aims to
address the challenges faced by BRPL in designing implementable charging solutions
for the city. We are immensely thankful to all the stakeholders who actively
participated in this study and survey including Mohd Fahaad Khan, Ram Kumar,
Danka, Sudesh, Shreya, Neeraj, Manish, Vinay Gupta, Anugrah Aaryaman Shukla,
Raman Adhwani, Anand, Balwir Rai, Rajan Sethi, Munish Gupta, Ashish Gupta,
Mahapragya Bhawan, Ishwar Sahai, Kamla Nath, PP Singh, Ramesh, Sachdeva, All
our contributing fleet operators, manufactures, commercial spaces managers,
individuals and RWA secretaries without whose enthusiastic participation it would not
have been possible to gain these insights. The study also explored public resources
to build an initial insight into design the contours of this assessment, relevant
sources are mentioned in the footnotes throughout the document
BSES Rajdhani Power Limited
India E Mobility Finance Facility (IEMF)
Consumer Insights For Electric Vehicle Charging Programs- Delhi 34
Survey information
Respondent details: