Embed Size (px)
DESCRIPTION
Succinct answers to frequently asked questions of the VAST-2 system. Presents an example of results. Explanation of how results might be used for reporting and for engaging land managers in how to change vegetation condition by changing land management practices.
Citation preview
Tracking The TransformaTion of VegeTaTed Landscapes using The VasT-2 sysTem
richard ThackWay
transformations
Version 1.1
5 augusT 2015
2
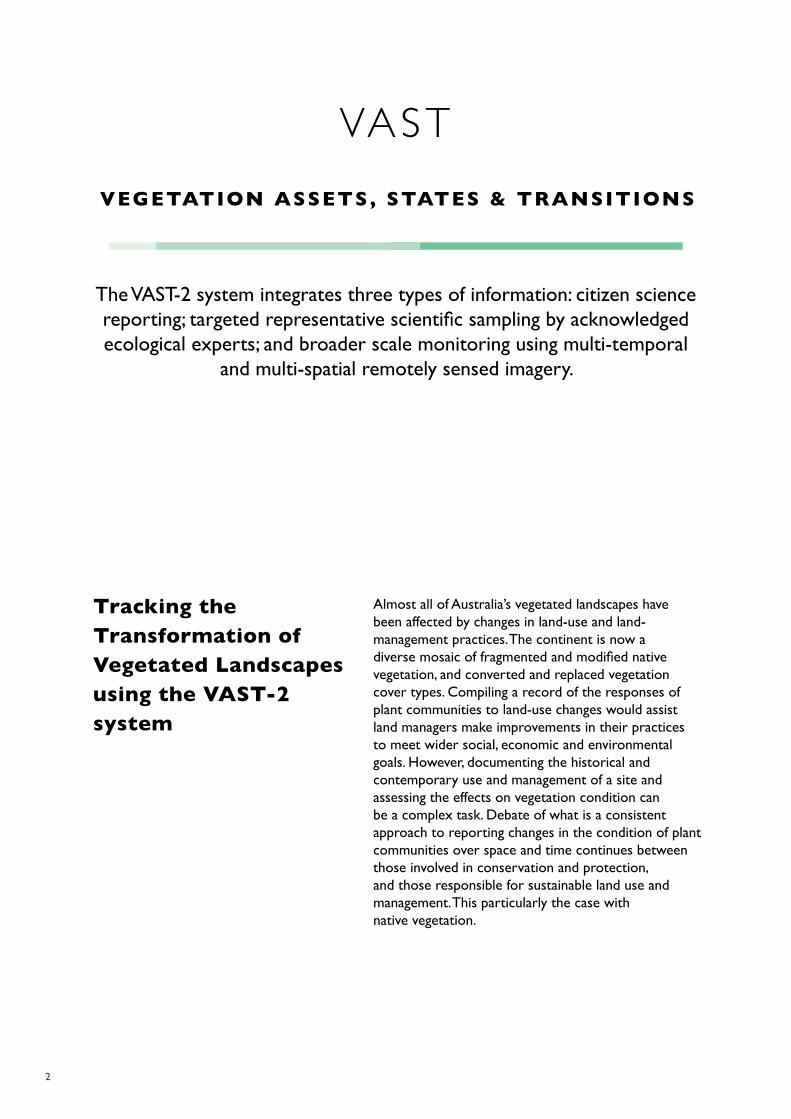
almost all of australia’s vegetated landscapes have been affected by changes in land-use and land-management practices. The continent is now a diverse mosaic of fragmented and modified native vegetation, and converted and replaced vegetation cover types. compiling a record of the responses of plant communities to land-use changes would assist land managers make improvements in their practices to meet wider social, economic and environmental goals. however, documenting the historical and contemporary use and management of a site and assessing the effects on vegetation condition can be a complex task. debate of what is a consistent approach to reporting changes in the condition of plant communities over space and time continues between those involved in conservation and protection, and those responsible for sustainable land use and management. This particularly the case with native vegetation.
VEGETATION ASSETS, STATES & TRANSITIONS
VAST
Tracking the Transformation of Vegetated Landscapes using the VAST-2 system
The VasT-2 system integrates three types of information: citizen science reporting; targeted representative scientific sampling by acknowledged ecological experts; and broader scale monitoring using multi-temporal
and multi-spatial remotely sensed imagery.
3
The VAST-2 system
VasT-2 addresses several key questions:
• What is the condition of the native vegetation on my site relative to an accepted national standard?
• What role has historic land use and land management practices had in transforming or modifying the condition of the native vegetation on my site?
• how can i assess and report the condition of my native vegetation resulting from my management interventions?
• as a land manager what can i do to change the condition of the native vegetation of my site?
VasT-2 is designed to assist researchers and land managers record site-based land use and land management practices and their effects on the condition of native plant communities.documenting the historic record of land use and management at a site and assessing the effects on vegetation condition need not be a complex task.
VasT-2 offers certainty for land managers and planners through providing a nationally consistent approach for assessing and reporting vegetation condition at sites over time. Quantitative and qualitative data and information as well as personal communications can be compiled and evaluated to determine changes in the condition of a plant community over time.
The VasT-2 system combines a structured spatiotemporal literature review and stakeholder interviews with 22 vegetation transformation indicators (Table 1) to assess and report the outcomes/effects of land management interventions on native plant communities. change is assessed relative to an unmodified reference state.
What are the benefits of the VAST-2 system for decision makers?
VasT-2:
• empowers land managers to engage equally with ecologists and researchers at the point of land management decisions;
• establishes a logical link between land management practice change and their effects on plant communities over time using a checklist of
22 indicators of vegetation structure, species composition and regenerative capacity or function;
• enables observational, qualitative and quantitative data/information to be used to populate the 22 indicators, which are analysed relative
to impacts of land use and management;
• illustrates complex ecological patterns and processes using simple to understand graphical tools;
• highlights options and future trade-offs for decision-makers.
VasT-2 describes transformation pathways of native vegetation, including positive and negative feedbacks and transitions from one condition state to another, including the replacement, removal or recovery of native vegetation. It offers a robust and flexible system that has been tested in australia’s tropical, sub-tropical, arid, semi-arid, and temperate bioregions.
VasT-2 delivers ecologically meaningful information to assist decision makers to track and understand complex ecological processes including degradation, restoration and regeneration. as a tool, the system provides a framework for identifying potential risks and barriers to achieving success, demonstrating progress toward vegetation condition targets, and selecting sites which represent least-cost options for future land use changes. it also highlights the importance of an accounting system that can be used to track the sustainable use and management of native vegetation across all land use types and has relevance for managing biodiversity.
The easy to understand graphs enable ecologists and land managers to explore options for future improvements through adaptive management of the site. as a historical record this information is also useful for environmental planners, educators, historians, industry groups and the wider public.
4
What is vegetation condition?
The VAST-2 system defines the condition of native plant community types relative to a fully natural reference state using indicators/attributes of regenerative capacity (function), vegetation structure and species composition. The purpose for this definition is to enable decision makers to track the condition of plant community types over time due to changes in land management practices and the effects these practices have on changing indicators/attributes of regenerative capacity (function), vegetation structure and species composition. This definition assists decision makers to understand how land management practices are used to transform vegetated landscapes to produce multiple benefits i.e. ecosystem services. The definition and the VAST-2 system have relevance to the management of biodiversity.
Consistent with this definition vegetation condition is a weighted transformation index comprised of 22 indicators and three components i.e. vegetation structure, species composition and regenerative capacity or function (Table 1). indicators are aggregated using an additive hierarchical system relative to the plant community’s reference state (figure 1).
What is the difference between VAST and VAST-2?
initially the VasT (Vegetation assets, states and Transitions) system was developed to describe and map changes in vegetation over time through a series of condition classes or states (Thackway and Lesslie 2006, 2008). VasT-2 was developed out of a need to implement a system to routinely report changes in condition states over time. VasT-2 is an enhancement to the VasT method which will enable identification of the factors contributing to those changes in state as a result of changes in management practice.
What is a VAST-2 site?
A uniform area defined using topographic position e.g. depression, flats and lower slopes, mid slopes, upper and ridge lines; geology and soil type. The native vegetation of the site is relatively uniform throughout an area. The dimensions of the site remain constant back in time, now and into the future. a site is a representative soil-landscape association and associated plant community. The land use and land management of the site may change over time. VasT-2 records these practices and their effects at the site (i.e. soil-landscape association) over time.
What is a historical record?
A historical record starts at the point of first contact by european settlers and includes a comprehensive list of historic and contemporary measurements and observations where these are available. This record also includes an acknowledgement of the indigenous people who managed the site at the time of european settlement.
FAQHow is change and trend assessed?
site-based effects of land management practices are scored using 22 indicators. each indicator is benchmarked relative to its reference state for that indicator. a transformation index is calculated by aggregating the 22 indicators and three components for each year of the historical record.
for each time period at a Transformation site, each indicator (Table 1) is given a score relative to the reference state. observed and/or measured changes in indicators range from 0 to 1, where 1 represents a natural unmodified plant community (as it would have been without post settlement human intervention) and 0 is where that ecological function is absent.
Why does VAST-2 use criteria and indicators?
Vegetation condition is defined using components of structure, composition and function or regenerative capacity. each of these is further delimited using a hierarchy of criteria and indicators (figure 1).
VasT-2 uses this framework in combination with systematic and repeated observations of land management practices over time to assess the effects of these practices on the 22 indicators and 10 criteria. figure 2 is an evidence-based account of the effects that land use and land management have had in a selected soil-landscape association of the indicators, criteria and components of vegetation condition.
for decision makers, figure 2 represents a baseline assessment for planning future change at the site. as a diagnostic tool, the land manager/s can utilize this account to discuss and plan adaptive management strategies within a soil-landscape association by modifying, removing and replacing, enhancing, restoring, maintaining and/or improving the 10 criteria:
1. soil hydrological status2. soil physical status3. soil chemical status4. soil biological status5. fire regime6. reproductive potential7. overstorey structure8. understorey structure9. overstorey composition10. understorey composition
The land manager is encouraged to establish fixed monitoring points or transects within the key soil-landscape associations and to measure, observe and document through time attributes changes in land management interventions and the 22 indicators. The role of specialists should be considered in stratifying sites, using standardized field and database methods to collect and analyze the attribute data and populate the VasT-2 indicators in Table 1.
5
Why use indicators describe to describe response and change?
The 22 indicators describe the response variables or core attributes of a plant community and its environment that are changed by land management practices. species composition indicators include richness and functional groups; vegetation structure indicators include height, cover and age structure. Regenerative capacity indicators include fire, soil nutrients, soil structure, soil hydrology and reproductive potential (Table 1).
Why does VAST-2 use a bioregional approach?
Establishing a stratified national system of monitoring sites to track the response of large numbers of similar land management interventions is unworkable. Arguably efficiencies can be achieved by selecting a few representative VasT-2 sites which are linked to on going and high quality ecological sites located in the same bioregional context e.g. site data collected at long term monitoring sites within the same land unit, land system, sub-iBra2 or bioregion. These bioregional level measurements and observations of vegetation and environmental responses can also be linked to vegetation and environmental indicators. for these reasons it is not critical to establish a dense network of comprehensive and representative VasT-2 long term monitoring sites.
Why does VAST-2 establish a partnership between land managers and ecologists?
Land manager initiated records and collections of information (formal and informal) about the management of native vegetation represent an as yet largely untapped source of information about the transformation of australia’s vegetated landscapes. Land manager information represents valid and useful information which can be compiled and evaluated using a systematic framework. using the VasT-2 system locally acknowledged ecologists are engaged to evaluate the historical record of land managers and the reported effects of land management practices on the 22 indicators at a site. ecologists and land managers working together contribute valuable ecological insights; and together they validate the final indicator scores and transformation indices.
Land managers invest to change the ecological function of an area to achieve desired ecosystem goods and services from a site. Land manager observations can provide information about how a site was transformed e.g. what, where and when an intervention/s was/were used and what was the observed result.
expert elicitation can be used to evaluate expected and observed outcomes of land manager practices; including those outcomes which were inadvertent.
a VasT-2 handbook (Thackway 2014) assists practitioners compile historical and contemporary information on the responses of native plant communities at sites to the impacts of land use and land management practices over time.
What are land management practices?
Land management practices are interventions or actions including grazing, land clearing, weed invasions and establishing inappropriate fire regimes. These practices are used to remove/replace, maintain/improve, sustainably harvest/manage, replace/manage, monitor the health, vitality and condition, establish/rehabilitate a native plant community.
What do the completed results look like?
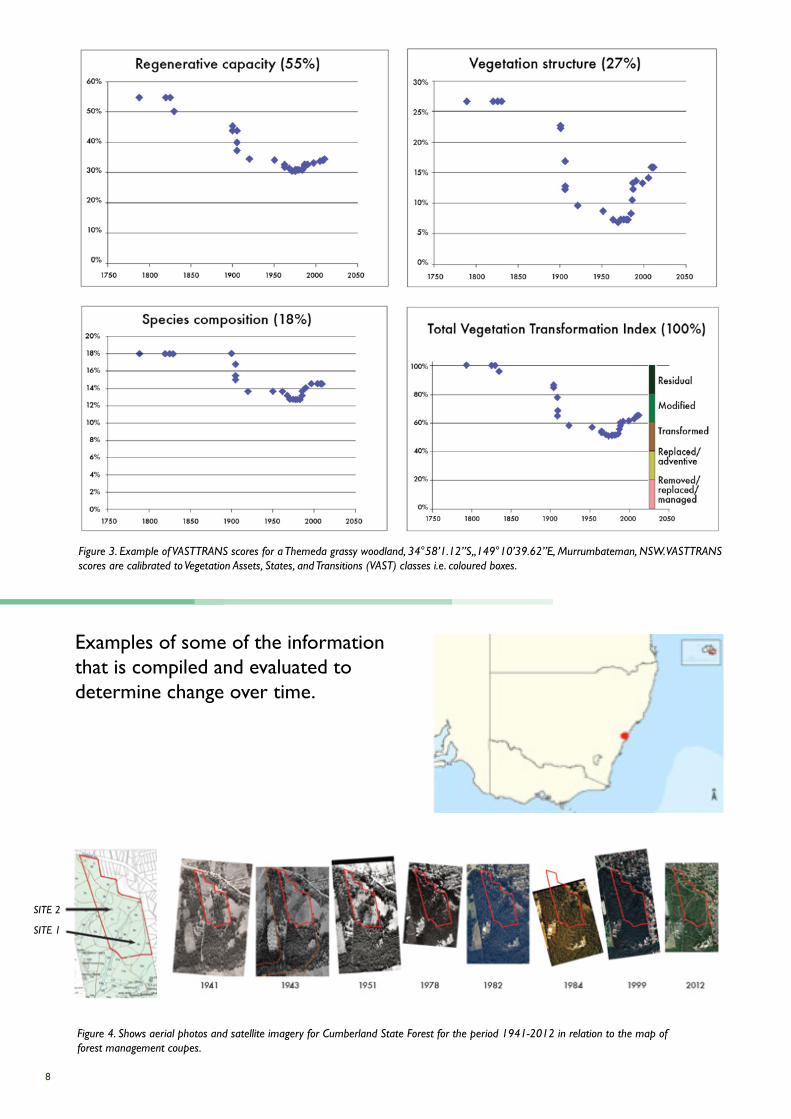
figure 2 shows an example for a Themeda grassy woodland on the southern tablelands of nsW. more results of completed VasT-2 sites are posted on aceas portal http://aceas.org.au/portal/ and the Tern data discovery portal (http://portal.tern.org.au/)
How is the issue of data quality handled?
all information compiled into a historical record for a site using the VasT-2 system is assigned a reliability or certainty level. This includes geospatial position, temporal accuracy and thematic accuracy. as new and more accurate information becomes available this replaces less reliable information in the historical record. Are the results of the VAST-2 system peer reviewed?
Yes. The TERN Digital Object Identifier (DOI)-minting service is used to assign unique dois to completed VasT-2 datasets. This means that these datasets are citable, akin to scholarly scientific publications like journal articles. The VAST-2 datasets are searchable via The data citation index enabling researchers to discover, use and track citation of datasets. Tracking of dataset citation will be a key indicator of the usefulness of that dataset to the broader research community.
What types of information can be used in VAST-2?
VasT-2 compiles and assesses qualitative observations and quantitative measurements about land management and their effects on vegetation and the environment. Both published and unpublished are valuable. oral histories, observations (photo-points) of land managers and scientific measurements collected at opportunistic and long-term ecological monitoring sites are equally important. Time series aerial photos, satellite and drone-based imagery and paddock histories in farm journals and peer reviewed scientific journal papers are equally important. figures 4, 5, 6 and 7.
Does VAST-2 establish a long-term monitoring system?
no. VasT-2 synthesises multi-temporal and multi-spatial information into a site-based historical record that describes changes in the condition of a native plant community (i.e. land diary of change and trend) over time. however, VasT-2 can compile a diverse range of data from long term ecological monitoring sites.
2 Interim Biogeographic Regionalisation for Australia
6
condition components
(VasT diagnostic attributes)
(3)
attribute groups (10)
description of loss or gain relative to pre settlement indicator reference (22)
regenerative capacity
fire regime 1. Change in the area /size of fire foot prints
2. Change in the number of fire starts
soil hydrology 3. change in the soil surface water availability.
4. change in the ground water availability
soil physical state 5. change in the depth of the a horizon
6. change in soil structure.
soil nutrient state 7. Nutrient stress – rundown (deficiency) relative to soil fertility
8. nutrient stress – excess (toxicity) relative to soil fertility
soil biological state
9. change in the recyclers responsible for maintaining soil porosity and nutrient recycling
10. change in surface organic matter, soil crusts
reproductive potential
11. change in the reproductive potential of overstorey structuring species
12. change in the reproductive potential of understorey structuring species
Vegetation structure
overstorey structure
13. change in the overstorey top height (mean) of the plant community
14. change in the overstorey projective foliage cover (mean) of the plant community
15. change in the overstorey structural diversity (i.e. a diversity of age classes) of the plant community
understorey structure
16. change in the understorey top height (mean) of the plant community
17. change in the understorey ground cover (mean) of the plant community
18. change in the understorey structural diversity (i.e. a diversity of age classes) of the plant
species c
omposition
overstorey composition
19. change in the densities of overstorey species functional groups
20. change in no.s of indigenous overstorey species relative to the number of exotic species
understorey composition
21. change in the densities of understorey species functional groups
22. change in no.s of indigenous understorey species relative to the number of exotic species
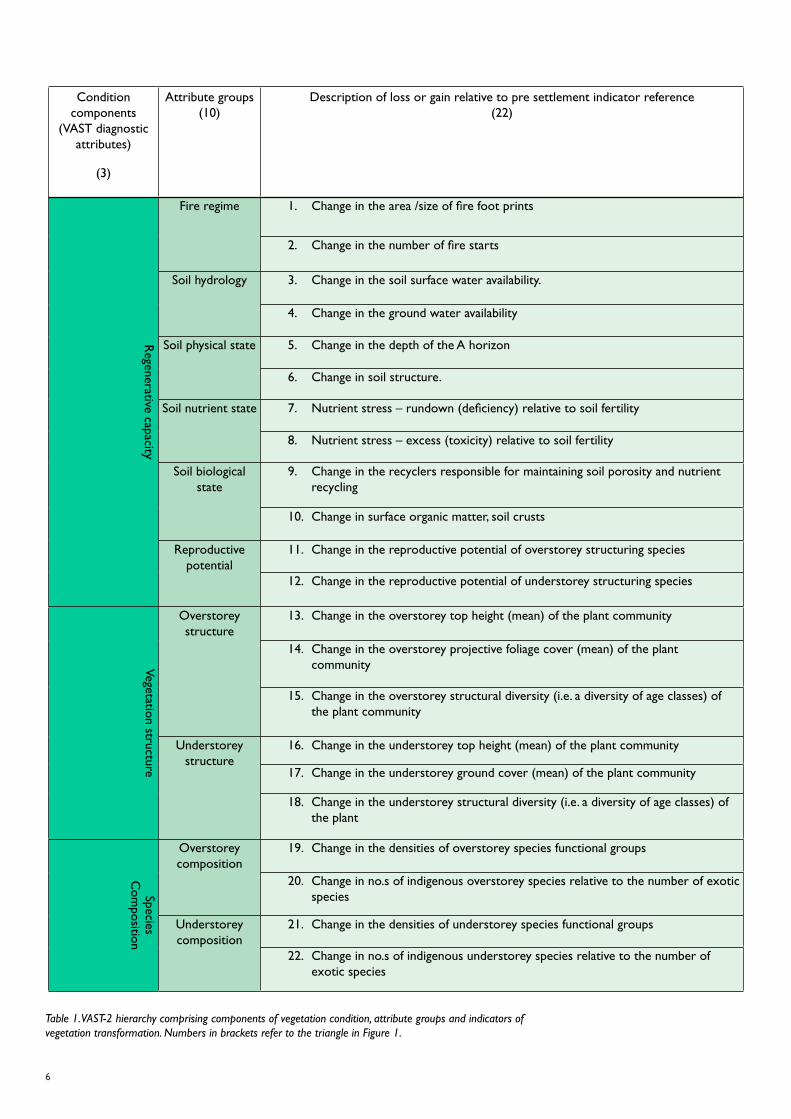
Table 1. VAST-2 hierarchy comprising components of vegetation condition, attribute groups and indicators of vegetation transformation. Numbers in brackets refer to the triangle in Figure 1.
7
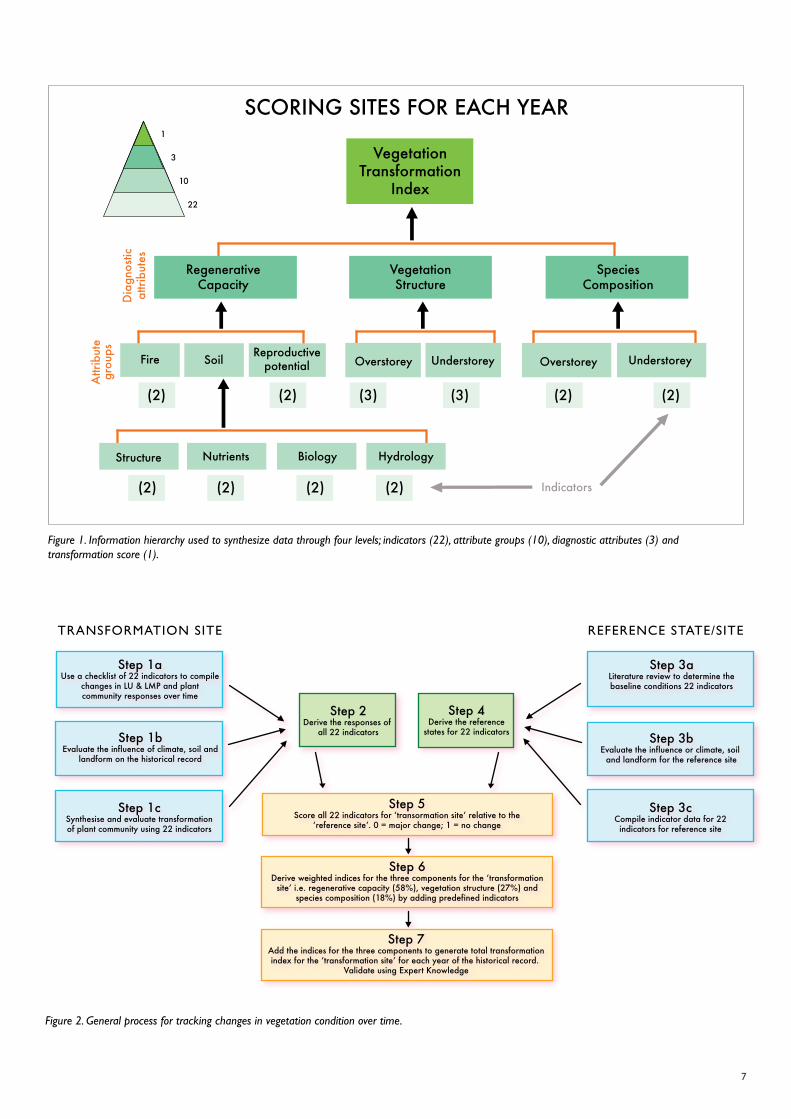
Figure 1. Information hierarchy used to synthesize data through four levels; indicators (22), attribute groups (10), diagnostic attributes (3) and transformation score (1).
SCORING SITES FOR EACH YEAR
VegetationTransformation
Index
RegenerativeCapacity
VegetationStructure
SpeciesComposition
Fire
Structure Nutrients Biology Hydrology
Soil OverstoreyReproductive
potential Understorey UnderstoreyOverstorey
(2)
(2) (2) (2) (2)
(2) (3) (3) (2) (2)
Dia
gnos
ticat
tribu
tes
Attr
ibut
egr
oups
Indicators
1
3
10
22
Figure 2. General process for tracking changes in vegetation condition over time.
Step 3aLiterature review to determine thebaseline conditions 22 indicators
Step 3bEvaluate the influence or climate, soil
and landform for the reference site
Step 3cCompile indicator data for 22indicators for reference site
Step 4Derive the reference
states for 22 indicators
Step 2Derive the responses of
all 22 indicators
Step 1aUse a checklist of 22 indicators to compile
changes in LU & LMP and plantcommunity responses over time
Step 1bEvaluate the influence of climate, soil and
landform on the historical record
Step 1cSynthesise and evaluate transformationof plant community using 22 indicators
Step 5Score all 22 indicators for ʻtransormation siteʼ relative to the
ʻreference siteʼ. 0 = major change; 1 = no change
Step 6Derive weighted indices for the three components for the ʻtransformation
siteʼ i.e. regenerative capacity (58%), vegetation structure (27%) andspecies composition (18%) by adding predefined indicators
Step 7Add the indices for the three components to generate total transformationindex for the ʻtransformation siteʼ for each year of the historical record.
Validate using Expert Knowledge
TransformaTion siTe reference sTaTe/siTe
8
examples of some of the information that is compiled and evaluated to determine change over time.
Figure 3. Example of VASTTRANS scores for a Themeda grassy woodland, 34°58’1.12”S,,149°10’39.62”E, Murrumbateman, NSW. VASTTRANS scores are calibrated to Vegetation Assets, States, and Transitions (VAST) classes i.e. coloured boxes.
Figure 4. Shows aerial photos and satellite imagery for Cumberland State Forest for the period 1941-2012 in relation to the map of forest management coupes.
SITE 1
SITE 2
9
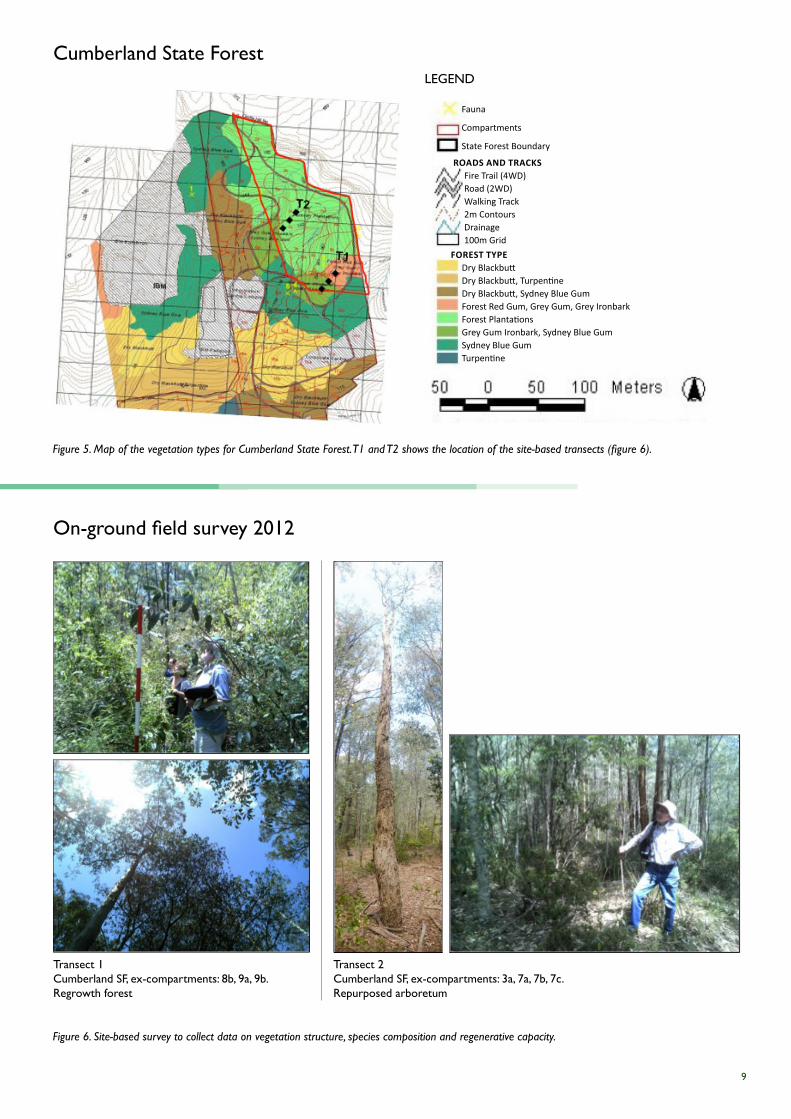
On-ground field survey 2012
cumberland state forest
Transect 1 cumberland sf, ex-compartments: 8b, 9a, 9b.regrowth forest
Transect 2cumberland sf, ex-compartments: 3a, 7a, 7b, 7c.repurposed arboretum
Figure 6. Site-based survey to collect data on vegetation structure, species composition and regenerative capacity.
Figure 5. Map of the vegetation types for Cumberland State Forest. T1 and T2 shows the location of the site-based transects (figure 6).
Roads and TRacks Fire Trail (4WD) Road (2WD) Walking Track 2m Contours Drainage 100m GridFoResT Type Dry Blackbutt Dry Blackbutt, Turpentine Dry Blackbutt, Sydney Blue Gum Forest Red Gum, Grey Gum, Grey Ironbark Forest Plantations Grey Gum Ironbark, Sydney Blue Gum Sydney Blue Gum Turpentine
Fauna
Compartments
State Forest Boundary
Legend
10
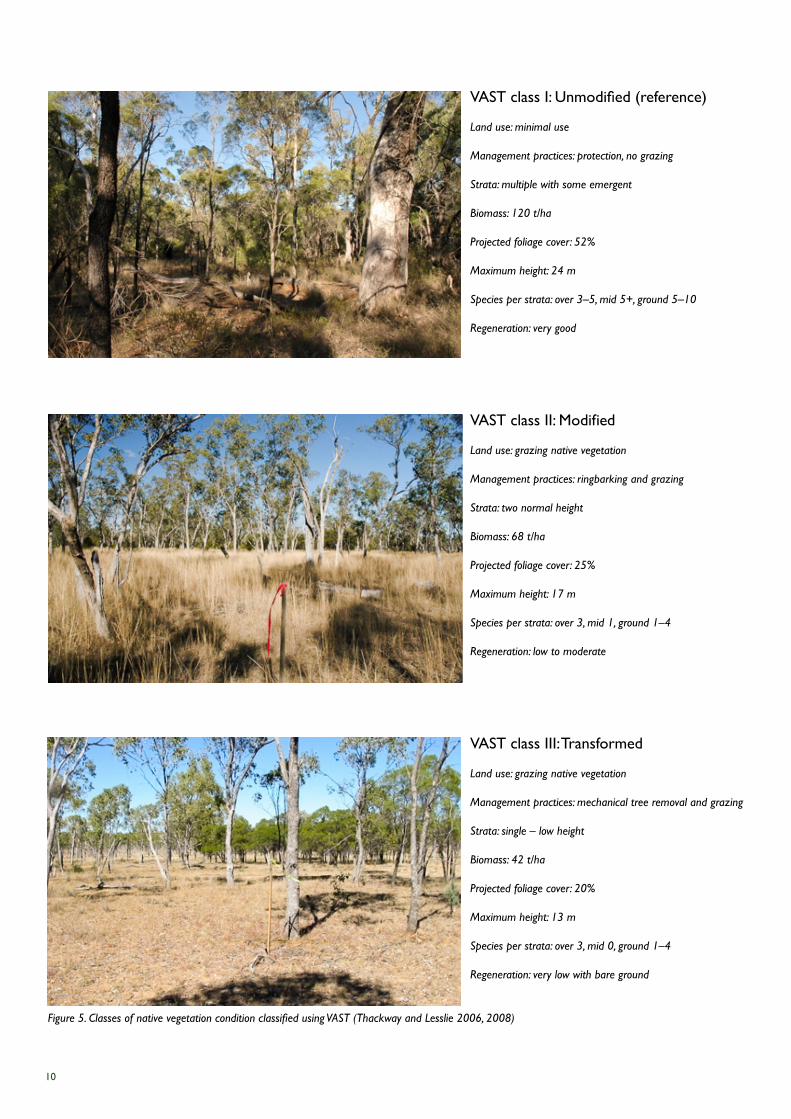
VAST class I: Unmodified (reference)
Land use: minimal use
Management practices: protection, no grazing
Strata: multiple with some emergent
Biomass: 120 t/ha
Projected foliage cover: 52%
Maximum height: 24 m
Species per strata: over 3–5, mid 5+, ground 5–10
Regeneration: very good
VasT class ii: modified
Land use: grazing native vegetation
Management practices: ringbarking and grazing
Strata: two normal height
Biomass: 68 t/ha
Projected foliage cover: 25%
Maximum height: 17 m
Species per strata: over 3, mid 1, ground 1–4
Regeneration: low to moderate
VasT class iii: Transformed
Land use: grazing native vegetation
Management practices: mechanical tree removal and grazing
Strata: single – low height
Biomass: 42 t/ha
Projected foliage cover: 20%
Maximum height: 13 m
Species per strata: over 3, mid 0, ground 1–4
Regeneration: very low with bare ground
Figure 5. Classes of native vegetation condition classified using VAST (Thackway and Lesslie 2006, 2008)
11
acLump (australian collaborative Land use and management program), (2010a). Land use and Land management information for australia: Workplan of the australian collaborative Land use and management program. australian Bureau of agricultural and resource economics and sciences, canberra. http://adl.brs.gov.au/data/warehouse/pe abares99001769/acLump Workplanreport 20101216.pdf [accessed on 8 december 2012].
acLump (australian collaborative Land use and management program), (2010b). status of Land management practices activities of the australian collaborative Land use and management program. australian Bureau of agricultural and resource economics and sciences, canberra. http://adl.brs.gov.au/data/warehouse/pe abares99001770/acLump statusreport 20101216.pdf [accessed on 8 december 2012].
Terrestrial ecosystem research network (Tern), (2012a). Tracking the transformation of vegetated landscapes. enewsletter-2012-aug. http://www.tern.org.au/newsletter-2012-aug-aceasThackwayhandbook-pg23202.html [accessed on 8 december 2012].
Terrestrial ecosystem research network (Tern), (2012b). enabling and encouraging dataset citation: Tern’s doi-minting service. Tern e-newsletter october 2012. http://www.tern.org.au/newsletter-2012-oct-doi-pg24032.html [accessed on 8 december 2012].
Terrestrial ecosystem research network (Tern), (2012c). Vegetation transformation. data discovery portal (Beta). http://portal. tern.org.au/search#%21/q=%28vegetation%20transformation%29/p=1/tab=collection/num=10 [accessed on 8 december 2012]
Thackway, r., (2013). applying a system for tracking the changes in vegetation condition to australia’s forests. in: Brown, a.g., Wells, k.f., parsons, m. and kerruish, c.m. (eds) (2013) managing our forests into the 21st century. proceedings of national conference, institute of foresters of australia, canberra, acT, australia, 4–7 april 2013, pp. 79-91. http://forestryconference.org.au/program/program-abstracts/ifa-2013-conf-papers-thackway
Thackway, r. (2014). VasT-2 Tracking the Transformation of Vegetated Landscapes, handbook for recording site-based effects of land use and land management practices on the condition of native plant communities, Version 3.0, June 2014. australian centre for ecological analysis and synthesis, Terrestrial ecosystem research network. Brisbane: The university of Queensland; 2014 p. 35.
Thackway, r. and Lesslie, r., (2006). reporting vegetation condition using the Vegetation assets, states, and Transitions (VasT) framework. ecological management and restoration. 7(suppl. 1):53-62. [abstract at doi/10.1111/j.1442-8903.2006.00292.x] [accessed on 8 december 2012].
Thackway,r., and Lesslie,r., (2008).describing and mapping human-induced vegetation change in the australian landscape. environmental management 42, 572–590. [abstract at dx.doi.org/10.1007/s00267-008-9131-5] [accessed on 8 december 2012].
Thackway ,r. and specht, a., (2015). synthesising the effects of land use on natural and managed landscapes. science of the Total environment. 526:136–152 doi:10.1016/j.scitotenv.2015.04.070.
Trudgill, s. T. (1988). soil and vegetation systems. clarendon press, oxford. p 211.
yapp, ga. and Thackway, r. (2015). responding to change — criteria and indicators for managing the Transformation of Vegetated Landscapes to maintain or restore ecosystem diversity. in: Biodiversity in ecosystems - Linking structure and function, dr Juan a. Blanco (ed.), isBn: 978-953-51-2028-5, inTech, available from: http://www.intechopen.com/books/biodiversity-in-ecosystems-linking-structure-and-function/respond-ing-to-change-criteria-and-indicators-for-managing-the-transformation-of-vegetated-landscapes
Further reading
transformations
richard Thackwaywww.vasttransformations.com
[email protected] 258 361
VasT Transformations © 2015