Embed Size (px)
Citation preview
NASA Technical Memorandum 103942
2 '/?
Vascular Uptake of RehydrationFluids in Hypohydrated Men atRest and Exercise
J. E. Greenleaf, G. Geelen, C. G. R. Jackson,J.-L. Saumet, L. T. Juhos, L. C. Keil, D. Fegan-Meyer,A. Dearborn, H. Hinghofer-Szalkay, and J. H. Whittam
August1992
(NASA-TM-I¢)39G2) VASCULAR !JPTAKF:
OF REHY_RAT[ON FLU[r_S IN
HyPoHYURATEq MEN AT REST ANrJ
FXERCrS_ ('IASA) ,_9
G3/52
N93-2o133
Unc 1 a s
0159157
National Aeronautics andSpace Administration
NASATechnicalMemorandum103942
Vascular Uptake of RehydrationFluids in Hypohydrated Men atRest and Exercise
J. E. Greenleaf, G. Geelen, C. G. R. Jackson, J.-L. Saumet, L. T. Juhos, L. C. Keil,D. Fegan-Meyer, A. Dearborn, and H. Hinghofer-Szalkay,Ames Research Center, Moffett Field, CaliforniaJ. H. Whittam, Shaklee U.S., Inc., San Francisco, California
August 1992
NationalAeronauticsandSpace Adminisl_ation
Ames Research CenterMoffett Field, California 94035-1000
Vascular Uptake of Rehydration Fluids in Hypohydrated Menat Rest and Exercise
J. E. GREENLEAF, G. GEELEN, C. G. R. JACKSON, J.-L. SAUME7I', L. T. JUHOS, L. C. KEIL, D. FEGAN-MEYER,
A. DEARBORN, H. HINGHOFER-SZALKAY, AND J. H. WHI'ITAM*
Ames Research Center
Summary
The purpose of this study was to formulate and to evaluate
rehydration drinks, which would restore total body water
and plasma volume (PV), for astronauts to consume
before and during extravehicular activity, a few hours
before reentry, and immediately after landing. In the first
experiment (rest, sitting), five healthy men (23-41 yr),
previously dehydrated for 24 hr, drank six (Ia, II, IV, V,
VI, VII) fluid formulations (one each at weekly intervals)and then sat for 70 min. Pre-test PV were measured with
Evans blue dye, and changes in PV were calculated with
the hematocrit-hemoglobin transformation equation. This
rest experiment simulated hypohydrated astronauts
preparing for reentry. The second experiment (exercise,
supine) followed the same protocol except four healthy
men (30-46 yr) worked for 70 min. in the supine position
on a cycle ergometer at a mean load of 71 + 1% of their
peak aerobic work capacity. This exercise experimentsimulated conditions for astronauts with reduced total
body water engaging in extravehicular activity.
In the rest experiment the change of PV after drinking the
beverage formulations ranged from -3.8% (P < 0.05) at3 rain. to +7.6% (P < 0.05) at 70 min. Plasma volume
decreased (P < 0.05) during the initial 9 rain. with drinks
II (19.6 mEq Na + + aspartame), V (19.6 mEq Na + +
glucose), and VI (Performance); and was unchanged with
la (water + aspartarne), IV(157 mEq Na + + aspartarne),
and VII (Power Surge). At 70 min. PV changed by +1.1%
to +1.5% (NS, similar to water) with drinks Ia, 1I, and VI;
and increased (P < 0.05) by 3.1% (VII) by +4.6% (VI)
and by +7.6% (IV).
In the exercise experiment a similar pattern of PV
responses occurred, but at a lower level. In the rest studyall six drinks resulted in changes of PV at 70 rain. from
+ 1.1 to +7.6%; but with exercise consumption of all six
drinks resulted in depression of PV from 5.2% to 14.0% at
70 rain. Results from prior studies indicate that when
subjects had consumed no fluids, the reduction in PV at
70 rain. with this moderately heavy exercise load would
*Shaklee U.S., Inc., San Francisco, California.
have been about 12%-14%. With the exception of Ia
(water), which produced the same response as consuming
no fluids and appeared to be the least desirable drink,
changes in PV with the remaining five drinks were similar
to resting PV responses. It appears that performance ofintensive exercise immediately after drinking inhibited
fluid transfer from the gastrointestinal tract into the
vascular system.
Thus, fluid formulations containing sodium compounds
near isotonic concentrations (i.e., the same concentration
as blood plasma) were more effective than more dilute
solutions for restoring and increasing PV in resting,
hypohydrated men. Fluid formulations containing sodium
compounds near isotonic concentrations and the moredilute sodium formulations were effective for maintaining
PV in exercising, hypohydrated men.
Introduction
Astronauts in microgravity exhibit a reduction in total
body water (hypohydration) of 3-4% of body weight for "the duration of their missions, and this chronic hypo-
hydration probably reduces both extracellular (interstitialand vascular) and cellular fluid compartments (Greenleaf,
1990). As an adaptive response, this chronic hypo-
hydration does not appear to influence astronauts'
physical or mental performance in microgravity unless it
is exacerbated by significant additional fluid and elec-
trolyte losses from vomiting, diarrhea, or sweating. Thelatter can also occur during heavy physical exercise such
as extravehicular activity (EVA). This "latent" hypo-
hydation will manifest itself as actual hypohydration
when acceleration and gravitational forces increase during
reentry. Hypohydration can then impair performance
during reentry, and orthostatic responses immediately
after landing when the astronauts attempt to arise from
their seats (Nicogossian, 1982). The result may be
syncope.
The present recommendation for rehydrating astronauts
a few hours prior to reentry is the voluntary consumptionof NaCI tablets and water in isotonic concentration
(1 g NaCI/100 ml H20) (Bungo, 1985; Frey, 1991).
Consumingthetabletsand water in this precise ratio(concentration) is inconvenient for the astronauts because
rehydration commences about two hours before reentry,
when they are strapped into their seats wearing reentry
suits. The abdominal bladder of the reentry suit exerts
pressure even when it is not inflated and causes
discomfort before, during, and especially after drinking.
The major problem with using salt tablets and water
separately for optimal concentration is achieving a properratio of salt to water. Excess salt taken without sufficient
water can accentuate plasma osmolality (increase thehypohydration), whereas excess water taken with
insufficient salt will probably be excreted in the urine,
cause discomfort, and provide little restoration of the
hypohydration. Pre-mixed beverage formulations would
ameliorate the optimal concentration difficulty, and
perhaps the volume discomfort problems if the drink
volume could be reduced and still provide for adequaterestoration of total body water. Rehydration fluid is
provided in the EVA suit. Apparently no definitive studies
have been conducted to determine the optimal content or
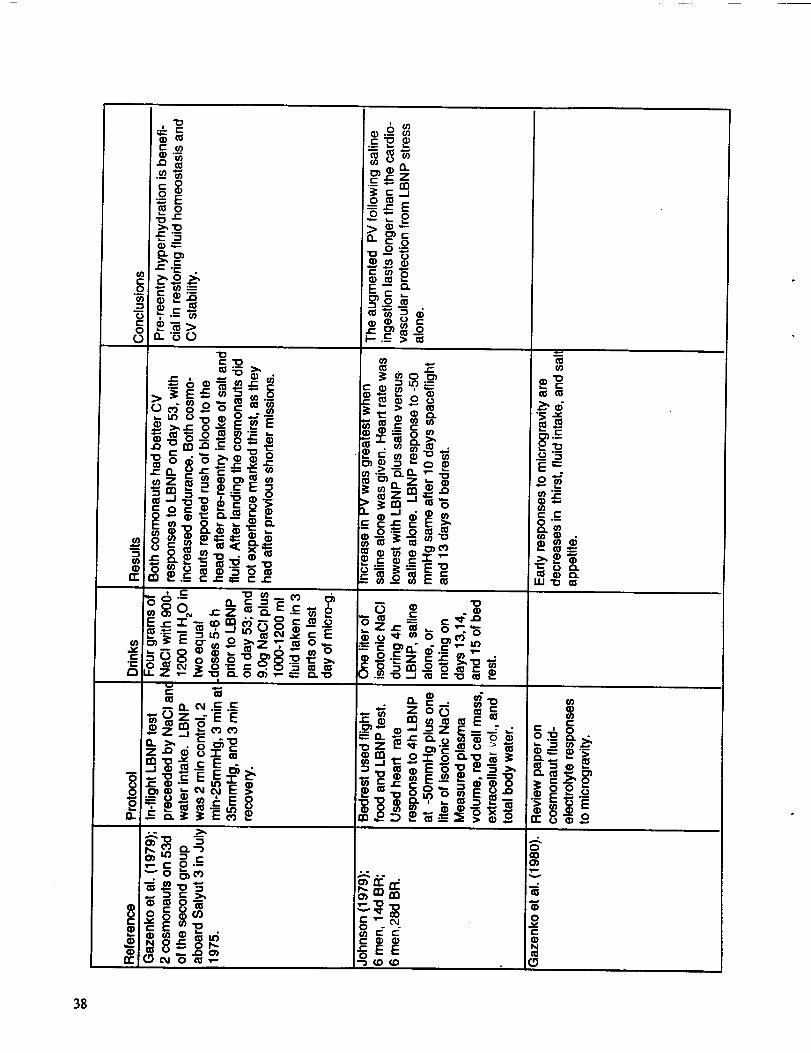
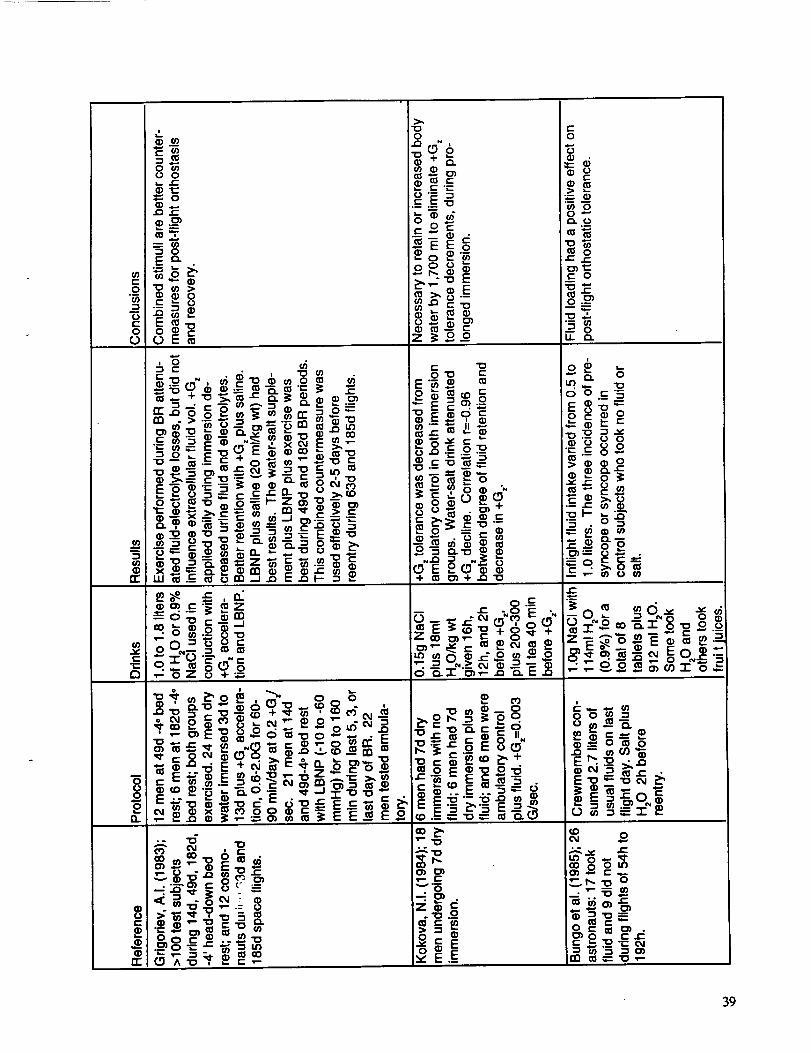
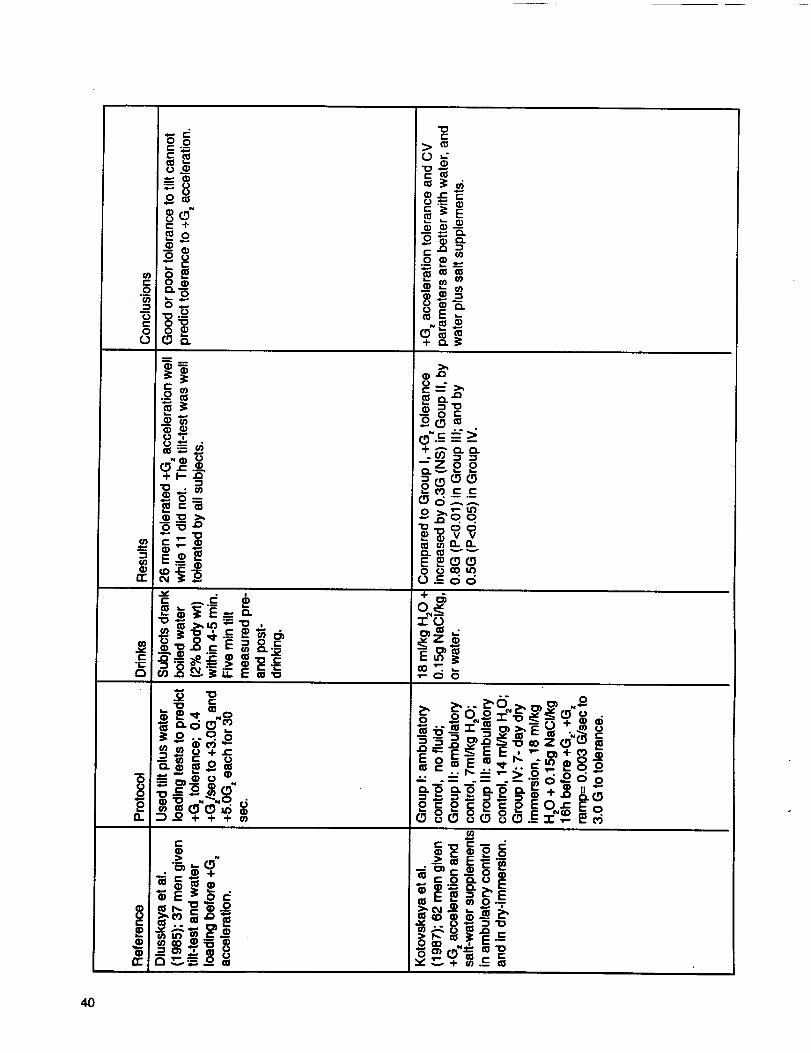
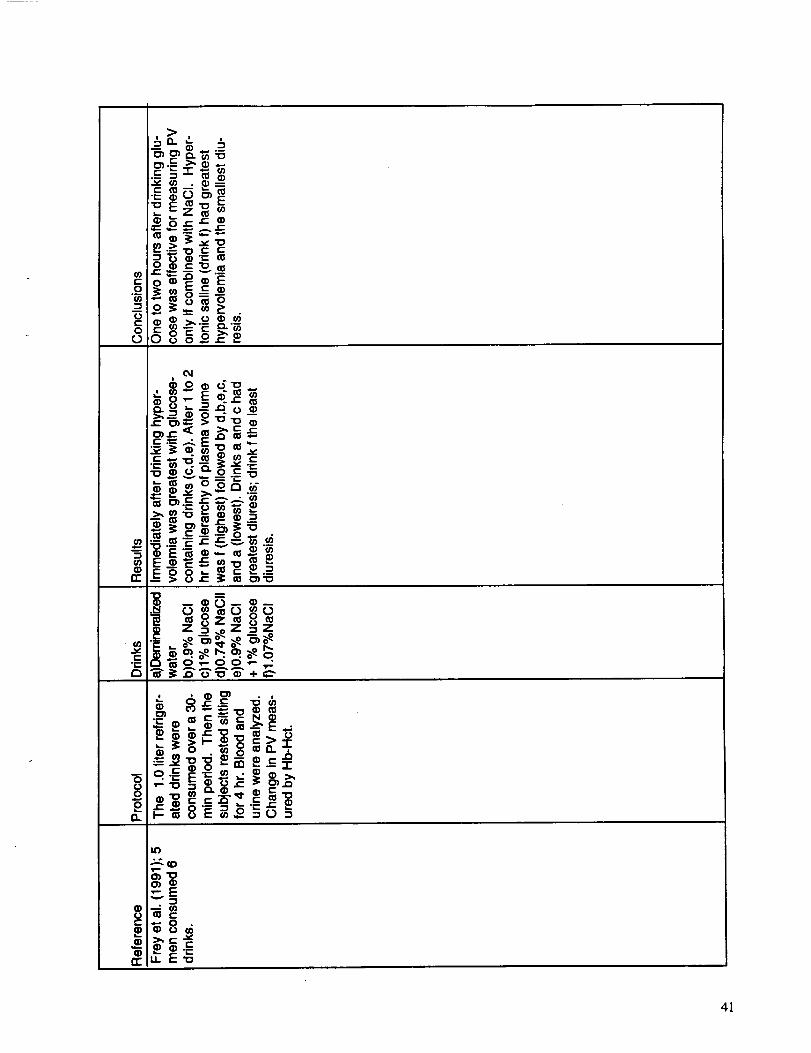
concentration of electrolytes and carbohydrates ofrehydration fluid formulations for astronauts. A brief
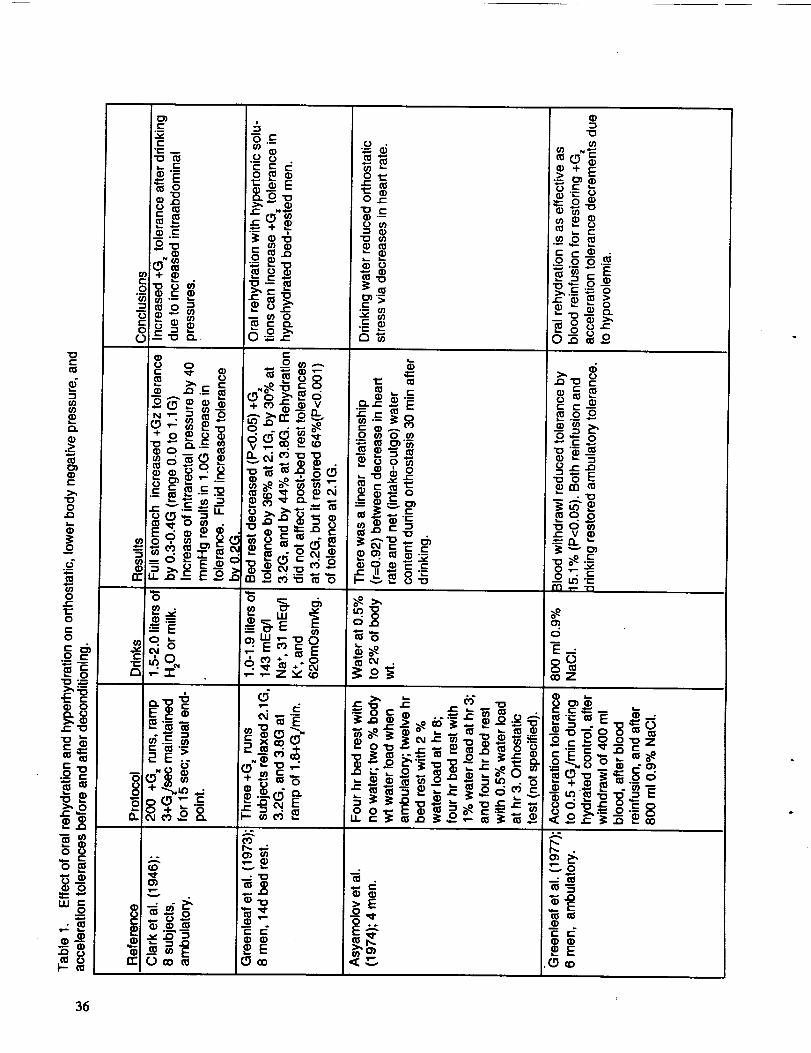
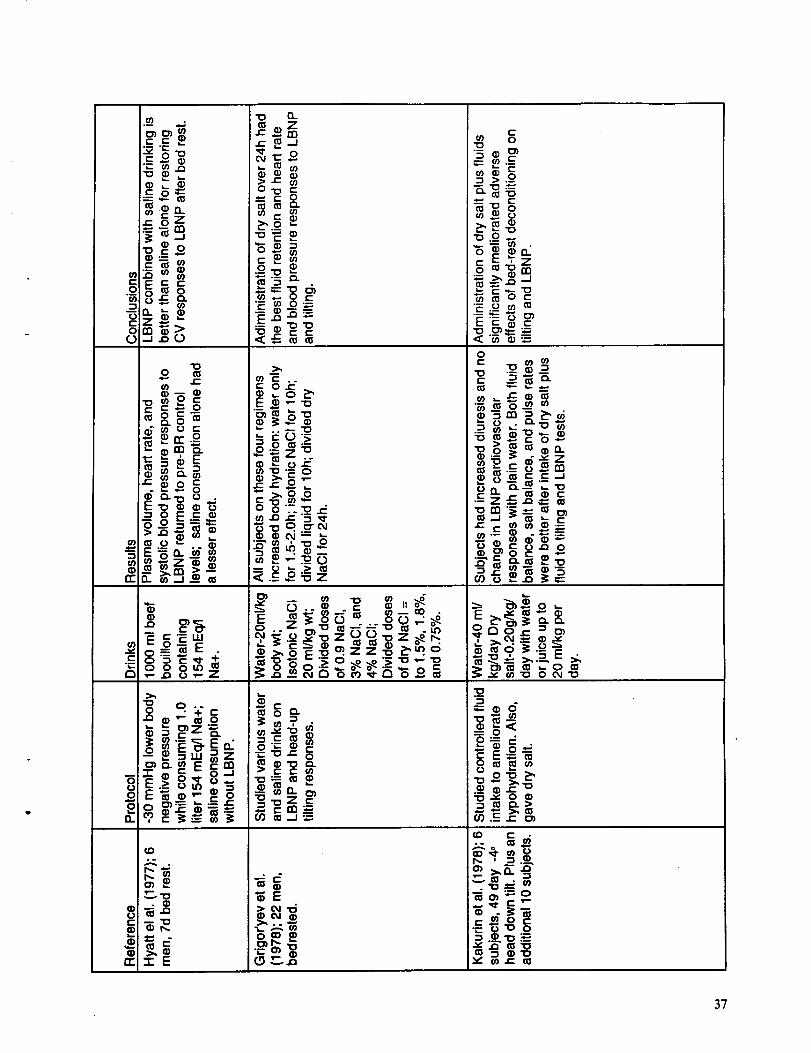
review of the effect of oral rehydration and hyper-hydration on ortlaostatic, lower body negative pressure,and acceleration tolerances before and after decondi-
tioning is presented in table 1.
The purpose of this study was to evaluate six oral
rehydration fluid formulations which could be used by
astronauts and cosmonauts before and during EVA, prior
to reentry, and after landing.
The authors thank S. E. Kravik, M.D., G. Leftheriotis,
M.D., R. Pelligra, M.D., and C. E. Wade, Ph.D. for their
assistance; R. Coppes, J. Evans, R. Gottfried, J. M. Harris,
R. Looft-Wilson, and V. Rimer for technical support, and
A. J. Hardesty for manuscript preparation. This study wassupported by NASA Task 199-18-12-07.
Methods
Subjects
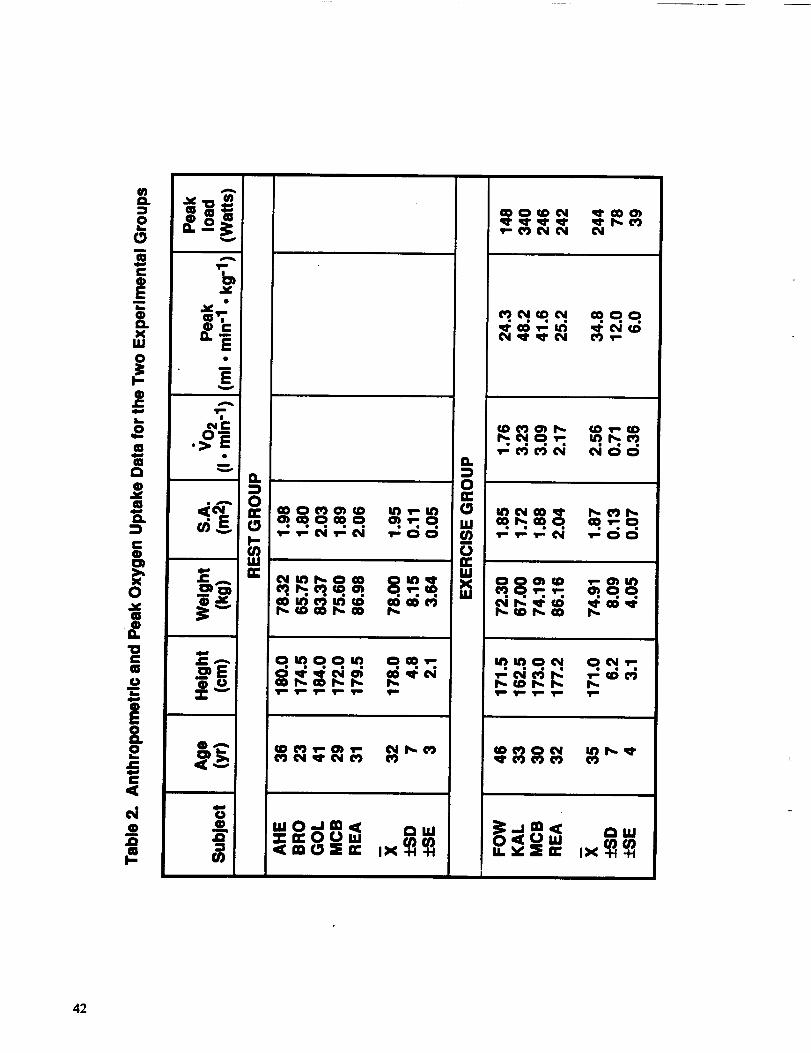
Seven men (23-46 yr, table 2) gave informed consent and
passed a comprehensive medical examination which
included their history, blood and urine analyses, and atreadmill stress test. All were non-smokers and none took
non-prescribed drugs. They were divided selectively into
two groups; a rest (sitting) group ('N = 5) and an exercise
(supine) group (N ---4). Two men participated in both
groups.
Procedure
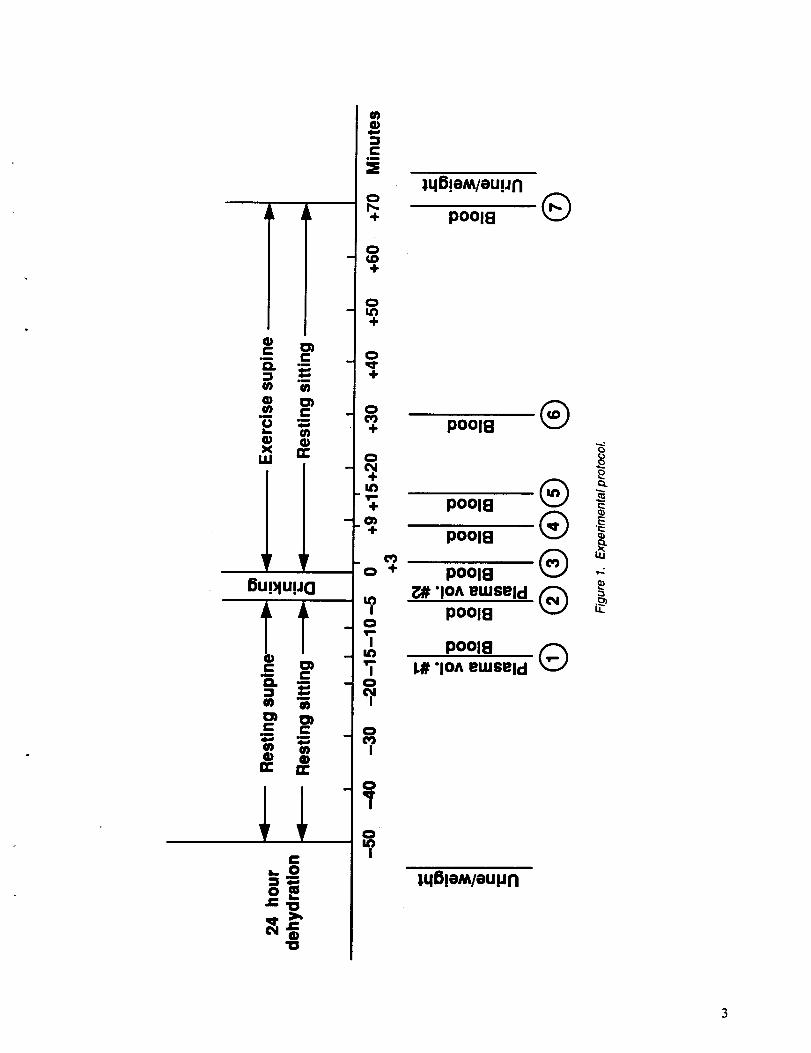
Peak oxygen uptake was measured before the drinking
phases began. The protocol for both experiments (fig. 1)
required the men to dehydrate for 24 hr immediately
before testing by restricting fluid intake and eating dryfood. Their level of dehydration, termed hypohydration
when the reduced fluid level of the body has reached a
steady-state, can be determined prior to each experiment
from the control level (-5 min.) of plasma osmolality.
Normal, hydrated ambulatory control plasma osmolality is
about 285 + 2 mOsm/kg. The initial range in this studywas 298 to 305 mOsm/kg in the rest experiment, and
291 to 304 mOsm/kg in the exercise experiment, so the
test subjects could be considered moderately dehydratedor hypohydrated.
The subjects arrived at the Laboratory for HumanGravitational Physiology at Ames Research Center at
0700 hr. They urinated, were weighed to +5g (model 5780digital scale, National Controls, Inc., San Carlos, CA
94070), and inserted a rectal temperature thermistor probe
16 era. Dressed in shorts and shoes the men rested sitting
(rest experiment) or supine (exercise experiment) for
50 min. (control period) while EKG electrodes, a cheek
laser-doppler probe, forearm impedance electrodes
(exercise experiment), skin temperature probes (exerciseexperiment), a forearm venous cathether, and the
transcranial-doppler head harness (rest experiment) were
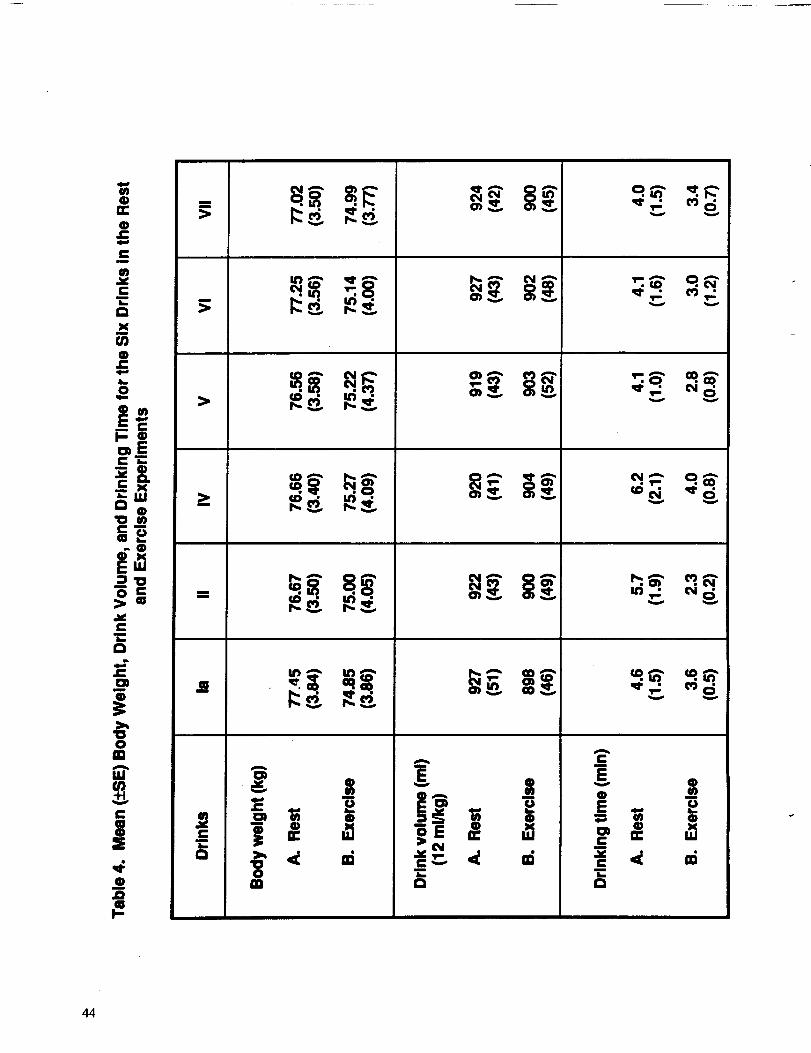
attached. The subjects, in the sitting position, then drank
slowly one of six fluid formulations designated Ia, II, IV,V, VI, VII (table 3). Drinks I and IV were not tested.
Drink volume was 12 ml/kg (898 to 927 ml) and mean
drinking time varied from 2.3 to 6.2 min. (table 4). They
either sat or exercised at 71 + 1% of their peak oxygen
uptake for 70 min. A urine sample was taken and, after
they were dried with towels, a final weight was taken.
Plasma volume was measured with Evans blue dye(T1824) just before drinking. An 8-ml pre-injection blood
sample was taken at-15 min. of the resting control period
(fig. I). Samples were drawn through a heparinized
antecubital teflon catheter (Quik-Cath, Travenol Labora-
tories, Inc., Deerfield, IL 60015). Additional 20 ml blood
samples were taken at -5, +3, +9, +15, +30, and +70 min.
of the test periods (fig. 1). The 70-min. sample was taken
just before exercise stopped. The -5 min. post-dye
injection blood sample was the control sample.
Physiological Measurements
Pc:.._xygen uptake ('V'o2 peak) was measured, after twofamiliarization sessions, at least three times before the
study began with the subjects in the supine position on
an Imaging/Ergometer Table (model 846T, Quinton
2
_L
4)c 01
Q. n= =_
w4) [3)u) C
m .m(,1 _.,
X n"LU
0iui4) O)= cQ.= _=MO) O)
m m
(_ o74) •
n- n-
"0
4)4,,.*
t--.i
lqB!eM/au!_n
° ®+ pOOl8
o(D÷
0in÷
0- q.
÷
_o÷ pooI8 (_
pool8 Q
pool8 (_
o _ pOOl8 Q
i 7.# "1o^ euJseld (_
pool8
_ pool8I L# "1o^ e,,,Seld _-J
0
lqBleM/Oul_n
Q_
Instruments Co., Seattle, WA 9812 I). Shoulder braces,
handgrips, and heel supports were used. The respiratory
measurements system utilized a low-resistance, low-dead-
space Rudolph value (model 2700, Hans Rudolph, Inc.,
Kansas City, MO 64108), a Tissot-tank calibrated
electronic spirometer (model S-301 Pneumoscan,
K.L. Engineering Co., Slymar, CA 91342), and a 3-1iter
mixing chamber from which the expired gas was sampled
at 0.5 liters/min, and then drawn through anhydrous
calcium sulfate (N.A. Hammond Drierite Co., Xenia, OH
45385) to oxygen and carbon dioxide analyzers (Applied
Electrochemistry models S-3AI and CD-3A, respectively;
Ametek, Therrnox Instruments Division, Pittsburg, PA
15238). The analyzers were calibrated with gases
standardized with the Lloyd-Haldane apparatus. Analog
data were processed with an analog-to-digital convener
(VISTA system IBM model 17002, Vacumed, Ventura,CA 93003) and transmitted to an IBM (model AT)
computer; output metabolic data were printed each 15 sec
and peak VO2 was the mean of the final four 15-secvalues. Peak oxygen uptake was extrapolated from the
heart rate at 180 beats/min. Heart rate and oxygen uptake
curves were plotted for each subject from resting data andtwo submaximal exercise loads of 75W and 150W. The
heart rate curve was extended to 180 beats/min, and a
vertical line was drawn to intersect the extended oxygen
uptake curve. The intersection was the estimated peak
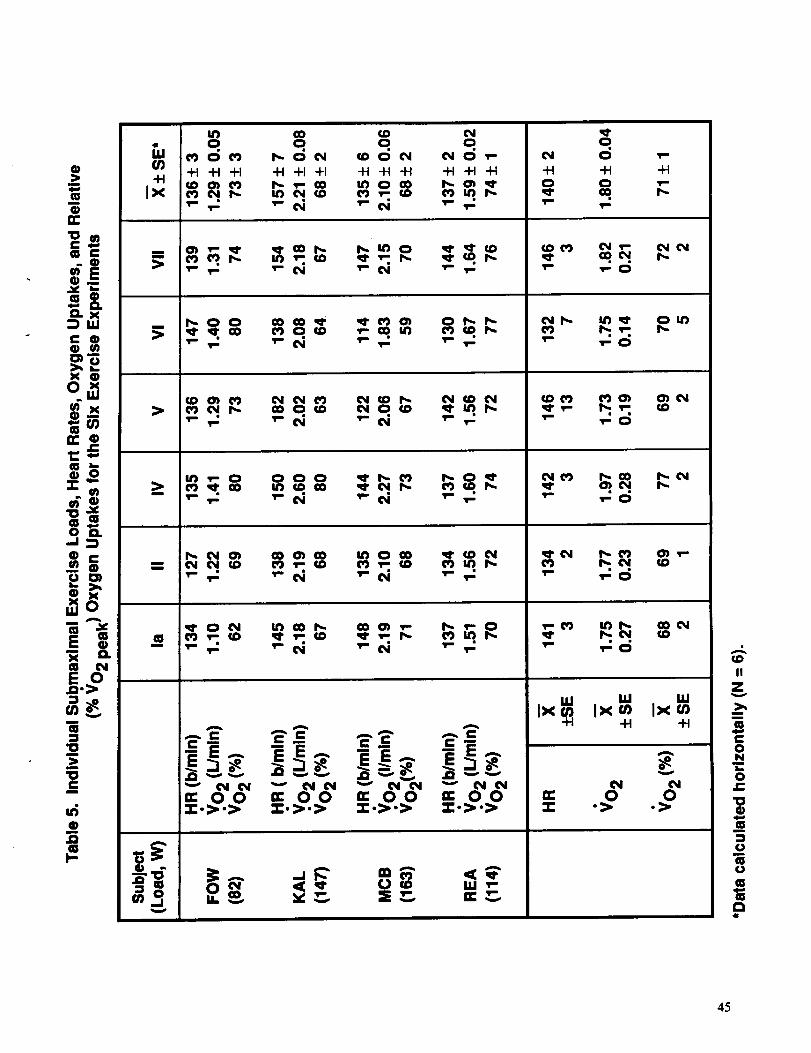
oxygen uptake. The exercise load corresponding to an
oxygen uptake of 70% of the estimated peak VO2 wasselected as the load to be used during the drinking experi-ments. The final mean relative exercise load was 71 :t: 1%
(range = 68 to 77%) (table 5).
Skin blood flow (volume and velocity) were measured on
the cheek just below the zygomatic bone with a laser
Doppler probe (LaserFlo Blood Perfusion Monitor,model BPM 403A, TSI-Vasamedics, Inc., St. Paul, MN
55117). Forearm total blood flow was measured
(Greenleaf, Montgomery, et al., 1979) with a modified
bilateral impedance rheograph (model BR-100, Beckman
Instruments, Inc., Brea, CA 92621). Blood pressure (arm)
was measured with conventional mercury sphygmom-
anometry, and heart rate was determined with acardiotachometer (model 78203C, Hewlett-Packard,
Waltham, MA 02154) connected to Quinton Quik-Prep
electrodes attached to the skin in the area of the sternal
notch, xiphoid process, and the fifth intercostal space.Middle cerebral arterial flow velocities (expressed as
frequency Doppler shift), peak systolic, diastolic, mean
area, and pulsatility index were measured in the rest group
with a transcranial ultrasonic doppler (MedaSonics,
Fremont. CA 94539). Rectal and six skin temperatures
(exercise experiment) were measured with series 700thermistors (Yellow Springs Instrument Co., Yellow
Springs, OH 45387) and recorded on a Digitek Datalogger
thermometry system (model 2000, United Systems Corp.,
Dayton, OH 45401). The skin thermistors, attached with
holders that permitted free movement of air (Greenleaf,
1976), were placed on the arm, forearm, thigh, calf, rightchest, and left chest. Mean skin temperature (Tsk) was
calculated (Hardy, 1938):
Tsk = 0.06(Tarm) + 0.13(Tforearrn) + 0.21(Tthigh)
+ 0.21 (Tcal f) + 0.20(Tr.chest) + 0.19(Tl.ches t)
During the exercise experiment the subject's back was in
contact with the plastic covering on the ergometer, so heat
loss from that skin area was impeded. Room temperaturewas 22.0 + SD 0.07°C and relative humidity was
46.9 + SD 5.9%.
Blood Measurements
Plasma sodium and potassium concentrations were
determined with specific ion electrodes (System E2A,
Beckman Instruments, Brea, CA 9262 I), plasma
osmolality by freezing point depression (model 3DII,
Advanced Instruments Digimatic Osmometer, Needham
Heights, MA 02194), and plasma total protein with a
colorimetric method utilizing the BCA assay reagent(Pierce, Rockford, IL 61105).
Blood and plasma densities were measured with the
mechanical oscillator technique which utilizes continuous
determinations of the oscillation time of a U-shaped,
hollow glass tube filled with whole blood brought to
bending-type vibration by electromagnetic energy
(Hinghofer, 1987; Kratky, 1966).
Plasma volume was measured with the subjects at rest
with Evans blue dye (T-1824) (New World Trading Corp.,
Longwood, FL 32650) just before drinking from one
10-rain. post-dye injection 20 ml blood sample (Campt_,.ql,1958; Greenleaf, Convertino, et al., 1979). The micro-
hematocrit tubes were centrifuged for 10 min. at
11,500 rpm (model MB, International Equipment Co.,
Needham Heights, MA 02194) and the hematocrit (Hot)
was read from a modified microcapillary tube reader
(model CR, International Equipment Co.). Blood
hemoglobin was determined (cyanomethemoglobin
method) with a hemoglobinometer (Coulter Electronics,
I-lialeah, FL 33014). Percent change in plasma volume
was calculated using the Hb-Hct transformation equations
(Greenleaf, Convertino, et al., 1979).
Plasmavasopressin was measured with a modified
radioimmunoassay (Keil, 1977), plasma renin activity
with a radioimmunoassay for angiotensin I (New England
Nuclear, Boston, MA 02118), plasma aldosterone by
radioimmunoassay (Coat-A-Count kit, DiagnosticsProducts, Los Angeles, CA 90045) and immunoreactive
atrial natriuretic factor (atriopeptin) by radioimmunoassay
(Gauquelin, 1990). Plasma epinephrine and norepineph-
rine were measured with reverse phase liquidchromatography (Davis, 1981).
Urinary Measurements
The volume of urine samples [pre-resting control versus
post-test (+70 min.)] was timed and measured in grad-uated cylinders. Urinary flow (_r) was expressed in
ml/min. Urinary sodium (UNa), potassium (UK), andosmotic (Uosm) concentrations were determined with the
same methods as the plasma variables. Other urinary
functions were calculated: Osmotic clearance (Costa) was
urine osmotic excretion (UosmV) divided by plasma
osmolality (Posm)- Free water clearance (CH20) was
_/-Cosm, fractional excretion of sodium was UNaV andfractional excretion of potassium was UKV.
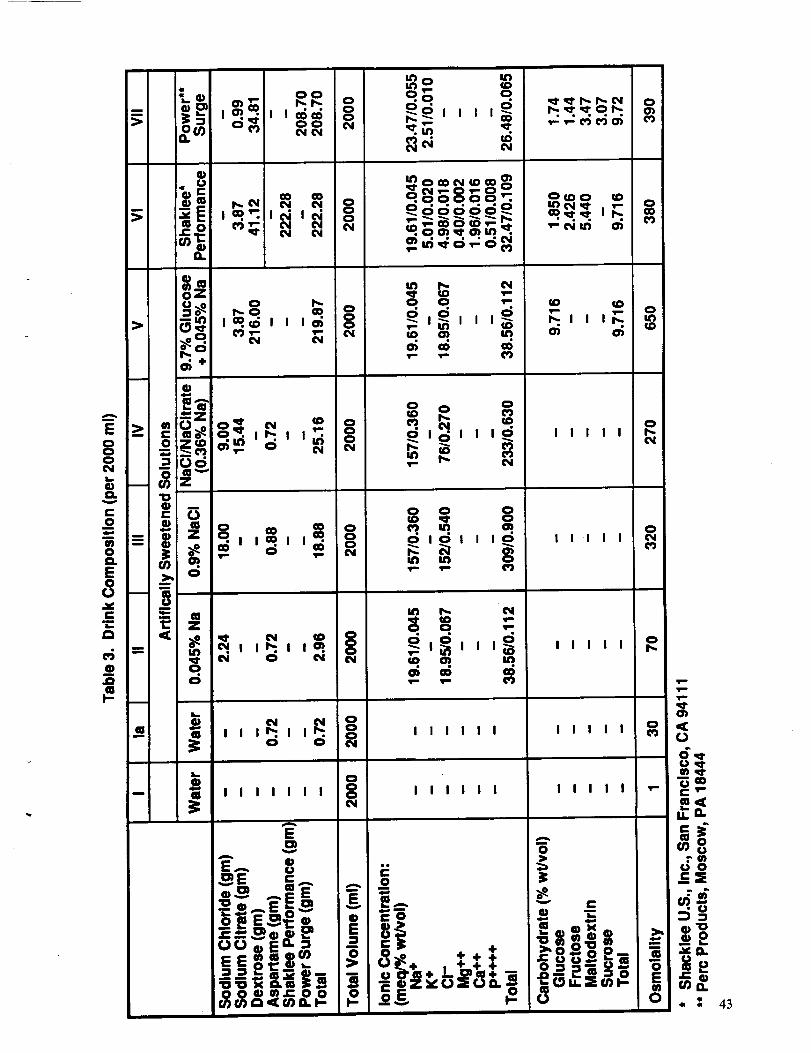
Drink Composition
Four experimental drinks (la, 1I, IV, and V) and two
commercial rehydration beverages (VI and VII) weretested: "Performance" (Shaldee U.S., Inc., San Francisco,
CA 9411 I) and "Power Surge" (Pete Products, Moscow,
PA 18444) (table 3). The basic ingredients of the bever-
ages were approximately 20 mEq sodium (0.045%),isotonic "saline" (157 mEq Na +, 0.36%) in the form ofsodium chloride and sodium citrate to ameliorate the
unpleasant salty taste of sodium chloride, and 9.7% total
carbohydrate. Note that both commercial beverages
contained about 20 mEq sodium and 9.7% carbohydrates.
The non-caloric sweetener Aspartame R and annetto
(natural orange coloring) were added to the non-
commercial drinks so that all drinks would appear and
taste similarly. Power Surge contained FD&C yellow #6
coloring. The high s=!, content of drink IV (157 Na +) was
obvious to the subjects. All drink formulations except
Power Surge were prepared by Shaklee chemists in their
laboratory.
Statistical Procedures
Data were analyzed with Students t-test for dependent
variables where appropriate. The null hypothesis was
rejected when P < 0.05. Nonsignificant differences were
denoted by NS, or the terms "trend" or "tendency."
Results and Discussion
Plasma Volume
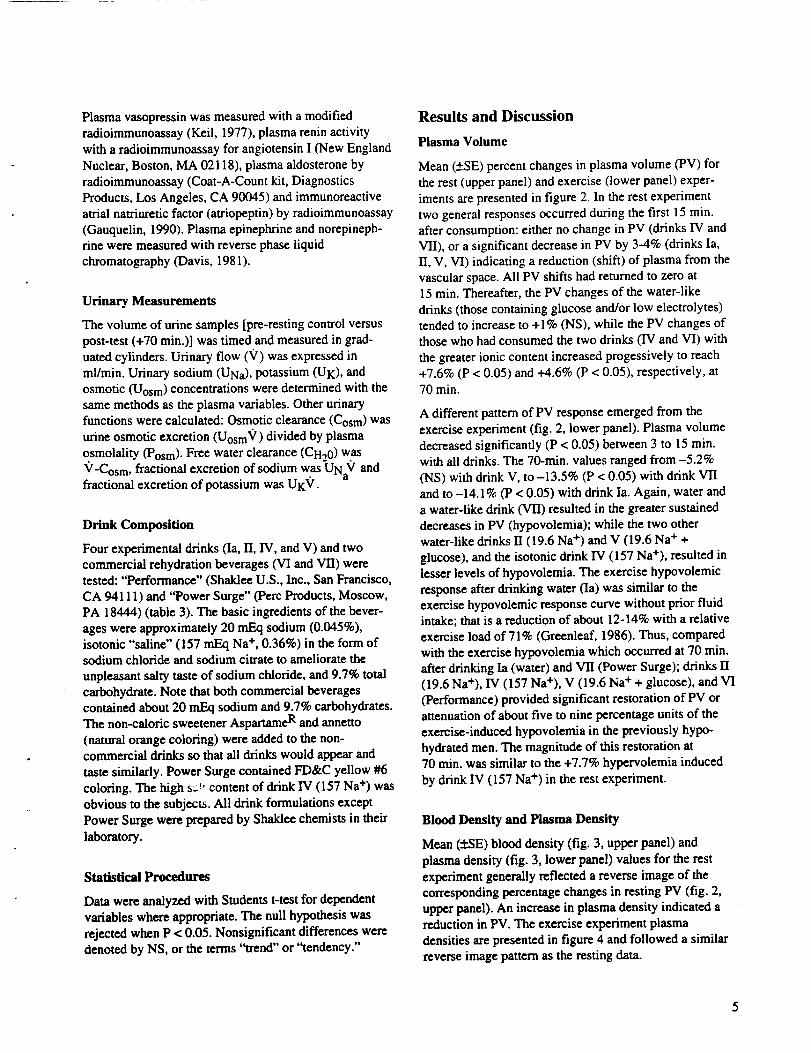
Mean (+SE) percent changes in plasma volume (PV) for
the rest (upper panel) and exercise (lower panel) exper-
iments are presented in figure 2. In the rest experiment
two general responses occurred during the first 15 rain.
after consumption: either no change in PV (drinks IV andVII), or a significant decrease in PV by 3-4% (drinks Ia,
II, V, VI) indicating a reduction (shift) of plasma from the
vascular space. All PV shifts had returned to zero at
15 rain. Thereafter, the PV changes of the water-like
drinks (those containing glucose and/or low electrolytes)
tended to increase to +I % (NS), while the PV changes of
those who had consumed the two drinks (IV and VI) with
the _eater ionic content increased progessively to reach
+7.6% (P < 0.05) and +4.6% (P < 0.05), respectively, at70 min.
A different pattern of PV response emerged from the
exercise experiment (fig. 2, lower panel). Plasma volume
decreased significantly (P < 0.05) between 3 to 15 min.
with all drinks. The 70-min. values ranged from -5.2%(NS) with drink V, to -13.5% (P < 0.05) with drink VII
and to -14.1% (P < 0.05) with drink Ia. Again, water and
a water-like drink (VII) resulted in the greater sustained
decreases in PV (hypovolemia); while the two otherwater-like drinks II (19.6 Na +) and V (19.6 Na + +
glucose), and the isotonic drink IV (157 Na+), resulted in
lesser levels of hypovolemia. The exercise hypovolemicresponse after drinking water (In) was similar to the
exercise hypovolemic response curve without prior fluid
intake; that is a reduction of about 12-14% with a relative
exercise load of 71% (Greenleaf, 1986). Thus, compared
with the exercise hypovolemia which occurred at 70 min.
after drinking Ia (water) and VII (Power Surge); drinks II
(19.6 Na+), IV (157 Na+), V (19.6 Na + + glucose), and VI
(Performance) provided significant restoration of PV or
attenuation of about five to nine percentage units of the
exercise-induced hypovolemia in the previously hypo-
hydrated men. The magnitude of this restoration at
70 rain. was similar to the +7.7% hypervolemia induced
by drink IV (157 Na +) in the rest experiment.
Blood Density and Plasma Density
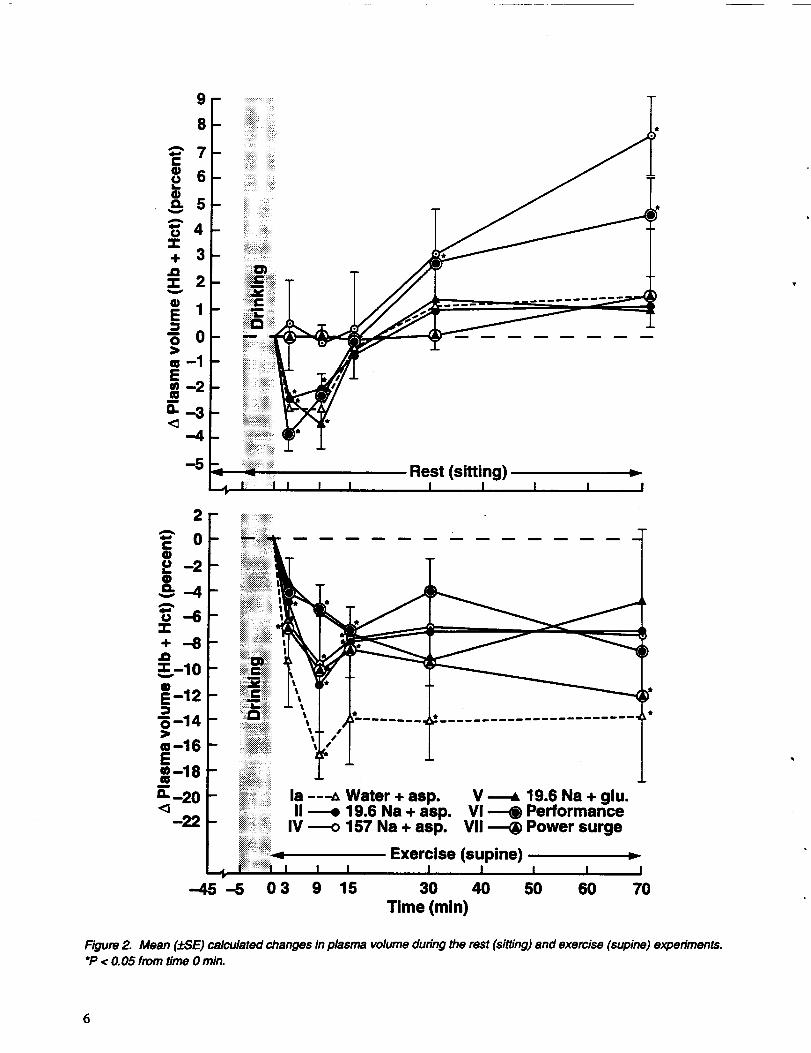
Mean (:I:SE) blood density (fig. 3, upper panel) and
plasma density (fig. 3, lower panel) values for the rest
experiment generally reflected a reverse image of the
corresponding percentage changes in resting PV (fig. 2,
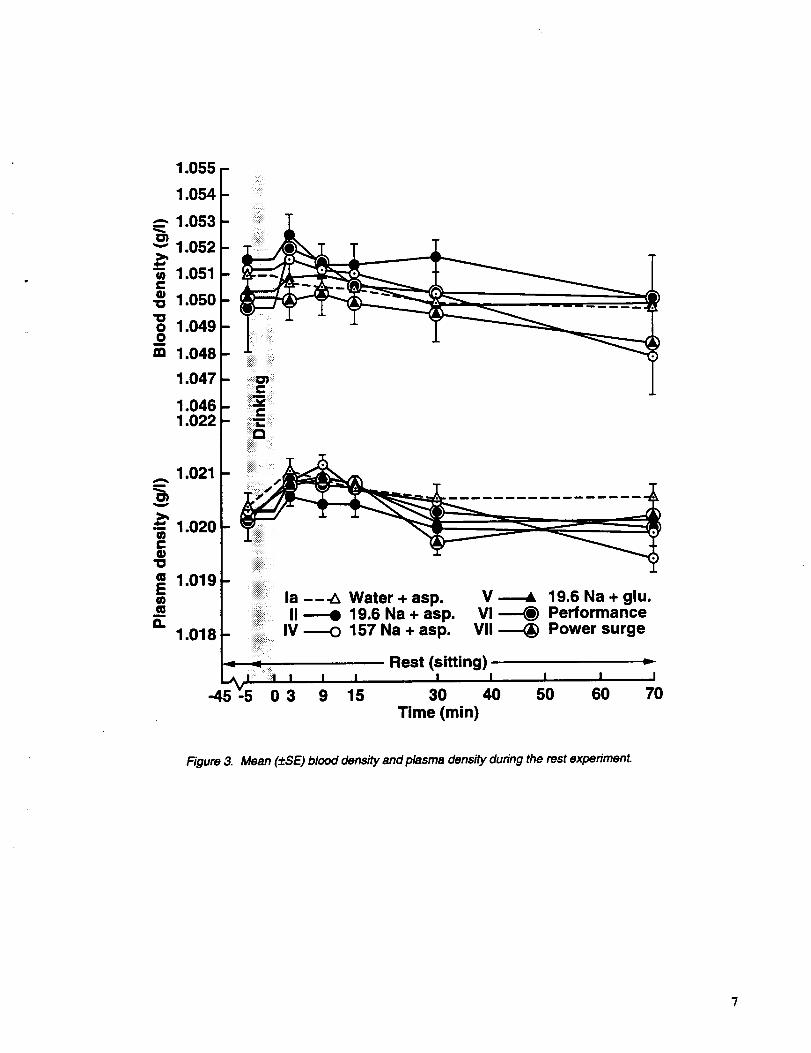
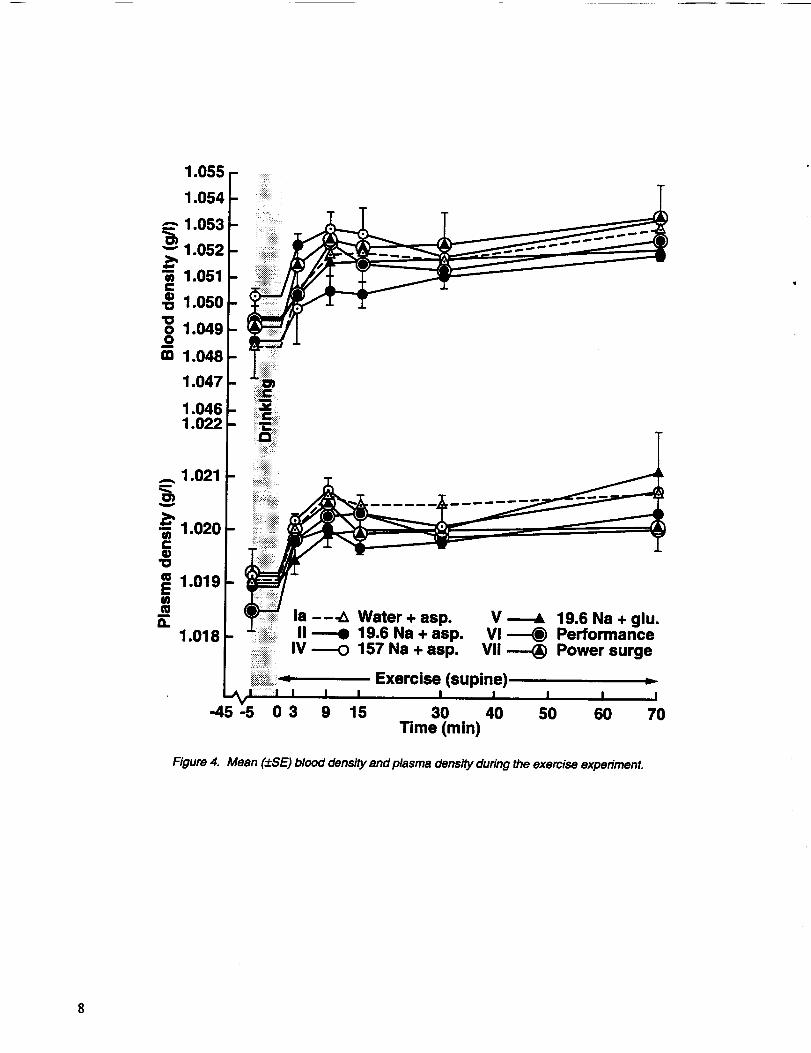
upper panel). An increase in plasma density indicated a
reduction in PV. The exercise experiment plasmadensities are presented in figure 4 and followed a similar
reverse image pattern as the resting data.
9
8
A,,, 7
o 6
_'4
+ 3
12j,go(g--1
0._ 3
-5
2A
"- 0CQ)
-2In
L-4qzml#
A
-5"I"
+ -8.Q
-10oE -12
-14
a -16E
_a"-180.-20<3
-22
Rest (sitting) _-I I I I I I I I
--45-5 03
\.
Is ---_ Water + asp.II _ 19.6 Na + asp.
IV -_o 157 Na + asp.
Exercise (supine)I I I I I
9 15 30 40 50 60 70
Time (min)
V-_ 19.6 Na + glu.PerformanceVII _ Power surge
F'_gure2. Mean (d:SE) calculated changes in plasma volume during the rest (sitting) and exercise (supine) experiments.*P < 0.05 from time 0 min.
0
1.055
1.054
__ 1.053DI"" 1.052
"_ 1.051C
"o 1.050"oo 1.0490
m 1.048
1.047
1.0461.022
1.018
V_ 19.6Na+glu.Vl _ Performance
VII _ Power surge
Rest (sitting)I
70
Figure 3. Mean (±SE) blood density and plasma density during the rest experiment.
7
1.047
1.0461.022
Water + asp.19.6 Na + asp.157 Na + asp.
V _ 19.6 Na + glu.Vl -_ Performance
VII _ Power surge
Figure 4. Mean (¢SE) blood density and plasma density during the exercise experiment.
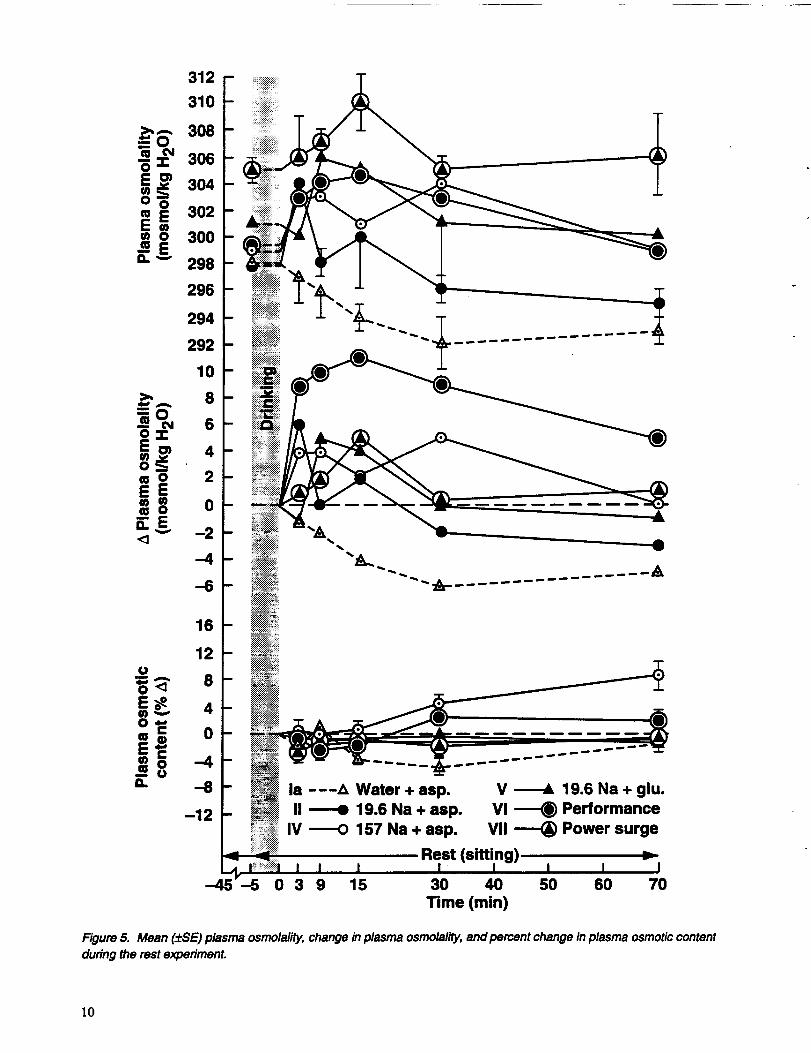
Plasma Osmotic Concentration and Content
These variables are presented in figure 5 (rest experiment)
and figure 6 (exercise experiment). Osmotic content is
osmotic concentration x PV. As would be expected, all
resting plasma osmotic measures were lowest with thewater drink, whose osmolality (30 mOsm/kg) was derived
mainly from the Aspartame R content (table 3): Pure water
had an osmolality of 1 mOsmol/kg. The largest change in
plasma osmolality was an increase following consumption
of drink VI (Performance) which contained the greatest
number of ions, but not the highest total ionic concentra-
tion: Only drink VII (Power Surge) was lower (table 3).
By the end of the rest experiment, drink IV (157 Na+),
which had the highest total ion concentration, also showed
the greatest elevation in plasma osmotic content. This
elevated content accompanied the 7.4% increase in PV.
No consistent relationship was evident between drink total
osmolality and change in plasma osmotic content in the
rest experiment. This was probably because most of the
carbohydrate contents in the drinks were metabolized
during the 70-min. period and their osmotic effect was
progressively diminished. Thus, the osmotic concentra-tions and contents of all drinks except IV (157 Na +) and
VI (Performance) produced essentially the same response
as water by the end of the experiment (fig. 5).
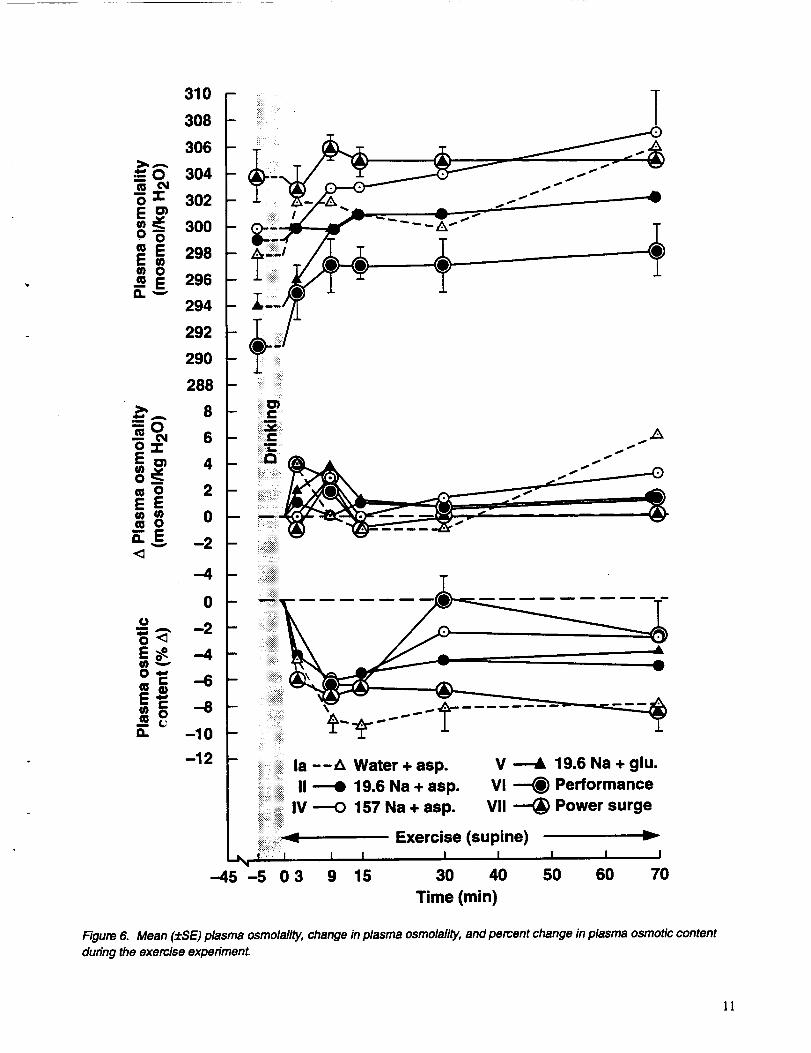
Unlike the responses of plasma osmolality during the rest
experiment, those during exercise exhibited less variation
(fig. 6, all panels). At the end of exercise the changes in
plasma osmolality were essentially the inverse of those in
the rest experiment; Ia (water) and IV (157 Na +) tended to
be higher while VI (Performance) and VII (Power Surge)
tended to be lower (fig. 6, middle panel). Changes in
plasma osmotic content followed more closely the
changes in PV with drinks Ia (water) and VII (Power
Surge) attaining the lowest plasma osmotic contents
(fig. 6, lower panel). Conversely, drinks IV (157 Na +) andVI (Performance) resulted in the highest (least attenuated)
plasma osmotic content levels which were associated withthe lesser decreases in PV. These findings indicate that
better PV stabilization during submaximai exercise
occurred after consuming drinks with the higher ioncontents.
The mixtures of carbohydrate and citrate levels per se did
not appear to be essential for maintenance of exercise PVif sufficient ion content was present in the drink. The
function of carbohydrates in maintaining plasma osmoi-
ality and volume is not clear from the present data
because subjects who consumed drinks II (19.6 Na +) and
V (19.6 Na + + glucose) responded similarly during
exercise (with both plasma osmolality and volume), and
responses to both drinks were more similar to drink IV(157 Na +) than to Water (fig. 6).
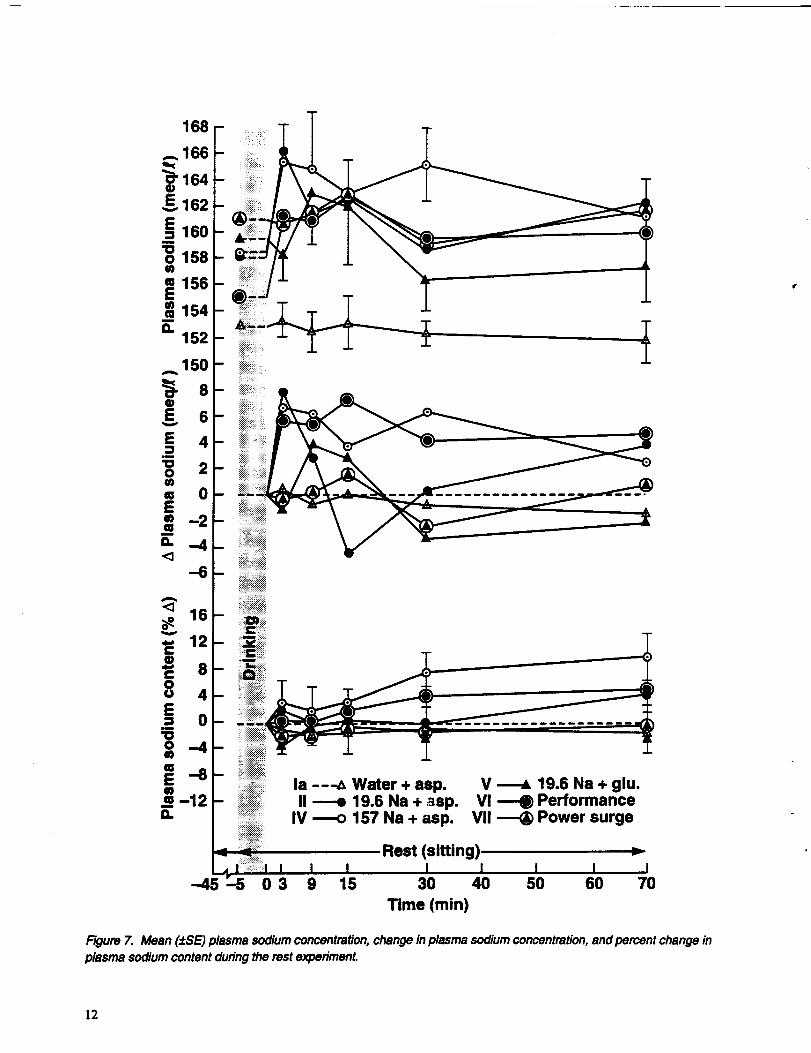
Plasma Sodium Concentration and Content
Most body sodium is located in the extracellular fluid
compartment. Since plasma sodium and its anionsconstitute over 80% of the content of plasma osmolality, it
is not surprising that these two variables showed some
similar responses, particularly in the rest experiment
(fig. 7 vs. fig. 5). The pattern of sodium and osmotic
concentrations, and changes in their concentrations and
contents over time were generally similar; for example,the sodium and osmotic content at 70 min. for drink IV
(157 Na +) was elevated to a greater degree than for the
other drinks.
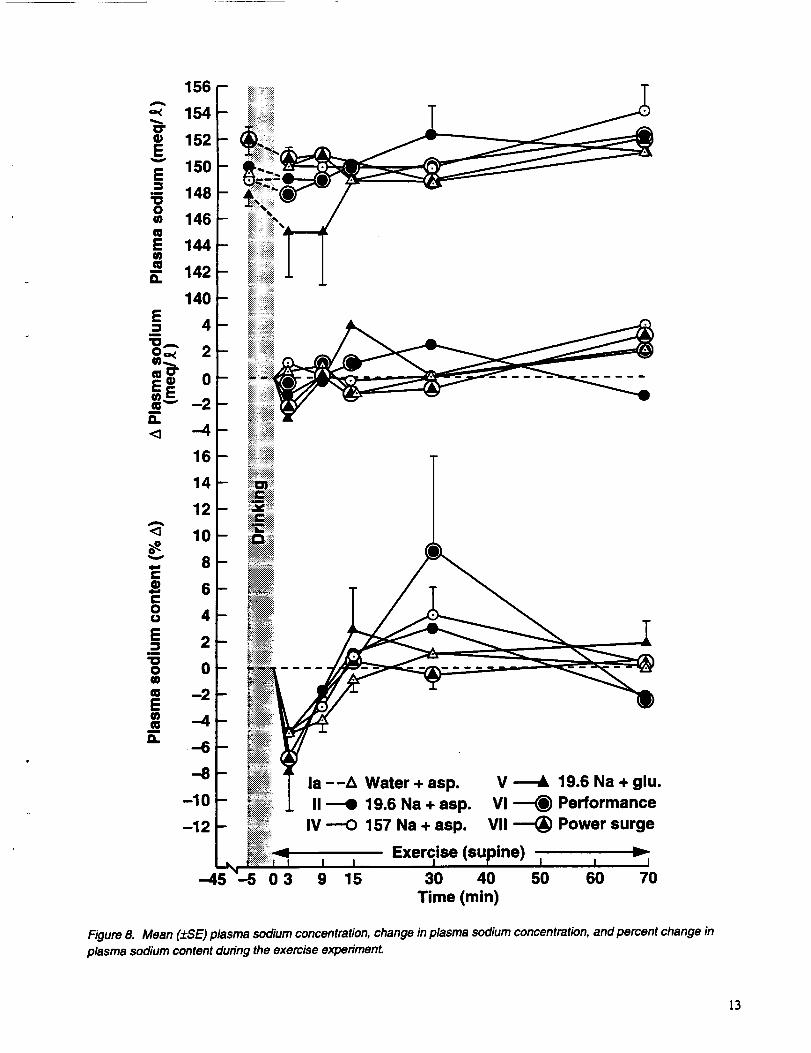
However, this general comparability was not evident in
the exercise experiment (fig. 8 vs. fig. 6). During the
70 rain. of work the plasma sodium concentrations were
less variable than the plasma osmotic concentrations. The
variabliity (-/-SE) of the changes in concentrations wassimilar, but after 15 min. the plasma sodium contents of
all drinks had increased (had returned) to or beyond the
baseline (zero) while plasma osmotic contents remained
depressed below the baseline. After 30 min. of exercise a
similar hierarchy of plasma osmotic and sodium contentlevels became evident, but at 70 min. this relationship
disappeared and the distribution became essentiallyrandom: the IV (157 Na +) drink sodium content was at thesame level as that of the water-like drinks; V (19.6 Na + +
glucose), VII (Power Surge), and Ia (water). Sodiumcontents of the other two drinks (II and V'I) were just
slightly lower. At the end of exercise the plasma sodium
content had clearly stabilized at pre-exercise control
levels despite its wide range (0 to 157 mEq/liter) and the
presence of many other constituents in the various drinks.Thus, the attenuated decrease of PV at 70 min. of exercise
after consuming drinks 1I, IV, V and VI (fig. 2, lower
panel) was not related to plasma sodium content per se,
but more to plasma total osmotic content. It appears that
osmotic components other than sodium play an important
role in maintaining and enhancing PV during exercise.
9
312
310
_6" 308m o4
z 306E _
_o 304
E _ 3020
_.e 300298
296
294
292
10
_... 8=0_m o4 6
wo 2EEmo 0
< -2
-4
--6
m A
O_E_O_
t-m •
0m 0a.
16
12
-12
la ---_ Water + asp.
II ----e 19.6 Na + asp.
IV ----O 157 Na + asp.
Rest
--45--5 039 15 30
V _ 19.6 Na + glu.
Vl _ PerformanceVII _ Power surge
40 50 60
r
I70
Time (min)
Figure 5. Mean (#:SE) plasma osmolality, change in plasma osmolality, and percent change in plasma osmotic content
during the rest experimenL
10
.5::Eo_
0"5
_ 0-_E
m
0"I"E_
_ 0EE
m om
_.E
E_0'_
n.
310
308
306
304
302
300
298
296
294
292
290
288
8
6
4
2
0
-2
-4
0
-2
-4
-6
--8
-10
-12la --_ Water + asp.
II ---e 19.6 Na + asp.
V _ 19.6 Na + glu.
Vl _ Performance
_'_"_'_'_'_IV ----O 157 Na + asp. VII _ Power surgeiiiiii!iiiii!iii!i_iiii!i
_'_'_._'_'___" Exercise (supine) "-I I I I I I I
9 15 30 40 50 60 70
Time (min)
Figure 6. Mean (±SE) plasma osmolality, change inplasma osmolality, and percent change in plasma osmotic content
during the exercise experiment.
1]
168
... 166
_ 164
E 162
E160o 158M
a 156E¢0m 154
O.152 ±
la ---_ Water + asp.II ----e 19.6 Na + asp.
IV -_o 157 Na + asp.
V _ 19.6 Na + glu.Vl _-_ Performance
VII _ Power surge
iiiiiiiii!iiiiii_iii_i_- _:;.; Rest (sitting)___!i!ii!!!ih, i i i i i , ,
-45 :-5 0 3 9 15 30 40 50 60 70
Time (min)
Figure 7. Mean (d:SE) plasma sodium concentration, change in plasma sodium concentration, and percent change in
plasma sodium content during the rest experiment.
]2
-4
16
14
12
--45 0 3 9 15
V _ 19.6 Na + glu.
19.6 Na + asp. Vl _ Performance
157 Na + asp. VII -_) Power surge
Exercise (supine) ._"-I I I
30 40 50 60 70
Time (min)
Figure 8. Mean (_:SE) plasma sodium concentration, change in plasma sodium concentration, and percent change in
plasma sodium content during the exercise experiment.
13
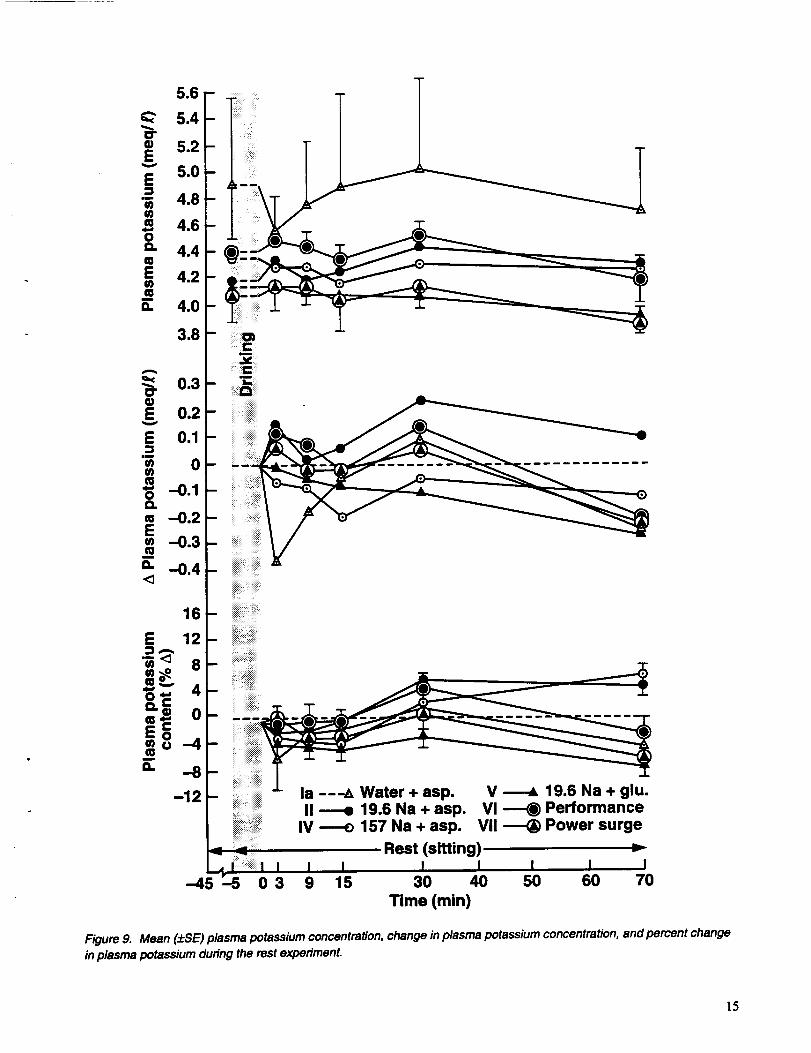
Plasma Potassium Concentration and Content
Unlike sodium, most body potassium is contained within
cells in the cellular fluid compartment. Changes in plasma
potassium content can reflect ion exchange between the
cellular and extracellular fluid compartments, as well as
the accompanying water movement. For example, an
increase in plasma potassium content could indicate
movement of potassium from cells to the extracellular
(vascular) space, and vice versa. Also, potassium is
present in plasma in much smaller concentrations than
sodium and therefore contributes significantly less to
plasma osmolality. An increase in potassium in the
extracellular fluid compamnent indicates a shift of
potassium from the cellular fluid compartment. Note
that potassium was present only in VI (Performance,5.01 mEqf2 liters) and VII (Power Surge,
2.51 mEq/2 liters).
Changes in plasma potassium concentration and content
during the rest experiment (fig. 9), similar to the plasma
sodium and osmotic responses, exhibited greater
variability than comparable responses during exercise
(fig. 10). Unlike plasma sodium and osmotic responses,
potassium content during the rest experiment remained
clustered around baseline (zero) at 70 rain. The slightly
depressed content from zero to 15 min. suggests that
during the rest experiment the potassium content
accompanied the fluid shift from the vascular space
(fig. 2, upper panel). Similar to changes in sodium and
osmotic contents, the IV (157 Na +) drink (containing no
K+) also had the greatest increase in potassium content
after 70 rain. of rest (fig. 9, lower panel). Adjacent to thedrink IV (157 Na +) value was the 11 (19.6 Na +) drink
value which also contained no potassium. Only drinks VI
(Performance) and VII (Power Surge) contained
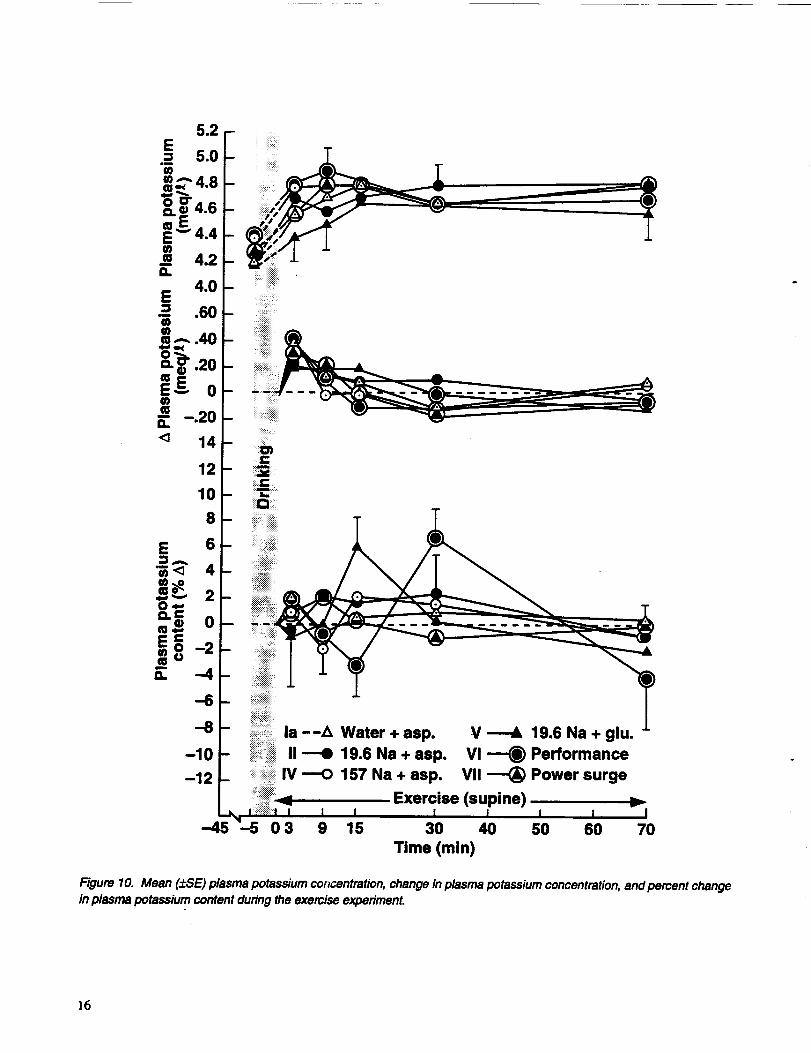
potassium. The general trend toward increasing plasmapotassium concentrations reflected the early hypovolemic
response during exercise (fig. I0, middle panel), although
potassium content remained essentially constant around
baseline (zero) (fig. I0, lower panel). The reason for the
large fluctuations in potassium content at 15 and
30 win. with drinks V (19.6 Na + + glucose) and VI
(Performance) is not clear; drink VI contained potassium
(5.01 meq/2 liters) although drink V did not. In contrast,drink VII (Power Surge) also contained potassium
(2.51 meq/2 liters) and its content pattern was essentially
unchanged over the 70 win. (fig. 10, lower panel).
With the exception of drinks II (19.6 Na +) and IV
(157 Na +) during the rest experiment, it does not appear
that an appreciable amount of potassium entered the
vascular space from the cellular space during either the
rest or the exercise experiment. This suggests that cellular
dehydration was minimal.
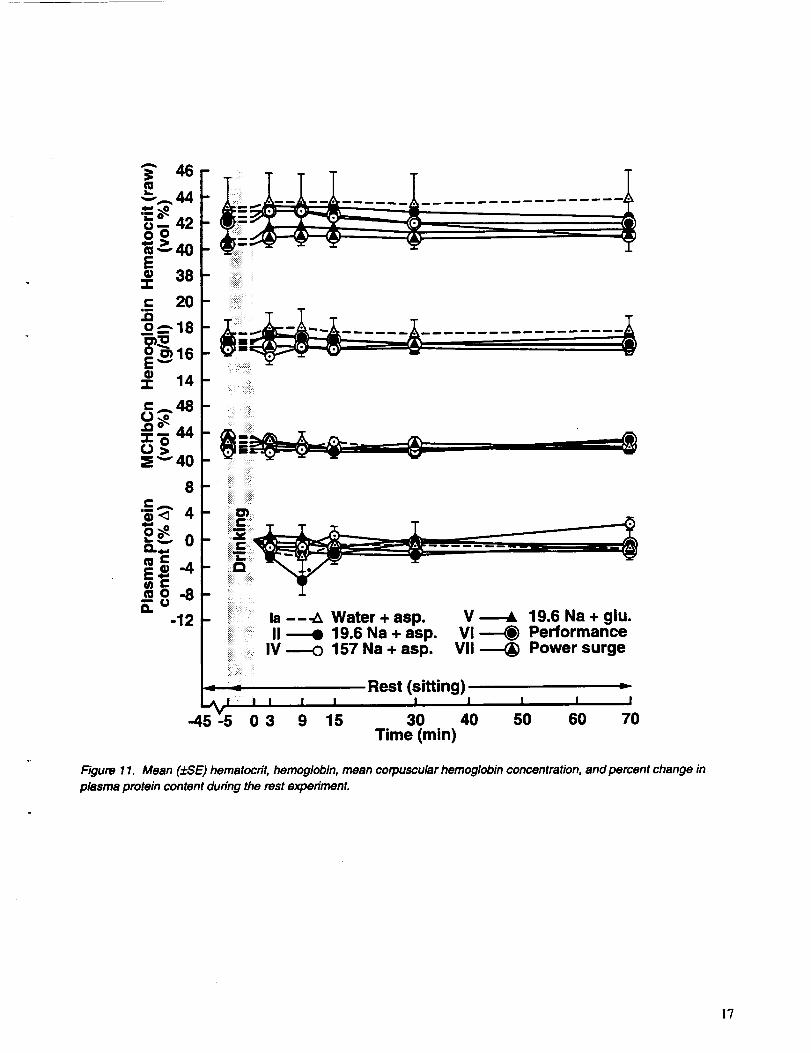
Plasma Protein Content and Hematology Variables
Raw (uncorrected) hematocrit (Hct), hemoglobin (lib),
mean corpuscular hemoglobin concentration (MCHbCn),
and percent change in plasma protein content (plasma
protein concentration x PV) are presented in figure 11
(rest) and figure 12 (exercise). The perturbations of therest Hot and Hb values (fig. 1 I) are reflected in the PV
data (fig. 2); with an Hot of 50%, a one percentage unit
change in Hct results in a 4% change in PV. All
MCHbCn, which indicate changes in blood cellular
volume (hydration), were essentially constant suggestingthat vascular fluid shifts occurred between the vascular
space and the interstitial space, and not into red blood
cells or other vascular constituents. There was a tendency
(NS) for plasma protein content elevation in the IV
(157 Na +) drink at 70 rain., but it was not appreciably
greater when compared to the other drinks. A higher
protein content, combined with the effect of the greatersodium content with the IV (157 Na +) drink, would
generally lead to retention of more plasma fluid.
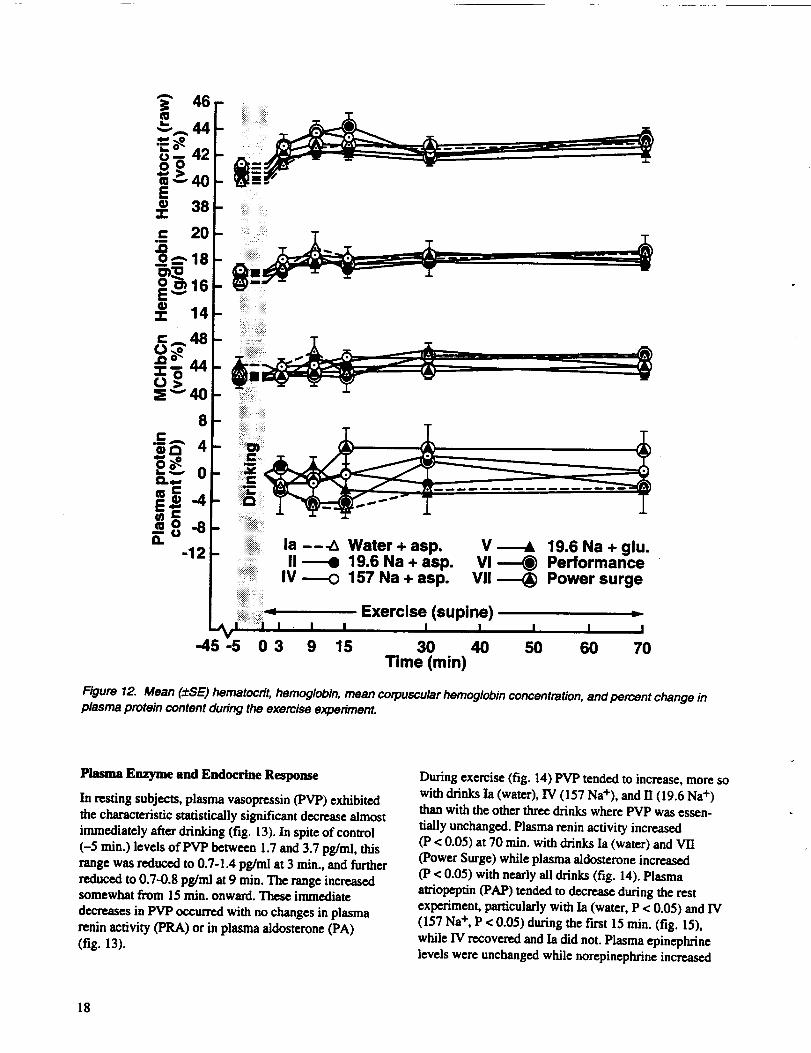
Compared with responses during the rest experiment, a
somewhat different pattern of responses was evident
during exercise (fig. 12). The Hot and Hb data showed
less variablity than the MCHbCn and protein content data.The trend toward increased Hot and Hb concentration
during the fast 15 rain. of exercise reflects the reduction
in plasma volume. Plasma protein content tended to behigher with the VI (Power Surge) and IV (157 Na +)drinks which could be the result of an actual increase in
protein content or, more likely, from a greater shift of
fluid to the interstitial space as indicated in figure 2 (lower
panel).
14
5.6
=e 5.2
E 5.0
•_ 4.84.6
4.4
_ 4.2
R" 4.0
3.8
16
la ---_ Water + asp. V _ 19.6 Na + glu.II ----e 19.6 Na + asp. VI _ Performance
IV ----e 157 Na + asp. VII -_ Power surge
Rest (sitting)I I I I I I
15 30 40 50 60 70
Time (rain)
Figure 9. Mean (_:SE) plasma potassium concentration, change in plasma potassium concentration, and percent change
in plasma potassium during the rest experiment.
15
5.2
.E 5.0
_' 4.8
_"_ 4.6
¢mE4. 4
. 4.2
E 4.0
._ .60
_., .40
0
<3 14
12
10
8
E 6.2=,-,co< 4m_
la __A Water + asp. V _ 19.6 Na + glu.
---e 19.6 Na + asp. VI _ Performance
IV --O 157 Na + asp. VII _ Power surge
Exercise (supine)I I I I I
0 3 9 15 30 40 50 60 70
Time (rain)
Figure 10. Mean (±SE) plasma potassium concentration, change in plasma potassium concentration, and percent change
in plasma potassium content during the exercise experiment.
16
44im
42
>40
_: 38
= 20
m
-!,. 14
¢ .... 48
_44
8_A
O_ -_._. u
E._4_C
o. u.12
- _iiiii!ii!ilililili!iiiiii_
iiiiiiiilmll
- ii!!i!i!!ili!ii!!i!ila--4 Water+asp. V_-_ 19.6 Na+glu.19.6 Na + asp. VI _ Performance157 Na + asp. VII _ Power surge
it---_
ii__ '_!iiii!i!ii!!!iii
i_!:iiiii!!!ii!¸
I I
9 15
Rest (sitting)
! I I I I I I-4 0 3 30 40 50 60 70Time (rain)
Figure 11. Mean (#:SE) hematocrit, hemoglobin, mean corpuscular hemoglobin concentration, and percent change in
plasma protein content during the rest experiment.
]?
!!i!ii!iiiiiiiiiiiiiiiiiii
38-
¢ 20 - T -_
o_---,18- . .-- . _
J 14-
8¢'A•_ 4
me"E_4fil e"_rag.8a.
-12
- ii
- iliiii!i_iiiiiiiiii!i....iiiiiiiiiiiiiiiii_i.i_
_i_!ii!i!i!iiii!iii!i!i?
!ii!iiiiiiiiii_iiiiiiiiii_I
.%,i!_!!_!!!ii!!i_,-,.-45 -5 0 3
la --_II
IV
Water + asp.19.6 Na + asp.157 Na + asp.
V _ 19.6 Na + glu.Vl _ Performance
VII -_ Power surge
Exercise (supine)I I I I I I I
9 15 30 40 50 60 70Time (rain)
Figure 12. Mean (d:SE) hematocrit, hemoglobin, mean corpuscular hemoglobin concentration, and percent change inplasma protein content during the exercise experiment.
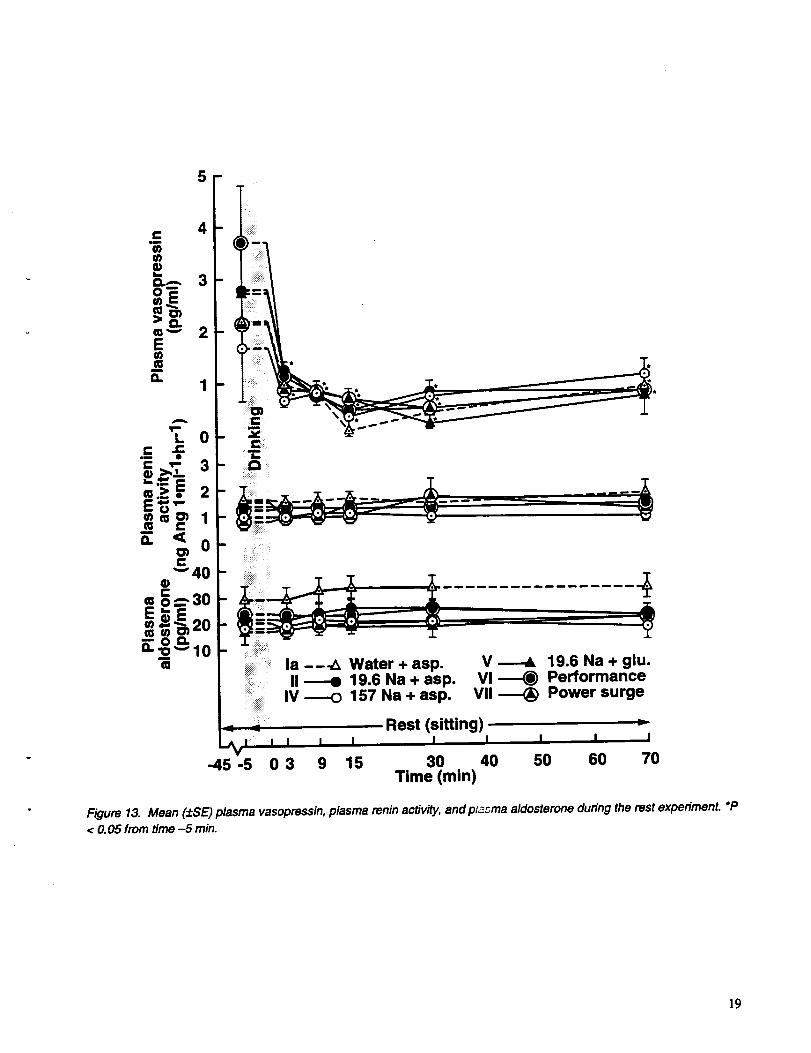
Plasma Enzyme and Endocrine Response
In resting subjects, plasma vasopressin (PVP) exhibited
the characterisdc stadsdcally significant decrease almost
immediately after drinking (fig. 13). In spite of control
(-5 rain.) levels of PVP between 1.7 and 3.7 pg/ml, this
range was reduced to 0.7-1.4 pg/ml at 3 rain., and further
reduced to 0.7-0.8 pg/ml at 9 rain. The range increasedsomewhat from 15 min. onward. Thvse immediate
decreases in PVP occurred with no changes in plasma
lenin acdvizy (PRA) or in plasma aldostemne (PA)(fig. 13).
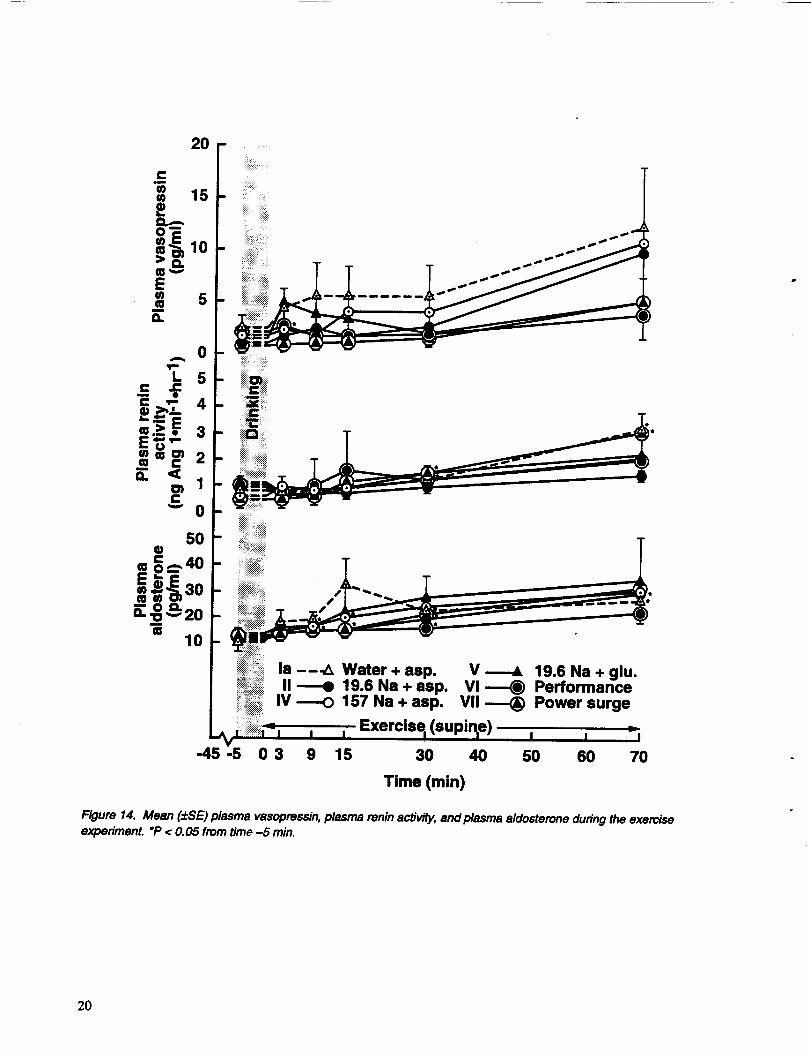
During exercise (fig. 14) PVP tended to increase, more so
with drinks Ia (water), IV (157 Na+), and II (19.6 Na +)than with the other three drinks where PVP was essen-
tially unchanged. Plasma renin activity increased
(P < 0.05) at 70 min. with drinks Ia (water) and VII(Power Surge) while plasma aldostemne increased
(P < 0.05) with nearly all drinks (fig. 14). Plasma
atriopepdn (PAP) tended to decrease during the rest
experiment, particularly with Ia (water, P < 0.05) and IV
(157 Na +, P < 0.05) during the in'st 15 min. (fig. 15),
while IV recovered and Ia did not. Plasma epinephrine
levels were unchanged while norepinephrine increased
18
0
Figure 13. Mean (±SE) plasma vasopressin, plasma renin activity, and p_sma aldosterone during the rest experiment. *P
< 0.05 from time-5 rain.
19
20
° 1o>Q.
Ecam 5
m.__._ 3
m ,- 2
C_" 0
50
Wi°.°X'.o _,_20
10
" i!ili!iii!!i!!i!!iii!!i!i.. iiiiiiiiiii!!_ii:
'_ -_1 W?_e_l;:aPp. V,V _----0 1performance9"6 Na+ glu.
-45 -5
IV -----0 157 Na + asp. VII ---_ Power surge
0 3 9 15 30 40 50 60 70
Time (min)
Figure 14. Mean (±SE) plasma vasopressin, plasma renin activity, and plasma aldostemne during the exerciseexperiment. °P < 0.05 from time -5 min.
2O
38
34P
=" 32
R" 24go
20
175
150
=e 125
10o
• 5O
25
s5om6_ A 450
_-_, 350--Q.Q.
o. _--- 250
o 150
ii:i:_:ii://i
iiiiiiiiii!!!i i!i!i i il
la --_ Water + asp.II _ 19.6 Na + asp.
IV ----O 157 Na + asp.
V _ 19.6 Na + glu.VI _-_ Performance
VII _ Power surge
Rest (sitting)=_I:::: I I I I I I I I I
-45 -5 0 3 9 15 30 40 50 60 70
Time (rain)
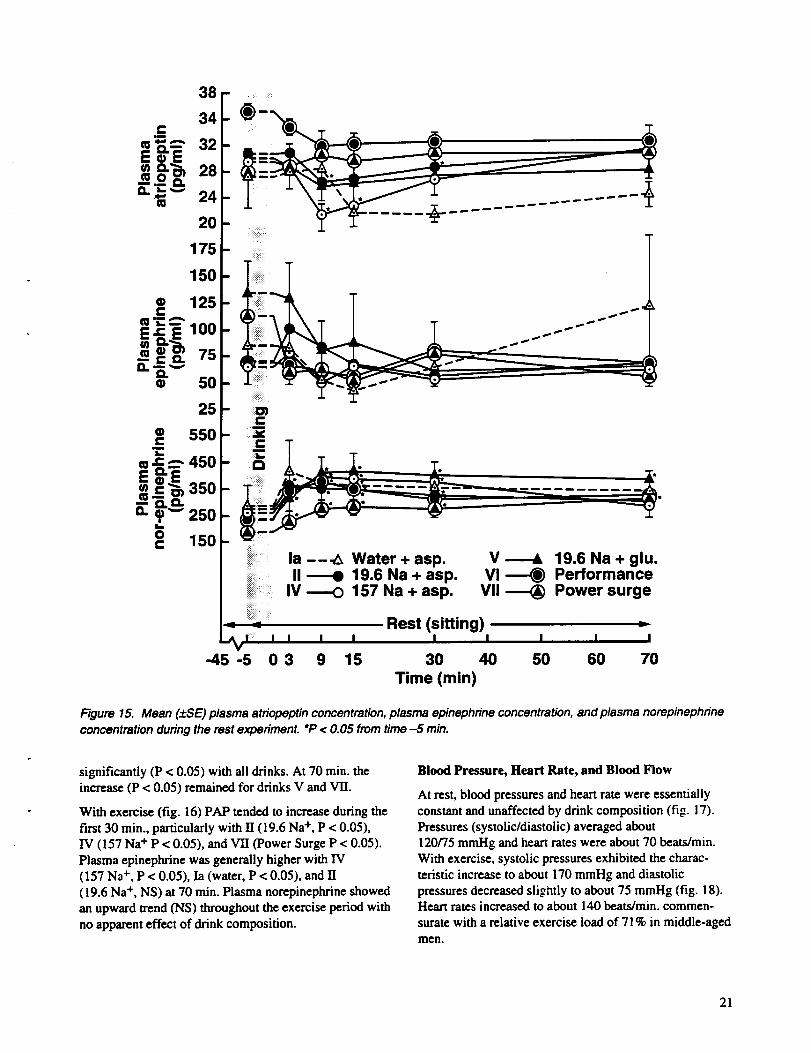
Figure 15. Mean (±SE) plasma atriopeptin concentration, plasma epinephrine concentration, and plasma norepinephrine
concentration during the rest experiment. °P < 0.05 from time-5 min.
significantly (P < 0.05) with all drinks. At 70 min. the
increase (P < 0.05) remained for drinks V and VII.
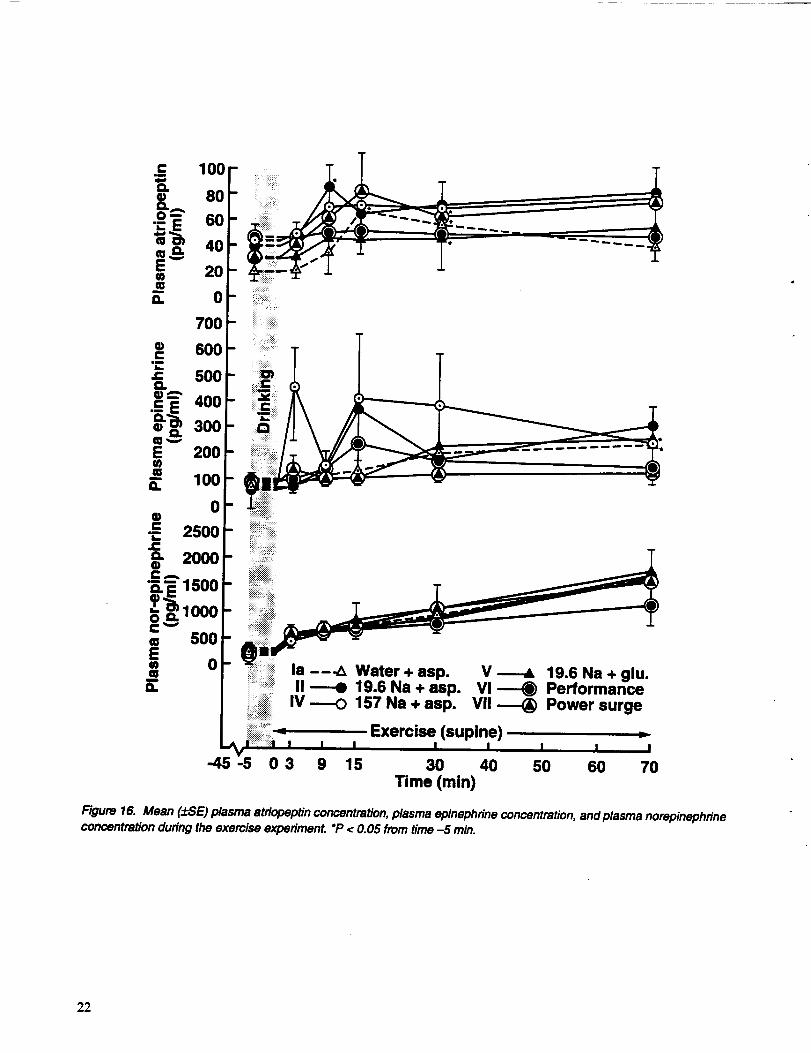
With exercise (fig. 16) PAP tended to increase during the
fwst 30 min., particularly with II (19.6 Na +, P < 0.05),
IV (157 Na + P < 0.05), and VII (Power Surge P < 0.05).
Plasma epinephrine was generally higher with IV
(157 Na +, P < 0.05), Ia (water, P < 0.05), and II
(19.6 Na +, NS) at 70 min. Plasma norepinephrine showed
an upward trend (NS) throughout the exercise period with
no apparent effect of drink composition.
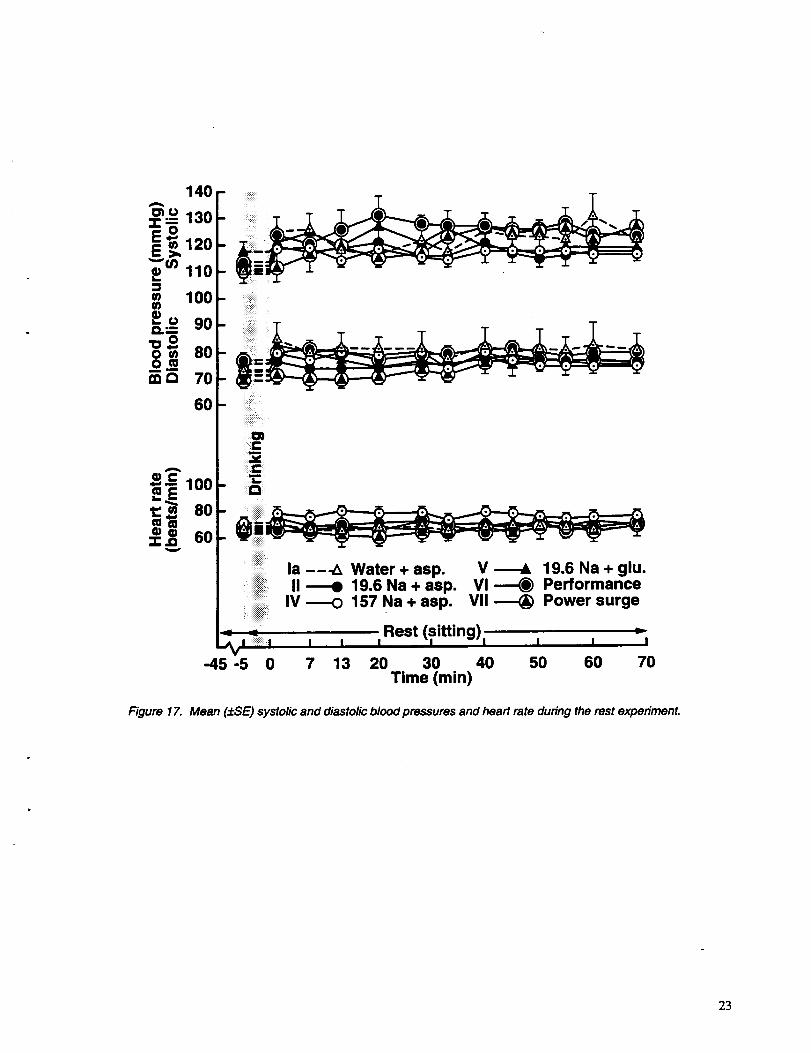
Blood Pressure, Heart Rate, and Blood Flow
At rest, blood pressures and heart rate were essentially
constant and unaffected by drink composition (fig. 17).
Pressures (systolic/diastolic) averaged about
120/75 mmHg and heart rates were about 70 beats/min.
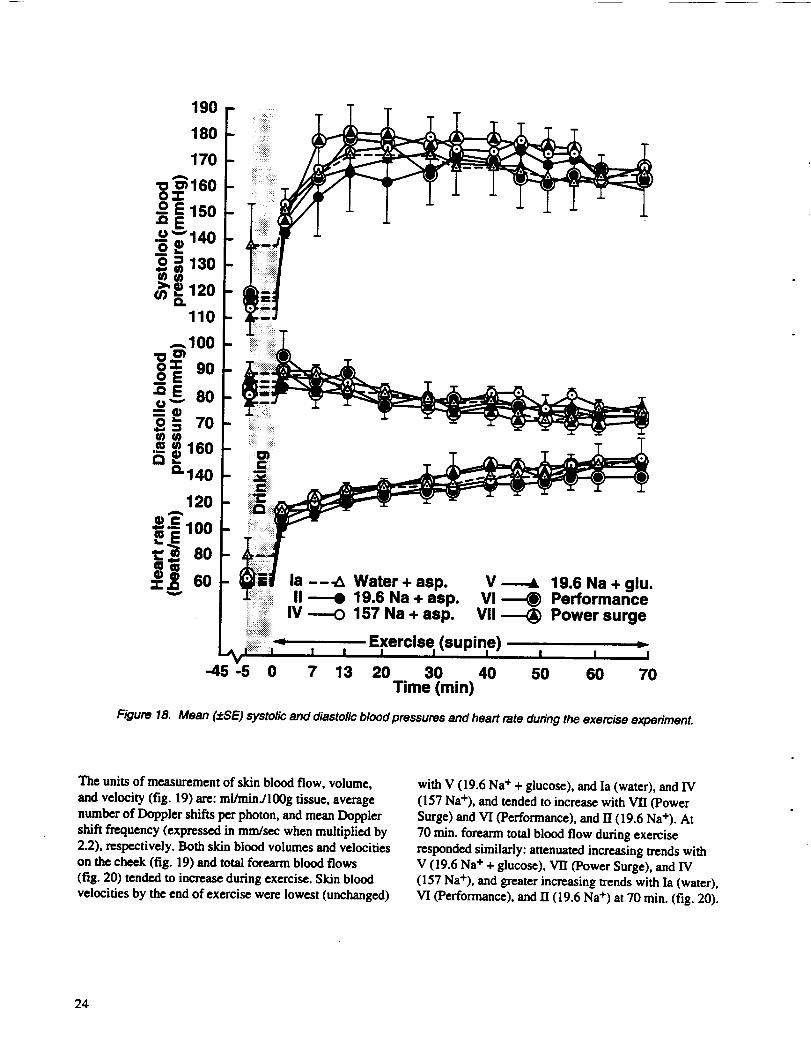
With exercise, systolic pressures exhibited the charac-
teristic increase to about 170 mmHg and diastolic
pressures decreased slightly to about 75 mmHg (fig. 18).Heart rates increased to about 140 beats/rain, commen-
surate with a relative exercise load of 71% in middle-aged
men.
21
700
Is --_ Water + asp.II ---e 19.6 Na + asp.
IV ----O 157 Na + asp.
V _ 19.6 Na + glu.VI _ Performance
Vii ---_ Power surge
Exercise (supine)
-45 0 3 9 15 30 40 50 60 70Time (rain)
Figure 16. Mean (_:SE) p/asma atriopeptin concentration, plasma epinephrine concentration, and plasma norepinephrine
concentration during the exercise experiment. *P < 0.05 from time -5 rnin.
22
== 100
_._o 90_•_ 0 _. .........O°o._5 70
6o>
C::.j¢"--
__1_fee __"=.......
_" _ 60 i
I la ---_ Water + asp. V _ 19.6 Na + glu.II -me 19.6 Na + asp. VI _ Performance
IV _ 157 Na + asp. VII _ Power surge
- Rest _-
-45 -5 0 7 13 20 30 40 50 60 70Time (min)
Figure 17. Mean (+SE) systolic and diastolic blood pressures and heart rate during the rest experiment.
23
190
180
170
"o_160oo E 150
""140
o = 130ww>,e 120
(no.
110
_,100
OE"_Eu_. 80=_
70160
c_ _-140
,_120
lO0
-45 -5
Figure 18. Mean (±SE) systolic and diastolic blood pressures and heart rate during the exercise experiment.
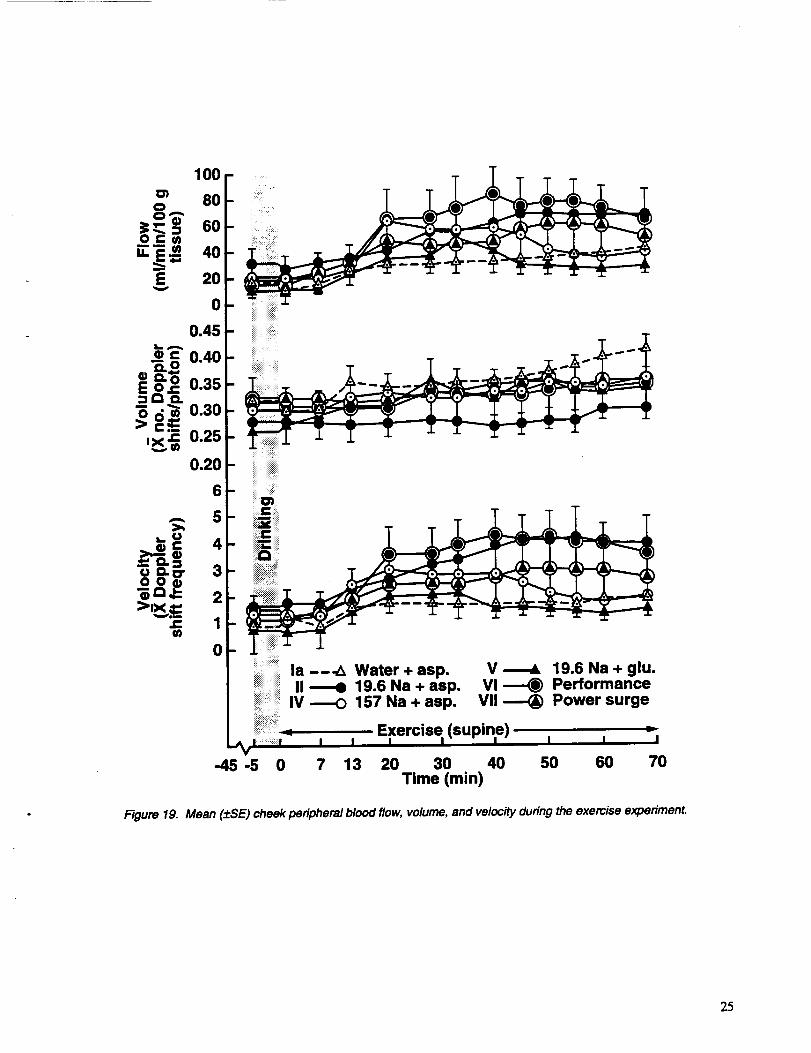
The units of measurement of skin blood flow, volume,
and velocity (fig. 19) are: ml/minJlOOg tissue, average
number of Doppler shifts per photon, and mean Doppler
shift frequency (expressed in mm/sec when multiplied by
2.2), respectively. Both skin blood volumes and velocities
on the cheek (fig. 19) and total forearm blood flows
(fig. 20) tended m increase during exercise. Skin blood
velocities by the end of exercise were lowest (unchanged)
with V (19.6 bia + + glucose), and Ia (water), and IV
(157 Na+), and tended to increase with VII (Power
Surge) and VI (Performance), and II (19.6 Na+). At
70 n'fin, forearm total blood flow during exercise
responded similarly: attenuated increasing trends with
V (19.6 Na + + glucose), VII (Power Surge), and IV(157 Na+), and greater increasing trends with Ia (water),
VI (Performance), and II (19.6 Na +) at 70 rain. (fig. 20).
24
O1o
j=_ = 60O e'- ¢n
,'i"_ 2040
0
0.45
100 - -
80 -
_" 0.40_.o
q) D."S o 0.35=QI_.
'_ d "_ 0.30> ,- ¢:_
,x_ 0.25
0.20
iiiii!iil;iil;;i=_:_:
iiii_i!:-i!i:ii
6
5
_cr 3__ua)_r_ 2
>'_ 1
0
- iiii!iiiiiiiili!ii!ii!iil
iiiii_i_i_i_i!_!iiiiiiii ....--!!i_iiii_i_iiiiiiiiiiii_ _,
,_iiiiiiiiiiiiiiiiiiiii_i, --- - - -
iii_iiii!iiiiiiiiiiiiiii_iiiiiiiiiiiiiiiiiiiiiiiiii_,
ii!i!ili!iiii_iiiiii!_,'iiiii_imiiii_iiii!ii_
" iiii_iiiiiiii
i!!!!_.-!i!i!illi!ili_iiiii!i!
la --_ Water + asp. V _ 19.6 Na + glu.II -me 19.6 Na + asp. VI _ Performance
! IV _ 157 Na + asp. VII _ Power surge
Exercise (supine)I I I I I I I
7 13 20 30 40 50 60 70Time (rain)
-45-5 0
Figure 19. Mean (#:SE) cheek peripheral blood flow, volume, and velocity during the exercise experiment.
25

.-. 120
w
= 100
o 80
E 6O
0
-o 41100.Q
E 2OL-
moL_
0u. 0
iiiiiiiii: i:
iiiiiii_i:_!!ii::_
_ !/i
iii!iii!iiii_ili'i!ii!ili_ii!ii!iiii!i!!ii!i!!!ii!ii_
- !!iiii!iii!ii!ii!i_i_i_i,i
!iii_i!i_iiii.iiiiiii!il_:iiiili
iiiiii!itc!ili!__iiiii_i_s.-.-_ i_i_i!
iiiiiiiiiii!:ii:!i_i_
i!iiiii!iiiii_:iii_iiiii
_iiiiiiiiiiii_iiiiiiii_iii_i_iiii!i!iliiii!iiiiiiiiiii
iiiiiiii!iiiiiiiiiiiiiiiiii
!i!iii!i!i!i!_i_!i!!ii!i!!iii_!iiii!iiiiiii_iii_i:_
la --._ Water + asp. V _ 19.6 Na + glu.II ----e 19.6 Na + asp. VI _ Performance
IV _ 157 Na + asp. VII -_ Power surge
Exercise (supine)I I _ I I
-45-5 0 7 13 20 30 40 50 60
Figure 20. Mean (:_SE) forearm total blood flow during the exercise experimenL
I
7O
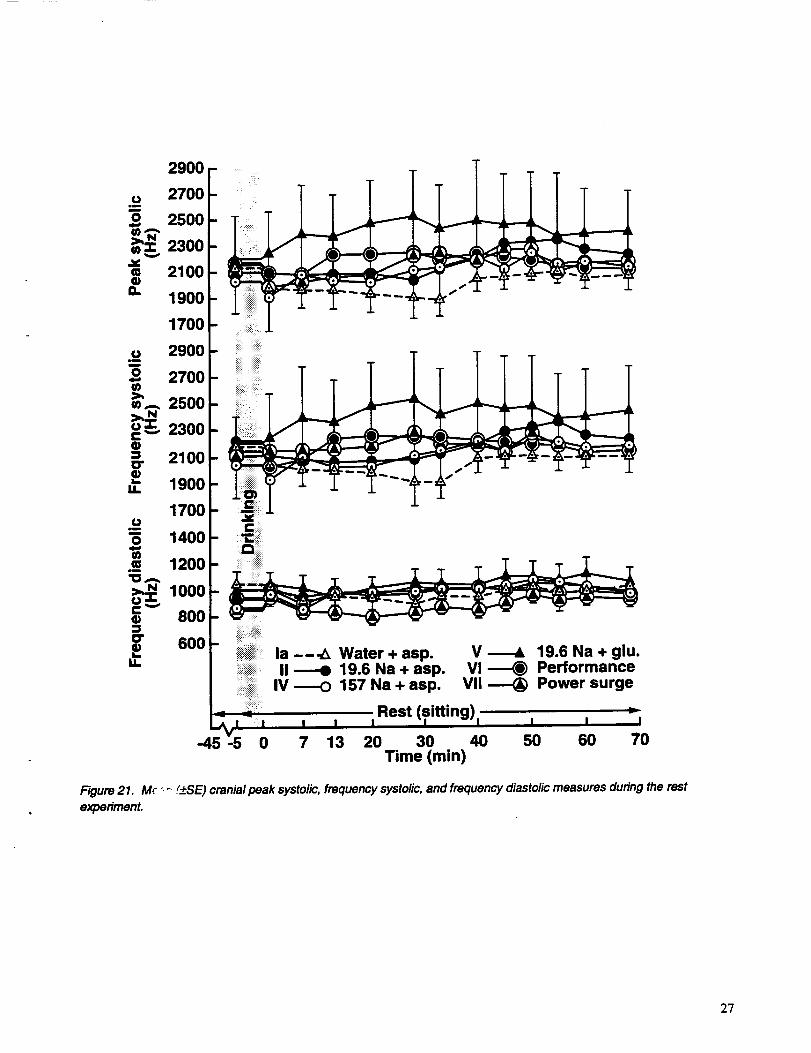
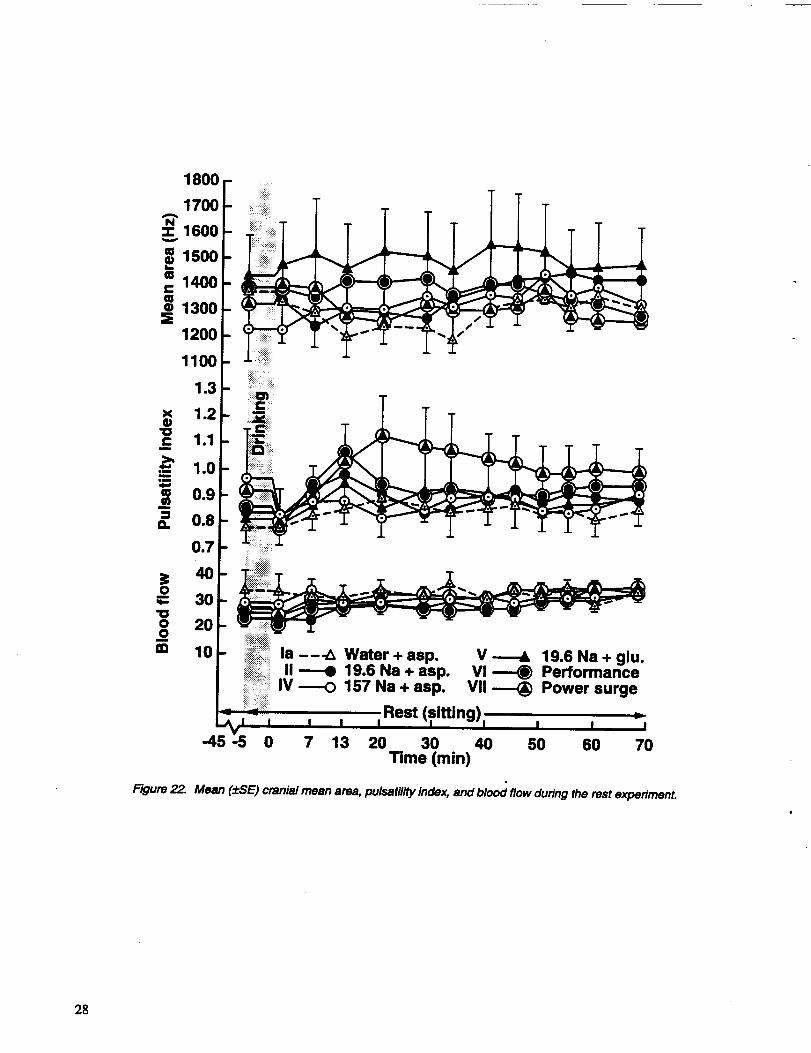
Middle Cerebral Arterial (MCA) Velocity Parameters(Resting Experiment)
Systolic frequency values were similar for the six drinks;
drink Ia was lower and drink V had the higher values.
Frequency diastolic values were essentially similar and
unchanged over the 70-min. resting period (fig. 21). Mean
area was generally lowest with drink Ia and highest withdrink V (fig. 22). Pulsafility index was greatest with drink
VII. MCA velocity was essentially constant varying from20 to35.
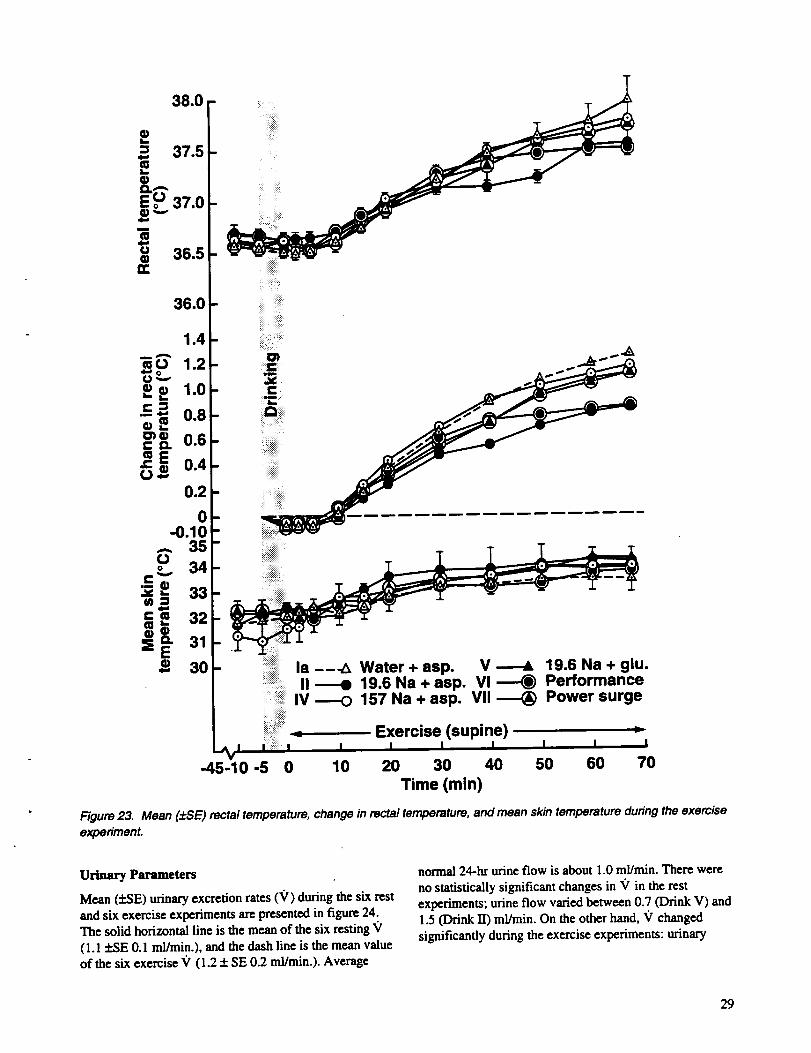
Body Temperatures
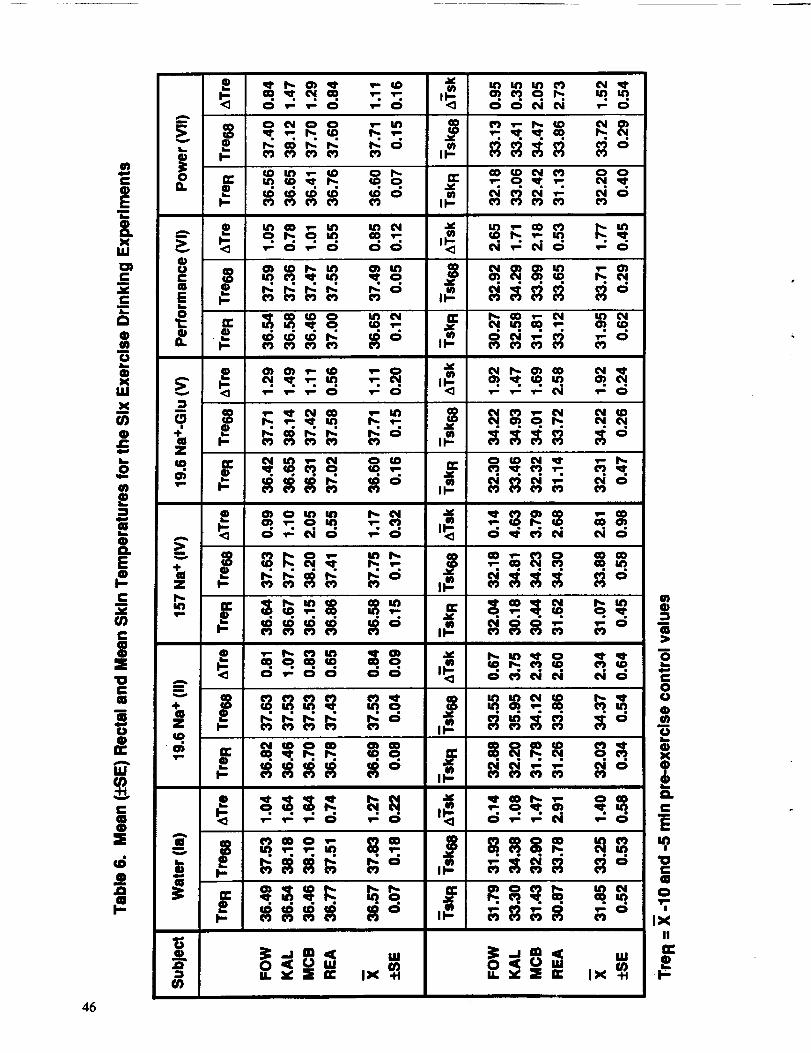
Rectal (Tre) and mean skin (Tsk) temperatures were
measured only during exercise (fig. 23). Rectal
temperatures exhibited the characteristic slight decline of
about 0.1 °(2 at the onset of exercise. Not all Tre (drinks Ia,
IV, VI, VII) had reached steady-state after 70 rain., due
perhaps to the supine position and inhibition of sweating
from the subject's back. There were no statistically
significant differences in Tre between la (water) and the
remaining drinks. With drinks II (19.6 Na +, Tie =
+0.84 + 0.09°C) and VI (Performance, ATre =
+0.85:1: 0.12°C), Tre appeared to reach steady-state andthese two drinks tended to attenuate (NS) the rise in rectal
temperature (table 6). Rectal temperature changes with theremaining drinks were: Ia (water, ATre = 1.27 + 0.22°C),
IV (157 Na +, ATre = 1.17:1: 0.32°C), V (19.6 Na + +
glucose, ATre = 1.11 :!:0.20°C), and VII (Power Surge,
Tre = 1.11 + 0.16°C). Mean skin temperatures increasedby 1.40°C to 2.81°C (table 6) because air motion was low.
26
2900 r"
u 2700 I-
_" 21oo]-_" 19oo_
1700 ]-
u 2900 I-
o ,,oop2700 _-
_ _oo_:" 21oo_
19oo_o 1700]-
1400 I-_ 1200 -
-1000--, 800 -13"OIm
IJ.,
!iii!iiiiiiiiii:ii;_:_r!!!!i!i_iiiiiiiiiiii,iiiill
600 - Liii_iiiii_iiiiiiiii!illa --._ Water + asp. V _ 19.6 Na + glu.I II ---e 19.6 Na + asp. VI _ Performance
IV ---<) 157 Na + asp. VII _ Power surge
oo;oTime (rain)
Figure 21. Mc "_ (+._SE)cranial peak systolic, frequency systolic, and frequency diastolic measures during the rest
experiment.
2'7
1800 -
1700
_.1600
m 1500.=m 1400=._ 1300
1200
1100
1.3
1.2_ 1.1
_ 1.0
_ 0.90.8
0.7
_ 4110
30'0o 20om 10
/
la --_ Water + asp. V _ 19.6 Na + glu.II _ 19.6 Na + asp. VI _ Performance
!i:i_i!! IV _ 157 Na + asp. VII _ Power surge
.__ Rest (sitting)-45:5'0713 20 30 40 50 60 70
Time (min)
Figure 22. Mean (±SE) cranial mean area, pulsatility index, and blood flow during the rest experiment.
28
38.0
.o
37.5
_ 36.5n-
36.0
1.4!
"_" 1.214d
o°....a) 1.0
_ 0.8
o.6
0.2
0-0.10
A 35
o_ 34
32c[ 31le
Q 30
-_V I-45-10 -5 0 10
la --_ Water + asp.II -_e 19.6 Na + asp.
IV ---O 157 Na + asp.
!!i'_iii!i_ pi )..... Exercise (su neli:,, ,I I
V .-.-&vI _-_vii ---_
19.6 Na + glu.PerformancePower surge
I I I I I I
20 30 40 50 60 70
Time (min)
Figure 23. Mean (_-SE) rectal temperature, change in recta/temperature, and mean skin temperature during the exercise
experimenL
Urinary Parameters
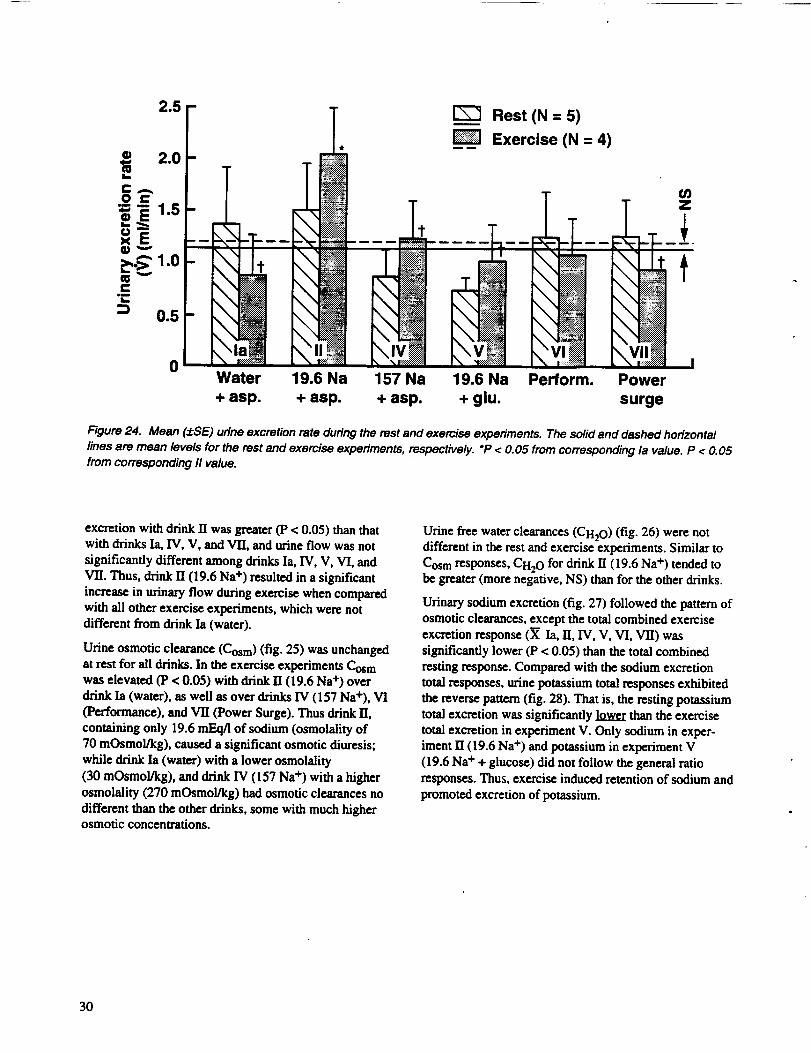
Mean (:I:SE) urinary excretion rates ('v') during the six rest
and six exercise experiments are presented in figure 24:The solid horizontal line is the mean of the six resting V
(1.1 +_qE 0.1 ml/min.), and the dash line is the mean valueof the six exercise _r (1.2 + SE 0.2 ml/min.). Average
normal 24-hr urine flow is about 1.0 ml/min. There were
no statistically significant changes in _" in the rest
experiments; urine flow varied between 0.7 (Drink V) and
1.5 (Drink IT) ml/min. On the other hand, V changed
significantly during the exercise experiments: urinary
29
2.5
2.0
_ 1.5
0_
1.oc
0.5
0Water
+ asp.
[_ Rest (N = 5)
Exercise (N = 4)
,19.6 Na 157 Na 19.6 Na Perform. Power
+ asp. + asp. + glu. surge
Figure 24. Mean (d:SE) urine excretion rate during the rest and exercise experiments. The solid and dashed horizontal
lines are mean levels for the rest and exercise experiments, respectively. *P < 0.05 from corresponding la value. P < 0.05from corresponding II value.
excretion with drink II was greater (P < 0.05) than thatwith drinks Ia, IV, V, and VII, and urine flow was not
significantly different among drinks la, IV, V, VI, and
VII. Thus, drink II (19.6 Na +) resulted in a significant
increase in urinary flow during exercise when comparedwith all other exercise experiments, which were not
different from drink Ia (water).
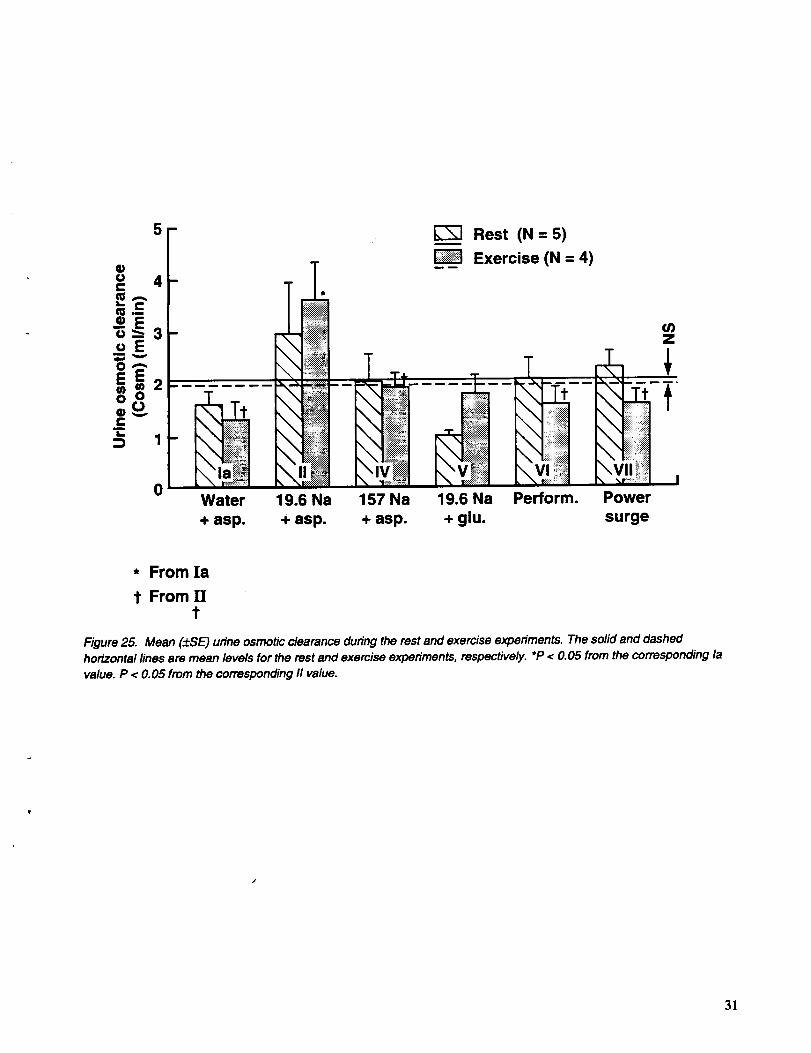
Urine osmotic clearance (Cosm) (fig. 25) was unchanged
at rest for all drinks. In the exercise experiments Cosm
was elevated (p < 0.05) with drink II (19.6 Na +) over
drink Ia (water), as well as over drinks IV (157 Na+), VI
('Performance), and VII (Power Surge). Thus drink H,
containing only 19.6 mEq/l of sodium (osmolality of
70 mOsmol/kg), caused a significant osmotic diuresis;
while drink Ia (water) with a lower osmolality
(30 mOsmol/kg), and drink IV (157 Na +) with a higher
osmolality (270 mOsmol/kg) had osmotic clearances no
different than the other drinks, some with much higherosmotic concentrations.
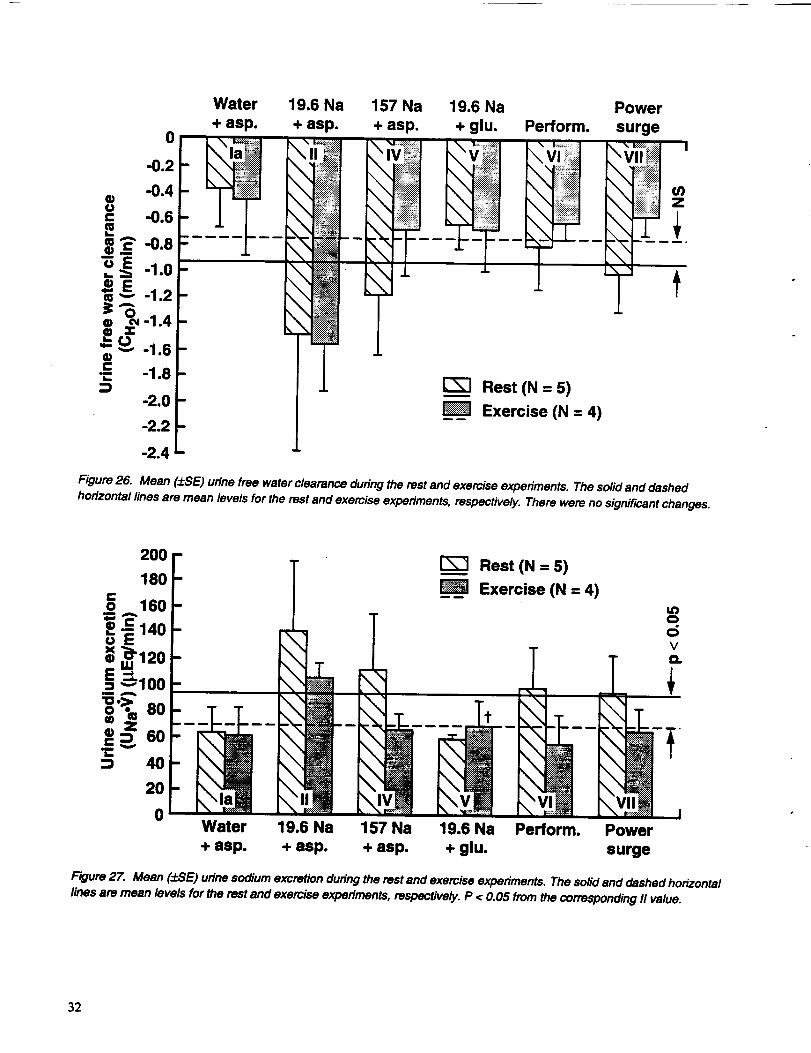
Urine free water clearances (CH20) (fig. 26) were notdifferent in the rest and exercise experiments. Similar to
Cosm responses, CH20 for drink H (19.6 Na +) tended tobe greater (more negative, NS) than for the other drinks.
Urinary sodium excretion (fig. 27) followed the pattern of
osmotic clearances, except the total combined exercise
excretion response (_ Ia, II, IV, V. VI, VII) was
significantly lower (p < 0.05) than the total combined
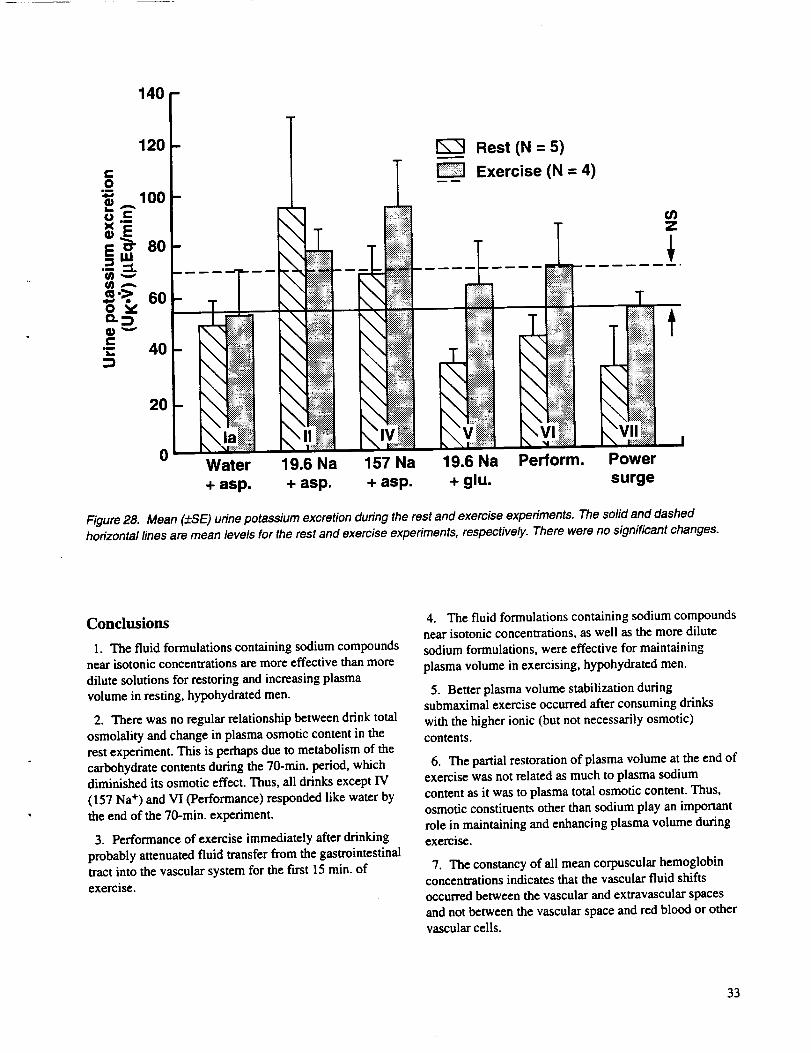
resting response. Compared with the sodium excretion
total responses, urine potassium total responses exhibited
the reverse pattern (fig. 28). That is, the resting potassiumtotal excretion was significantly lower than the exercise
total excretion in experiment V. Only sodium in exper-
iment II (19.6 Na +) and potassium in experiment V
(19.6 Na + + glucose) did not follow the general ratio
responses. Thus, exercise induced retention of sodium and
promoted excretion of potassium.
3O
5
4
_E
o
im
0
-mWater
+ asp.
T
Rest (N = 5)
Exercise (N = 4)
19.6 Na 157 Na 19.6 Na Perform. Power
+ asp. + asp. + glu. surge
* From Ia
t From IIt
Figure 25. Mean (±SE) urine osmotic clearance during the rest and exercise experiments. The solid and dashedhorizontal lines are mean levels for the rest and exercise experiments, respectively. "P < 0.05 from the corresponding la
value. P < 0.05 from the corresponding II value.
31
0
-0.2
-0,4
-0.6_'£ -0.8
"6 _ -1.0i,._.
eE= _ -1.2
® £-1.4"- _ -1.6o
N -1.8
-2.0
-2.2
-2.4
Water 19.6 Na 157 Na 19.6 Na Power
+ asp. + asp. + asp. + glu. Perform. surge
\
I
Rest (N = 5)
Exercise (N = 4)
Z
Figure 26. Mean (±SE) urine free water clearance during the rest and exercise experiments. The solid and dashed
horizontal lines are mean levels for the rest and exercise experiments, respectively. There were no significant changes.
200 [" T Rest (N = 5)
_ A160E180 / _ Exercise (N = 4) =
o° of °_'> en .........
=-==.o ...... .... ' .... i5 40
20
0 IWater 19.6 Na 157 Na 19.6 Na Perform. Power
+ asp. + asp. + asp. + glu. surge
Rgure 27. Mean (#:SE) urine sodium excretion during the rest and exercise experiments. The solid and dashed horizontal
lines are mean levels for (he rest and exercise experiments, respect/ve/y. P < 0.05 from the corresponding II value.
32
140 -
120
8..,100
o.C
800 vQ-:3
v
r-•= 40
2O
0
TI
I
Water 19.6 _la
Rest (N = 5)
Exercise (N = 4)
+ asp. + asp. surge
Figure 28. Mean (_:SE) urine potassium excretion during the rest and exercise experiments. The solid and dashed
horizontal lines are mean levels for the rest and exercise experiments, respectively. There were no significant changes.
Conclusions
I. The fluid formulations containing sodium compoundsnear isotonic concentrations are more effective than more
dilute solutions for restoring and increasing plasma
volume in resting, hypohydrated men.
2. There was no regular relationship between drink total
osmolality and change in plasma osmotic content in the
rest experiment. This is perhaps due to metabolism of thecarbohydrate contents during the 70-rain. period, which
diminished its osmotic effect. Thus, all drinks except IV
(157 Na +) and VI (Performance) responded like water by
the end of the 70-rain. experiment.
3. Performance of exercise immediately after drinking
probably attenuated fluid transfer from the gastrointestinal
tractintothevascularsystem forthefirst15min.of
exercise.
4. The fluid formulations containing sodium compoundsnear isotonic concentrations, as well as the more dilute
sodium formulations, were effective for maintaining
plasma volume in exercising, hypohydrated men.
5. Better plasma volume stabilization duringsubmaximal exercise occurred after consuming drinks
with the higher ionic (but not necessarily osmotic)contents.
6. The partial restoration of plasma volume at the end ofexercise was not related as much to plasma sodium
content as it was to plasma total osmotic content. Thus,
osmotic constituents other than sodium play an important
role in maintaining and enhancing plasma volume duringexercise.
7. The constancyof all mean corpuscularhemoglobin
concentrationsindicatesthatthevascularfluidshifts
occurredbetween thevascularand extravascularspaces
and notbetween thevascularspaceand redblood orother
vascularcells.
33
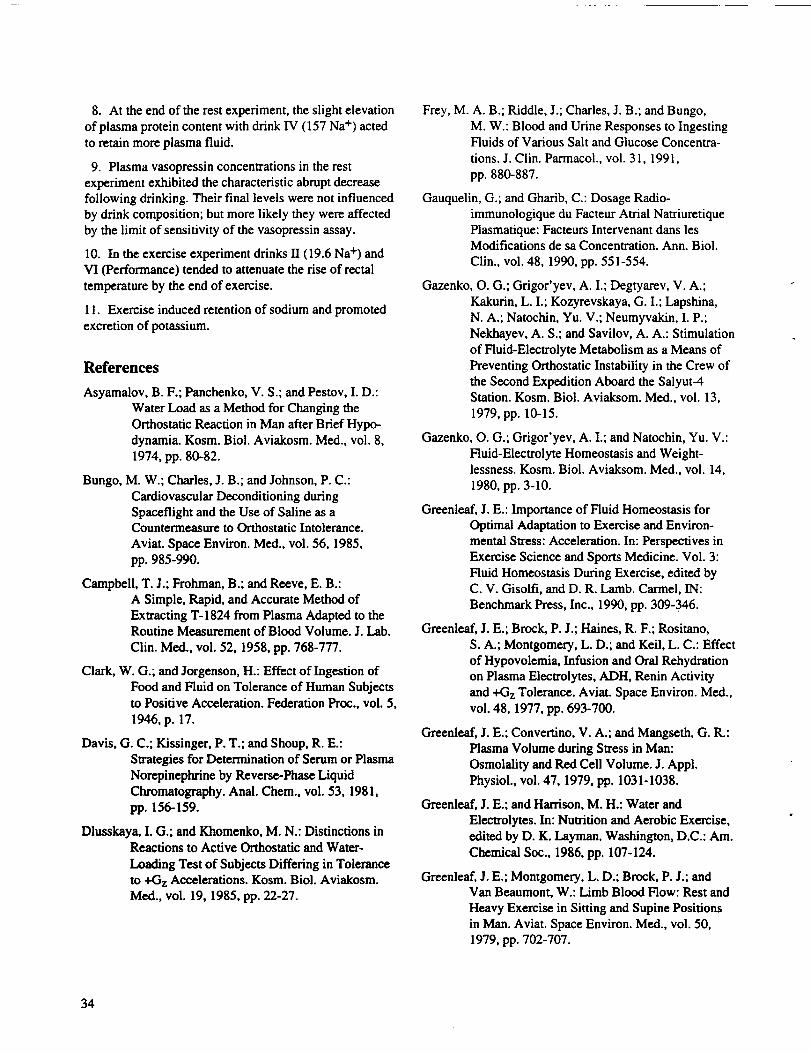
8. At the end of the rest experiment, the slight elevation
of plasma protein content with drink IV (157 Na +) acted
to retain more plasma fluid.
9. Plasma vasopressin concentrations in the rest
experiment exhibited the characteristic abrupt decrease
following drinking. Their final levels were not influenced
by drink composition; but more likely they were affected
by the limit of sensitivity of the vasopressin assay.
10. In the exercise experiment drinks 11 (19.6 Na +) and
VI (Performance) tended to attenuate the rise of rectal
temperature by the end of exercise.
11. Exercise induced retention of sodium and promoted
excretion of potassium.
References
Asyamalov, B. F., Panchenko, V. S., and Pestov, I. D.:
Water Load as a Method for Changing the
Orthostatic Reaction in Man after Brief Hypo-
dynamia. Kosm. Biol. Aviakosm. Med., vol. 8,
1974, pp. 80-82.
Bungo, M. W.; Charles, J. B.; and Johnson, P. C.:
Cardiovascular De.conditioning during
Spaceflight and the Use of Saline as aCountermeasure to Orthostatic Intolerance.
Aviat. Space Environ. Med., vol. 56, 1985,
pp. 985-990.
Campbell, T. J.; Frohman, B.; and Reeve, E. B.:
A Simple, Rapid, and Accurate Method of
Extracting T-1824 from Plasma Adapted to theRoutine Measurement of Blood Volume. J. Lab.
Clin. Med., vol. 52, 1958, pp. 768-777.
Clark, W. G.; and Jorgenson, H.: Effect of Ingestion ofFood and Fluid on Tolerance of Human Subjects
to Positive Acceleration. Federation Proc., vol. 5,
1946, p. 17.
Davis, G. C.; Kissinger, P. T.; and Shoup, R. E.:
Strategies for Determination of Serum or Plasma
Norepinephrine by Reverse-Phase Liquid
Chromatography. Anal. Chem., vol. 53, 1981,
pp. 156-159.
Dlusskaya, I. G.; and Khomenko, M. N.: Distinctions inReactions to Active Orthostatic and Water-
Loading Test of Subjects Differing in Tolerance
to +G z Accelerations. Kosm. Biol. Aviakosm.
Med., vol. 19, 1985, pp. 22-27.
Frey, M. A. B.; Riddle, J.; Charles, J. B.; and Bungo,
M. W.: Blood and Urine Responses to IngestingFluids of Various Salt and Glucose Concentra-
tions. J. Clin. Parrnacol., vol. 31, 1991,
pp. 880-887.
Gauquelin, G.; and Gharib, C.: Dosage Radio-
immunologique du Facteur Atrial Natriuretique
Plasmatique: Facteurs Intervenant dans lesModifications de sa Concentration. Ann. Biol.
Clin., vol. 48, 1990, pp. 551-554.
Gazenko, O. G.; Grigor'yev, A. I.; Degtyarev, V. A.;
Kakurin, L. I.; Kozyrevskaya, G. I.; Lapshina,
N. A.; Natochin, Yu. V.; Neumyvakin, I. P.;
Nekhayev, A. S.; and Savilov, A. A.: Stimulation
of Fluid-Electrolyte Metabolism as a Means of
Preventing Orthostatic Instability in the Crew of
the Second Expedition Aboard the Salyut-4Station. Kosm. Biol. Aviaksom. IVied., vol. 13,
1979, pp. 10-15.
Gazenko, O. G.; Grigor'yev, A. I.; and Natochin, Yu. V.:
Fluid-Electrolyte Homeostasis and Weight-lessness. Kosm. Biol. Aviaksom. Med., vol. 14,
1980, pp. 3-10.
Greenleaf, J. E.: Importance of Fluid Homeostasis for
Optimal Adaptation to Exercise and Environ-
mental Stress: Acceleration. In: Perspectives in
Exercise Science and Sports Medicine. Vol. 3:
Fluid Homeostasis During Exercise, edited byC. V. Gisolfi, and D. R. Lamb. Carmel, IN:
Benchmark Press, Inc., 1990, pp. 309-346.
Greenleaf, J. E.; Brock, P. J.; Haines, R. F.; Rositano,
S. A.; Montgomery, L. D.; and Keil, L. C.: Effectof Hypovolemia, Infusion and Oral Rehydration
on Plasma Electrolytes, ADH, Renin Activity
and +Gz Tolerance. Aviat. Space Environ. Med.,
vol. 48, 1977, pp. 693-700.
Greenleaf, J. E.; Convertino, V. A.; and Mangseth, G. R.:
Plasma Volume during Stress in Man:Osmolality and Red Cell Volume. J. Appl.
Physiol., vol. 47, 1979, pp. 1031-1038.
Greenleaf, J. E.; and Harrison, M. H.: Water and
Electrolytes. In: Nutrition and Aerobic Exercise,
edited by D. K. Layman. Washington, D.C.: Am.
Chemical Soc., 1986, pp. 107-124.
Greenleaf, J. E.; Montgomery, L. D.; Brock, P. J.; andVan Beaumont, W.: Limb Blood Flow: Rest and
Heavy Exercise in Sitting and Supine Positions
in Man. Aviat. Space Environ. Med., vol. 50,1979, pp. 702-707.
34
Greenleaf, J. E.; van Beaumont, W.; Bernauer, E. M.;
Haines, R. F.; Sandier, H.; Staley, R. W.; Young,
H. L.; and Yusken, J. W.: Effects of Rehydration
on +G z Tolerance after 14 Days' Bed Rest.
Aerospace Med., vol. 44, 1973, pp. 715-722.
Greenleaf, J. E.; and Williams, B. A.: Thermistor Holder
for Skin Temperature Measurements.U.S. Patent 3,983,753, 1976.
Grigor'yev, A. I.: Correction of Changes in Fluid-
Electrolyte Metabolism in Manned SpaceFlights. Aviat. Space Environ. Med., vol. 54,
1983, pp. 318-323.
Grigor'yev, A. I.; Katkovskiy, B. S.; Savilov, A. A.;
Georgiyevskiy, V. S.; Dorokhova, B. R.; and
Mikhayiov, V. M.: Effects of Hyperhydration onHuman Endurance of Orthostatic and LBNP
Tests. Kosm. Biol. Aviakosm. Med., vol, 12,
1978, pp. 20-24.
Hardy, J. D.; and DuBois, E. F.: The Technique of
Measuring Radiation and Convection. J. Nutr.,
vol. 15, 1938, pp. 461-475.
Hinghofer-Szalkay, H., and Greenleaf, J. E.: Continuous
Monitoring of Blood Volume Changes in
Humans. J. Appl. Physiol., vol. 63, 1987,pp. 1003-1007.
Hyatt, K. H.; and West, D. A.: Reversal of Bedrest-
Induced Orthostatic Intolerance by Lower Body
Negative Pressure and Saline. Aviat. Space
Environ. Med., vol. 48, 1977, pp. 120-124.
Johnson, P. C.: Fluid Volume Changes Induced by Space
Hight. Acta Astronautica, vol. 6, 1979,
pp. 1335-1341.
Kakurin, L. I.; Katkovskiy, B. S.; Tishler, V. A.;
Kozyrevskaya, G. I.; Shashkov, V. S.;
Georgiyevskiy, V. S.; Grigor'yev, A. I.;
Mikhaylov, V. M.; Anashkin, O. D.; Machinskiy,G. V.; Savilov, A. A.; and Tikhomirov, Ye. P.:
Substatiation of a Set of Preventive Measures
Referable to the Objectives of Mission in the
Salyut Orbital Station. Kosm. Biol. Aviakosm.
Med., vol. 12, 1978, pp. 20-27.
Keil, L. C.; and Severs, W. B.: Reduction in Plasma
Vasopressin Levels of Dehydrated Rats follow-
ing Acute Stress. Endocrinology, vol. 100, 1977,pp. 30-38.
Kokova, N. I.: Effect of Fluid and Salt Supplements toFood Allowance on Endurance of Head-to-Pelvis
Accelerations following 7-Day "Dry" Immersion
and under Ordinary Motor Activity Conditions.Kosm. Biol. Aviakosm. Med., vol. 18, 1984,
pp. 33-37.
Kotovskaya, A. R.; Baranski, S.; Gembizka, D.;
Voitkowjak, M.; Vii-Vilyams, I. F.; and Kokova,
N. I.: Improvement of Human Tolerance to
Head-Pelvis (+Gz) Accelerations by Increasing
Hydration. Kosm. Biol. Aviakosm. Med.,
vol. 21, 1987, pp. 14-18.
Kratky, O.; Leopold, H.; and Stabinger, H.:
Dichtemessung an Flussigkeiten und Gasen auf10--6 g/cm 3 bei 0,6 cm 3 Probenvolumen. Z.
Angew. Physik, vol. 27, 1966, pp. 273-277.
Nicogossian, A. E.; and Parker, J. F., Jr.: Space
Physiology and Medicine. Washington, D.C.:
U.S. Government Printing Office, 1982. 324 p.(NASA SP--447).
35
...- U)'--
-om ._oo
L r" r- _
.0 _, (I)
'r
_0 -- m 0
o
o't:
Or-
"_ (1)"0 (1)
• I=- __
o
of,-a
E
0"_o
-, 8n-o t-
e- t'- __._ .o o
-.e'_
-_E
_0 0
0 "._
_-e- i_ E
0 ,-- _..0 0"0
"_ if) _'10"_0,, -
<o _'_ ,, __
---'2
._©
36
O.
-- _ --z:_mz
"0 _ 0•r- O_ _ _ *"
i,- ffl
Z
•._ . "o__o _
"n "_: o =
_ _ ._ .__-_ __> :__0 ._ .o 0 _[ m m
e-co o
(D
"Io
0
"o .0
o
Q_o_
8_ 2 _
_-'E co=$
o.A o
, :3
60 e-
3?
"t3._' r-
13 (_
r- 0
._o0
>','Io
j_ •
o
"_ m om
_- m.._>0r0 Q.. "_ 0
®.6
_ r-
o_E_.- L_ .0
__o
QO Q)_-c_F- ._c> --_
38
0 _
r_.O
"10 ¢n0
; _,-. ¢,-0_"_C: 0
--_"0 ,,-.
!0 _
uc a) o
_) 0 o 0
t3. r"m -m o _=
._ _ _,_"_-_
•.-, Q)
_-o _- _-_r- .__0O_ 0 U)
•.--o_ _- = ,,_-,_ .
-o_o
(..5 A "0 ,
,9.o
"I0 0
39
4O
.,-,_O or-:,_
or- +_oID
"" C
0.,.,
o o_
_ m
+1-_"
*C3l'-
O'.-"O
"10.-,e- l_l
.o ____
N i__ ,,,--'
C0_-I- o. _
(i) 'mo__->,e-
(D _ "IOO
z2e
0 d .-._..q) '10 >.,
i_ lID r" (I)
v • I
C ... e- _)
"O._ >,m'_-O ,
_ I_ _ _
• "5) _) _+"
1_. I1.
0 _COIOo._ d c_
_m
m E=_
e" O ID.O _:
,> ,
_ _ _._- m
o®__m_o.-
"_ .__
OJ
&o_6=..
_._o _-__ .q o _>, --_ _ o
I .- ___o._=
_Sx>,_ 0_._ _ _) _-
: _-_ : =_._.__
, o ,,- o d ,,-r_ _'_" _ _ +
' 6.,::.__. -_ 6,(_9 .... :l=: .0 _)
S®_:=
,;-_©
_'_8_
41
t.0
_.o.q
42
in in14"1(_ (D
.-. ,,
u_ _o00c_©_0__ CO CO ":00000"%. OClDO OlD
.,,,-coo©,-.. ,-t<_ o; m
O_ '¢1' ¢0 ,P"U 0 0 _. 0 0 _=' rid CD=._ ,-.o _ o° c_ c_ c_ ,- ,- o(_.¢ _,_ .-- o .- 'm ' ' © o; o; ¢o
_"I _In I m._4_ I I I O_ --- --- I --- I_. I I I f,.-i
--Z
o_ ,,'-, i_ 8 _ i_i, io i i i i i o0 Z_l "_ _ "_ _ _" _"
"_c_ v'r" " _ 0 mI_. _ ¢_a'_
0 0 0
_., ,,.:., ,_ _,_,, ,_ , , , , , oc_
L--
_-- I i Itr": I Ir":o o o I i t t I i I i I I I
''''''' .'''''' "
04 ,.. I I I I l _I,_" ,." O.
-_ ...==E ""
"_.-, I_-- (U I_ Ca,- (U 1< _)'0
:1 =] i_; m': m_
(J_(/_ _ _[ _ D. I-- I_- I_ 43
.0
44
m
C •• m
X •
IT-
EO
mm
'0m
=Dm
"0C
m
@m
.Qm
I--
m
m
mmm
mm
q q q
• _ __
_1_ _1_ _ C_ _1_ _1_ _
_" oo _: oo _" OO _: oo2:-_'_ 3:.>,.>, "_-_'_ "_"_'_
_ _ A A Au_ _ v= _ v= tr, v=
_ro
+1 +1 -I-I
_- t_1 It11_ _0 C_l
A
C_ C_0 0
"!" -=) .:_
(DI!
Zv
mm
0NmI_.
0
"0(I)
_=0
m
O
e_
45
46
: !
I- Z I
om
W
m
0L_
4_
0o
0L_
?
Q.
|
"0
|
II
Form Approved
REPORT DOCUMENTATION PAGE OMBNo0704-0,88
Public reportingburden for this collectionof informationis estimated to average I hour per response, includingthe time for reviewinginstructions, searchingexisting data sources,gathehng and maintaining the dete needed, and completing and reviewingthe collection of information. Send comments regardingthis burdenestimate or any other aspect of thiscollection of information, includingsuggestionsfor reducing this burden, to WashingtonHeadquarters Services,Directorate for informationOperations and Reports, 1215 JeffersonDavis Highway. Suite 1204. Adington, VA 22202..4302, end to the Office of Management end Budget,Paperwork ReductionProject (0704-0188), Washington, DC 20503.
1. AGENCY USE ONLY (Leave blank) 2. REPORT DATE 3. REPORT TYPE AND DATES COVERED
August 1992 Technical Memorandum4. TITLE AND SUBTITLE 5. FUNDING NUMBERS
Vascular Uptake of Rehydration Fluids in Hypohydrated Men at Restand Exercise
6. AUTHOR(S)
J. E. Greenleaf, G. Geelen, C. G. R, Jackson, J.-L. Saumet, L. T. Juhos,
L. C. Keil, D. Fegan-Meyer, A. Dearborn, H. Hinghofer-Szalkay,
and J. H. Whittam _Shaklee U.S. Inc., San Francisco, CA 94111)7. PERFORMING ORGANIZATION NAME(S) AND ADDRESS(ES)
Ames Research Center
Moffett Field, CA 94035-1000
9. SPONSORING/MONITORINGAGENCYNAME(S)ANDADDRESS(ES)
National Aeronautics and Space AdministrationWashington, DC 20546-0001
199-18-12-07
8. PERFORMING ORGANIZATIONREPORT NUMBER
A-92113
10. SPONSORING/MONITORINGAGENCY REPORT NUMBER
NASA TM-103942
11. SUPPLEMENTARY NOTES
Point of Contact: J.E. Greenleaf, Ames Research Center, MS 239-11, Moffett Field, CA 94035-1000
(415) 604-6604 or FAX (415) 604-3954
12a. DISTRIBUTION/AVAILABILITY STATEMENT
13.
12b. DISTRIBUTION CODE
Unclassified -- Unlimited
Subject Category _ ,ff',_:_
AB,_¥1_ACT (Maximum 200 words)
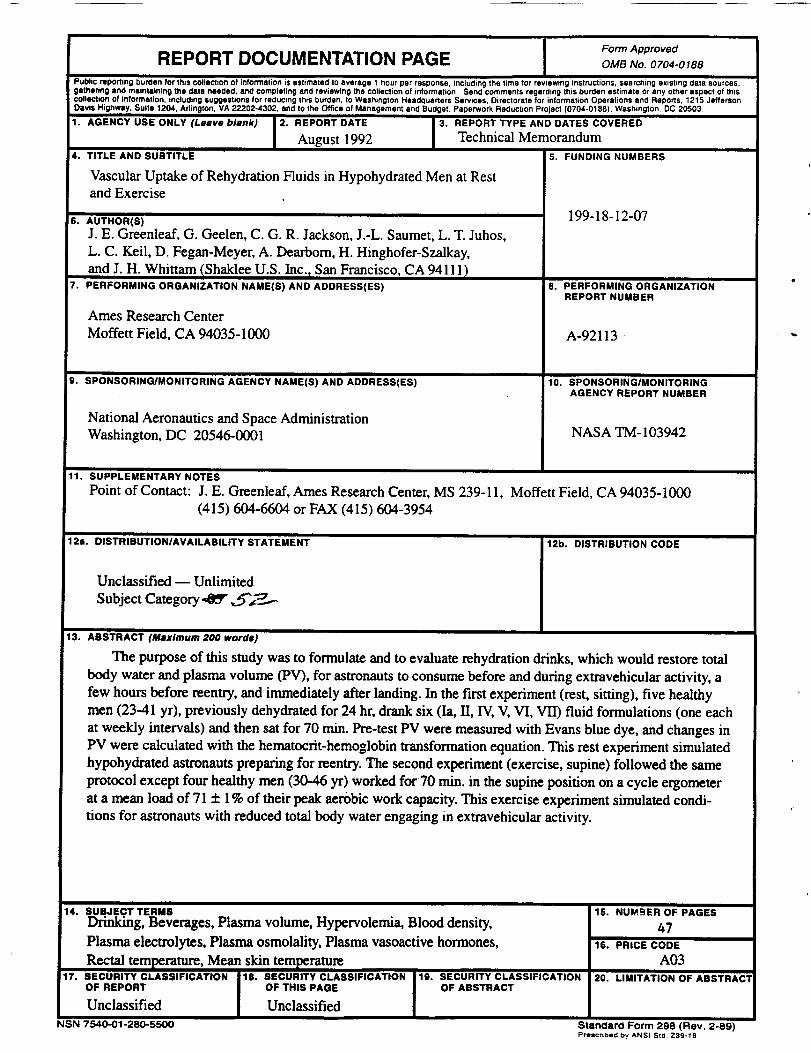
The purpose of this study was to formulate and to evaluate rehydration drinks, which would restore total
body water and plasma volume (PV), for astronauts to consume before and during extravehicular activity, a
few hours before reentry, and immediately after landing. In the first experiment (rest, sitting), five healthy
men (23-41 yr), previously dehydrated for 24 hr, drank six (Ia, II, IV, V, VI, V]]) fluid formulations (one each
at weekly intervals) and then sat for 70 min. Pre-test PV were measured with Evans blue dye, and changes inPV were calculated with the hematocrit-hemoglobin transformation equation. This rest experiment simulated
hypohydrated astronauts preparing for reentry. The second experiment (exercise, supine) followed the same
protocol except four healthy men (30-46 yr) worked for70 min. in the supine position on a cycle ergometer
at a mean load of 71 + 1% of their peak aerobic work capacity. This exercise experiment simulated condi-
tions for astronauts with reduced total body water engaging in extravehicular activity.
14. SUBJECT TERMS
Drinking, Beverages, Plasma volume, Hypervolemia, Blood density,
Plasma electrolytes, Plasma osmolality, Plasma vasoactive hormones,
Rectal temDerature, Mean skin temperature17. SECURITY CLASSIFICATION 18. SECURITY CLASSIFICATION
OF REPORT OF THIS PAGE
Unclassified Unclassified
NSN 7540-01-280-5500
15. NUMRER OF PAGES
4716. PRICE CODE
A03
19. SECURITY CLASSIFICATION 20. LIMITATION OF ABSTRACTOF ABSTRACT
Standard Form 298 (Rev. 2-89)Pfeschbed by ANSI Std Z39-1e