Embed Size (px)
Citation preview
Oral versus intravenous rehydration for treating dehydration
due to gastroenteritis in children (Review)
Hartling L, Bellemare S, Wiebe N, Russell KF, Klassen TP, Craig WR
This is a reprint of a Cochrane review, prepared and maintained by The Cochrane Collaboration and published in The Cochrane Library2010, Issue 1
http://www.thecochranelibrary.com
Oral versus intravenous rehydration for treating dehydration due to gastroenteritis in children (Review)
Copyright © 2010 The Cochrane Collaboration. Published by John Wiley & Sons, Ltd.
T A B L E O F C O N T E N T S
1HEADER . . . . . . . . . . . . . . . . . . . . . . . . . . . . . . . . . . . . . . .
1ABSTRACT . . . . . . . . . . . . . . . . . . . . . . . . . . . . . . . . . . . . . .
2PLAIN LANGUAGE SUMMARY . . . . . . . . . . . . . . . . . . . . . . . . . . . . . .
2BACKGROUND . . . . . . . . . . . . . . . . . . . . . . . . . . . . . . . . . . . .
3OBJECTIVES . . . . . . . . . . . . . . . . . . . . . . . . . . . . . . . . . . . . .
3METHODS . . . . . . . . . . . . . . . . . . . . . . . . . . . . . . . . . . . . . .
5RESULTS . . . . . . . . . . . . . . . . . . . . . . . . . . . . . . . . . . . . . . .
Figure 1. . . . . . . . . . . . . . . . . . . . . . . . . . . . . . . . . . . . . . 8
Figure 2. . . . . . . . . . . . . . . . . . . . . . . . . . . . . . . . . . . . . . 8
Figure 3. . . . . . . . . . . . . . . . . . . . . . . . . . . . . . . . . . . . . . 11
11DISCUSSION . . . . . . . . . . . . . . . . . . . . . . . . . . . . . . . . . . . . .
Figure 4. . . . . . . . . . . . . . . . . . . . . . . . . . . . . . . . . . . . . . 12
13AUTHORS’ CONCLUSIONS . . . . . . . . . . . . . . . . . . . . . . . . . . . . . . .
13ACKNOWLEDGEMENTS . . . . . . . . . . . . . . . . . . . . . . . . . . . . . . . .
14REFERENCES . . . . . . . . . . . . . . . . . . . . . . . . . . . . . . . . . . . . .
17CHARACTERISTICS OF STUDIES . . . . . . . . . . . . . . . . . . . . . . . . . . . . .
32DATA AND ANALYSES . . . . . . . . . . . . . . . . . . . . . . . . . . . . . . . . . .
Analysis 1.1. Comparison 1 Oral rehydration therapy (any solution) versus intravenous therapy, Outcome 1 Failure to
rehydrate (by inpatient/outpatient). . . . . . . . . . . . . . . . . . . . . . . . . . . 34
Analysis 1.2. Comparison 1 Oral rehydration therapy (any solution) versus intravenous therapy, Outcome 2 Weight gain
(g) at discharge (by inpatient/outpatient). . . . . . . . . . . . . . . . . . . . . . . . . 35
Analysis 1.3. Comparison 1 Oral rehydration therapy (any solution) versus intravenous therapy, Outcome 3 Per cent weight
gain (g) at discharge (by inpatient/outpatient). . . . . . . . . . . . . . . . . . . . . . . 36
Analysis 1.4. Comparison 1 Oral rehydration therapy (any solution) versus intravenous therapy, Outcome 4 Length of
hospital stay (days). . . . . . . . . . . . . . . . . . . . . . . . . . . . . . . . . 37
Analysis 1.5. Comparison 1 Oral rehydration therapy (any solution) versus intravenous therapy, Outcome 5 Incidences of
hyponatremia. . . . . . . . . . . . . . . . . . . . . . . . . . . . . . . . . . 38
Analysis 1.6. Comparison 1 Oral rehydration therapy (any solution) versus intravenous therapy, Outcome 6 Incidences of
hypernatremia (by inpatient/outpatient). . . . . . . . . . . . . . . . . . . . . . . . . 39
Analysis 1.7. Comparison 1 Oral rehydration therapy (any solution) versus intravenous therapy, Outcome 7 Duration of
diarrhea (h) (by inpatient/outpatient). . . . . . . . . . . . . . . . . . . . . . . . . . 40
Analysis 1.8. Comparison 1 Oral rehydration therapy (any solution) versus intravenous therapy, Outcome 8 Total fluid
intake (mL/kg) at 6 h (by inpatient/outpatient). . . . . . . . . . . . . . . . . . . . . . . 41
Analysis 1.9. Comparison 1 Oral rehydration therapy (any solution) versus intravenous therapy, Outcome 9 Total fluid
intake (mL/kg) at 24 h (by inpatient/outpatient). . . . . . . . . . . . . . . . . . . . . . 42
Analysis 1.10. Comparison 1 Oral rehydration therapy (any solution) versus intravenous therapy, Outcome 10 Total fluid
intake (mL) at 6 h (by inpatient/outpatient). . . . . . . . . . . . . . . . . . . . . . . . 43
Analysis 1.11. Comparison 1 Oral rehydration therapy (any solution) versus intravenous therapy, Outcome 11
Complications. . . . . . . . . . . . . . . . . . . . . . . . . . . . . . . . . . 43
Analysis 1.12. Comparison 1 Oral rehydration therapy (any solution) versus intravenous therapy, Outcome 12 Sodium
intake (mmol/kg) at 6 h (by inpatient/outpatient). . . . . . . . . . . . . . . . . . . . . . 45
Analysis 1.13. Comparison 1 Oral rehydration therapy (any solution) versus intravenous therapy, Outcome 13 Sodium
levels (mmol/kg) at 24 h (by inpatient/outpatient). . . . . . . . . . . . . . . . . . . . . . 46
Analysis 2.1. Comparison 2 Oral rehydration therapy (any solution) versus intravenous therapy: subgroup analyses,
Outcome 1 Failure to rehydrate: review authors’ definition. . . . . . . . . . . . . . . . . . . 47
Analysis 2.2. Comparison 2 Oral rehydration therapy (any solution) versus intravenous therapy: subgroup analyses,
Outcome 2 Failure to rehydrate: intention-to-treat analysis. . . . . . . . . . . . . . . . . . . 48
Analysis 2.3. Comparison 2 Oral rehydration therapy (any solution) versus intravenous therapy: subgroup analyses,
Outcome 3 Failure to rehydrate: by osmolarity. . . . . . . . . . . . . . . . . . . . . . . 50
Analysis 2.4. Comparison 2 Oral rehydration therapy (any solution) versus intravenous therapy: subgroup analyses,
Outcome 4 Failure to rehydrate: by vomiting. . . . . . . . . . . . . . . . . . . . . . . . 51
iOral versus intravenous rehydration for treating dehydration due to gastroenteritis in children (Review)
Copyright © 2010 The Cochrane Collaboration. Published by John Wiley & Sons, Ltd.
Analysis 2.5. Comparison 2 Oral rehydration therapy (any solution) versus intravenous therapy: subgroup analyses,
Outcome 5 Failure to rehydrate: by route. . . . . . . . . . . . . . . . . . . . . . . . . 53
54APPENDICES . . . . . . . . . . . . . . . . . . . . . . . . . . . . . . . . . . . . .
60WHAT’S NEW . . . . . . . . . . . . . . . . . . . . . . . . . . . . . . . . . . . . .
60HISTORY . . . . . . . . . . . . . . . . . . . . . . . . . . . . . . . . . . . . . . .
60CONTRIBUTIONS OF AUTHORS . . . . . . . . . . . . . . . . . . . . . . . . . . . . .
61DECLARATIONS OF INTEREST . . . . . . . . . . . . . . . . . . . . . . . . . . . . . .
61SOURCES OF SUPPORT . . . . . . . . . . . . . . . . . . . . . . . . . . . . . . . . .
61DIFFERENCES BETWEEN PROTOCOL AND REVIEW . . . . . . . . . . . . . . . . . . . . .
61INDEX TERMS . . . . . . . . . . . . . . . . . . . . . . . . . . . . . . . . . . . .
iiOral versus intravenous rehydration for treating dehydration due to gastroenteritis in children (Review)
Copyright © 2010 The Cochrane Collaboration. Published by John Wiley & Sons, Ltd.
[Intervention Review]
Oral versus intravenous rehydration for treating dehydrationdue to gastroenteritis in children
Lisa Hartling2, Steven Bellemare3, Natasha Wiebe4, Kelly F Russell5, Terry P Klassen6, William Raine Craig1
1Pediatric Emergency, University of Alberta, Edmonton, Canada. 2Department of Paediatrics, University of Alberta, Edmonton,
Canada. 3Department of Pediatrics, Dalhousie University, Halifax, Canada. 4Medicine, University of Alberta, Edmonton, Canada.5Department of Paediatrics, Alberta Children’s Hospital, Calgary, Canada. 6Department of Pediatrics, University of Alberta, 8417
Aberhart Centre One, Edmonton, Canada
Contact address: William Raine Craig, Pediatric Emergency, University of Alberta, 7215 Aberhart Centre 1, 11402 University Ave,
Edmonton, Alberta, T6G 2J3, Canada. [email protected].
Editorial group: Cochrane Infectious Diseases Group.
Publication status and date: Stable (no update expected for reasons given in ’What’s new’), published in Issue 1, 2010.
Review content assessed as up-to-date: 28 March 2006.
Citation: Hartling L, Bellemare S, Wiebe N, Russell KF, Klassen TP, Craig WR. Oral versus intravenous rehydration for treating
dehydration due to gastroenteritis in children. Cochrane Database of Systematic Reviews 2006, Issue 3. Art. No.: CD004390. DOI:
10.1002/14651858.CD004390.pub2.
Copyright © 2010 The Cochrane Collaboration. Published by John Wiley & Sons, Ltd.
A B S T R A C T
Background
Dehydration associated with gastroenteritis is a serious complication. Oral rehydration is an effective and inexpensive treatment, but
some physicians prefer intravenous methods.
Objectives
To compare oral with intravenous therapy for treating dehydration due to acute gastroenteritis in children.
Search methods
We searched the Cochrane Infectious Diseases Group Specialized Register (March 2006), CENTRAL (The Cochrane Library 2006,
Issue 1), MEDLINE (1966 to March 2006), EMBASE (1974 to March 2006), LILACS (1982 to March 2006), and reference lists.
We also contacted researchers, pharmaceutical companies, and relevant organizations.
Selection criteria
Randomized and quasi-randomized controlled trials comparing intravenous rehydration therapy (IVT) with oral rehydration therapy
(ORT) in children up to 18 years of age with acute gastroenteritis.
Data collection and analysis
Two authors independently extracted data and assessed quality using the Jadad score. We expressed dichotomous data as a risk difference
(RD) and number needed to treat (NNT), and continuous data as a mean difference (MD). We used meta-regression for subgroup
analyses.
1Oral versus intravenous rehydration for treating dehydration due to gastroenteritis in children (Review)
Copyright © 2010 The Cochrane Collaboration. Published by John Wiley & Sons, Ltd.
Main results
Seventeen trials (1811 participants), of poor to moderate quality, were included. There were more treatment failures with ORT (RD
4%, 95% confidence interval (CI) 1 to 7, random-effects model; 1811 participants, 18 trials; NNT = 25). Six deaths occurred in the
IVT group and two in the ORT groups (4 trials). There were no significant differences in weight gain (369 participants, 6 trials),
hyponatremia (248 participants, 2 trials) or hypernatremia (1062 participants, 10 trials), duration of diarrhea (960 participants, 8
trials), or total fluid intake at six hours (985 participants, 8 trials) and 24 hours (835 participants, 7 trials). Shorter hospital stays were
reported for the ORT group (WMD -1.20 days, 95% CI -2.38 to -0.02 days; 526 participants, 6 trials). Phlebitis occurred more often
in the IVT group (NNT 50, 95% CI 25 to 100) and paralytic ileus more often in the ORT group (NNT 33, 95% CI 20 to 100, fixed-
effect model), but there was no significant difference between ORT using the low osmolarity solutions recommended by the World
Health Organization and IVT (729 participants, 6 trials).
Authors’ conclusions
Although no clinically important differences between ORT and IVT, the ORT group did have a higher risk of paralytic ileus, and the
IVT group was exposed to risks of intravenous therapy. For every 25 children (95% CI 14 to 100) treated with ORT one would fail
and require IVT.
P L A I N L A N G U A G E S U M M A R Y
Children with dehydration due to gastroenteritis need to be rehydrated, and this review did not show any important differences
between giving fluids orally or intravenously
Dehydration is when body water content is reduced causing dry skin, headaches, sunken eyes, dizziness, confusion, and sometimes
death. Children with dehydration due to gastroenteritis need rehydrating either by liquids given by mouth or a tube through the nose,
or intravenously. The review of 17 trials (some funded by drug companies) found that the trials were not of high quality; however
the evidence suggested that there are no clinically important differences between giving fluids orally or intravenously. For every 25
children treated with fluids given orally, one child would fail and require intravenous rehydration. Further, the results for low osmolarity
solutions, the currently recommended treatment by the World Health Organization, showed a lower failure rate for oral rehydration
that was not significantly different from that of intravenous rehydration. Oral rehydration should be the first line of treatment in
children with mild to moderate dehydration with intravenous therapy being used if the oral route fails. The evidence showed that there
may be a higher risk of paralytic ileus with oral rehydration while intravenous therapy carries the risk of phlebitis (ie inflammation of
the veins).
B A C K G R O U N D
Gastroenteritis is an illness characterized by the acute onset of di-
arrhea, which may or may not be accompanied by nausea, vom-
iting, fever, and abdominal pain (AAP 1996). It can be caused
by a variety of infectious agents including bacteria and viruses
(Armon 2000). Acute diarrhea refers to the passage of loose or
watery stools, usually at least three times per 24 hours, and lasting
less than 14 days; the consistency of stools being more important
than the frequency.
Mild cases of gastroenteritis are usually self-limiting and may cause
mild dehydration, which can be treated or prevented by contin-
ued feeding and drinking more fluids. Children who lose a large
volume of liquid stool may develop moderate or severe dehydra-
tion; in the most severe cases this can lead to death. These children
should be given rehydration therapy in order to restore the lost
fluids and electrolytes.
Worldwide, 12% of deaths among children less than five years
are due to diarrhea (WHO 2000). In low-income and middle-
income countries, an estimated 1.8 million children below the age
of five years die of diarrhea each year (Bern 1992). Almost 50%
of these deaths are due to dehydration and most affect children
less than one year of age (WHO 1996). Children in high-income
countries are also affected by diarrhea. In the USA, for example,
each year there are roughly 21.5 to 38 million episodes of diarrhea
among the 16.5 million children under the age of five years (
2Oral versus intravenous rehydration for treating dehydration due to gastroenteritis in children (Review)
Copyright © 2010 The Cochrane Collaboration. Published by John Wiley & Sons, Ltd.
Glass 1991). Diarrhea accounts for an estimated 2.1 to 3.7 million
physician visits per year (Glass 1991) and 9% to 10% of all hospital
admissions of children under the age of 5 years (Glass 1991;
Gangarosa 1992). Approximately one per 15,000 children born in
the USA or one per 500 children hospitalized with gastrointestinal
illness will die of their illness (Glass 1991).
Widespread use of oral rehydration salt (ORS) solutions began
in the 1970s as an effective and inexpensive method of treating
diarrhea in low-income and middle-income countries (Duggan
1992). The basis for their use lies in the knowledge that glucose
enhances sodium and water absorption in the bowel, even during
diarrhea (Mackenzie 1988; Duggan 1992). There are a number of
ORS solutions that vary in terms of their electrolyte and carbohy-
drate concentrations (Santosham 1991). The World Health Orga-
nization recommends a specific formulation of ORS solution for
both rehydration and maintenance of hydration (WHO 2002). It
has an osmolarity similar to that of plasma and contains citrate to
correct metabolic acidosis and a glucose concentration that allows
maximum absorption of sodium and water.
Despite its success and proven efficacy (Gavin 1996), and recom-
mendations for use by the American Academy of Pediatrics and
the Centers for Disease Control (Duggan 1992; AAP 1996), oral
rehydration therapy (ORT) continues to be less frequently used
by family physicians and pediatricians in North America, where
intravenous therapy (IVT) is more in vogue (Snyder 1991; Ozuah
2002).
IVT, usually with normal saline or Ringer’s lactate (AAP 1996),
is familiar to physicians and is rapid and effective in promptly
reversing cases of hypovolemic (low blood volume) shock. Since
it must be administered in an outpatient or inpatient setting by
specially trained staff, it is expensive in terms of money and hu-
man resources. In addition, IVT is a traumatic experience for most
children and is known to have complications related to rapid over
correction of electrolyte imbalances (WHO 1995), leaking of so-
lutions into surrounding tissues (Garland 1992), and infection or
inflammation (Garland 1992).
ORT is colloquially used in the literature as a substitute for the
perhaps more appropriate term enteral rehydration therapy. It is
important to note that rehydration can be provided enterally in
two manners: orally or via nasogastric tube. Although ORT is not
widely popular in developed countries because it is thought to take
extra time and effort (Goepp 1993), it has many advantages. If
administered by mouth, it is less traumatic to the child and can
be administered by caregivers in a variety of settings including the
home (Mackenzie 1988; AAP 1996). Research has shown ORT
to be less expensive than IVT and to be associated with lower
hospital admission rates and shorter lengths of stay (Listernick
1986; Gremse 1995). ORT is not recommended if the child has
paralytic ileus or glucose malabsorption (Duggan 1992; WHO
1995), which are rare events. In both these clinical scenarios, fluid
remains in the gut lumen rather than being absorbed into the
intravascular space where the body can use it. Further delivery of
fluid then just causes abdominal distention.
In 1996, Gavin and colleagues published the results of a meta-
analysis that evaluated the efficacy of glucose-based ORT among
well-nourished children in developed countries (Gavin 1996). The
review included six studies that compared ORT with IVT and
seven studies that compared ORS solutions with different sodium
contents. They found that failure of ORT (defined as the need to
revert to IVT) varied among trials, ranging from 0% to 18.8%
with an overall failure rate of 3.6% (95% confidence interval 1.4 to
5.8). They found no significant difference in failure between dif-
ferent ORS solutions. They also found no higher risk of iatrogenic
hypernatremia or hyponatremia with ORT compared with IVT
and no significant differences in failure rates between inpatients
and outpatients. The authors suggested that ORT may, in fact,
be associated with more favourable outcomes such as increased
weight gain and shorter duration of diarrhea.
The NHS Centre for Reviews and Dissemination (CRD) at the
University of York, England critically appraised the Gavin 1996
review. While there was little detail in the paper on the individual
studies reviewed and some aspects of the methods used for the
review, the appraisal concluded that sufficient information was
presented to suggest that the findings were likely reliable (DARE
2002). In addition, we evaluated the review by applying Oxman
and Guyatt’s index of the scientific quality of research overviews
(Oxman 1991). The weaknesses identified by the Oxman and
Guyatt index included the limited search (MEDLINE up to 1993
and contact with organizations and content experts; English lan-
guage articles only) and the lack of assessment and consideration
of the validity of the included studies. The purpose of the present
review is to update and build on the work started by Gavin and
colleagues by increasing the scope (countries of all income lev-
els, method of administration of ORT) and comprehensiveness
(broader search strategy, inclusion not limited by language of pub-
lication or publication status), and by assessing the risk of bias in
the included studies.
O B J E C T I V E S
To compare oral with intravenous therapy for treating dehydration
due to acute gastroenteritis in children.
M E T H O D S
Criteria for considering studies for this review
3Oral versus intravenous rehydration for treating dehydration due to gastroenteritis in children (Review)
Copyright © 2010 The Cochrane Collaboration. Published by John Wiley & Sons, Ltd.
Types of studies
Randomized and quasi-randomized controlled trials.
Types of participants
Children up to 18 years of age with dehydration secondary to
acute gastroenteritis.
We included hospital inpatients and outpatients.
Acute gastroenteritis was defined as the rapid onset of diarrhea
(lasting less than 14 days) with or without nausea, vomiting, fever,
or abdominal pain (AAP 1996). Diarrhea is the passage of loose
or watery stools, usually with increased frequency and volume
(Baldassano 1991). Dehydration due to diarrhea is a “deficiency
of water and salt” (Santosham 1991), and is most often assessed
in terms of the percentage of weight lost during the dehydrating
episode (Armon 2000). The severity of dehydration can be classi-
fied as mild (3% to 5%), moderate (6% to 9%), or severe (10%
or greater) (Duggan 1992; AAP 1996).
Types of interventions
Intervention
Oral rehydration therapy administered orally or via nasogastric
tube.
Control
Intravenous therapy.
Types of outcome measures
Primary
• Failure of rehydration or failure to maintain hydration after
initial rehydration (as defined in the trials).
• Death.
Secondary
• Weight gain.
• Length of hospital stay for inpatients.
• Hypernatremia (excessive concentration of sodium in the
blood).
• Hyponatremia (reduced concentration of sodium in the
blood).
• Duration of diarrhea.
• Total fluid intake.
• Sodium intake and sodium levels.
• Complications and adverse events.
Search methods for identification of studies
We attempted to identify all relevant trials regardless of language
or publication status (published, unpublished, in press, and in
progress).
Databases
We searched the following databases using the search terms and
strategy described in Appendix 1: Cochrane Infectious Diseases
Group Specialized Register (March 2006);Cochrane Central Reg-
ister of Controlled Trials (CENTRAL), published in The CochraneLibrary (2006, Issue 1); MEDLINE (1966 to March 2006); EM-
BASE (1974 to March 2006); and LILACS (1982 to March 2006).
Researchers, organizations, and pharmaceutical
companies
We contacted the World Health Organization Division of Child
and Adolescent Health, Technologies for Primary Health Care
Project (sponsored by US Agency for International Development),
International Child Health Foundation, International Children’s
Centre, International Center for Diarrhoeal Diseases Research,
and individual researchers working in the field for unpublished
data, confidential reports, and raw data of published trials. We also
contacted the manufacturers of Pedialyte (Ross Products Division,
Abbott Laboratories) and Gastrolyte (Aventis Pharma Inc.) for
any unpublished information or studies they may have possessed
information pertaining to the efficacy of ORT.
Reference lists
We also reviewed the citations of existing reviews (Gavin 1996;
Fonseca 2004), and of all trials identified by the above methods.
Data collection and analysis
Selection of studies
Two authors (Steven Bellemare (SB) and Kelly Russell (KR)) inde-
pendently screened the results of the literature search. The full text
of all potentially relevant articles was retrieved. Two authors (KR,
Don McConnell (DM), or Lisa Hartling (LH)) independently as-
sessed the trials for inclusion in the review using predetermined
inclusion criteria. We resolved any disagreements through discus-
sion or by consulting a third party.
Data extraction and management
One author (SB or LH) extracted data from the included trials,
and a second author (KR) checked the data for completeness and
4Oral versus intravenous rehydration for treating dehydration due to gastroenteritis in children (Review)
Copyright © 2010 The Cochrane Collaboration. Published by John Wiley & Sons, Ltd.
accuracy. We requested unpublished data from authors where nec-
essary. We used a standard data extraction form to extract data on
trial characteristics including methods, participants, interventions,
and outcomes. We also collected information on source of fund-
ing and intention-to-treat (whether an intention-to-treat analysis
was planned and whether an intention-to-treat analysis was done).
We resolved any disagreements by referring to the trial report and
through discussion.
Assessment of risk of bias in included studies
Two authors (SB, William Craig (WC), or LH) evaluated each
trial using the Jadad 5-point scale to assess randomization (0 to
2 points), double blinding (0 to 2 points), and withdrawals and
dropouts (0 to 1 point) (Jadad 1996). SB, WC, or LH also as-
sessed concealment of allocation as being adequate, inadequate, or
unclear (Schulz 1995). We resolved any differences through con-
sensus or by consulting a third party. We provided overall quality
scores according to the Jadad scale. We also described and displayed
the quality information by individual components − generation
of random sequence, blinding, loss to follow up, and allocation
concealment − which we classified as adequate, inadequate, or
unclear.
Data synthesis
Since we had frequent zero event rates (per group, per trial), we
expressed dichotomous data (eg failure of treatment) as a risk dif-
ference (RD) rather than using a relative measure that would force
the trial data to be omitted or approximated (adding ½ to each
2 x 2 table cell) (Higgins 2005a). We also calculated the num-
ber needed to treat (NNT) to help clarify the degree of benefit
for the baseline intravenous risk. We calculated baseline risks us-
ing the same weights calculated from the risk difference analy-
ses. We converted continuous data to a mean difference and then
calculated an overall mean difference. We analyzed the results in
Review Manager 4.2 using a random-effects model and presented
all estimates with 95% confidence intervals (CI). We analyzed the
longitudinal outcome of total fluid intake for two time points: six
and 24 hours. One trial assessed total fluid intake at four hours
(Spandorfer 2005), while two trials assessed total fluid intake at
eight hours (Santosham 1982i; Santosham 1982ii); these trials
were included in the analysis for total fluid intake at six hours.
We quantified statistical heterogeneity using the I2 statistic
(Higgins 2003). We assessed possible sources of heterogeneity by
subgroup analyses meta-regressing (using Stata 7.0) on the pri-
mary outcome measure (failure to rehydrate). We examined several
participant subgroups: inpatient or outpatient status; participant
age; state of nourishment; extent of dehydration; country’s income
status; route of administration (oral versus nasogastric); and type
of ORS solution. We also examined several other subgroups: Jadad
score; allocation concealment; funding source; and intention-to-
treat analysis.
The relationship between the osmolarity of the ORT solution and
failure to rehydrate was explored using a chi-square subgroup test
(Deeks 2001). We calculated osmolarity based on the reported
constituent concentrations in the solutions (Appendix 2). We also
examined the choice of model for sensitivity to the results (eg
Mantel-Haenszel fixed-effect model). We performed intention-to-
treat analyses for our primary outcome measure (failure to rehy-
drate). After viewing the trials, we created a more homogeneous
failure definition and applied it to each article in order to check
the robustness of the primary results (ie using failure to rehydrate
as defined in the trials). The decision to examine persistent vom-
iting as an exclusion criterion was selected post hoc for subgroup
analysis; all other subgroups were specified a priori. We identified
and explored all statistical outliers.
We tested for publication bias using the funnel plot visually
and quantitatively using the rank correlation test (Begg 1994),
weighted regression (Egger 1997), and the trim-and-fill method
(Duval 2001) in Stata 7.0.
When standard deviations were not reported, we performed a
sensitivity analysis by substituting both the minimum and max-
imum standard deviations from the other outcome-specific in-
cluded studies to gauge whether these omitted studies might sig-
nificantly alter our results.
R E S U L T S
Description of studies
See: Characteristics of included studies; Characteristics of excluded
studies.
We identified 466 unique references through the electronic
databases and obtained the full text of 28 potentially relevant ar-
ticles. We identified 11 additional studies via recommendations
from authors and experts in the field and references. Seventeen of
these met the inclusion criteria (see ’Characteristics of included
studies’). One trial was conducted concurrently and slightly differ-
ently in two countries; we have analyzed this as two separate studies
(Santosham 1982i; Santosham 1982ii). The reasons for excluding
studies are noted in the ’Characteristics of excluded studies’.
Randomization
All trials compared an IVT arm with one or more ORT arms
(oral or nasogastric). The trials varied widely in methodology and
quality. They were published from 1982 to 2005 and though most
were randomized, two trials were quasi-randomized (Singh 1982;
Mackenzie 1991).
5Oral versus intravenous rehydration for treating dehydration due to gastroenteritis in children (Review)
Copyright © 2010 The Cochrane Collaboration. Published by John Wiley & Sons, Ltd.
Location
The trials varied in their countries of origin. Nine were con-
ducted in high-income countries: six in the USA (Tamer 1985;
Listernick 1986; Gremse 1995; Atherly-John 2002; Nager 2002;
Spandorfer 2005); one in Canada (Issenman 1993); one in Aus-
tralia (Mackenzie 1991); and one in Finland (Vesikari 1987). The
other trials were from lower income countries such as Puerto Rico
(de Pumarejo 1990), Egypt (el-Mougi 1994), Mexico (Gonzalez
1988), Iran (Sharifi 1985), Afghanistan (Singh 1982), Colombia
(Hernandez 1987), and Peru (Brown 1988). One trial was con-
ducted in the USA and Panama simultaneously (Santosham 1982i;
Santosham 1982ii).
Funding source
Of the trials that mentioned the source of funding, five received
funding or sponsorship from the pharmaceutical industry (Ross
or Abbott Laboratories) (Santosham 1982i; Listernick 1986; de
Pumarejo 1990; Issenman 1993; Gremse 1995), one trial received
funding from other external sources (Santosham 1982i), one trial
received funding from Nestle, the World Health Organization,
and the US government (Brown 1988), and two trials used Pedi-
alyte in their protocol but did not specifically acknowledge Ross
Laboratories (the manufacturer of Pedialyte) as a funding source
(Nager 2002; Spandorfer 2005).
Inclusion and exclusion criteria
Most trials were similar in their inclusion and exclusion criteria
except in the area of treatment of children with persistent vomiting
and severe dehydration and shock. All trials excluded children in
shock except for two (Santosham 1982i; Santosham 1982ii; Sharifi
1985), and three trials did not mention whether they included or
excluded these children (Hernandez 1987; Vesikari 1987; Brown
1988). All children in the Santosham trials presenting in either se-
vere dehydration or shock were first treated immediately with IVT
to reverse the condition before being randomized to a treatment
group.
Three trials enrolled children with only dehydration secondary
to acute diarrhea and made no mention of vomiting in the in-
clusion criteria (Brown 1988; Vesikari 1987; el-Mougi 1994).
Of the remaining trials, five excluded children with persistent or
protracted vomiting (Singh 1982; de Pumarejo 1990; Issenman
1993; Atherly-John 2002; Nager 2002), while four trials in-
cluded these children (Spandorfer 2005; Sharifi 1985; Listernick
1986; Gremse 1995). The remaining authors did not elaborate
on the inclusion or exclusion of children with persistent vomiting
(Santosham 1982i; Santosham 1982ii; Tamer 1985; Hernandez
1987; Gonzalez 1988; Mackenzie 1991).
Study population
The populations studied were similar: 1015 (56%) people were
randomized to the ORT group and 796 (44%) people to the IVT
group. Overall more people were randomized to ORT as some
trials included more than one ORT group (Santosham 1982i;
Santosham 1982ii; Hernandez 1987; Brown 1988; el-Mougi
1994). Most trials included children from three months to five
years of age. The other trials included children from eight weeks to
three years (Spandorfer 2005), children up to the age of 17 years
(Atherly-John 2002), or neonates aged less than 14 days (Vesikari
1987; Gonzalez 1988; de Pumarejo 1990). One trial did not spec-
ify the age range (Singh 1982). Finally, Hernandez 1987 enrolled
children less than five years but did not specify a lower age limit
(15.3% of their population was ≤ 3 months).
ORS solutions: description and administration
All the trials used ORS solutions containing glucose (75 to 144
mEq/L) or dextrose (70 to 139 mEq/L), as well as sodium (45 to
90 mEq/L), potassium (13 to 30 mEq/L), and chloride (35 to 80
mEq/L) (Appendix 2). One trial used a combination of glucose
and fructose as the carbohydrate component (Listernick 1986).
All the trials used either citrate or bicarbonate in their ORS. Eight
trials reported the osmolarity of the ORS solutions (Santosham
1982i; Santosham 1982ii; Singh 1982; Sharifi 1985; Hernandez
1987; de Pumarejo 1990; Issenman 1993; el-Mougi 1994; Nager
2002), which ranged from 210 to 390 mmol/L. One trial did not
report on the makeup or osmolarity of the ORS used (Atherly-John
2002).
The route of administration of ORT differed. Some trials adminis-
tered by mouth only (Santosham 1982i; Santosham 1982ii; Singh
1982; el-Moughi 1983; Tamer 1985; Listernick 1986; Brown
1988; de Pumarejo 1990; Issenman 1993; Atherly-John 2002;
Spandorfer 2005), while others administered it by mouth, using
an nasogastric tube only when required (Hernandez 1987; Vesikari
1987; Gonzalez 1988; Mackenzie 1991). Children randomized to
the ORT arm received ORS exclusively via nasogastric tube in one
trial (Gremse 1995); but before study enrolment children in both
arms had failed a prior uncontrolled trial of ORS administered
by mouth. One trial administered ORS exclusively via nasogastric
tube (Nager 2002), while another gave ORS via nasogastric tube
in the rehydration phase of the trial and by mouth in the mainte-
nance phase (Sharifi 1985).
Outcomes
All trials reported on the primary outcome measure of interest:
failure to rehydrate using ORT. However, the definition of failure
of ORT varied. While some trials counted children taking ORS
by mouth with persistent vomiting as treatment failures, others
inserted nasogastric tubes in these children, thus giving ORT more
chances of success in the process (Hernandez 1987; Vesikari 1987;
6Oral versus intravenous rehydration for treating dehydration due to gastroenteritis in children (Review)
Copyright © 2010 The Cochrane Collaboration. Published by John Wiley & Sons, Ltd.
Gonzalez 1988; Mackenzie 1991). Only three trials reported data
on deaths (Singh 1982; el-Mougi 1994; Sharifi 1985), while ad-
ditional data were obtained from a fourth (Mackenzie 1991). Sec-
ondary outcome measures, when not determined a priori, were
tabulated as they were reported in individual trials.
Risk of bias in included studies
The quality of the studies ranged from zero to three on the Jadad
scale (median two). Since none of the trials could be double blind
due to the nature of the intervention, the maximum Jadad score
was three rather than the conventional five. Two trials scored a
three (Atherly-John 2002; Spandorfer 2005). One trial scored a
zero on the Jadad scale as it was described as randomized (one
point) but used an inappropriate method of randomization (point
deducted) (Singh 1982). Six trials scored a one on the Jadad score
(Sharifi 1985; Hernandez 1987; Gonzalez 1988; de Pumarejo
1990; el-Mougi 1994; Gremse 1995). All received a point for
randomization. The seven remaining trials scored a two: one point
for randomization and one point for reporting withdrawals. The
quality components for each trial are detailed in Appendix 3.
Two trials had adequately concealed allocation (Atherly-John
2002; Spandorfer 2005); it was unclear in the remaining trials.
Although four trials had incomplete follow up and one other
(Issenman 1993) counted a withdrawal as a failure (Tamer 1985;
Brown 1988; Mackenzie 1991; Nager 2002), only two trials re-
ported doing an intention-to-treat analysis (Atherly-John 2002;
Spandorfer 2005).
Effects of interventions
Failure to rehydrate
There was a statistically significant difference in failure to rehy-
drate between treatment groups (RD 4%, 95% CI 1 to 7; 1811
participants, 18 trials, Analysis 1.1). The NNT was 25 (95% CI
14 to 100), and the failure risks were 4.9% for ORT and 1.3%
for IVT. Failure definitions varied by trial and are discussed later.
The results for failure to rehydrate were not sensitive to the choice
of model, as the fixed-effect model also favoured IVT (RD 4%,
95% CI 2 to 6; NNT 25, 95% CI 17 to 50).
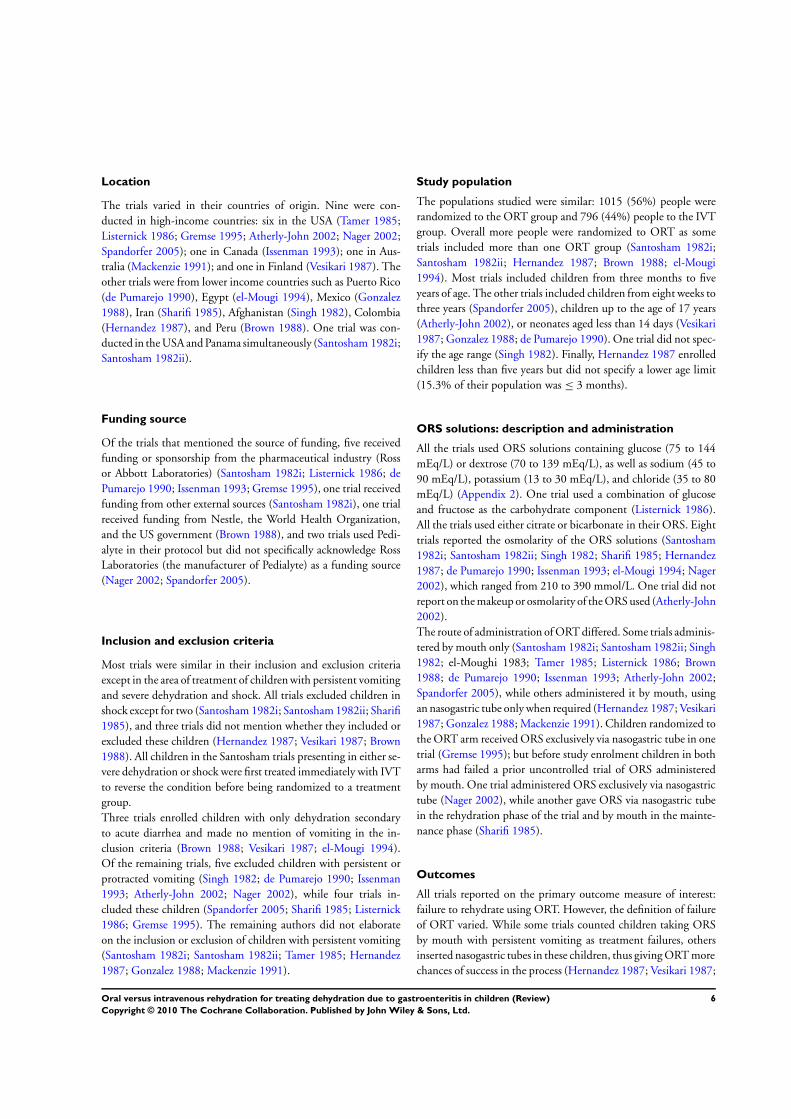
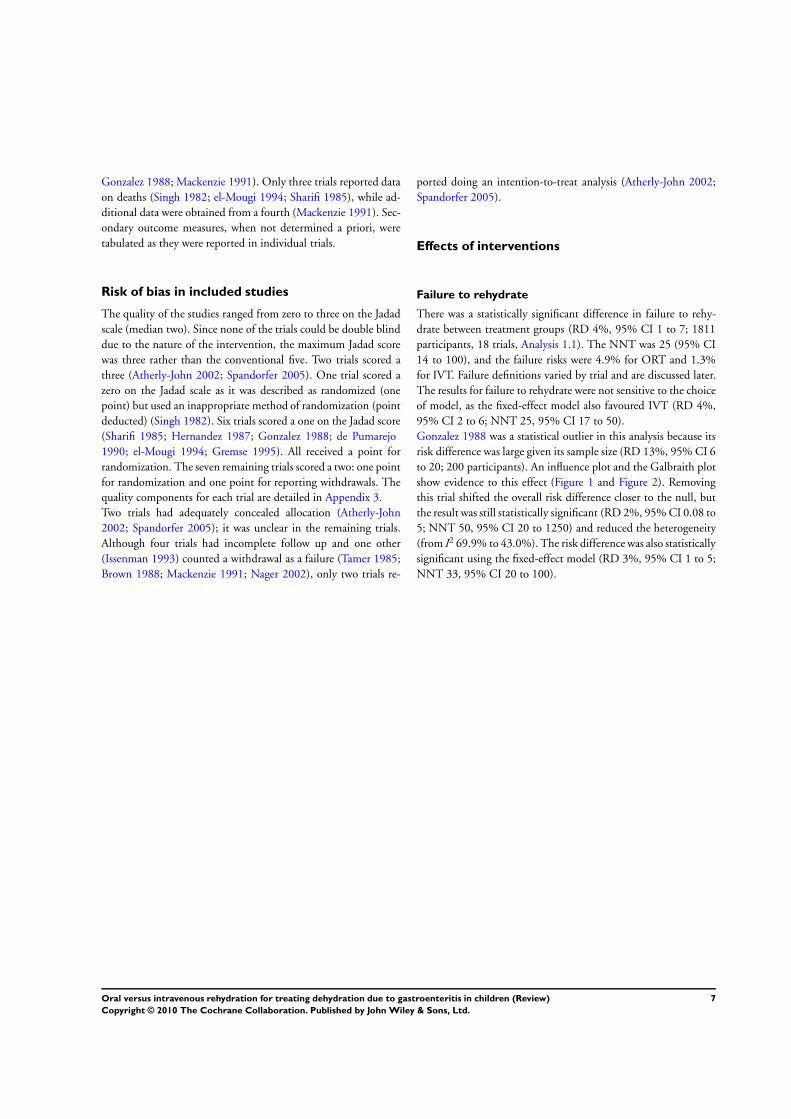
Gonzalez 1988 was a statistical outlier in this analysis because its
risk difference was large given its sample size (RD 13%, 95% CI 6
to 20; 200 participants). An influence plot and the Galbraith plot
show evidence to this effect (Figure 1 and Figure 2). Removing
this trial shifted the overall risk difference closer to the null, but
the result was still statistically significant (RD 2%, 95% CI 0.08 to
5; NNT 50, 95% CI 20 to 1250) and reduced the heterogeneity
(from I2 69.9% to 43.0%). The risk difference was also statistically
significant using the fixed-effect model (RD 3%, 95% CI 1 to 5;
NNT 33, 95% CI 20 to 100).
7Oral versus intravenous rehydration for treating dehydration due to gastroenteritis in children (Review)
Copyright © 2010 The Cochrane Collaboration. Published by John Wiley & Sons, Ltd.
Figure 1. Influence plot: meta-analysis using random-effects model (linear form)
Figure 2. Galbraith plot
8Oral versus intravenous rehydration for treating dehydration due to gastroenteritis in children (Review)
Copyright © 2010 The Cochrane Collaboration. Published by John Wiley & Sons, Ltd.
Gremse 1995 and Nager 2002 met all the inclusion criteria but ran-
domized the participants to the nasogastric or intravenous route;
this occurred after the participants had already failed an uncon-
trolled trial of ORT in Gremse 1995. These trials were neither
outliers nor influential.
Death
Three trials reported deaths, and a fourth author provided supple-
mental data (Mackenzie 1991). Singh 1982 reported that all chil-
dren were successfully rehydrated; however one participant suc-
cumbed to a “severe pyrogenic reaction”. el-Mougi 1994 reported
one death in the IVT group due to pneumonia and ileus. Sharifi
1985 reported seven deaths: two in the ORT group and five in the
IVT group. The cause of death was not reported although four of
the seven deaths occurred in participants below the third percentile
weight class. Mackenzie 1991 reported that no deaths occurred.
All reported deaths occurred in low-middle income countries (UN
Statistics).
Weight gain at discharge
There was no statistically significant difference in weight gain be-
tween treatment groups (WMD -26.33 g, 95% CI -206.92 to
154.26; 369 participants, 6 trials, Analysis 1.2), but there was
substantial heterogeneity (I2 90.8%). Nager 2002 reported means
but not standard deviations for weight gain; substituting the min-
imum and maximum standard deviation from the other trials did
not greatly influence the results. There was no statistically signif-
icant difference in percent weight gain between groups (WMD -
0.26%, 95% CI -1.56 to 1.05, I2 90.9%; 767 participants, 5 trials,
Analysis 1.3).
Length of hospital stay for inpatients
Children treated with ORT spent less time in hospital (WMD -
1.20 days, 95% CI -2.38 to -0.02, I2 95.1%; 526 participants,
6 trials, Analysis 1.4). This was no longer statistically significant
when we removed the outlying study (Gonzalez 1988).
Hyponatremia
The combined estimate of the two trials reporting on this did
not show a significant difference (RD 1%, 95% CI -13 to 15, I2
67.2%; 248 participants, Analysis 1.5).
Hypernatremia
The number of cases of hypernatremia was not statistically differ-
ent between treatments (RD 0%, 95% CI -1 to 1, I2 0%; 1062
participants, 10 trials, Analysis 1.6).
Duration of diarrhea
The mean length of diarrhea was not statistically different between
groups (WMD -5.90 h, 95% CI -12.70 to 0.89, I2 76.3%; 960
participants, 8 trials, Analysis 1.7).
Total fluid intake
Total fluid intake did not differ significantly between the two
groups at six hours after starting treatment (WMD 32.09 mL/
kg, 95% CI -26.69 to 90.88, I2 99.9%; 985 participants, 8 trials,
Analysis 1.8) or at 24 hours (73.45 mL/kg, 95% CI -31.78 to
178.69; I2 99.8%; 835 participants, 7 trials, Analysis 1.9). The
total fluid intake as measured in milliliters was also not significantly
different at six hours (152.00 mL, 95% CI -64.21 to 368.21;37
participants, 1 trial, Analysis 1.10).
Complications and adverse events
There were statistically significantly more children with paralytic
ileus in the ORT group when analyzed using the fixed-effect model
(RD 3%, 95% CI 1 to 5, IVT risk 0%; I2 43.8%; 670 participants,
2 trials) but not the random-effects model (RD 2%, 95% CI 0 to
5; Analysis 1.11). Thirty-three children (95% CI 20 to 100) need
to be treated with IVT rather than ORT to prevent one case of
paralytic ileus. The occurrence of phlebitis in the IVT group was
statistically significant (RD -2%, 95% CI -4 to -1, I2 0%; 877
participants, 5 trials, Analysis 1.11). Fifty children (95% CI 25 to
100) need to be treated with ORT rather than IVT to prevent one
case of phlebitis. The IVT risk for phlebitis was 2.5%. Incidences
of peri-orbital edema, seizures, and abdominal distention were
not statistically significantly different between groups (see Analysis
1.11).
Sodium intake and sodium levels
Sodium intake at six hours was not statistically significantly dif-
ferent between the ORT and IVT groups (WMD 5.80 mmol/
kg, 95% CI -1.48 to 13.07, I2 99%; 607 participants, 3 trials,
Analysis 1.12). Sodium levels at 24 hours were also not statistically
significantly different (WMD 1.25 mmol/kg, 95% CI -0.56 to
3.07, I2 88.5%; 992 participants, 7 trials, Analysis 1.13).
9Oral versus intravenous rehydration for treating dehydration due to gastroenteritis in children (Review)
Copyright © 2010 The Cochrane Collaboration. Published by John Wiley & Sons, Ltd.
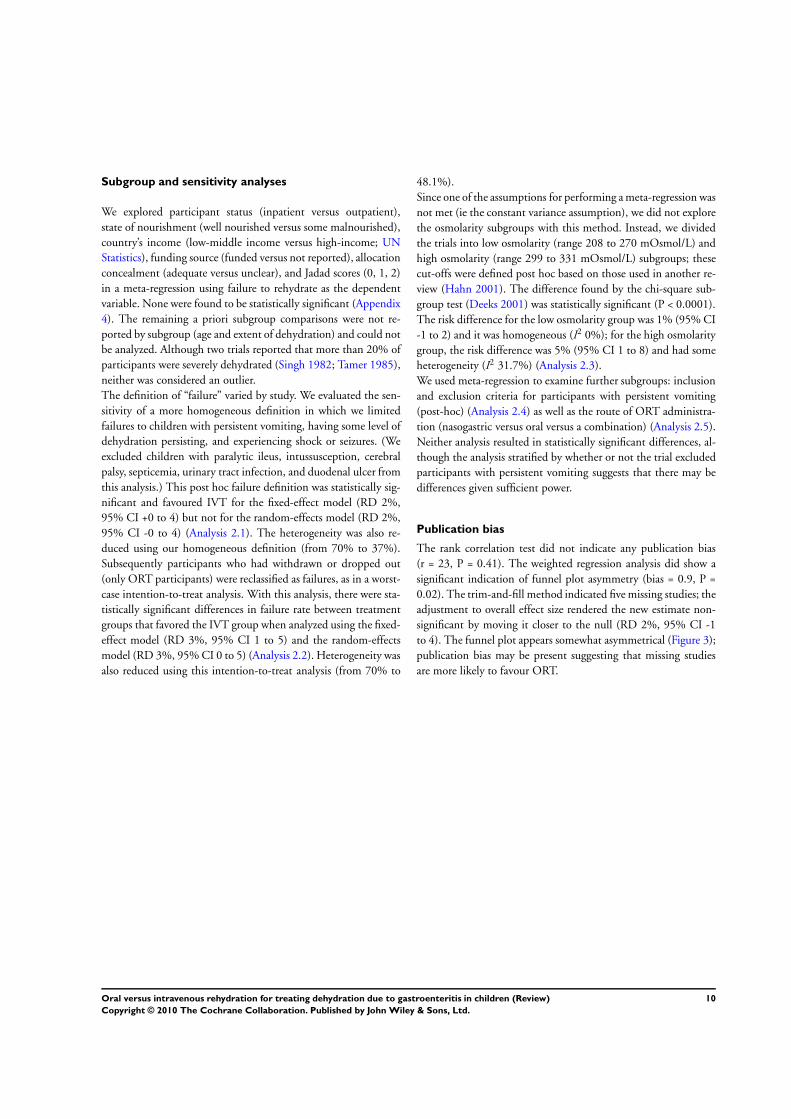
Subgroup and sensitivity analyses
We explored participant status (inpatient versus outpatient),
state of nourishment (well nourished versus some malnourished),
country’s income (low-middle income versus high-income; UN
Statistics), funding source (funded versus not reported), allocation
concealment (adequate versus unclear), and Jadad scores (0, 1, 2)
in a meta-regression using failure to rehydrate as the dependent
variable. None were found to be statistically significant (Appendix
4). The remaining a priori subgroup comparisons were not re-
ported by subgroup (age and extent of dehydration) and could not
be analyzed. Although two trials reported that more than 20% of
participants were severely dehydrated (Singh 1982; Tamer 1985),
neither was considered an outlier.
The definition of “failure” varied by study. We evaluated the sen-
sitivity of a more homogeneous definition in which we limited
failures to children with persistent vomiting, having some level of
dehydration persisting, and experiencing shock or seizures. (We
excluded children with paralytic ileus, intussusception, cerebral
palsy, septicemia, urinary tract infection, and duodenal ulcer from
this analysis.) This post hoc failure definition was statistically sig-
nificant and favoured IVT for the fixed-effect model (RD 2%,
95% CI +0 to 4) but not for the random-effects model (RD 2%,
95% CI -0 to 4) (Analysis 2.1). The heterogeneity was also re-
duced using our homogeneous definition (from 70% to 37%).
Subsequently participants who had withdrawn or dropped out
(only ORT participants) were reclassified as failures, as in a worst-
case intention-to-treat analysis. With this analysis, there were sta-
tistically significant differences in failure rate between treatment
groups that favored the IVT group when analyzed using the fixed-
effect model (RD 3%, 95% CI 1 to 5) and the random-effects
model (RD 3%, 95% CI 0 to 5) (Analysis 2.2). Heterogeneity was
also reduced using this intention-to-treat analysis (from 70% to
48.1%).
Since one of the assumptions for performing a meta-regression was
not met (ie the constant variance assumption), we did not explore
the osmolarity subgroups with this method. Instead, we divided
the trials into low osmolarity (range 208 to 270 mOsmol/L) and
high osmolarity (range 299 to 331 mOsmol/L) subgroups; these
cut-offs were defined post hoc based on those used in another re-
view (Hahn 2001). The difference found by the chi-square sub-
group test (Deeks 2001) was statistically significant (P < 0.0001).
The risk difference for the low osmolarity group was 1% (95% CI
-1 to 2) and it was homogeneous (I2 0%); for the high osmolarity
group, the risk difference was 5% (95% CI 1 to 8) and had some
heterogeneity (I2 31.7%) (Analysis 2.3).
We used meta-regression to examine further subgroups: inclusion
and exclusion criteria for participants with persistent vomiting
(post-hoc) (Analysis 2.4) as well as the route of ORT administra-
tion (nasogastric versus oral versus a combination) (Analysis 2.5).
Neither analysis resulted in statistically significant differences, al-
though the analysis stratified by whether or not the trial excluded
participants with persistent vomiting suggests that there may be
differences given sufficient power.
Publication bias
The rank correlation test did not indicate any publication bias
(r = 23, P = 0.41). The weighted regression analysis did show a
significant indication of funnel plot asymmetry (bias = 0.9, P =
0.02). The trim-and-fill method indicated five missing studies; the
adjustment to overall effect size rendered the new estimate non-
significant by moving it closer to the null (RD 2%, 95% CI -1
to 4). The funnel plot appears somewhat asymmetrical (Figure 3);
publication bias may be present suggesting that missing studies
are more likely to favour ORT.
10Oral versus intravenous rehydration for treating dehydration due to gastroenteritis in children (Review)
Copyright © 2010 The Cochrane Collaboration. Published by John Wiley & Sons, Ltd.
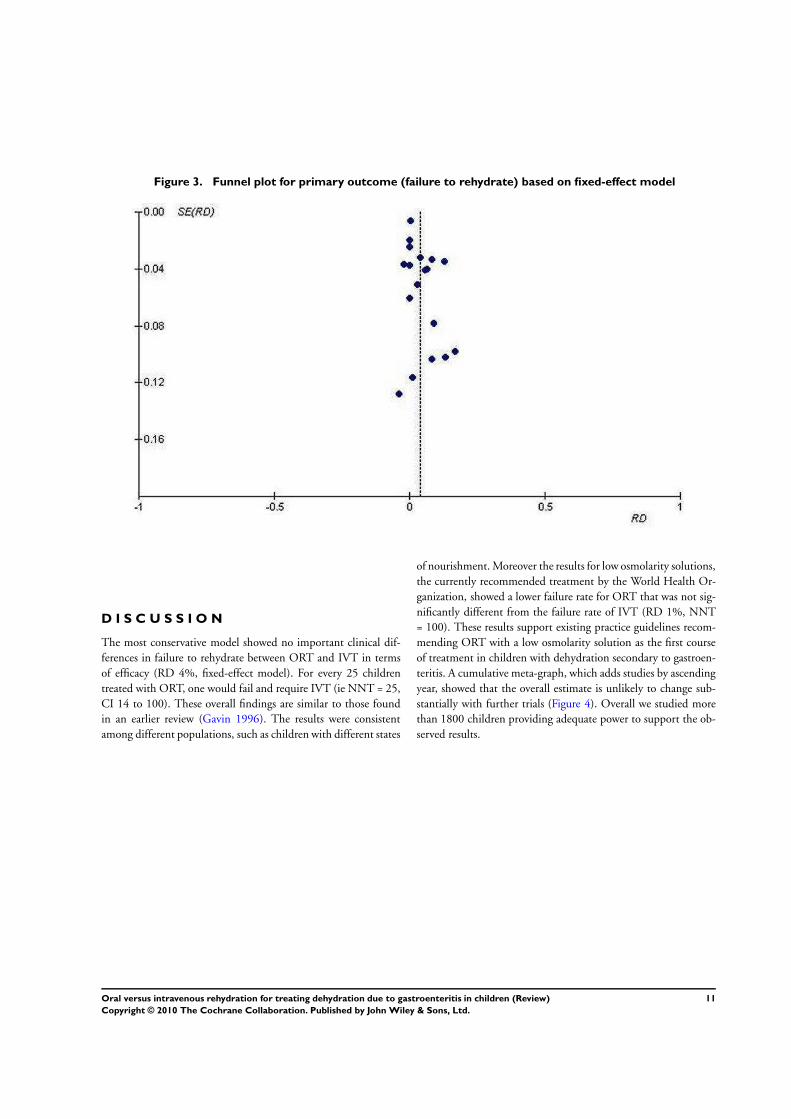
Figure 3. Funnel plot for primary outcome (failure to rehydrate) based on fixed-effect model
D I S C U S S I O N
The most conservative model showed no important clinical dif-
ferences in failure to rehydrate between ORT and IVT in terms
of efficacy (RD 4%, fixed-effect model). For every 25 children
treated with ORT, one would fail and require IVT (ie NNT = 25,
CI 14 to 100). These overall findings are similar to those found
in an earlier review (Gavin 1996). The results were consistent
among different populations, such as children with different states
of nourishment. Moreover the results for low osmolarity solutions,
the currently recommended treatment by the World Health Or-
ganization, showed a lower failure rate for ORT that was not sig-
nificantly different from the failure rate of IVT (RD 1%, NNT
= 100). These results support existing practice guidelines recom-
mending ORT with a low osmolarity solution as the first course
of treatment in children with dehydration secondary to gastroen-
teritis. A cumulative meta-graph, which adds studies by ascending
year, showed that the overall estimate is unlikely to change sub-
stantially with further trials (Figure 4). Overall we studied more
than 1800 children providing adequate power to support the ob-
served results.
11Oral versus intravenous rehydration for treating dehydration due to gastroenteritis in children (Review)
Copyright © 2010 The Cochrane Collaboration. Published by John Wiley & Sons, Ltd.
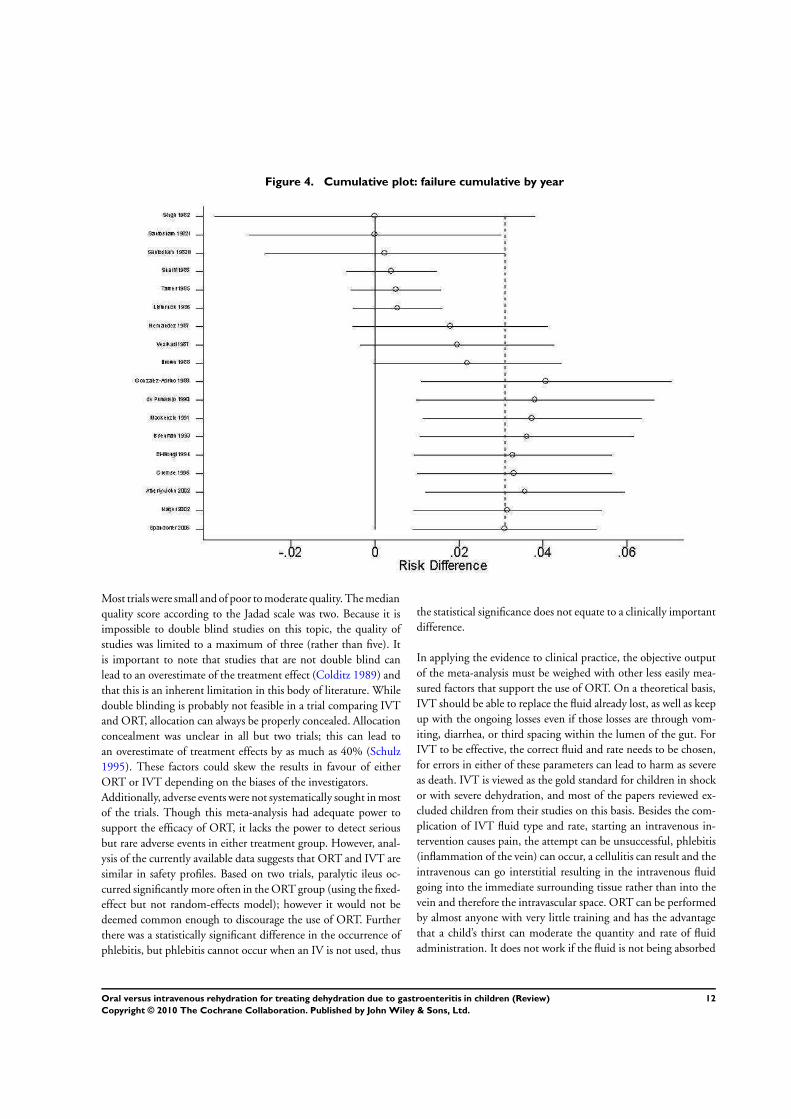
Figure 4. Cumulative plot: failure cumulative by year
Most trials were small and of poor to moderate quality. The median
quality score according to the Jadad scale was two. Because it is
impossible to double blind studies on this topic, the quality of
studies was limited to a maximum of three (rather than five). It
is important to note that studies that are not double blind can
lead to an overestimate of the treatment effect (Colditz 1989) and
that this is an inherent limitation in this body of literature. While
double blinding is probably not feasible in a trial comparing IVT
and ORT, allocation can always be properly concealed. Allocation
concealment was unclear in all but two trials; this can lead to
an overestimate of treatment effects by as much as 40% (Schulz
1995). These factors could skew the results in favour of either
ORT or IVT depending on the biases of the investigators.
Additionally, adverse events were not systematically sought in most
of the trials. Though this meta-analysis had adequate power to
support the efficacy of ORT, it lacks the power to detect serious
but rare adverse events in either treatment group. However, anal-
ysis of the currently available data suggests that ORT and IVT are
similar in safety profiles. Based on two trials, paralytic ileus oc-
curred significantly more often in the ORT group (using the fixed-
effect but not random-effects model); however it would not be
deemed common enough to discourage the use of ORT. Further
there was a statistically significant difference in the occurrence of
phlebitis, but phlebitis cannot occur when an IV is not used, thus
the statistical significance does not equate to a clinically important
difference.
In applying the evidence to clinical practice, the objective output
of the meta-analysis must be weighed with other less easily mea-
sured factors that support the use of ORT. On a theoretical basis,
IVT should be able to replace the fluid already lost, as well as keep
up with the ongoing losses even if those losses are through vom-
iting, diarrhea, or third spacing within the lumen of the gut. For
IVT to be effective, the correct fluid and rate needs to be chosen,
for errors in either of these parameters can lead to harm as severe
as death. IVT is viewed as the gold standard for children in shock
or with severe dehydration, and most of the papers reviewed ex-
cluded children from their studies on this basis. Besides the com-
plication of IVT fluid type and rate, starting an intravenous in-
tervention causes pain, the attempt can be unsuccessful, phlebitis
(inflammation of the vein) can occur, a cellulitis can result and the
intravenous can go interstitial resulting in the intravenous fluid
going into the immediate surrounding tissue rather than into the
vein and therefore the intravascular space. ORT can be performed
by almost anyone with very little training and has the advantage
that a child’s thirst can moderate the quantity and rate of fluid
administration. It does not work if the fluid is not being absorbed
12Oral versus intravenous rehydration for treating dehydration due to gastroenteritis in children (Review)
Copyright © 2010 The Cochrane Collaboration. Published by John Wiley & Sons, Ltd.
by the gut (paralytic ileus), and in some cases, the rate of diarrhea
increases as oral fluid rate increases so that the child remains in a
net negative fluid balance. Once the ORT is administered via a
nasogastric tube, some of the theoretical advantages of ORT dis-
appear, and some theoretical disadvantages need to be considered.
The child is no longer able to control the rate or amount of fluid
intake and so operator errors may occur just as they do with IVT.
Errors in placement of the nasogastric tube can occur; the most
severe of these is passing the nasogastric tube into the trachea so
that the fluid is going into the lungs rather than the stomach.
The passing of a nasogastric tube can result in a bleeding nose
and discomfort. The tube does not always pass easily on the first
attempt. There is evidence to suggest that ORT is less costly than
IVT and can be administered as rapidly (Nager 2002). A random-
ized controlled trial has demonstrated that the use of ORT in a
high-income country pediatric emergency department resulted in
statistically significantly lower costs, less time spent in the emer-
gency department, and a more favorable impression of caregivers
for this form of therapy (Atherly-John 2002).
Though there was little statistical heterogeneity between trials on
failure to rehydrate when the outlying trial was omitted (Gonzalez
1988) (I2 43%), there were important clinical variations and large
heterogeneity in most of the secondary outcomes. Rehydration
was accomplished at different rates, by different routes, and with
various solutions in different populations. Comparisons of differ-
ent oral rehydration solutions have been the subject of other re-
views (Fontaine 2000; Hahn 2001). A meta-analysis comparing
reduced osmolarity ORT (< 270 mOsmol/L) with the standard
solution (311 mOsmol/L) showed that unscheduled intravenous
infusion was statistically significantly less in the reduced osmolar-
ity group (odds ratio 0.59, 95% CI 0.45 to 0.79) (Hahn 2001).
Our post-hoc (between-study) analysis comparing low and high
osmolarity solutions supported these findings.
Another source of variation was the definition of “treatment fail-
ure”. We examined the effect of different treatment failure defini-
tions through a post hoc refined definition analysis and found that
it reduced heterogeneity and the therapeutic benefits of IVT as
compared with ORT (from 4% to 2%). The intention-to-treat ver-
sion of this model involved reclassifying seven ORT withdrawals
as failures; this model also reduced heterogeneity and benefits for
IVT (from 4% to 3%). If the seven withdrawals were systemati-
cally related to treatment benefit, then this intention-to-treat anal-
ysis is less biased.
One trial had a statistically significantly greater failure rate
(Gonzalez 1988). The trial authors attributed it to the fact that
many of the children who failed were younger than six months of
age. (This trial was the only one to include neonates.) The authors
argued that the burden of illness can be more severe in younger
infants. Our data neither prove nor disprove this statement. When
we removed this trial from the analysis, the remaining trial results
were homogeneous and the overall risk difference shifted towards
the null.
The results may not be generalizable to all children with dehydra-
tion secondary to gastroenteritis but may be generalizable only to
those with dehydration secondary to diarrhea. The reader must
also recognize that most of the trials excluded children in shock,
severe dehydration, and paralytic ileus since IVT is the indicated
treatment for these clinical scenarios. A post hoc look between
trials with different inclusion and exclusion criteria suggests that
there may be an important difference in response to ORT among
participants that vomited and did not vomit. The risk difference
for trials that excluded participants with persistent vomiting was
0% (95% CI -3 to 3) as compared with 4% (95% CI -5 to 13) in
trials that did not exclude such participants (Analysis 01.17). The
issue of how vomiting affects the efficacy of ORT needs further
study. However, in practice treatment failure only means than one
switches to IVT.
A U T H O R S ’ C O N C L U S I O N SImplications for practice
There were no important clinical differences between ORT and
IVT for rehydration secondary to acute gastroenteritis in children.
It seems reasonable that children presenting for medical care with
mild to moderate dehydration secondary to acute gastroenteritis
should initially be treated with ORT. Should treatment fail, then
IVT may be used. In children who have persistent vomiting, ORT
may be used, but the child must be closely observed for proof of
successful treatment.
For every 25 children treated with ORT, one would fail and re-
quire IVT. Clinicians and families need to apply this evidence to
individual situations in order to decide whether they are willing
to accept this minimal risk.
Implications for research
Further research comparing ORT and IVT for children with de-
hydration secondary to gastroenteritis is not warranted and may
be unethical. If undertaken, further research should focus on eval-
uating the efficacy of nasogastric rehydration in children who have
persistent vomiting.
A C K N O W L E D G E M E N T S
We thank Ellen Crumley, Marlene Dorgan, and Carol Friesen for
their assistance with searching, Ben Vandermeer for assistance re-
running the statistical analysis, and Maria Ospina for assistance
with interpretation of Spanish articles. The editorial base for the
Cochrane Infectious Diseases Group is funded by the UK Depart-
ment for International Development (DFID) for the benefit of
developing countries.
13Oral versus intravenous rehydration for treating dehydration due to gastroenteritis in children (Review)
Copyright © 2010 The Cochrane Collaboration. Published by John Wiley & Sons, Ltd.
R E F E R E N C E S
References to studies included in this review
Atherly-John 2002 {published data only}
Atherly-John YC, Cunningham SJ, Crain EF. A randomized
trial of oral vs intravenous rehydration in a pediatric
emergency department. Archives of Pediatrics & Adolescent
Medicine 2002;156(12):1240–3.
Brown 1988 {published data only}
Brown KH, Gastanaduy AS, Saavedra JM, Lembcke J, Rivas
D, Robertson AD, et al.Effect of continued oral feeding
on clinical and nutritional outcomes of acute diarrhea in
children. Journal of Pediatrics 1988;112(2):191–200.
de Pumarejo 1990 {published data only}
de Pumarejo MM, Lugo CE, Alvarez-Ruiz JR, Colon-
Santini JL. Oral rehydration: experience in the management
of patients with acute gastroenteritis in the emergency
room at the Dr. Antonio Ortiz pediatric hospital
[Rehidratacion oral: experiencia en el manejo de pacientes
con gastroenteritis auguda en la sala de emergencia hospital
pediatrico Dr. Antonio Ortiz]. Boletin de la Asociacion
Medica de Puerto Rico 1990;82(5):227–33.
el-Mougi 1994 {published data only}
el-Mougi M, el-Akkad N, Hendawi A, Hassan M, Amer A,
Fontaine O, et al.Is a low-osmolarity ORS solution more
efficacious than standard WHO ORS solution?. Journal of
Pediatric Gastroenterology and Nutrition 1994;19(1):83–6.
Gonzalez 1988 {published data only}
Gonzalez-Adriano SR, Valdes-Garza HE, Garcia-Valdes LC.
Oral hydration versus intravenous hydration in patients
with acute diarrhea. Boletin Medico del Hospital Infantil de
Mexico 1988;45(3):165–72.
Gremse 1995 {published data only}
Gremse DA. Effectiveness of nasogastric rehydration
in hospatilized children with acute diarrhea. Jouranl of
Pediatric Gastroenterology and Nutrition 1995;21(2):145–8.
Hernandez 1987 {published data only}
Hernandez A, Jaramillo C, Ramirez R, Gomez G, Franco
D. Treatment of acute diarrhea in children. Comparative
study of three oral rehydration solutions and I.V. therapy in
Colombia [Tratamiento de diarrea aguda en ninos. Estudio
comparativo de tres soluciones de rehidratacion oral y
venoclisis en Colombia]. Boletin de la Oficina Sanitaria
Panamericana 1987;102(6):606–16.
Issenman 1993 {published data only}
Issenman RM, Leung AK. Oral and intravenous rehydration
of children. Canadian Family Physician 1993;39:2129–36.
Listernick 1986 {published data only}
Listernick R, Zieserl E, Davis AT. Outpatient oral
rehydration in the United States. American Journal of
Disease in Childhood 1986;140(3):211–5.
Mackenzie 1991 {published data only}
Mackenzie A, Barnes G. Randomised controlled trial
comparing oral and intravenous rehydration therapy in
children with diarrhoea. BMJ 1991;303(6799):393–6.
Nager 2002 {published data only}
Nager AL, Wang VJ. Comparison of nasogastric and
intravenous methods of rehydration in pediatric patients
with acute dehydration. Pediatrics 2002;109(4):566–72.
Santosham 1982i {published data only}
Santosham M, Daum RS, Dillman L, Rodriguez JL, Luque
S, Russell R, et al.Oral rehydration therapy of infantile
diarrhea: a controlled study of well-nourished children
hospitalized in the United States and Panama. New England
Journal of Medicine 1982;306(18):1070–6.
Santosham 1982ii {published data only}
Santosham M, Daum RS, Dillman L, Rodriguez JL, Luque
S, Russell R, et al.Oral rehydration therapy of infantile
diarrhea: a controlled study of well-nourished children
hospitalized in the United States and Panama. New England
Journal of Medicine 1982;306(18):1070–6.
Sharifi 1985 {published data only}
Sharifi J, Ghavami F, Z Nowrouzi, Fouladvand B, Malek
M, Rezaeian M, et al.Oral versus intravenous reheydration
therapy in severe gastroenteritis. Archives of Disease in
Childhood 1985;60(9):856–60.
Singh 1982 {published data only}
Singh M, Mahmoodi A, Arya LJ, Azamy S. Controlled trial
of oral versus intravenous rehydration in the management
of acute gastroenteritis. Indian Journal of Medical Research
1982;75:691–3.
Spandorfer 2005 {published data only}
Spandorfer PR, Alessandrini EA, Joffe MD, Localio R, Shaw
KN. Oral versus intravenous rehydration of moderately
dehydrated children: a randomized, controlled trial.
Pediatrics 2005;115(2):295–301.
Tamer 1985 {published data only}
Ross MB. Erratum: Oral rehydration. Journal of Pediatrics
1986;108(1):160.
Tamer AM, Friedman LB, Maxwell SRW, Cynamon HA,
Perez HN, Cleveland WW. Oral rehydration of infants in a
large urban U.S. medical center. Journal of Pediatrics 1985;
107(1):14–9.
Vesikari 1987 {published data only}
Vesikari T, Isolauri E, Baer M. A comparative trial of rapid
oral and intravenous rehydration in acute diarrhoea. Acta
Paediatria Scandanavia 1987;76(2):300–5.
References to studies excluded from this review
Alam 1987 {published data only}
Alam AN, Sarker SA, Molla AM, Rahaman MM, Greenough
III WB. Hydrolysed wheat based oral rehydration solution
for acute diarrhoea. Archives of Disease in Childhood 1987;
62(5):440–4.
Carpenter 1982 {published data only}
Carpenter CC. Oral rehydration: is it as good as parenteral
therapy?. New England Journal of Medicine 1982;306(18):
1103–4.
14Oral versus intravenous rehydration for treating dehydration due to gastroenteritis in children (Review)
Copyright © 2010 The Cochrane Collaboration. Published by John Wiley & Sons, Ltd.
Gavin 1996 {published data only}
Gavin N, Merrick N, Davidson B. Efficacy of glucose-based
oral rehydration therapy. Pediatrics 1996;98(1):45–51.
Hirschhorn 1972 {published data only}
Hirschhorn N, Cash RA, Woodward WE, Spivey GH.
Oral fluid therapy of Apache children with acute infectious
diarrhoea. Lancet 1972;2(7766):15–8.
Isolauri 1985 {published data only}
Isolauri E, Vesikari T. Oral rehydration, rapid feeding, and
cholestyramine for treatment of acute diarrhea. Journal of
Pediatric Gastroenterology and Nutrition 1985;4(3):366–74.
Jan 1997 {published data only}
Jan A, Rafi M, Mustafa S, Rasmussen ZA, Thobani S,
Badruddin SH. Evaluation of dowdo (wheat-milk gruel) in
children with acute diarrhoea. Jouranl of Pakistan Medical
Association 1997;47(1):12–6.
Kist-van Holthe 1999 {published data only}
Kist-van Holthe JE, van der Heijden AJ. Dehydration due
to gastroenteritis in children [Dehydratie ten gevolge van
gastro–enteritis bij kinderen]. Nederlands Tijdschrift Voor
Geneeskunde 1999;143(4):193–6.
Klish 1985 {published data only}
Klish WJ. Use of oral fluids in treatment of diarrhea.
Pediatrics in Review 1985;7(1):27–30.
Lexomboon 1994 {published data only}
Lexomboon U, Harikul S, Lortholary O. Control
randomized study of rehydration/rehydration with
dioctahedral smectite in ambulatory Thai infants with acute
diarrhea. Southeast Asian Journal of Tropical Medicine and
Public Health 1994;25(1):157–62.
Mackenzie 1988 {published data only}
Mackenzie A, Barnes G. Oral rehydration in infantile
diarrhoea in the developed world. Drugs 1988;36 Suppl 4:
48–60.
Mackenzie 1989 {published data only}
Mackenzie A, Barnes G, Shann F. Clinical signs of
dehydration in children. Lancet 1989;2(8663):605–7.
Mahalanabis 1972 {published data only}
Mahalanabis P, Brayton JB, Mondal A, Pierce NF. The use
of Ringer’s lactate in the treatment of children with cholera
and acute noncholera diarrhoea. Bulletin of the World Health
Organization 1972;46(3):311–9.
Orenstein 1986 {published data only}
Orenstein SR. Enteral versus parenteral therapy for
intractable diarrhea of infancy: a prospective, randomized
trial. The Journal of Pediatrics 1986;109(2):277–86.
Patra 1989 {published data only}
Patra FC, Sack DA, Islam A, Alam AN, Mazumder RN.
Oral rehydration formula containing alanine and glucose
for treatment of diarrhoea: a controlled trial. BMJ 1989;
298(6684):1353–6.
Rautanen 1993 {published data only}
Rautanen T, el-Radhi S, Vesikari T. Clinical experience with
a hypotonic oral rehydration solution in acute diarrhoea.
Acta Paediatricia 1993;82(1):52–4.
Reid 1996 {published data only}
Reid SR, Bonadio WA. Outpatient rapid intravenous
rehydration to correct dehydration and resolve vomiting in
children with acute gastroenteritis. Annals of Emergency
Medicine 1996;28(3):318–23.
Samadi 1983 {published data only}
Samadi AR, Islam R, Huq MI. Replacement of intravenous
therapy by oral rehydration solution in a large treatment
centre for diarrhoea with dehydration. Bulletin of the World
Health Organization 1983;61(3):471–6.
Sarker 1995 {published data only}
Sarker SA, Majid N, Mahalanabis D. Alanine- and glucose-
based hypo-osmolar oral rehydration solution in infants
with persistent diarrhoea: a controlled trial. Acta Paediatria
1985;84(7):775–80.
Srivastava 1985 {published data only}
Srivastava VK, Arya H, Uppal SS, Rath B, Laisram N.
Comparison of oral and intravenous rehydration among
hospitalized children with acute diarrhoea. Journal of
Diarrhoea Disease Research 1985;3(2):92–5.
Tripp 1980 {published data only}
Tripp JH, Harries JT. UNICEF/W.H.O. glucose electrolyte
solution not always appropriate. Lancet 1980;2(8198):793.
Weizman 1983 {published data only}
Weizman Z, Schmueli A, Deckelbaum RJ. Continuous
nasogastric drip elemental feeding. Alternative for
prolonged parenteral nutrition in severe prolonged diarrhea.
American Journal of Disease in Childhood 1983;137(3):
253–5.
Additional references
AAP 1996
American Academy of Pediatrics, Provisional committee
on quality improvement, Subcommittee on acute
gastroenteritis. Practice parameter: the management of
acute gastroenteritis in young children. Pediatrics 1996;97
(3):424–35.
Armon 2000
Armon K, Elliott EJ. Acute gastroenteritis. In: Moyer VA,
Elliott EJ, Davis RL, Gilbert R, Klassen T, Logan S, Mellis
C, Williams K editor(s). Evidence based pediatrics and child
health. 1st Edition. London: BMJ Books, 2000:273–86.
Baldassano 1991
Baldassano RN. Chronic diarrhea. A practical approach for
the pediatrician. Pediatric Clinics of North America 1991;38
(3):667–86.
Begg 1994
Begg CB, Mazumdar M. Operating characteristics of a rank
correlation test for publication bias. Biometrics 1994;50(4):
1088–101.
Bern 1992
Bern C, Martines J, de Zoysa I, Glass RI. The magnitude
of the global problem of diarrhoeal disease: a ten-year
update. Bulletin of the World Health Organization 1992;70
(6):705–14.
15Oral versus intravenous rehydration for treating dehydration due to gastroenteritis in children (Review)
Copyright © 2010 The Cochrane Collaboration. Published by John Wiley & Sons, Ltd.
Colditz 1989
Colditz GA, Miller JN, Mosteller F. How study design
affects outcomes in comparisons of therapy. I: Medical.
Statistics in Medicine 1989;8(4):411–54.
DARE 2002
Efficacy of glucose-based oral rehydration therapy. [Abstract
961213] Database of Abstracts of Reviews of Effectiveness.
Abstract of Gavin N, Merrick N, Davidson B. Efficacy of
glucose-based oral rehydration therapy. Pediatrics. 1996.
98(1). 45-51. The Cochrane Library 2004, Issue 1.
Deeks 2001
Deeks JJ, Altman DG, Bradburn MJ. Statistical methods
for examining heterogeneity and combining results from
several studies in meta-analysis. In: Egger M, Davey Smith
G, Altman DG editor(s). Systematic reviews in health care:
meta-analysis in context. 2nd Edition. London: BMJ Books,
2001:300.
Duggan 1992
Duggan C, Santosham M, Glass RI. The management of
acute diarrhea in children: oral rehydration, maintenance,
and nutritional therapy. Centers for Disease Control and
Prevention. MMWR. Recommendations and reports 1992;41
(RR-16):1–20.
Duval 2001
Duval S, Tweedie R. Trim and fill: A simple funnel-plot-
based method of testing and adjusting for publication bias
in meta-analysis. Biometrics 2001;56(2):455–63.
Egger 1997
Egger M, Davey Smith G, Schneider M, Minder C. Bias
in meta-analysis detected by a simple, graphical test. BMJ
1997;315(7109):629–34.
Fonseca 2004
Fonseca BK, Holdgate A, Craig JC. Enteral vs intravenous
rehydration therapy for children with gastroenteritis: a
meta-analysis of randomized controlled trials. Archives of
Pediatrics & Adolescent Medicine 2004;158(5):483–90.
Fontaine 2000
Fontaine O, Gore SM, Pierce NF. Rice-based oral
rehydration solution for treating diarrhoea. Cochrane
Database of Systematic Reviews 2000, Issue 2. [DOI:
10.1002/14651858.CD001264.pub2]
Gangarosa 1992
Gangarosa RE, Glass RI, Lew JF, Boring JR. Hospitalizations
involving gastroenteritis in the United States, 1985: the
special burden of the disease among the elderly. American
Journal of Epidemiology 1992;135(3):281–90.
Garland 1992
Garland FS, Dunne WM Jr, Havens P, Hintermeyer M,
Bozzette MA, Wincek J, et al.Peripheral intravenous
catheter complications in critically ill children: a prospective
study. Pediatrics 1992;89(6 Pt 2):1145–50.
Glass 1991
Glass RI, Lew JF, Gangarosa RE, LeBaron CW, Ho MS.
Estimates of morbidity and mortality rates for diarrheal
diseases in American children. Journal of Pediatrics 1991;
118(4 (Pt 2)):S27–33.
Goepp 1993
Goepp JG, Katz SA. Oral rehydration therapy. American
Family Physician 1993;47(4):843–51.
Hahn 2001
Hahn S, Kim Y, Garner P. Reduced osmolarity oral
rehydration solution for treating dehydration due to
diarrhoea in children: systematic review. BMJ 2001;323
(7304):81–5.
Higgins 2003
Higgins JP, Thompson SG, Deeks JJ, Altman DG.
Measuring inconsistency in meta-analyses. BMJ 2003;327
(7414):557–60.
Higgins 2005a
Higgins JPT, Green S, editors. Measures of relative effect:
the risk ratio and odds ratio. Cochrane Handbook for
Systematic Reviews of Interventions 8.2.1.2 [updated May
2005]; Section 8. www.cochrane.org/resources/handbook/
hbook.htm. Chichester, UK: John Wiley & Sons, Ltd.,
(accessed 14 February 2006).
Higgins 2005b
Higgins J, Green S, editors. Highly sensitive search
strategies for identifying reports of randomized controlled
trials in MEDLINE. Cochrane Handbook for Systematic
Reviews of Interventions 4.2.5 [updated May 2005];
Appendix 5b. www.cochrane.org/resources/handbook/
hbook.htm (accessed 1 March 2006).
Jadad 1996
Jadad AR, Moore RA, Carroll D, Jenkinson C, Reynolds
DJM, Gavaghan DJ, et al.Assessing the quality of reports of
randomized clinical trials: is blinding necessary?. Controlled
Clinical Trials 1996;17(1):1–12.
Oxman 1991
Oxman A, Guyatt GH. Validation of an index of the quality
of review articles. Journal of Clinical Epidemiology 1991;44
(11):1271–8.
Ozuah 2002
Ozuah PO, Avner JR, Stein RE. Oral rehydration,
emergency physicians, and practice parameters: a national
survey. Pediatrics 2002;109(2):259–61.
Review Manager 4.2
The Nordic Cochrane Centre, The Cochrane Collaboration.
Review Manager (RevMan). 4.2 for Windows.
Copenhagen: The Nordic Cochrane Centre, The Cochrane
Collaboration, 2003.
Santosham 1991
Santosham M, Greenough WB 3rd. Oral rehydration
therapy: a global perspective. Journal of Pediatrics 1991;4(4
(Pt 2)):S44–51.
Schulz 1995
Schulz KF, Chalmers I, Hayes RJ, Altman DG. Empirical
evidence of bias. Dimensions of methodological quality
associated with estimates of treatment effects in controlled
trials. JAMA 1995;273(5):408–12.
16Oral versus intravenous rehydration for treating dehydration due to gastroenteritis in children (Review)
Copyright © 2010 The Cochrane Collaboration. Published by John Wiley & Sons, Ltd.
Snyder 1991
Snyder JD. Use and misuse of oral therapy for diarrhea:
comparison of US practices with American Academy of
Pediatrics recommendations. Pediatrics 1991;87(1):28–33.
Stata 7.0
Stata Corporation. Intercooled Stata 7.0. for Windows 98/
95/NT. College Station, Texas: Stata Corporation.
UN Statistics
United Nations Statistics Division. Economic trade
and other groupings of countries or areas. New York,
NY: United Nations Statistics Division. www.un.org/
Depts/unsd/methods/m49groupe.htm#ldcs (accessed 14
November 14 2001).
WHO 1996
World Health Organization. The challenge of diarrhoeal
and acute respiratory disease control. Point of Fact No 77.
Geneva: World Health Organization, 1996:1–4.
WHO 2000
World Health Organization, Child and Adolescent
Health and Development. Child health epidemiology.
www.who.int/child-adolescent-health/overview/
child health/child epidemiology.htm (accessed 6 May
2002).
WHO 2002
World Health Organization, Dept. of Child and Adolescent
Health and Development. Reduced osmolarity : oral
rehydration salts (ORS) formulation : a report from a meeting
of experts jointly organised by UNICEF and WHO : UNICEF
house, New York, USA, 18 July 2001 [WHO/FCH/CAH/
01.22]. Geneva: World Health Organization, 2002.∗ Indicates the major publication for the study
17Oral versus intravenous rehydration for treating dehydration due to gastroenteritis in children (Review)
Copyright © 2010 The Cochrane Collaboration. Published by John Wiley & Sons, Ltd.
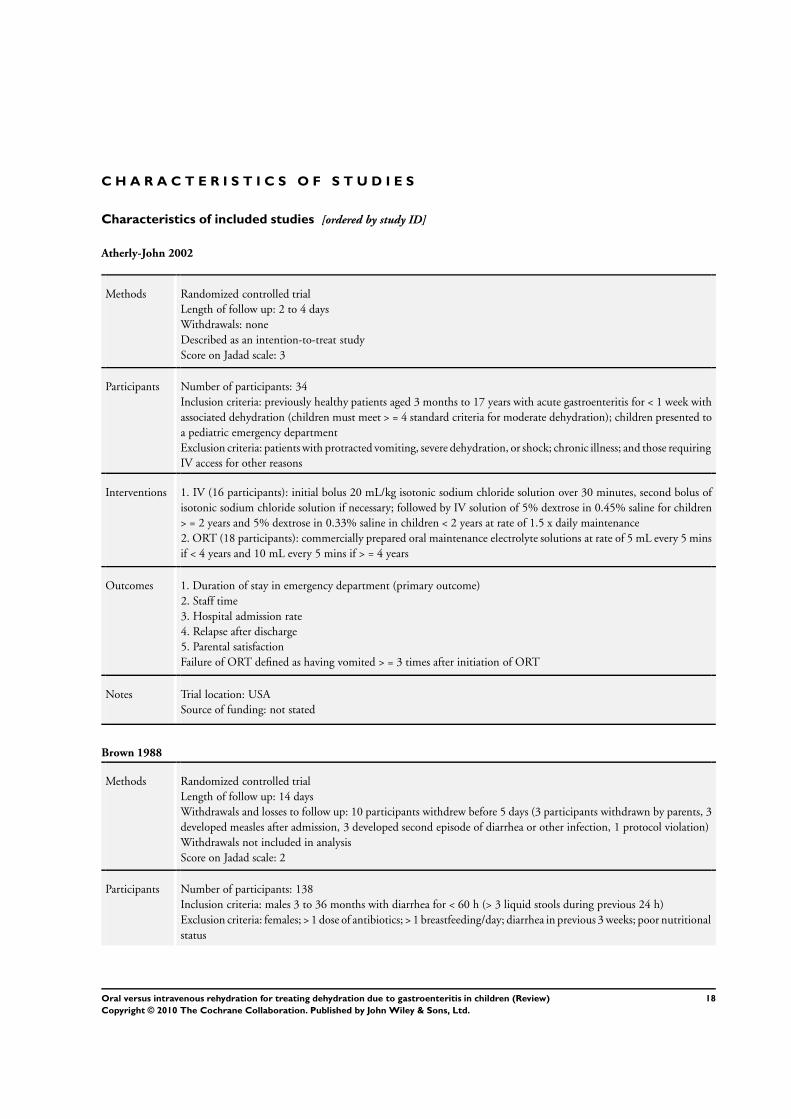
C H A R A C T E R I S T I C S O F S T U D I E S
Characteristics of included studies [ordered by study ID]
Atherly-John 2002
Methods Randomized controlled trial
Length of follow up: 2 to 4 days
Withdrawals: none
Described as an intention-to-treat study
Score on Jadad scale: 3
Participants Number of participants: 34
Inclusion criteria: previously healthy patients aged 3 months to 17 years with acute gastroenteritis for < 1 week with
associated dehydration (children must meet > = 4 standard criteria for moderate dehydration); children presented to
a pediatric emergency department
Exclusion criteria: patients with protracted vomiting, severe dehydration, or shock; chronic illness; and those requiring
IV access for other reasons
Interventions 1. IV (16 participants): initial bolus 20 mL/kg isotonic sodium chloride solution over 30 minutes, second bolus of
isotonic sodium chloride solution if necessary; followed by IV solution of 5% dextrose in 0.45% saline for children
> = 2 years and 5% dextrose in 0.33% saline in children < 2 years at rate of 1.5 x daily maintenance
2. ORT (18 participants): commercially prepared oral maintenance electrolyte solutions at rate of 5 mL every 5 mins
if < 4 years and 10 mL every 5 mins if > = 4 years
Outcomes 1. Duration of stay in emergency department (primary outcome)
2. Staff time
3. Hospital admission rate
4. Relapse after discharge
5. Parental satisfaction
Failure of ORT defined as having vomited > = 3 times after initiation of ORT
Notes Trial location: USA
Source of funding: not stated
Brown 1988
Methods Randomized controlled trial
Length of follow up: 14 days
Withdrawals and losses to follow up: 10 participants withdrew before 5 days (3 participants withdrawn by parents, 3
developed measles after admission, 3 developed second episode of diarrhea or other infection, 1 protocol violation)
Withdrawals not included in analysis
Score on Jadad scale: 2
Participants Number of participants: 138
Inclusion criteria: males 3 to 36 months with diarrhea for < 60 h (> 3 liquid stools during previous 24 h)
Exclusion criteria: females; > 1 dose of antibiotics; > 1 breastfeeding/day; diarrhea in previous 3 weeks; poor nutritional
status
18Oral versus intravenous rehydration for treating dehydration due to gastroenteritis in children (Review)
Copyright © 2010 The Cochrane Collaboration. Published by John Wiley & Sons, Ltd.
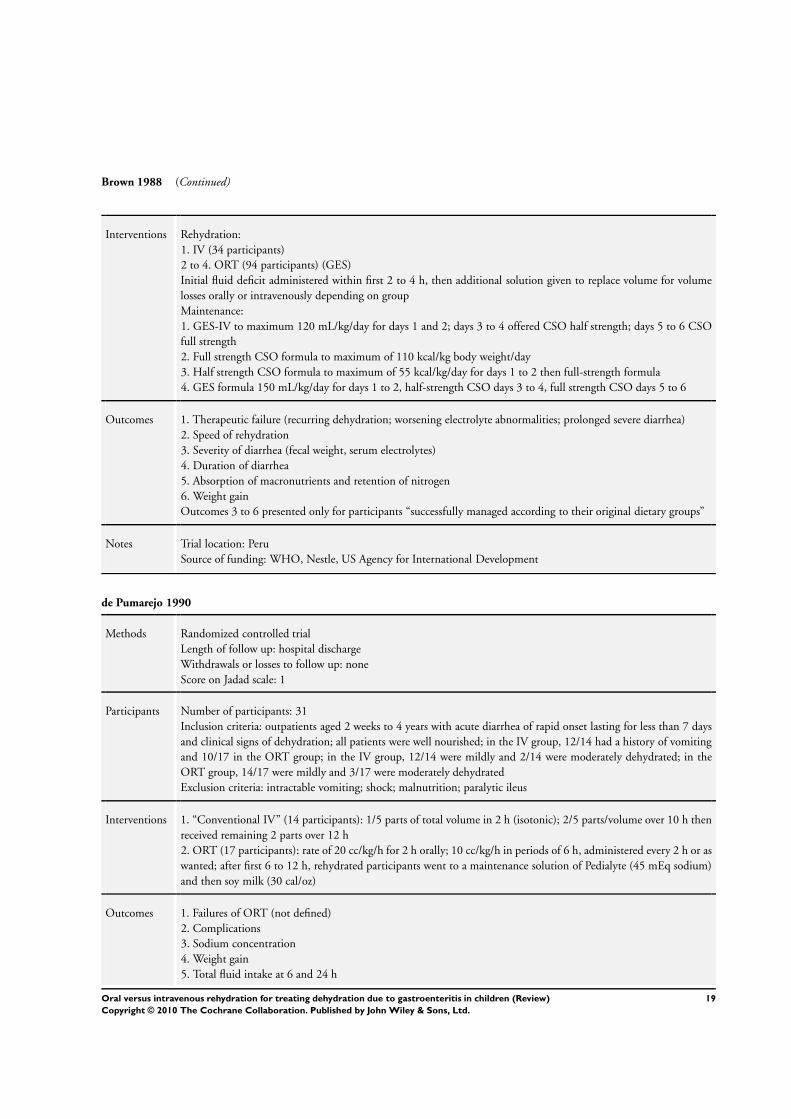
Brown 1988 (Continued)
Interventions Rehydration:
1. IV (34 participants)
2 to 4. ORT (94 participants) (GES)
Initial fluid deficit administered within first 2 to 4 h, then additional solution given to replace volume for volume
losses orally or intravenously depending on group
Maintenance:
1. GES-IV to maximum 120 mL/kg/day for days 1 and 2; days 3 to 4 offered CSO half strength; days 5 to 6 CSO
full strength
2. Full strength CSO formula to maximum of 110 kcal/kg body weight/day
3. Half strength CSO formula to maximum of 55 kcal/kg/day for days 1 to 2 then full-strength formula
4. GES formula 150 mL/kg/day for days 1 to 2, half-strength CSO days 3 to 4, full strength CSO days 5 to 6
Outcomes 1. Therapeutic failure (recurring dehydration; worsening electrolyte abnormalities; prolonged severe diarrhea)
2. Speed of rehydration
3. Severity of diarrhea (fecal weight, serum electrolytes)
4. Duration of diarrhea
5. Absorption of macronutrients and retention of nitrogen
6. Weight gain
Outcomes 3 to 6 presented only for participants “successfully managed according to their original dietary groups”
Notes Trial location: Peru
Source of funding: WHO, Nestle, US Agency for International Development
de Pumarejo 1990
Methods Randomized controlled trial
Length of follow up: hospital discharge
Withdrawals or losses to follow up: none
Score on Jadad scale: 1
Participants Number of participants: 31
Inclusion criteria: outpatients aged 2 weeks to 4 years with acute diarrhea of rapid onset lasting for less than 7 days
and clinical signs of dehydration; all patients were well nourished; in the IV group, 12/14 had a history of vomiting
and 10/17 in the ORT group; in the IV group, 12/14 were mildly and 2/14 were moderately dehydrated; in the
ORT group, 14/17 were mildly and 3/17 were moderately dehydrated
Exclusion criteria: intractable vomiting; shock; malnutrition; paralytic ileus
Interventions 1. “Conventional IV” (14 participants): 1/5 parts of total volume in 2 h (isotonic); 2/5 parts/volume over 10 h then
received remaining 2 parts over 12 h
2. ORT (17 participants): rate of 20 cc/kg/h for 2 h orally; 10 cc/kg/h in periods of 6 h, administered every 2 h or as
wanted; after first 6 to 12 h, rehydrated participants went to a maintenance solution of Pedialyte (45 mEq sodium)
and then soy milk (30 cal/oz)
Outcomes 1. Failures of ORT (not defined)
2. Complications
3. Sodium concentration
4. Weight gain
5. Total fluid intake at 6 and 24 h
19Oral versus intravenous rehydration for treating dehydration due to gastroenteritis in children (Review)
Copyright © 2010 The Cochrane Collaboration. Published by John Wiley & Sons, Ltd.
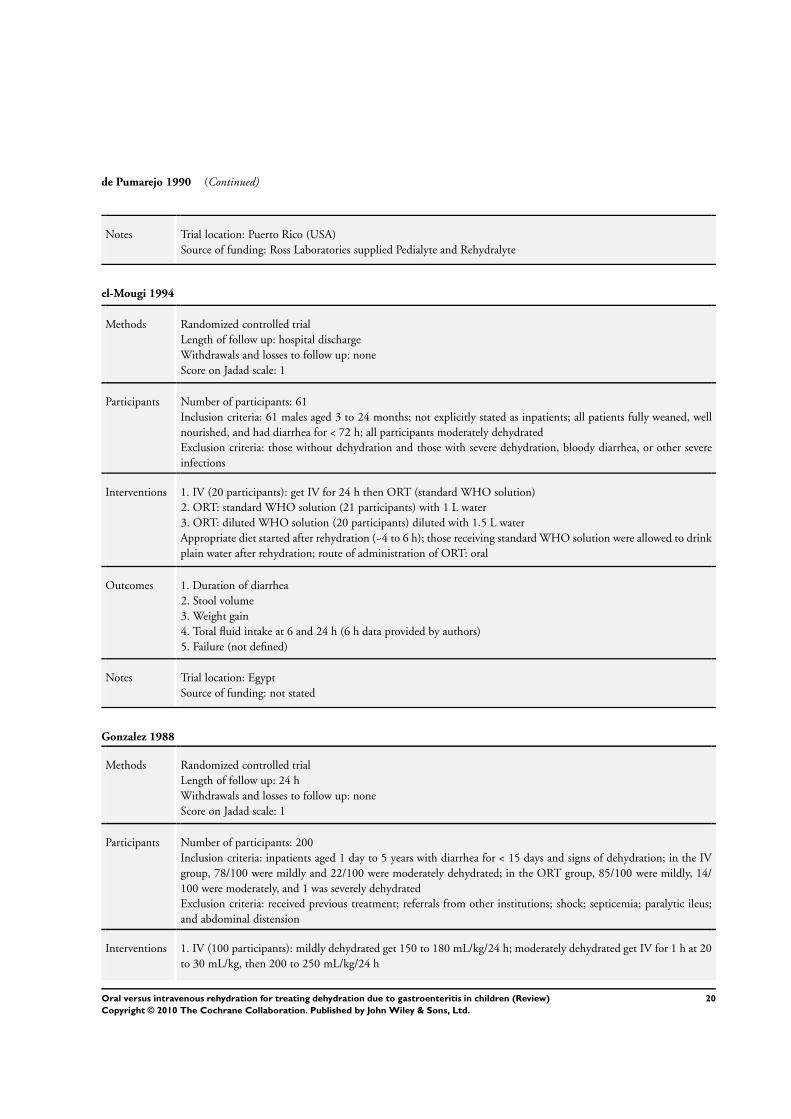
de Pumarejo 1990 (Continued)
Notes Trial location: Puerto Rico (USA)
Source of funding: Ross Laboratories supplied Pedialyte and Rehydralyte
el-Mougi 1994
Methods Randomized controlled trial
Length of follow up: hospital discharge
Withdrawals and losses to follow up: none
Score on Jadad scale: 1
Participants Number of participants: 61
Inclusion criteria: 61 males aged 3 to 24 months; not explicitly stated as inpatients; all patients fully weaned, well
nourished, and had diarrhea for < 72 h; all participants moderately dehydrated
Exclusion criteria: those without dehydration and those with severe dehydration, bloody diarrhea, or other severe
infections
Interventions 1. IV (20 participants): get IV for 24 h then ORT (standard WHO solution)
2. ORT: standard WHO solution (21 participants) with 1 L water
3. ORT: diluted WHO solution (20 participants) diluted with 1.5 L water
Appropriate diet started after rehydration (~4 to 6 h); those receiving standard WHO solution were allowed to drink
plain water after rehydration; route of administration of ORT: oral
Outcomes 1. Duration of diarrhea
2. Stool volume
3. Weight gain
4. Total fluid intake at 6 and 24 h (6 h data provided by authors)
5. Failure (not defined)
Notes Trial location: Egypt
Source of funding: not stated
Gonzalez 1988
Methods Randomized controlled trial
Length of follow up: 24 h
Withdrawals and losses to follow up: none
Score on Jadad scale: 1
Participants Number of participants: 200
Inclusion criteria: inpatients aged 1 day to 5 years with diarrhea for < 15 days and signs of dehydration; in the IV
group, 78/100 were mildly and 22/100 were moderately dehydrated; in the ORT group, 85/100 were mildly, 14/
100 were moderately, and 1 was severely dehydrated
Exclusion criteria: received previous treatment; referrals from other institutions; shock; septicemia; paralytic ileus;
and abdominal distension
Interventions 1. IV (100 participants): mildly dehydrated get 150 to 180 mL/kg/24 h; moderately dehydrated get IV for 1 h at 20
to 30 mL/kg, then 200 to 250 mL/kg/24 h
20Oral versus intravenous rehydration for treating dehydration due to gastroenteritis in children (Review)
Copyright © 2010 The Cochrane Collaboration. Published by John Wiley & Sons, Ltd.
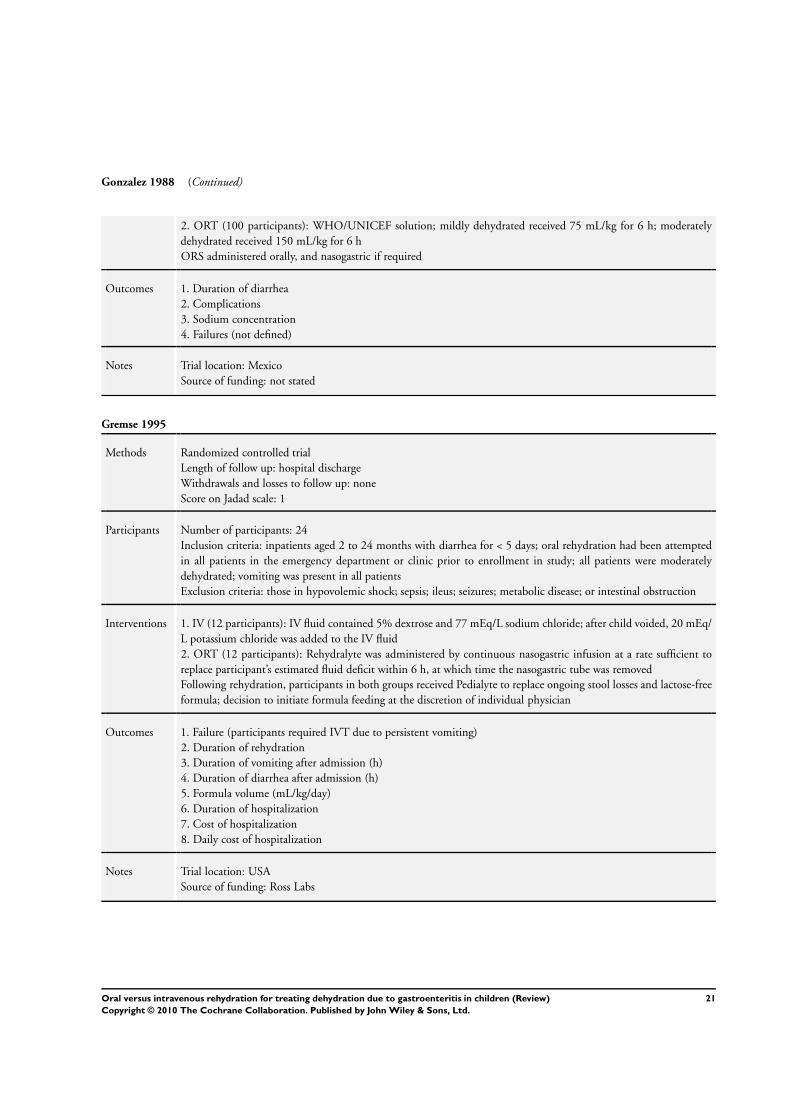
Gonzalez 1988 (Continued)
2. ORT (100 participants): WHO/UNICEF solution; mildly dehydrated received 75 mL/kg for 6 h; moderately
dehydrated received 150 mL/kg for 6 h
ORS administered orally, and nasogastric if required
Outcomes 1. Duration of diarrhea
2. Complications
3. Sodium concentration
4. Failures (not defined)
Notes Trial location: Mexico
Source of funding: not stated
Gremse 1995
Methods Randomized controlled trial
Length of follow up: hospital discharge
Withdrawals and losses to follow up: none
Score on Jadad scale: 1
Participants Number of participants: 24
Inclusion criteria: inpatients aged 2 to 24 months with diarrhea for < 5 days; oral rehydration had been attempted
in all patients in the emergency department or clinic prior to enrollment in study; all patients were moderately
dehydrated; vomiting was present in all patients
Exclusion criteria: those in hypovolemic shock; sepsis; ileus; seizures; metabolic disease; or intestinal obstruction
Interventions 1. IV (12 participants): IV fluid contained 5% dextrose and 77 mEq/L sodium chloride; after child voided, 20 mEq/
L potassium chloride was added to the IV fluid
2. ORT (12 participants): Rehydralyte was administered by continuous nasogastric infusion at a rate sufficient to
replace participant’s estimated fluid deficit within 6 h, at which time the nasogastric tube was removed
Following rehydration, participants in both groups received Pedialyte to replace ongoing stool losses and lactose-free
formula; decision to initiate formula feeding at the discretion of individual physician
Outcomes 1. Failure (participants required IVT due to persistent vomiting)
2. Duration of rehydration
3. Duration of vomiting after admission (h)
4. Duration of diarrhea after admission (h)
5. Formula volume (mL/kg/day)
6. Duration of hospitalization
7. Cost of hospitalization
8. Daily cost of hospitalization
Notes Trial location: USA
Source of funding: Ross Labs
21Oral versus intravenous rehydration for treating dehydration due to gastroenteritis in children (Review)
Copyright © 2010 The Cochrane Collaboration. Published by John Wiley & Sons, Ltd.
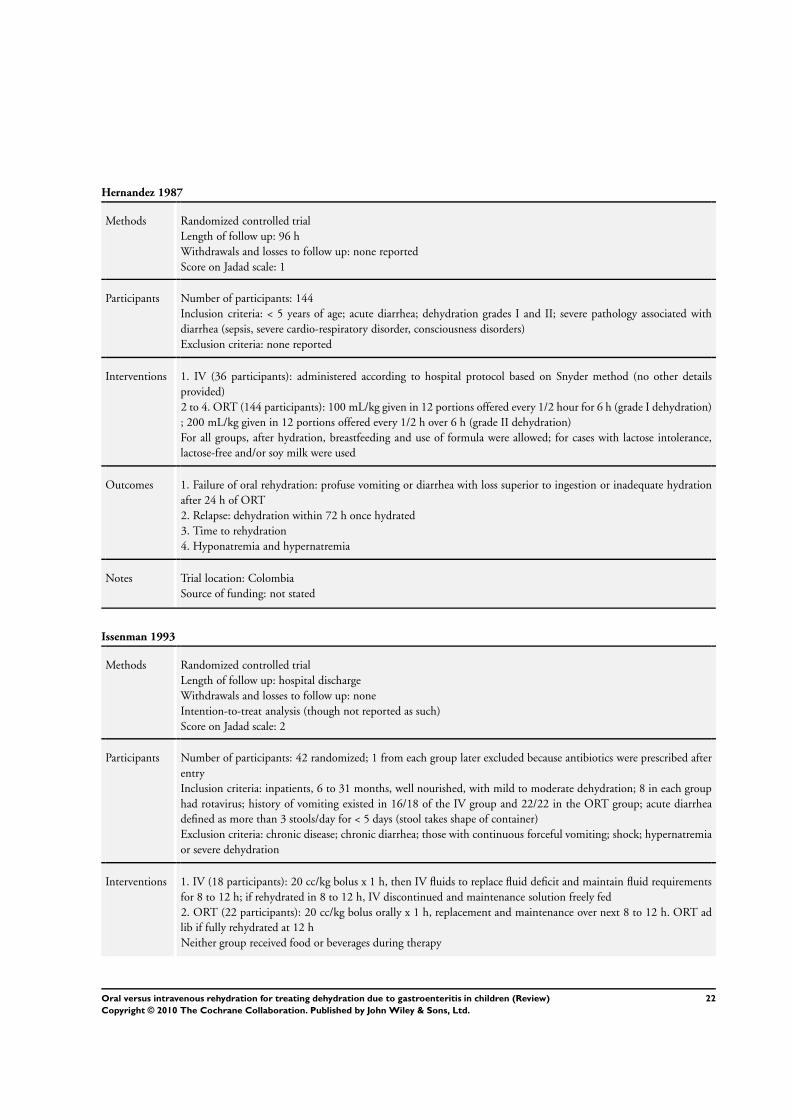
Hernandez 1987
Methods Randomized controlled trial
Length of follow up: 96 h
Withdrawals and losses to follow up: none reported
Score on Jadad scale: 1
Participants Number of participants: 144
Inclusion criteria: < 5 years of age; acute diarrhea; dehydration grades I and II; severe pathology associated with
diarrhea (sepsis, severe cardio-respiratory disorder, consciousness disorders)
Exclusion criteria: none reported
Interventions 1. IV (36 participants): administered according to hospital protocol based on Snyder method (no other details
provided)
2 to 4. ORT (144 participants): 100 mL/kg given in 12 portions offered every 1/2 hour for 6 h (grade I dehydration)
; 200 mL/kg given in 12 portions offered every 1/2 h over 6 h (grade II dehydration)
For all groups, after hydration, breastfeeding and use of formula were allowed; for cases with lactose intolerance,
lactose-free and/or soy milk were used
Outcomes 1. Failure of oral rehydration: profuse vomiting or diarrhea with loss superior to ingestion or inadequate hydration
after 24 h of ORT
2. Relapse: dehydration within 72 h once hydrated
3. Time to rehydration
4. Hyponatremia and hypernatremia
Notes Trial location: Colombia
Source of funding: not stated
Issenman 1993
Methods Randomized controlled trial
Length of follow up: hospital discharge
Withdrawals and losses to follow up: none
Intention-to-treat analysis (though not reported as such)
Score on Jadad scale: 2
Participants Number of participants: 42 randomized; 1 from each group later excluded because antibiotics were prescribed after
entry
Inclusion criteria: inpatients, 6 to 31 months, well nourished, with mild to moderate dehydration; 8 in each group
had rotavirus; history of vomiting existed in 16/18 of the IV group and 22/22 in the ORT group; acute diarrhea
defined as more than 3 stools/day for < 5 days (stool takes shape of container)
Exclusion criteria: chronic disease; chronic diarrhea; those with continuous forceful vomiting; shock; hypernatremia
or severe dehydration
Interventions 1. IV (18 participants): 20 cc/kg bolus x 1 h, then IV fluids to replace fluid deficit and maintain fluid requirements
for 8 to 12 h; if rehydrated in 8 to 12 h, IV discontinued and maintenance solution freely fed
2. ORT (22 participants): 20 cc/kg bolus orally x 1 h, replacement and maintenance over next 8 to 12 h. ORT ad
lib if fully rehydrated at 12 h
Neither group received food or beverages during therapy
22Oral versus intravenous rehydration for treating dehydration due to gastroenteritis in children (Review)
Copyright © 2010 The Cochrane Collaboration. Published by John Wiley & Sons, Ltd.

Issenman 1993 (Continued)
Outcomes 1. Failures (participant refused ORT solution, failed to return to normal hydration by 24 h after entry, or failed to
achieve adequate maintenance oral intake)
2. Weight gain
3. Side effects
4. Total fluid intake at 24 h
Notes Trial location: Canada
Source of funding: Ross Labs
Listernick 1986
Methods Randomized controlled trial
Length of follow up: 48 h after study conclusion
Withdrawals and losses to follow up: none
Score on Jadad scale: 2
2 children had urinary tract infections and were the failures
Participants Number of participants: 29
Inclusion criteria: outpatients aged 3 to 24 months; all patients were well nourished, dehydrated, and had acute
diarrhea for < 5 days; 10/14 in IV group and 11/15 in ORT group had rotavirus; history of vomiting was present
in all of the patients; acute diarrhea defined as < 5 days increased frequency or more liquid consistency (stool takes
shape of container)
Exclusion criteria: those requiring intensive care, or having a serum sodium concentration of > 160 mEq/L
Interventions 1. IV (14 participants): 20 cc/kg for 1 h then rehydrated over 8 h
2. ORT (15 participants): 20 cc/kg of 60-GES via orally for 1 h then ad lib for 8 h
One child in ORT group got IV prior to ORT
Outcomes 1. Failures (failed to achieve normal state of hydration by 12 h or adequate oral intake due to vomiting or refusal to
drink)
2. Time to rehydrate
3. Weight gain
4. Complications
5. Side effects
6. Sodium concentration
7. Total fluid intake at 24 h
Notes Trial location: USA
Source of funding: Ross Labs
23Oral versus intravenous rehydration for treating dehydration due to gastroenteritis in children (Review)
Copyright © 2010 The Cochrane Collaboration. Published by John Wiley & Sons, Ltd.
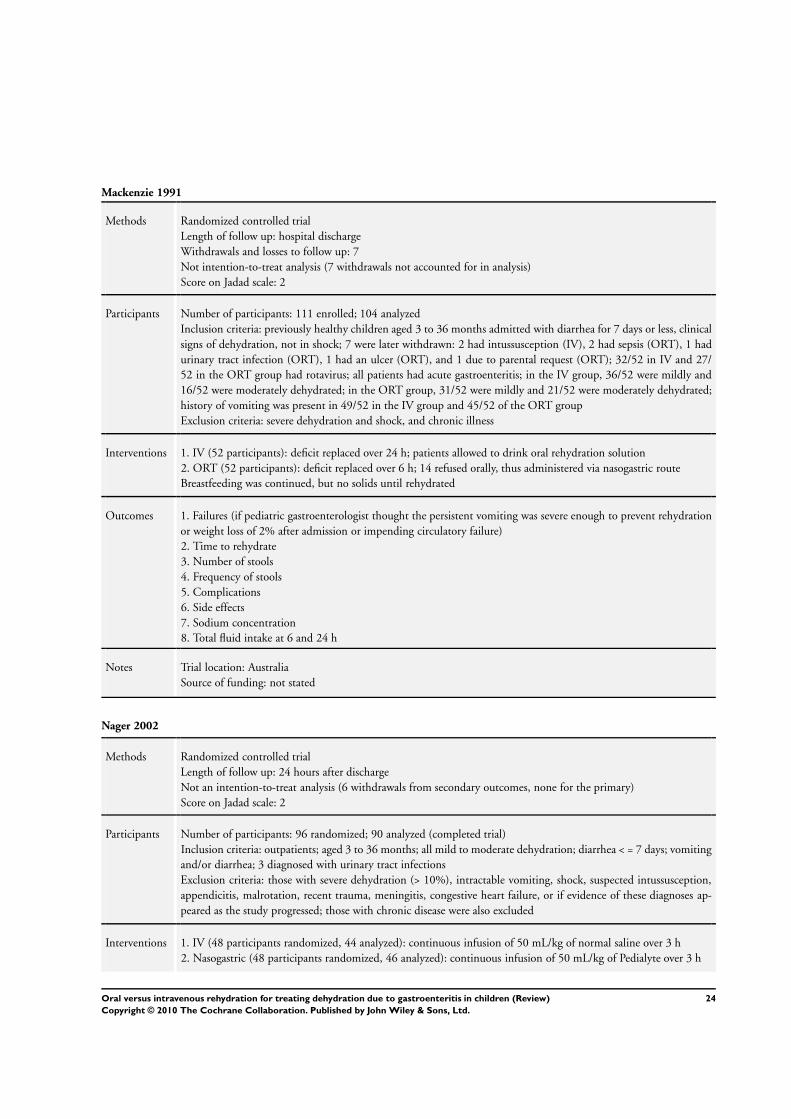
Mackenzie 1991
Methods Randomized controlled trial
Length of follow up: hospital discharge
Withdrawals and losses to follow up: 7
Not intention-to-treat analysis (7 withdrawals not accounted for in analysis)
Score on Jadad scale: 2
Participants Number of participants: 111 enrolled; 104 analyzed
Inclusion criteria: previously healthy children aged 3 to 36 months admitted with diarrhea for 7 days or less, clinical
signs of dehydration, not in shock; 7 were later withdrawn: 2 had intussusception (IV), 2 had sepsis (ORT), 1 had
urinary tract infection (ORT), 1 had an ulcer (ORT), and 1 due to parental request (ORT); 32/52 in IV and 27/
52 in the ORT group had rotavirus; all patients had acute gastroenteritis; in the IV group, 36/52 were mildly and
16/52 were moderately dehydrated; in the ORT group, 31/52 were mildly and 21/52 were moderately dehydrated;
history of vomiting was present in 49/52 in the IV group and 45/52 of the ORT group
Exclusion criteria: severe dehydration and shock, and chronic illness
Interventions 1. IV (52 participants): deficit replaced over 24 h; patients allowed to drink oral rehydration solution
2. ORT (52 participants): deficit replaced over 6 h; 14 refused orally, thus administered via nasogastric route
Breastfeeding was continued, but no solids until rehydrated
Outcomes 1. Failures (if pediatric gastroenterologist thought the persistent vomiting was severe enough to prevent rehydration
or weight loss of 2% after admission or impending circulatory failure)
2. Time to rehydrate
3. Number of stools
4. Frequency of stools
5. Complications
6. Side effects
7. Sodium concentration
8. Total fluid intake at 6 and 24 h
Notes Trial location: Australia
Source of funding: not stated
Nager 2002
Methods Randomized controlled trial
Length of follow up: 24 hours after discharge
Not an intention-to-treat analysis (6 withdrawals from secondary outcomes, none for the primary)
Score on Jadad scale: 2
Participants Number of participants: 96 randomized; 90 analyzed (completed trial)
Inclusion criteria: outpatients; aged 3 to 36 months; all mild to moderate dehydration; diarrhea < = 7 days; vomiting
and/or diarrhea; 3 diagnosed with urinary tract infections
Exclusion criteria: those with severe dehydration (> 10%), intractable vomiting, shock, suspected intussusception,
appendicitis, malrotation, recent trauma, meningitis, congestive heart failure, or if evidence of these diagnoses ap-
peared as the study progressed; those with chronic disease were also excluded
Interventions 1. IV (48 participants randomized, 44 analyzed): continuous infusion of 50 mL/kg of normal saline over 3 h
2. Nasogastric (48 participants randomized, 46 analyzed): continuous infusion of 50 mL/kg of Pedialyte over 3 h
24Oral versus intravenous rehydration for treating dehydration due to gastroenteritis in children (Review)
Copyright © 2010 The Cochrane Collaboration. Published by John Wiley & Sons, Ltd.
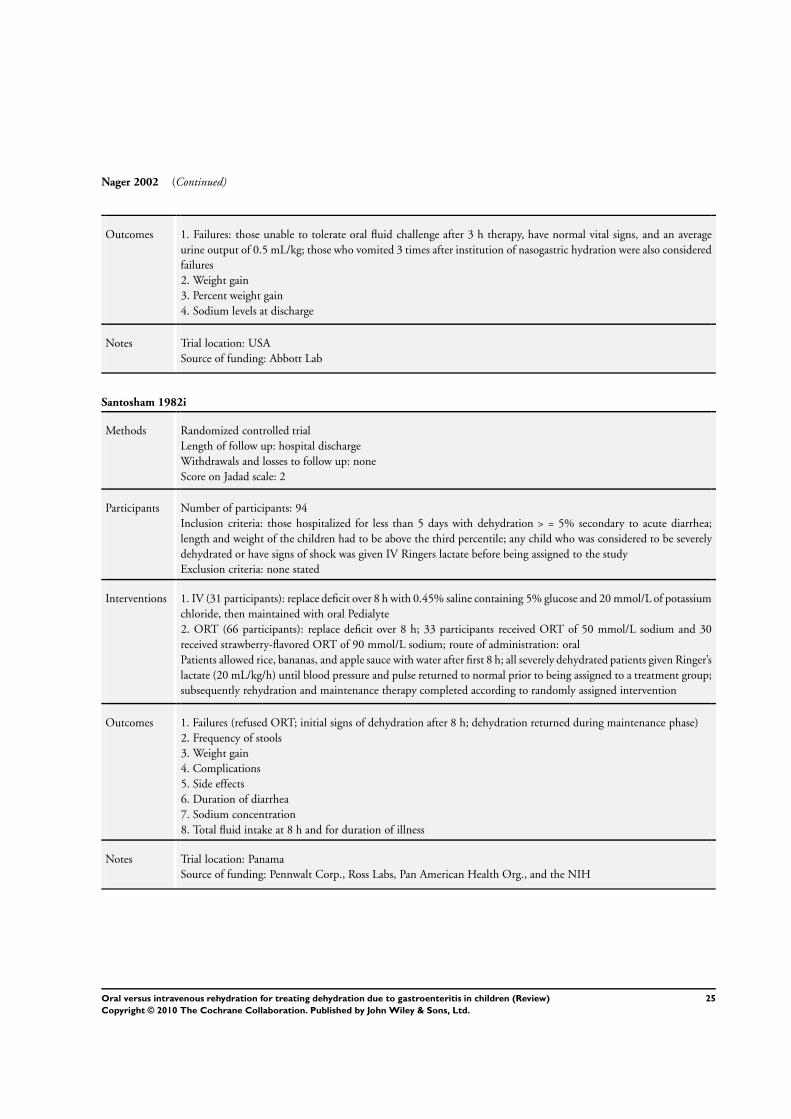
Nager 2002 (Continued)
Outcomes 1. Failures: those unable to tolerate oral fluid challenge after 3 h therapy, have normal vital signs, and an average
urine output of 0.5 mL/kg; those who vomited 3 times after institution of nasogastric hydration were also considered
failures
2. Weight gain
3. Percent weight gain
4. Sodium levels at discharge
Notes Trial location: USA
Source of funding: Abbott Lab
Santosham 1982i
Methods Randomized controlled trial
Length of follow up: hospital discharge
Withdrawals and losses to follow up: none
Score on Jadad scale: 2
Participants Number of participants: 94
Inclusion criteria: those hospitalized for less than 5 days with dehydration > = 5% secondary to acute diarrhea;
length and weight of the children had to be above the third percentile; any child who was considered to be severely
dehydrated or have signs of shock was given IV Ringers lactate before being assigned to the study
Exclusion criteria: none stated
Interventions 1. IV (31 participants): replace deficit over 8 h with 0.45% saline containing 5% glucose and 20 mmol/L of potassium
chloride, then maintained with oral Pedialyte
2. ORT (66 participants): replace deficit over 8 h; 33 participants received ORT of 50 mmol/L sodium and 30
received strawberry-flavored ORT of 90 mmol/L sodium; route of administration: oral
Patients allowed rice, bananas, and apple sauce with water after first 8 h; all severely dehydrated patients given Ringer’s
lactate (20 mL/kg/h) until blood pressure and pulse returned to normal prior to being assigned to a treatment group;
subsequently rehydration and maintenance therapy completed according to randomly assigned intervention
Outcomes 1. Failures (refused ORT; initial signs of dehydration after 8 h; dehydration returned during maintenance phase)
2. Frequency of stools
3. Weight gain
4. Complications
5. Side effects
6. Duration of diarrhea
7. Sodium concentration
8. Total fluid intake at 8 h and for duration of illness
Notes Trial location: Panama
Source of funding: Pennwalt Corp., Ross Labs, Pan American Health Org., and the NIH
25Oral versus intravenous rehydration for treating dehydration due to gastroenteritis in children (Review)
Copyright © 2010 The Cochrane Collaboration. Published by John Wiley & Sons, Ltd.
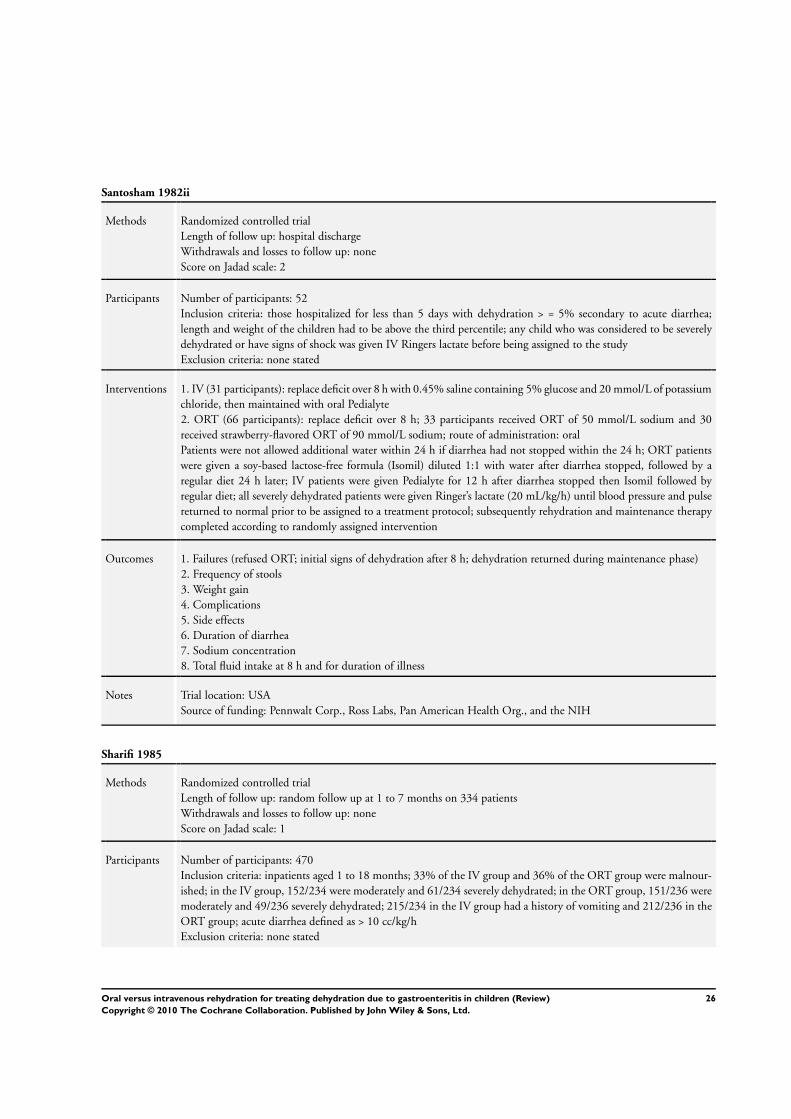
Santosham 1982ii
Methods Randomized controlled trial
Length of follow up: hospital discharge
Withdrawals and losses to follow up: none
Score on Jadad scale: 2
Participants Number of participants: 52
Inclusion criteria: those hospitalized for less than 5 days with dehydration > = 5% secondary to acute diarrhea;
length and weight of the children had to be above the third percentile; any child who was considered to be severely
dehydrated or have signs of shock was given IV Ringers lactate before being assigned to the study
Exclusion criteria: none stated
Interventions 1. IV (31 participants): replace deficit over 8 h with 0.45% saline containing 5% glucose and 20 mmol/L of potassium
chloride, then maintained with oral Pedialyte
2. ORT (66 participants): replace deficit over 8 h; 33 participants received ORT of 50 mmol/L sodium and 30
received strawberry-flavored ORT of 90 mmol/L sodium; route of administration: oral
Patients were not allowed additional water within 24 h if diarrhea had not stopped within the 24 h; ORT patients
were given a soy-based lactose-free formula (Isomil) diluted 1:1 with water after diarrhea stopped, followed by a
regular diet 24 h later; IV patients were given Pedialyte for 12 h after diarrhea stopped then Isomil followed by
regular diet; all severely dehydrated patients were given Ringer’s lactate (20 mL/kg/h) until blood pressure and pulse
returned to normal prior to be assigned to a treatment protocol; subsequently rehydration and maintenance therapy
completed according to randomly assigned intervention
Outcomes 1. Failures (refused ORT; initial signs of dehydration after 8 h; dehydration returned during maintenance phase)
2. Frequency of stools
3. Weight gain
4. Complications
5. Side effects
6. Duration of diarrhea
7. Sodium concentration
8. Total fluid intake at 8 h and for duration of illness
Notes Trial location: USA
Source of funding: Pennwalt Corp., Ross Labs, Pan American Health Org., and the NIH
Sharifi 1985
Methods Randomized controlled trial
Length of follow up: random follow up at 1 to 7 months on 334 patients
Withdrawals and losses to follow up: none
Score on Jadad scale: 1
Participants Number of participants: 470
Inclusion criteria: inpatients aged 1 to 18 months; 33% of the IV group and 36% of the ORT group were malnour-
ished; in the IV group, 152/234 were moderately and 61/234 severely dehydrated; in the ORT group, 151/236 were
moderately and 49/236 severely dehydrated; 215/234 in the IV group had a history of vomiting and 212/236 in the
ORT group; acute diarrhea defined as > 10 cc/kg/h
Exclusion criteria: none stated
26Oral versus intravenous rehydration for treating dehydration due to gastroenteritis in children (Review)
Copyright © 2010 The Cochrane Collaboration. Published by John Wiley & Sons, Ltd.
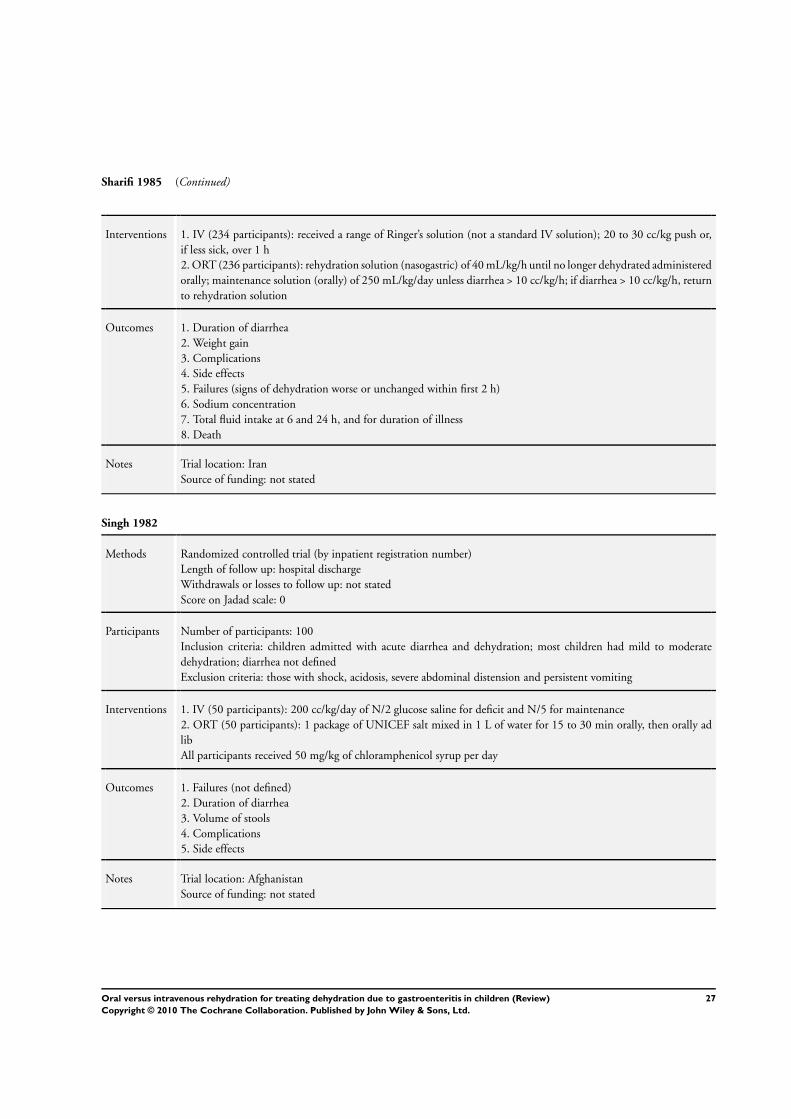
Sharifi 1985 (Continued)
Interventions 1. IV (234 participants): received a range of Ringer’s solution (not a standard IV solution); 20 to 30 cc/kg push or,
if less sick, over 1 h
2. ORT (236 participants): rehydration solution (nasogastric) of 40 mL/kg/h until no longer dehydrated administered
orally; maintenance solution (orally) of 250 mL/kg/day unless diarrhea > 10 cc/kg/h; if diarrhea > 10 cc/kg/h, return
to rehydration solution
Outcomes 1. Duration of diarrhea
2. Weight gain
3. Complications
4. Side effects
5. Failures (signs of dehydration worse or unchanged within first 2 h)
6. Sodium concentration
7. Total fluid intake at 6 and 24 h, and for duration of illness
8. Death
Notes Trial location: Iran
Source of funding: not stated
Singh 1982
Methods Randomized controlled trial (by inpatient registration number)
Length of follow up: hospital discharge
Withdrawals or losses to follow up: not stated
Score on Jadad scale: 0
Participants Number of participants: 100
Inclusion criteria: children admitted with acute diarrhea and dehydration; most children had mild to moderate
dehydration; diarrhea not defined
Exclusion criteria: those with shock, acidosis, severe abdominal distension and persistent vomiting
Interventions 1. IV (50 participants): 200 cc/kg/day of N/2 glucose saline for deficit and N/5 for maintenance
2. ORT (50 participants): 1 package of UNICEF salt mixed in 1 L of water for 15 to 30 min orally, then orally ad
lib
All participants received 50 mg/kg of chloramphenicol syrup per day
Outcomes 1. Failures (not defined)
2. Duration of diarrhea
3. Volume of stools
4. Complications
5. Side effects
Notes Trial location: Afghanistan
Source of funding: not stated
27Oral versus intravenous rehydration for treating dehydration due to gastroenteritis in children (Review)
Copyright © 2010 The Cochrane Collaboration. Published by John Wiley & Sons, Ltd.
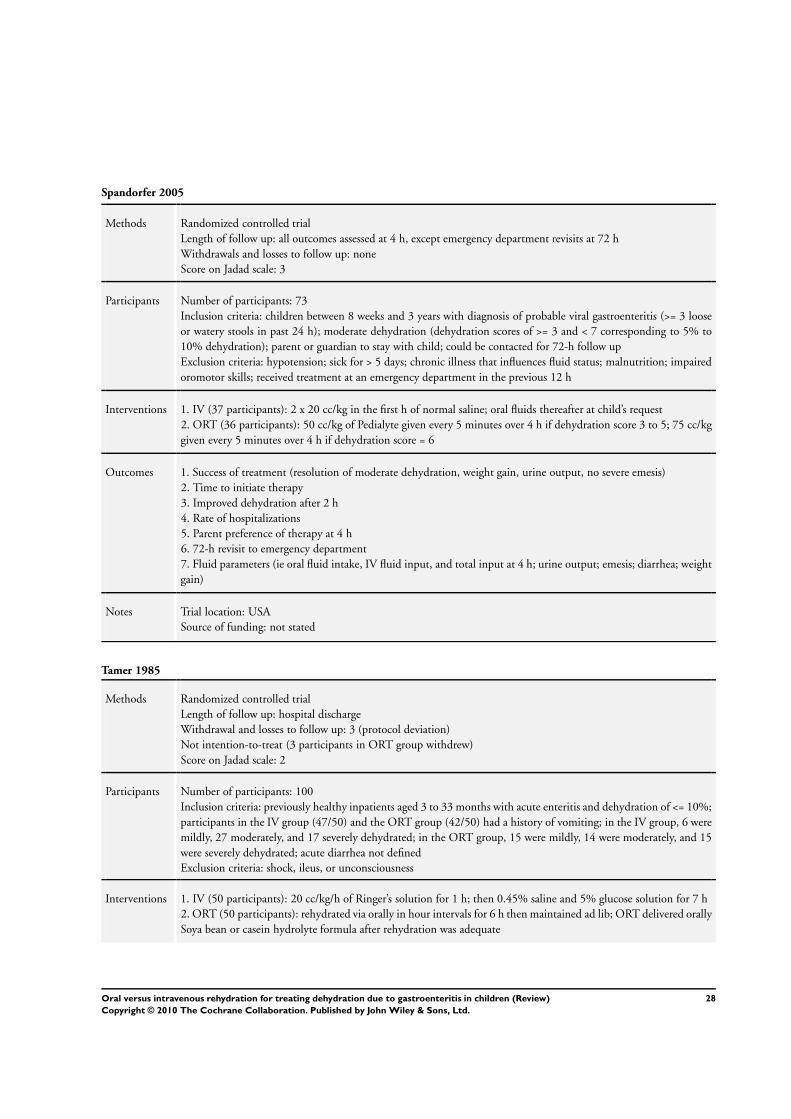
Spandorfer 2005
Methods Randomized controlled trial
Length of follow up: all outcomes assessed at 4 h, except emergency department revisits at 72 h
Withdrawals and losses to follow up: none
Score on Jadad scale: 3
Participants Number of participants: 73
Inclusion criteria: children between 8 weeks and 3 years with diagnosis of probable viral gastroenteritis (>= 3 loose
or watery stools in past 24 h); moderate dehydration (dehydration scores of >= 3 and < 7 corresponding to 5% to
10% dehydration); parent or guardian to stay with child; could be contacted for 72-h follow up
Exclusion criteria: hypotension; sick for > 5 days; chronic illness that influences fluid status; malnutrition; impaired
oromotor skills; received treatment at an emergency department in the previous 12 h
Interventions 1. IV (37 participants): 2 x 20 cc/kg in the first h of normal saline; oral fluids thereafter at child’s request
2. ORT (36 participants): 50 cc/kg of Pedialyte given every 5 minutes over 4 h if dehydration score 3 to 5; 75 cc/kg
given every 5 minutes over 4 h if dehydration score = 6
Outcomes 1. Success of treatment (resolution of moderate dehydration, weight gain, urine output, no severe emesis)
2. Time to initiate therapy
3. Improved dehydration after 2 h
4. Rate of hospitalizations
5. Parent preference of therapy at 4 h
6. 72-h revisit to emergency department
7. Fluid parameters (ie oral fluid intake, IV fluid input, and total input at 4 h; urine output; emesis; diarrhea; weight
gain)
Notes Trial location: USA
Source of funding: not stated
Tamer 1985
Methods Randomized controlled trial
Length of follow up: hospital discharge
Withdrawal and losses to follow up: 3 (protocol deviation)
Not intention-to-treat (3 participants in ORT group withdrew)
Score on Jadad scale: 2
Participants Number of participants: 100
Inclusion criteria: previously healthy inpatients aged 3 to 33 months with acute enteritis and dehydration of <= 10%;
participants in the IV group (47/50) and the ORT group (42/50) had a history of vomiting; in the IV group, 6 were
mildly, 27 moderately, and 17 severely dehydrated; in the ORT group, 15 were mildly, 14 were moderately, and 15
were severely dehydrated; acute diarrhea not defined
Exclusion criteria: shock, ileus, or unconsciousness
Interventions 1. IV (50 participants): 20 cc/kg/h of Ringer’s solution for 1 h; then 0.45% saline and 5% glucose solution for 7 h
2. ORT (50 participants): rehydrated via orally in hour intervals for 6 h then maintained ad lib; ORT delivered orally
Soya bean or casein hydrolyte formula after rehydration was adequate
28Oral versus intravenous rehydration for treating dehydration due to gastroenteritis in children (Review)
Copyright © 2010 The Cochrane Collaboration. Published by John Wiley & Sons, Ltd.
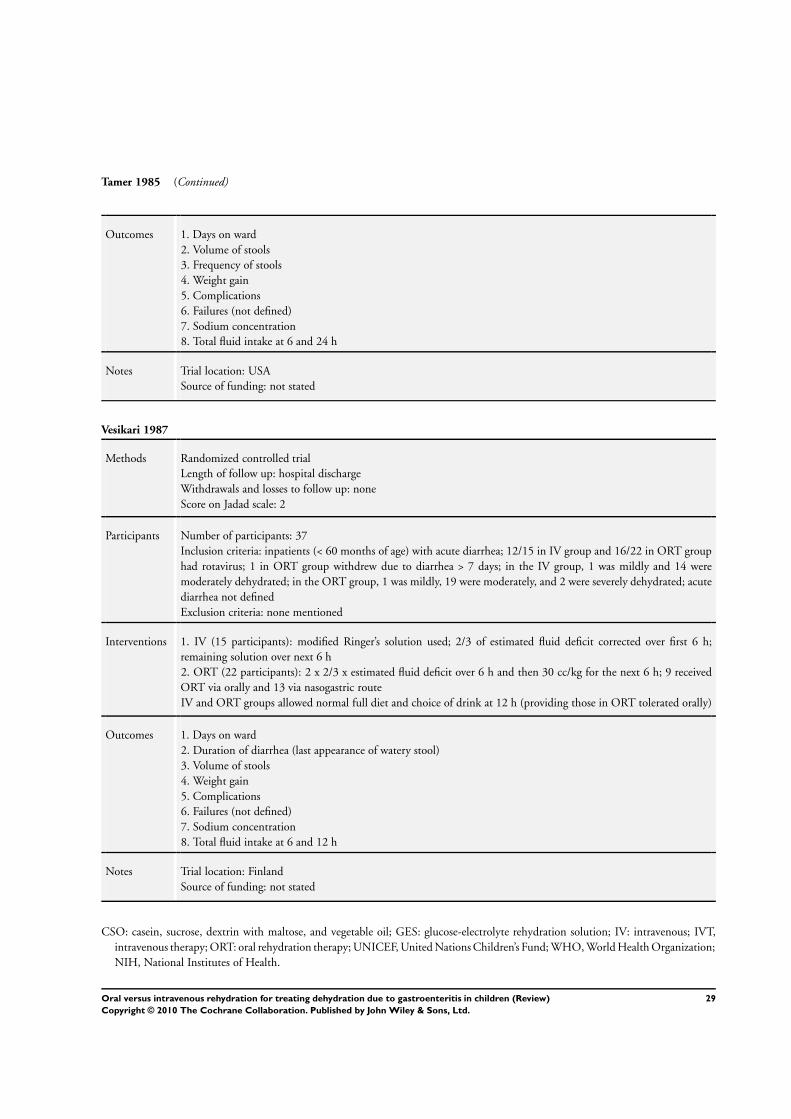
Tamer 1985 (Continued)
Outcomes 1. Days on ward
2. Volume of stools
3. Frequency of stools
4. Weight gain
5. Complications
6. Failures (not defined)
7. Sodium concentration
8. Total fluid intake at 6 and 24 h
Notes Trial location: USA
Source of funding: not stated
Vesikari 1987
Methods Randomized controlled trial
Length of follow up: hospital discharge
Withdrawals and losses to follow up: none
Score on Jadad scale: 2
Participants Number of participants: 37
Inclusion criteria: inpatients (< 60 months of age) with acute diarrhea; 12/15 in IV group and 16/22 in ORT group
had rotavirus; 1 in ORT group withdrew due to diarrhea > 7 days; in the IV group, 1 was mildly and 14 were
moderately dehydrated; in the ORT group, 1 was mildly, 19 were moderately, and 2 were severely dehydrated; acute
diarrhea not defined
Exclusion criteria: none mentioned
Interventions 1. IV (15 participants): modified Ringer’s solution used; 2/3 of estimated fluid deficit corrected over first 6 h;
remaining solution over next 6 h
2. ORT (22 participants): 2 x 2/3 x estimated fluid deficit over 6 h and then 30 cc/kg for the next 6 h; 9 received
ORT via orally and 13 via nasogastric route
IV and ORT groups allowed normal full diet and choice of drink at 12 h (providing those in ORT tolerated orally)
Outcomes 1. Days on ward
2. Duration of diarrhea (last appearance of watery stool)
3. Volume of stools
4. Weight gain
5. Complications
6. Failures (not defined)
7. Sodium concentration
8. Total fluid intake at 6 and 12 h
Notes Trial location: Finland
Source of funding: not stated
CSO: casein, sucrose, dextrin with maltose, and vegetable oil; GES: glucose-electrolyte rehydration solution; IV: intravenous; IVT,
intravenous therapy; ORT: oral rehydration therapy; UNICEF, United Nations Children’s Fund; WHO, World Health Organization;
NIH, National Institutes of Health.
29Oral versus intravenous rehydration for treating dehydration due to gastroenteritis in children (Review)
Copyright © 2010 The Cochrane Collaboration. Published by John Wiley & Sons, Ltd.
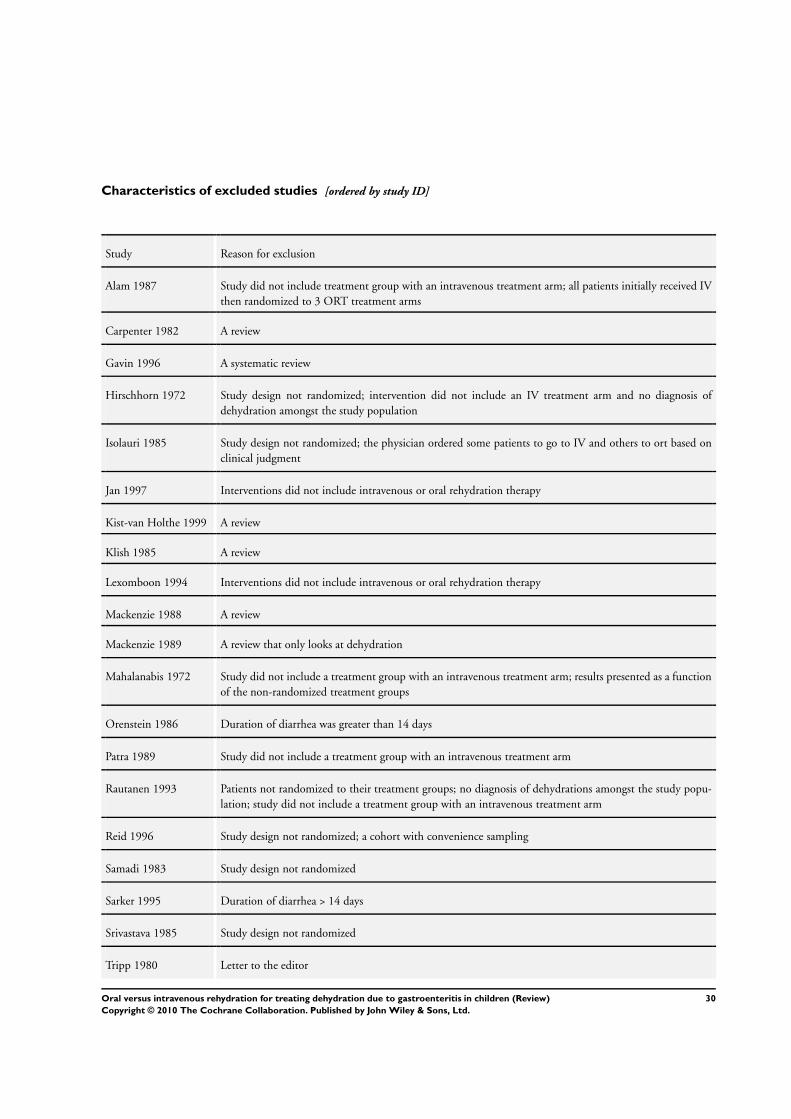
Characteristics of excluded studies [ordered by study ID]
Study Reason for exclusion
Alam 1987 Study did not include treatment group with an intravenous treatment arm; all patients initially received IV
then randomized to 3 ORT treatment arms
Carpenter 1982 A review
Gavin 1996 A systematic review
Hirschhorn 1972 Study design not randomized; intervention did not include an IV treatment arm and no diagnosis of
dehydration amongst the study population
Isolauri 1985 Study design not randomized; the physician ordered some patients to go to IV and others to ort based on
clinical judgment
Jan 1997 Interventions did not include intravenous or oral rehydration therapy
Kist-van Holthe 1999 A review
Klish 1985 A review
Lexomboon 1994 Interventions did not include intravenous or oral rehydration therapy
Mackenzie 1988 A review
Mackenzie 1989 A review that only looks at dehydration
Mahalanabis 1972 Study did not include a treatment group with an intravenous treatment arm; results presented as a function
of the non-randomized treatment groups
Orenstein 1986 Duration of diarrhea was greater than 14 days
Patra 1989 Study did not include a treatment group with an intravenous treatment arm
Rautanen 1993 Patients not randomized to their treatment groups; no diagnosis of dehydrations amongst the study popu-
lation; study did not include a treatment group with an intravenous treatment arm
Reid 1996 Study design not randomized; a cohort with convenience sampling
Samadi 1983 Study design not randomized
Sarker 1995 Duration of diarrhea > 14 days
Srivastava 1985 Study design not randomized
Tripp 1980 Letter to the editor
30Oral versus intravenous rehydration for treating dehydration due to gastroenteritis in children (Review)
Copyright © 2010 The Cochrane Collaboration. Published by John Wiley & Sons, Ltd.
(Continued)
Weizman 1983 Duration of diarrhea > 14 days; study design not randomized
31Oral versus intravenous rehydration for treating dehydration due to gastroenteritis in children (Review)
Copyright © 2010 The Cochrane Collaboration. Published by John Wiley & Sons, Ltd.
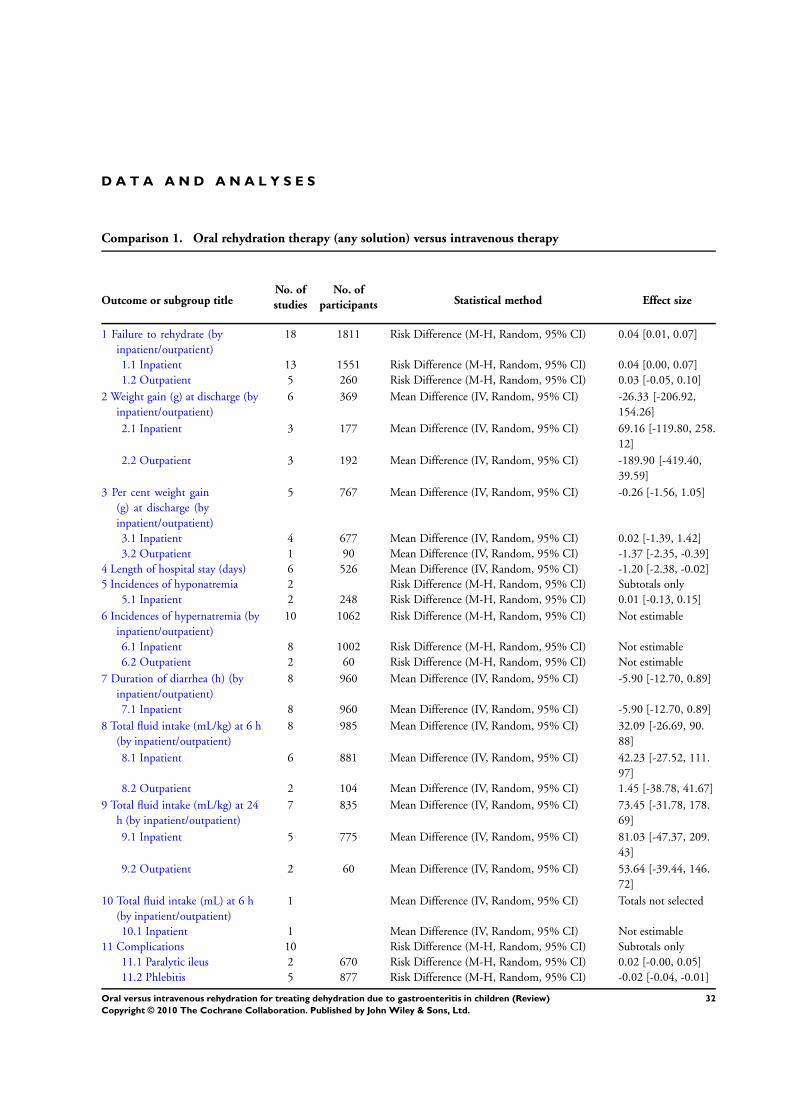
D A T A A N D A N A L Y S E S
Comparison 1. Oral rehydration therapy (any solution) versus intravenous therapy
Outcome or subgroup titleNo. of
studies
No. of
participants Statistical method Effect size
1 Failure to rehydrate (by
inpatient/outpatient)
18 1811 Risk Difference (M-H, Random, 95% CI) 0.04 [0.01, 0.07]
1.1 Inpatient 13 1551 Risk Difference (M-H, Random, 95% CI) 0.04 [0.00, 0.07]
1.2 Outpatient 5 260 Risk Difference (M-H, Random, 95% CI) 0.03 [-0.05, 0.10]
2 Weight gain (g) at discharge (by
inpatient/outpatient)
6 369 Mean Difference (IV, Random, 95% CI) -26.33 [-206.92,
154.26]
2.1 Inpatient 3 177 Mean Difference (IV, Random, 95% CI) 69.16 [-119.80, 258.
12]
2.2 Outpatient 3 192 Mean Difference (IV, Random, 95% CI) -189.90 [-419.40,
39.59]
3 Per cent weight gain
(g) at discharge (by
inpatient/outpatient)
5 767 Mean Difference (IV, Random, 95% CI) -0.26 [-1.56, 1.05]
3.1 Inpatient 4 677 Mean Difference (IV, Random, 95% CI) 0.02 [-1.39, 1.42]
3.2 Outpatient 1 90 Mean Difference (IV, Random, 95% CI) -1.37 [-2.35, -0.39]
4 Length of hospital stay (days) 6 526 Mean Difference (IV, Random, 95% CI) -1.20 [-2.38, -0.02]
5 Incidences of hyponatremia 2 Risk Difference (M-H, Random, 95% CI) Subtotals only
5.1 Inpatient 2 248 Risk Difference (M-H, Random, 95% CI) 0.01 [-0.13, 0.15]
6 Incidences of hypernatremia (by
inpatient/outpatient)
10 1062 Risk Difference (M-H, Random, 95% CI) Not estimable
6.1 Inpatient 8 1002 Risk Difference (M-H, Random, 95% CI) Not estimable
6.2 Outpatient 2 60 Risk Difference (M-H, Random, 95% CI) Not estimable
7 Duration of diarrhea (h) (by
inpatient/outpatient)
8 960 Mean Difference (IV, Random, 95% CI) -5.90 [-12.70, 0.89]
7.1 Inpatient 8 960 Mean Difference (IV, Random, 95% CI) -5.90 [-12.70, 0.89]
8 Total fluid intake (mL/kg) at 6 h
(by inpatient/outpatient)
8 985 Mean Difference (IV, Random, 95% CI) 32.09 [-26.69, 90.
88]
8.1 Inpatient 6 881 Mean Difference (IV, Random, 95% CI) 42.23 [-27.52, 111.
97]
8.2 Outpatient 2 104 Mean Difference (IV, Random, 95% CI) 1.45 [-38.78, 41.67]
9 Total fluid intake (mL/kg) at 24
h (by inpatient/outpatient)
7 835 Mean Difference (IV, Random, 95% CI) 73.45 [-31.78, 178.
69]
9.1 Inpatient 5 775 Mean Difference (IV, Random, 95% CI) 81.03 [-47.37, 209.
43]
9.2 Outpatient 2 60 Mean Difference (IV, Random, 95% CI) 53.64 [-39.44, 146.
72]
10 Total fluid intake (mL) at 6 h
(by inpatient/outpatient)
1 Mean Difference (IV, Random, 95% CI) Totals not selected
10.1 Inpatient 1 Mean Difference (IV, Random, 95% CI) Not estimable
11 Complications 10 Risk Difference (M-H, Random, 95% CI) Subtotals only
11.1 Paralytic ileus 2 670 Risk Difference (M-H, Random, 95% CI) 0.02 [-0.00, 0.05]
11.2 Phlebitis 5 877 Risk Difference (M-H, Random, 95% CI) -0.02 [-0.04, -0.01]
32Oral versus intravenous rehydration for treating dehydration due to gastroenteritis in children (Review)
Copyright © 2010 The Cochrane Collaboration. Published by John Wiley & Sons, Ltd.
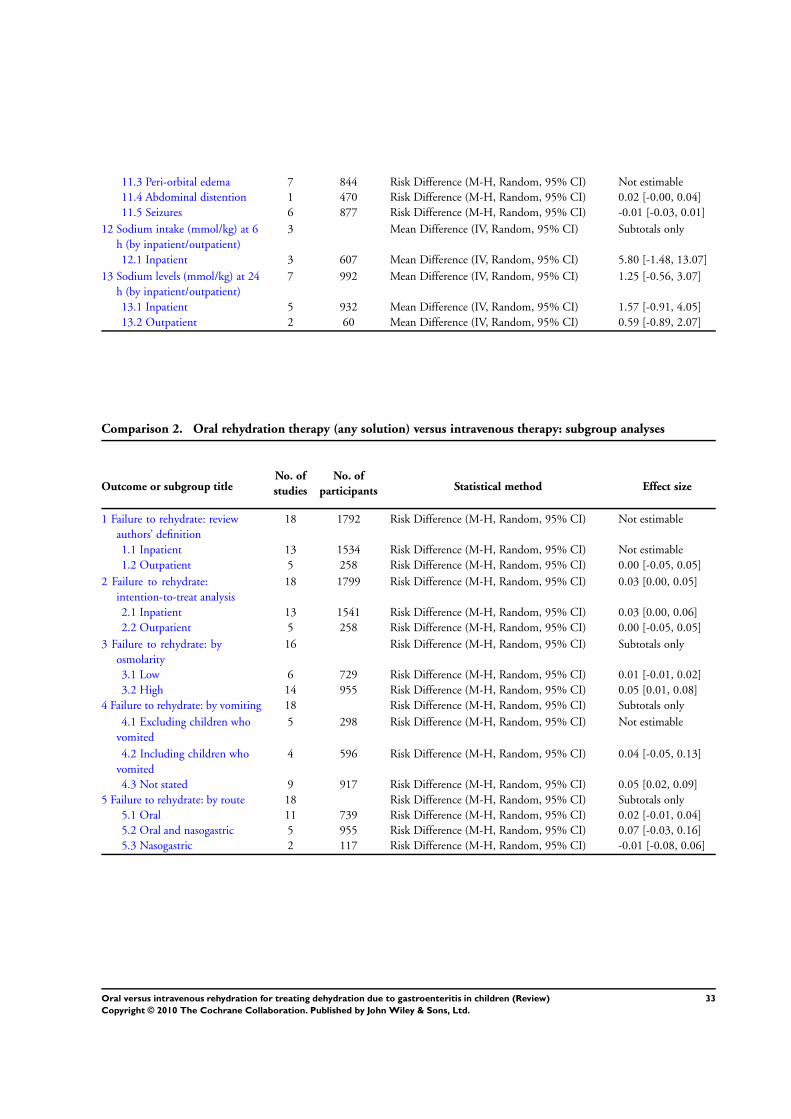
11.3 Peri-orbital edema 7 844 Risk Difference (M-H, Random, 95% CI) Not estimable
11.4 Abdominal distention 1 470 Risk Difference (M-H, Random, 95% CI) 0.02 [-0.00, 0.04]
11.5 Seizures 6 877 Risk Difference (M-H, Random, 95% CI) -0.01 [-0.03, 0.01]
12 Sodium intake (mmol/kg) at 6
h (by inpatient/outpatient)
3 Mean Difference (IV, Random, 95% CI) Subtotals only
12.1 Inpatient 3 607 Mean Difference (IV, Random, 95% CI) 5.80 [-1.48, 13.07]
13 Sodium levels (mmol/kg) at 24
h (by inpatient/outpatient)
7 992 Mean Difference (IV, Random, 95% CI) 1.25 [-0.56, 3.07]
13.1 Inpatient 5 932 Mean Difference (IV, Random, 95% CI) 1.57 [-0.91, 4.05]
13.2 Outpatient 2 60 Mean Difference (IV, Random, 95% CI) 0.59 [-0.89, 2.07]
Comparison 2. Oral rehydration therapy (any solution) versus intravenous therapy: subgroup analyses
Outcome or subgroup titleNo. of
studies
No. of
participants Statistical method Effect size
1 Failure to rehydrate: review
authors’ definition
18 1792 Risk Difference (M-H, Random, 95% CI) Not estimable
1.1 Inpatient 13 1534 Risk Difference (M-H, Random, 95% CI) Not estimable
1.2 Outpatient 5 258 Risk Difference (M-H, Random, 95% CI) 0.00 [-0.05, 0.05]
2 Failure to rehydrate:
intention-to-treat analysis
18 1799 Risk Difference (M-H, Random, 95% CI) 0.03 [0.00, 0.05]
2.1 Inpatient 13 1541 Risk Difference (M-H, Random, 95% CI) 0.03 [0.00, 0.06]
2.2 Outpatient 5 258 Risk Difference (M-H, Random, 95% CI) 0.00 [-0.05, 0.05]
3 Failure to rehydrate: by
osmolarity
16 Risk Difference (M-H, Random, 95% CI) Subtotals only
3.1 Low 6 729 Risk Difference (M-H, Random, 95% CI) 0.01 [-0.01, 0.02]
3.2 High 14 955 Risk Difference (M-H, Random, 95% CI) 0.05 [0.01, 0.08]
4 Failure to rehydrate: by vomiting 18 Risk Difference (M-H, Random, 95% CI) Subtotals only
4.1 Excluding children who
vomited
5 298 Risk Difference (M-H, Random, 95% CI) Not estimable
4.2 Including children who
vomited
4 596 Risk Difference (M-H, Random, 95% CI) 0.04 [-0.05, 0.13]
4.3 Not stated 9 917 Risk Difference (M-H, Random, 95% CI) 0.05 [0.02, 0.09]
5 Failure to rehydrate: by route 18 Risk Difference (M-H, Random, 95% CI) Subtotals only
5.1 Oral 11 739 Risk Difference (M-H, Random, 95% CI) 0.02 [-0.01, 0.04]
5.2 Oral and nasogastric 5 955 Risk Difference (M-H, Random, 95% CI) 0.07 [-0.03, 0.16]
5.3 Nasogastric 2 117 Risk Difference (M-H, Random, 95% CI) -0.01 [-0.08, 0.06]
33Oral versus intravenous rehydration for treating dehydration due to gastroenteritis in children (Review)
Copyright © 2010 The Cochrane Collaboration. Published by John Wiley & Sons, Ltd.
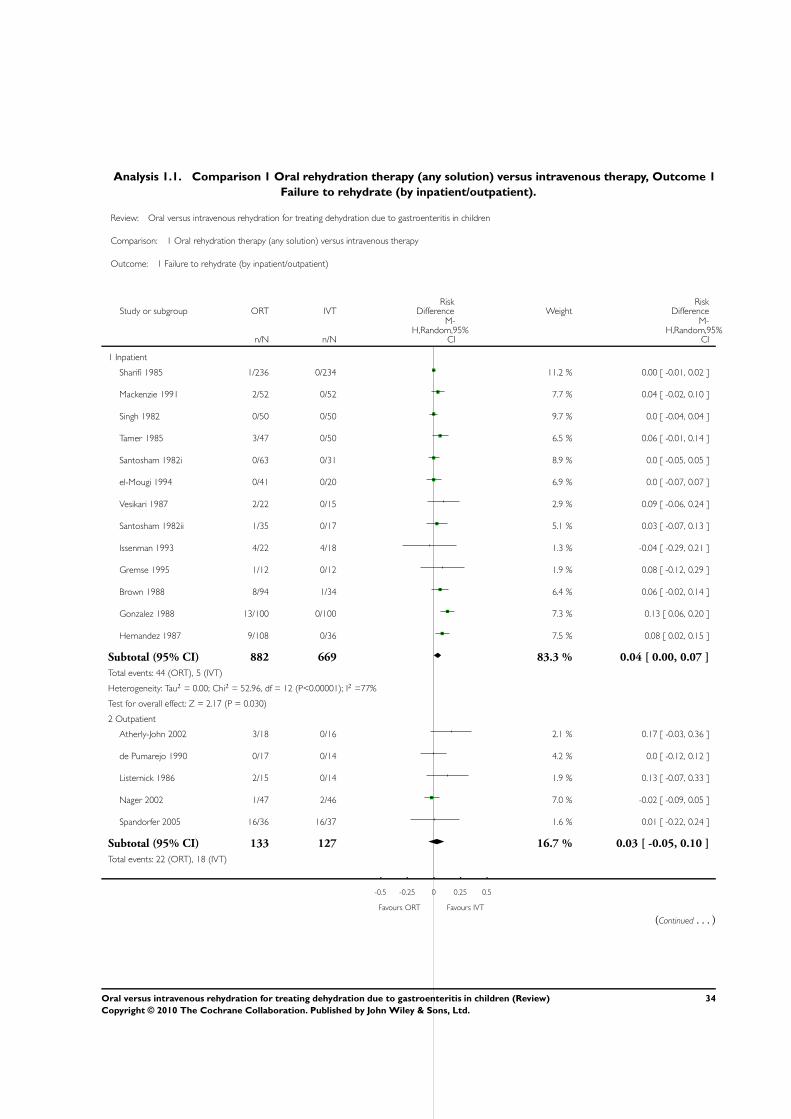
Analysis 1.1. Comparison 1 Oral rehydration therapy (any solution) versus intravenous therapy, Outcome 1
Failure to rehydrate (by inpatient/outpatient).
Review: Oral versus intravenous rehydration for treating dehydration due to gastroenteritis in children
Comparison: 1 Oral rehydration therapy (any solution) versus intravenous therapy
Outcome: 1 Failure to rehydrate (by inpatient/outpatient)
Study or subgroup ORT IVTRisk
Difference WeightRisk
Difference
n/N n/N
M-H,Random,95%
CI
M-H,Random,95%
CI
1 Inpatient
Sharifi 1985 1/236 0/234 11.2 % 0.00 [ -0.01, 0.02 ]
Mackenzie 1991 2/52 0/52 7.7 % 0.04 [ -0.02, 0.10 ]
Singh 1982 0/50 0/50 9.7 % 0.0 [ -0.04, 0.04 ]
Tamer 1985 3/47 0/50 6.5 % 0.06 [ -0.01, 0.14 ]
Santosham 1982i 0/63 0/31 8.9 % 0.0 [ -0.05, 0.05 ]
el-Mougi 1994 0/41 0/20 6.9 % 0.0 [ -0.07, 0.07 ]
Vesikari 1987 2/22 0/15 2.9 % 0.09 [ -0.06, 0.24 ]
Santosham 1982ii 1/35 0/17 5.1 % 0.03 [ -0.07, 0.13 ]
Issenman 1993 4/22 4/18 1.3 % -0.04 [ -0.29, 0.21 ]
Gremse 1995 1/12 0/12 1.9 % 0.08 [ -0.12, 0.29 ]
Brown 1988 8/94 1/34 6.4 % 0.06 [ -0.02, 0.14 ]
Gonzalez 1988 13/100 0/100 7.3 % 0.13 [ 0.06, 0.20 ]
Hernandez 1987 9/108 0/36 7.5 % 0.08 [ 0.02, 0.15 ]
Subtotal (95% CI) 882 669 83.3 % 0.04 [ 0.00, 0.07 ]
Total events: 44 (ORT), 5 (IVT)
Heterogeneity: Tau2 = 0.00; Chi2 = 52.96, df = 12 (P<0.00001); I2 =77%
Test for overall effect: Z = 2.17 (P = 0.030)
2 Outpatient
Atherly-John 2002 3/18 0/16 2.1 % 0.17 [ -0.03, 0.36 ]
de Pumarejo 1990 0/17 0/14 4.2 % 0.0 [ -0.12, 0.12 ]
Listernick 1986 2/15 0/14 1.9 % 0.13 [ -0.07, 0.33 ]
Nager 2002 1/47 2/46 7.0 % -0.02 [ -0.09, 0.05 ]
Spandorfer 2005 16/36 16/37 1.6 % 0.01 [ -0.22, 0.24 ]
Subtotal (95% CI) 133 127 16.7 % 0.03 [ -0.05, 0.10 ]
Total events: 22 (ORT), 18 (IVT)
-0.5 -0.25 0 0.25 0.5
Favours ORT Favours IVT
(Continued . . . )
34Oral versus intravenous rehydration for treating dehydration due to gastroenteritis in children (Review)
Copyright © 2010 The Cochrane Collaboration. Published by John Wiley & Sons, Ltd.
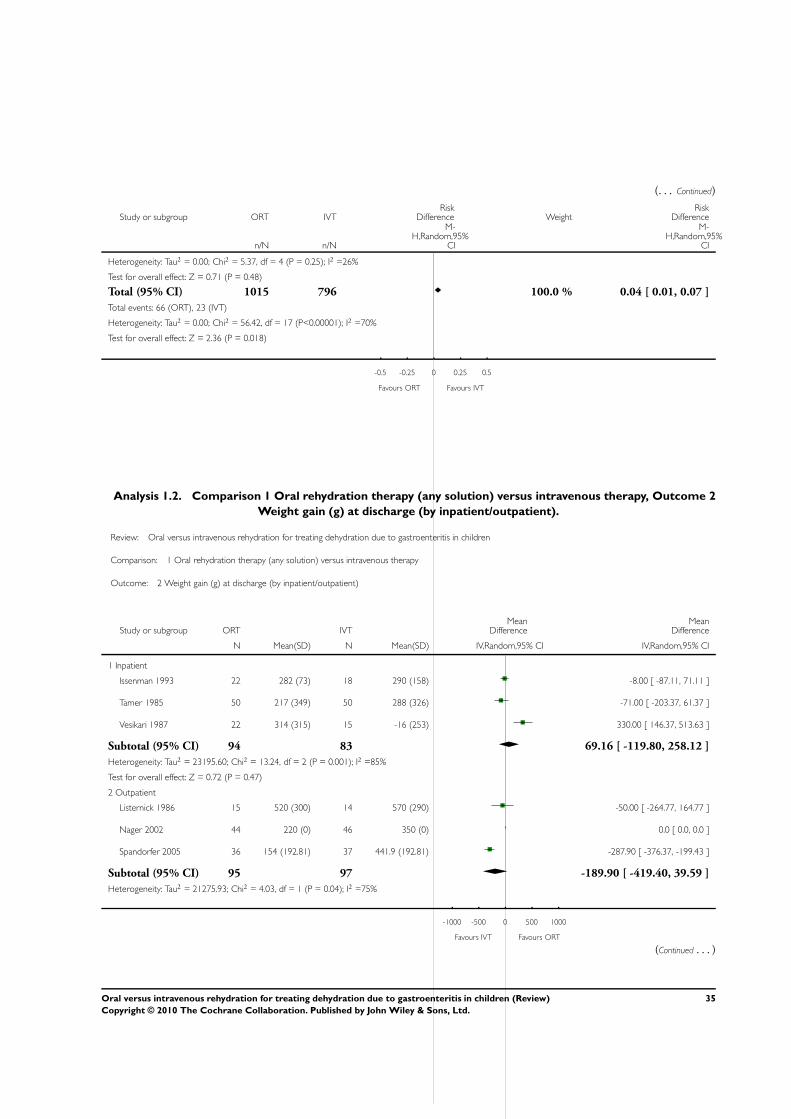
(. . . Continued)
Study or subgroup ORT IVTRisk
Difference WeightRisk
Difference
n/N n/N
M-H,Random,95%
CI
M-H,Random,95%
CI
Heterogeneity: Tau2 = 0.00; Chi2 = 5.37, df = 4 (P = 0.25); I2 =26%
Test for overall effect: Z = 0.71 (P = 0.48)
Total (95% CI) 1015 796 100.0 % 0.04 [ 0.01, 0.07 ]
Total events: 66 (ORT), 23 (IVT)
Heterogeneity: Tau2 = 0.00; Chi2 = 56.42, df = 17 (P<0.00001); I2 =70%
Test for overall effect: Z = 2.36 (P = 0.018)
-0.5 -0.25 0 0.25 0.5
Favours ORT Favours IVT
Analysis 1.2. Comparison 1 Oral rehydration therapy (any solution) versus intravenous therapy, Outcome 2
Weight gain (g) at discharge (by inpatient/outpatient).
Review: Oral versus intravenous rehydration for treating dehydration due to gastroenteritis in children
Comparison: 1 Oral rehydration therapy (any solution) versus intravenous therapy
Outcome: 2 Weight gain (g) at discharge (by inpatient/outpatient)
Study or subgroup ORT IVTMean
DifferenceMean
Difference
N Mean(SD) N Mean(SD) IV,Random,95% CI IV,Random,95% CI
1 Inpatient
Issenman 1993 22 282 (73) 18 290 (158) -8.00 [ -87.11, 71.11 ]
Tamer 1985 50 217 (349) 50 288 (326) -71.00 [ -203.37, 61.37 ]
Vesikari 1987 22 314 (315) 15 -16 (253) 330.00 [ 146.37, 513.63 ]
Subtotal (95% CI) 94 83 69.16 [ -119.80, 258.12 ]
Heterogeneity: Tau2 = 23195.60; Chi2 = 13.24, df = 2 (P = 0.001); I2 =85%
Test for overall effect: Z = 0.72 (P = 0.47)
2 Outpatient
Listernick 1986 15 520 (300) 14 570 (290) -50.00 [ -264.77, 164.77 ]
Nager 2002 44 220 (0) 46 350 (0) 0.0 [ 0.0, 0.0 ]
Spandorfer 2005 36 154 (192.81) 37 441.9 (192.81) -287.90 [ -376.37, -199.43 ]
Subtotal (95% CI) 95 97 -189.90 [ -419.40, 39.59 ]
Heterogeneity: Tau2 = 21275.93; Chi2 = 4.03, df = 1 (P = 0.04); I2 =75%
-1000 -500 0 500 1000
Favours IVT Favours ORT
(Continued . . . )
35Oral versus intravenous rehydration for treating dehydration due to gastroenteritis in children (Review)
Copyright © 2010 The Cochrane Collaboration. Published by John Wiley & Sons, Ltd.
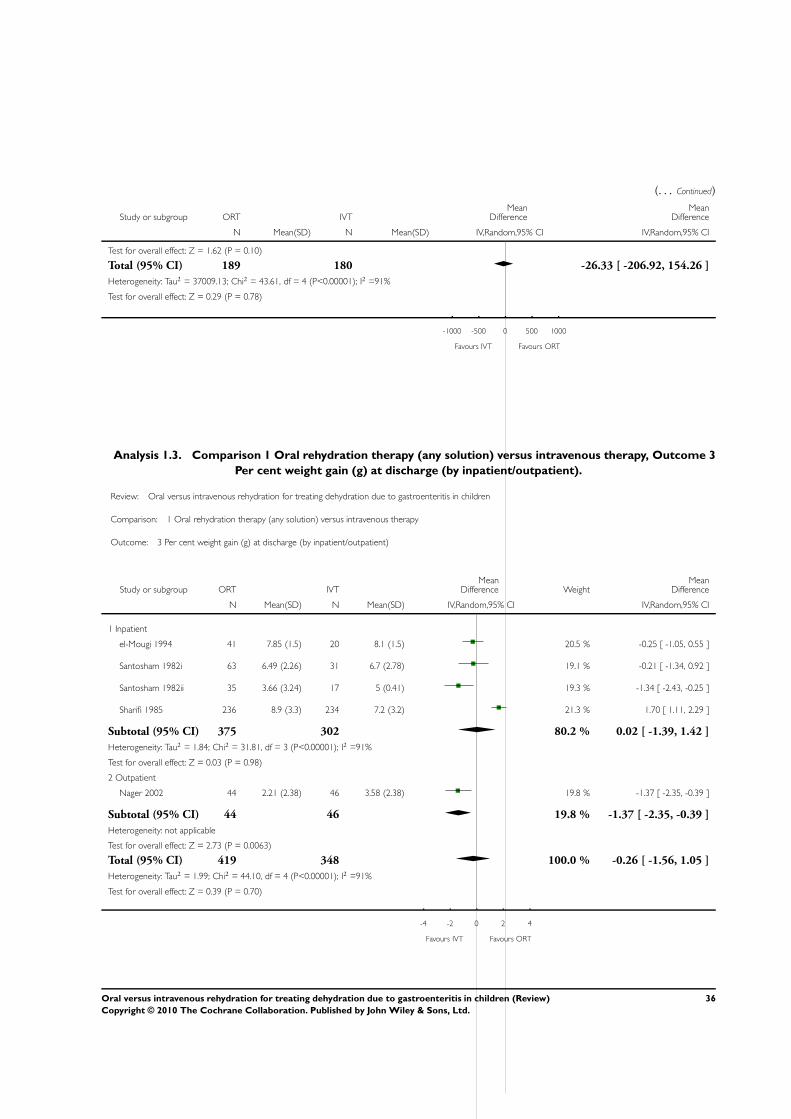
(. . . Continued)
Study or subgroup ORT IVTMean
DifferenceMean
Difference
N Mean(SD) N Mean(SD) IV,Random,95% CI IV,Random,95% CI
Test for overall effect: Z = 1.62 (P = 0.10)
Total (95% CI) 189 180 -26.33 [ -206.92, 154.26 ]
Heterogeneity: Tau2 = 37009.13; Chi2 = 43.61, df = 4 (P<0.00001); I2 =91%
Test for overall effect: Z = 0.29 (P = 0.78)
-1000 -500 0 500 1000
Favours IVT Favours ORT
Analysis 1.3. Comparison 1 Oral rehydration therapy (any solution) versus intravenous therapy, Outcome 3
Per cent weight gain (g) at discharge (by inpatient/outpatient).
Review: Oral versus intravenous rehydration for treating dehydration due to gastroenteritis in children
Comparison: 1 Oral rehydration therapy (any solution) versus intravenous therapy
Outcome: 3 Per cent weight gain (g) at discharge (by inpatient/outpatient)
Study or subgroup ORT IVTMean
Difference WeightMean
Difference
N Mean(SD) N Mean(SD) IV,Random,95% CI IV,Random,95% CI
1 Inpatient
el-Mougi 1994 41 7.85 (1.5) 20 8.1 (1.5) 20.5 % -0.25 [ -1.05, 0.55 ]
Santosham 1982i 63 6.49 (2.26) 31 6.7 (2.78) 19.1 % -0.21 [ -1.34, 0.92 ]
Santosham 1982ii 35 3.66 (3.24) 17 5 (0.41) 19.3 % -1.34 [ -2.43, -0.25 ]
Sharifi 1985 236 8.9 (3.3) 234 7.2 (3.2) 21.3 % 1.70 [ 1.11, 2.29 ]
Subtotal (95% CI) 375 302 80.2 % 0.02 [ -1.39, 1.42 ]
Heterogeneity: Tau2 = 1.84; Chi2 = 31.81, df = 3 (P<0.00001); I2 =91%
Test for overall effect: Z = 0.03 (P = 0.98)
2 Outpatient
Nager 2002 44 2.21 (2.38) 46 3.58 (2.38) 19.8 % -1.37 [ -2.35, -0.39 ]
Subtotal (95% CI) 44 46 19.8 % -1.37 [ -2.35, -0.39 ]
Heterogeneity: not applicable
Test for overall effect: Z = 2.73 (P = 0.0063)
Total (95% CI) 419 348 100.0 % -0.26 [ -1.56, 1.05 ]
Heterogeneity: Tau2 = 1.99; Chi2 = 44.10, df = 4 (P<0.00001); I2 =91%
Test for overall effect: Z = 0.39 (P = 0.70)
-4 -2 0 2 4
Favours IVT Favours ORT
36Oral versus intravenous rehydration for treating dehydration due to gastroenteritis in children (Review)
Copyright © 2010 The Cochrane Collaboration. Published by John Wiley & Sons, Ltd.
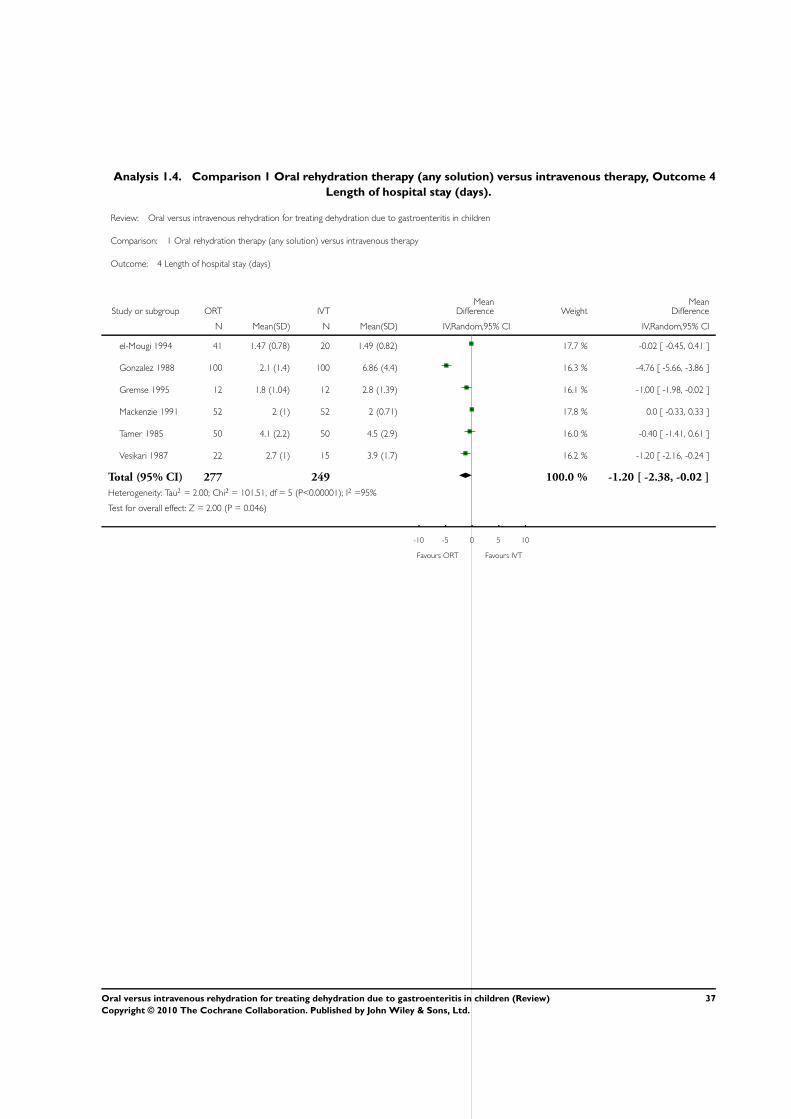
Analysis 1.4. Comparison 1 Oral rehydration therapy (any solution) versus intravenous therapy, Outcome 4
Length of hospital stay (days).
Review: Oral versus intravenous rehydration for treating dehydration due to gastroenteritis in children
Comparison: 1 Oral rehydration therapy (any solution) versus intravenous therapy
Outcome: 4 Length of hospital stay (days)
Study or subgroup ORT IVTMean
Difference WeightMean
Difference
N Mean(SD) N Mean(SD) IV,Random,95% CI IV,Random,95% CI
el-Mougi 1994 41 1.47 (0.78) 20 1.49 (0.82) 17.7 % -0.02 [ -0.45, 0.41 ]
Gonzalez 1988 100 2.1 (1.4) 100 6.86 (4.4) 16.3 % -4.76 [ -5.66, -3.86 ]
Gremse 1995 12 1.8 (1.04) 12 2.8 (1.39) 16.1 % -1.00 [ -1.98, -0.02 ]
Mackenzie 1991 52 2 (1) 52 2 (0.71) 17.8 % 0.0 [ -0.33, 0.33 ]
Tamer 1985 50 4.1 (2.2) 50 4.5 (2.9) 16.0 % -0.40 [ -1.41, 0.61 ]
Vesikari 1987 22 2.7 (1) 15 3.9 (1.7) 16.2 % -1.20 [ -2.16, -0.24 ]
Total (95% CI) 277 249 100.0 % -1.20 [ -2.38, -0.02 ]
Heterogeneity: Tau2 = 2.00; Chi2 = 101.51, df = 5 (P<0.00001); I2 =95%
Test for overall effect: Z = 2.00 (P = 0.046)
-10 -5 0 5 10
Favours ORT Favours IVT
37Oral versus intravenous rehydration for treating dehydration due to gastroenteritis in children (Review)
Copyright © 2010 The Cochrane Collaboration. Published by John Wiley & Sons, Ltd.
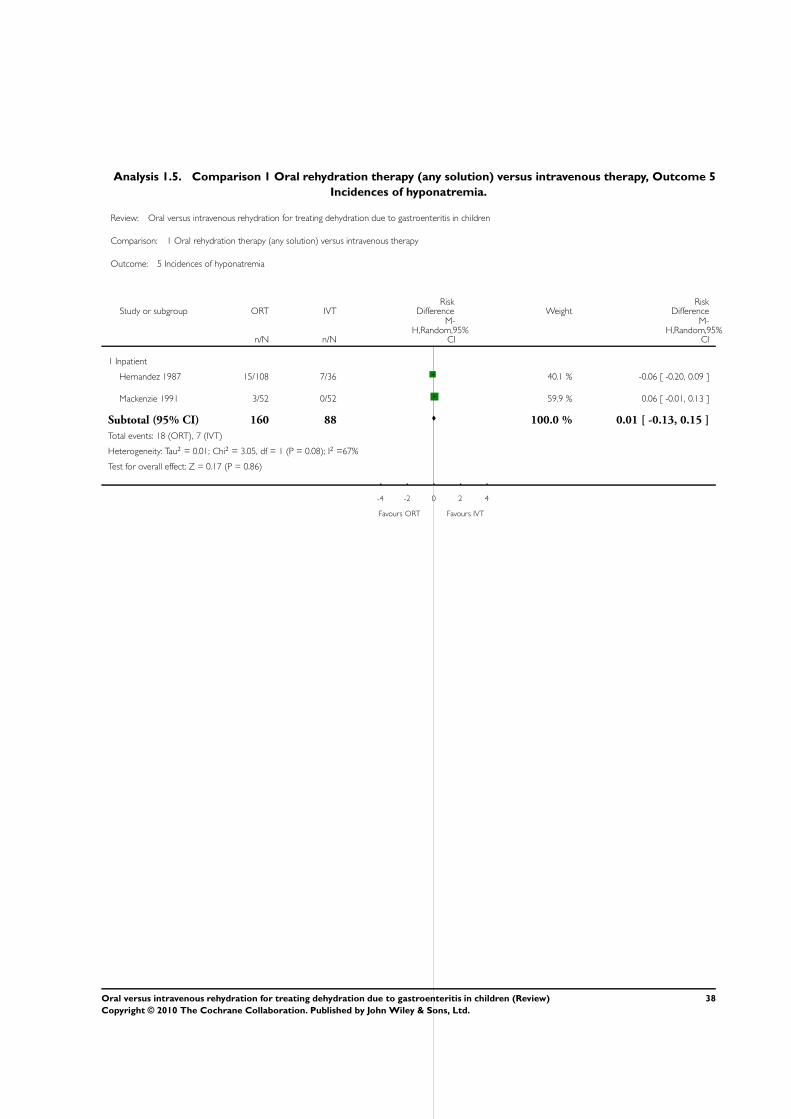
Analysis 1.5. Comparison 1 Oral rehydration therapy (any solution) versus intravenous therapy, Outcome 5
Incidences of hyponatremia.
Review: Oral versus intravenous rehydration for treating dehydration due to gastroenteritis in children
Comparison: 1 Oral rehydration therapy (any solution) versus intravenous therapy
Outcome: 5 Incidences of hyponatremia
Study or subgroup ORT IVTRisk
Difference WeightRisk
Difference
n/N n/N
M-H,Random,95%
CI
M-H,Random,95%
CI
1 Inpatient
Hernandez 1987 15/108 7/36 40.1 % -0.06 [ -0.20, 0.09 ]
Mackenzie 1991 3/52 0/52 59.9 % 0.06 [ -0.01, 0.13 ]
Subtotal (95% CI) 160 88 100.0 % 0.01 [ -0.13, 0.15 ]
Total events: 18 (ORT), 7 (IVT)
Heterogeneity: Tau2 = 0.01; Chi2 = 3.05, df = 1 (P = 0.08); I2 =67%
Test for overall effect: Z = 0.17 (P = 0.86)
-4 -2 0 2 4
Favours ORT Favours IVT
38Oral versus intravenous rehydration for treating dehydration due to gastroenteritis in children (Review)
Copyright © 2010 The Cochrane Collaboration. Published by John Wiley & Sons, Ltd.
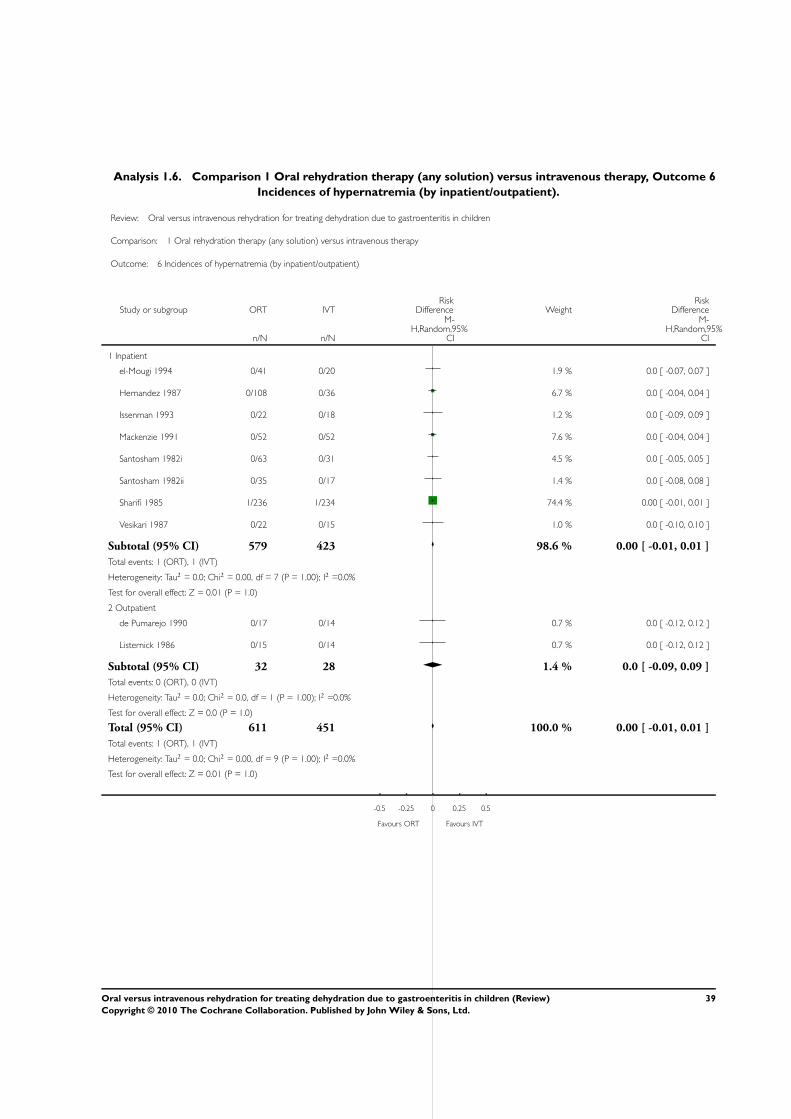
Analysis 1.6. Comparison 1 Oral rehydration therapy (any solution) versus intravenous therapy, Outcome 6
Incidences of hypernatremia (by inpatient/outpatient).
Review: Oral versus intravenous rehydration for treating dehydration due to gastroenteritis in children
Comparison: 1 Oral rehydration therapy (any solution) versus intravenous therapy
Outcome: 6 Incidences of hypernatremia (by inpatient/outpatient)
Study or subgroup ORT IVTRisk
Difference WeightRisk
Difference
n/N n/N
M-H,Random,95%
CI
M-H,Random,95%
CI
1 Inpatient
el-Mougi 1994 0/41 0/20 1.9 % 0.0 [ -0.07, 0.07 ]
Hernandez 1987 0/108 0/36 6.7 % 0.0 [ -0.04, 0.04 ]
Issenman 1993 0/22 0/18 1.2 % 0.0 [ -0.09, 0.09 ]
Mackenzie 1991 0/52 0/52 7.6 % 0.0 [ -0.04, 0.04 ]
Santosham 1982i 0/63 0/31 4.5 % 0.0 [ -0.05, 0.05 ]
Santosham 1982ii 0/35 0/17 1.4 % 0.0 [ -0.08, 0.08 ]
Sharifi 1985 1/236 1/234 74.4 % 0.00 [ -0.01, 0.01 ]
Vesikari 1987 0/22 0/15 1.0 % 0.0 [ -0.10, 0.10 ]
Subtotal (95% CI) 579 423 98.6 % 0.00 [ -0.01, 0.01 ]
Total events: 1 (ORT), 1 (IVT)
Heterogeneity: Tau2 = 0.0; Chi2 = 0.00, df = 7 (P = 1.00); I2 =0.0%
Test for overall effect: Z = 0.01 (P = 1.0)
2 Outpatient
de Pumarejo 1990 0/17 0/14 0.7 % 0.0 [ -0.12, 0.12 ]
Listernick 1986 0/15 0/14 0.7 % 0.0 [ -0.12, 0.12 ]
Subtotal (95% CI) 32 28 1.4 % 0.0 [ -0.09, 0.09 ]
Total events: 0 (ORT), 0 (IVT)
Heterogeneity: Tau2 = 0.0; Chi2 = 0.0, df = 1 (P = 1.00); I2 =0.0%
Test for overall effect: Z = 0.0 (P = 1.0)
Total (95% CI) 611 451 100.0 % 0.00 [ -0.01, 0.01 ]
Total events: 1 (ORT), 1 (IVT)
Heterogeneity: Tau2 = 0.0; Chi2 = 0.00, df = 9 (P = 1.00); I2 =0.0%
Test for overall effect: Z = 0.01 (P = 1.0)
-0.5 -0.25 0 0.25 0.5
Favours ORT Favours IVT
39Oral versus intravenous rehydration for treating dehydration due to gastroenteritis in children (Review)
Copyright © 2010 The Cochrane Collaboration. Published by John Wiley & Sons, Ltd.
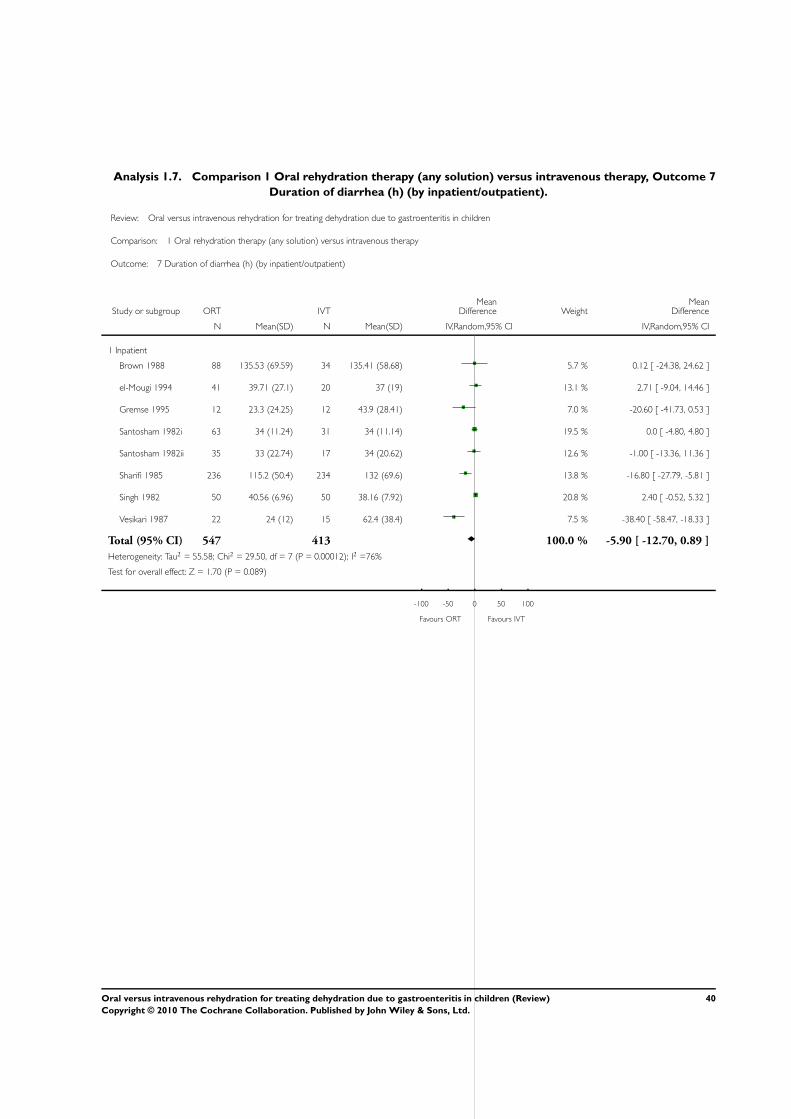
Analysis 1.7. Comparison 1 Oral rehydration therapy (any solution) versus intravenous therapy, Outcome 7
Duration of diarrhea (h) (by inpatient/outpatient).
Review: Oral versus intravenous rehydration for treating dehydration due to gastroenteritis in children
Comparison: 1 Oral rehydration therapy (any solution) versus intravenous therapy
Outcome: 7 Duration of diarrhea (h) (by inpatient/outpatient)
Study or subgroup ORT IVTMean
Difference WeightMean
Difference
N Mean(SD) N Mean(SD) IV,Random,95% CI IV,Random,95% CI
1 Inpatient
Brown 1988 88 135.53 (69.59) 34 135.41 (58.68) 5.7 % 0.12 [ -24.38, 24.62 ]
el-Mougi 1994 41 39.71 (27.1) 20 37 (19) 13.1 % 2.71 [ -9.04, 14.46 ]
Gremse 1995 12 23.3 (24.25) 12 43.9 (28.41) 7.0 % -20.60 [ -41.73, 0.53 ]
Santosham 1982i 63 34 (11.24) 31 34 (11.14) 19.5 % 0.0 [ -4.80, 4.80 ]
Santosham 1982ii 35 33 (22.74) 17 34 (20.62) 12.6 % -1.00 [ -13.36, 11.36 ]
Sharifi 1985 236 115.2 (50.4) 234 132 (69.6) 13.8 % -16.80 [ -27.79, -5.81 ]
Singh 1982 50 40.56 (6.96) 50 38.16 (7.92) 20.8 % 2.40 [ -0.52, 5.32 ]
Vesikari 1987 22 24 (12) 15 62.4 (38.4) 7.5 % -38.40 [ -58.47, -18.33 ]
Total (95% CI) 547 413 100.0 % -5.90 [ -12.70, 0.89 ]
Heterogeneity: Tau2 = 55.58; Chi2 = 29.50, df = 7 (P = 0.00012); I2 =76%
Test for overall effect: Z = 1.70 (P = 0.089)
-100 -50 0 50 100
Favours ORT Favours IVT
40Oral versus intravenous rehydration for treating dehydration due to gastroenteritis in children (Review)
Copyright © 2010 The Cochrane Collaboration. Published by John Wiley & Sons, Ltd.
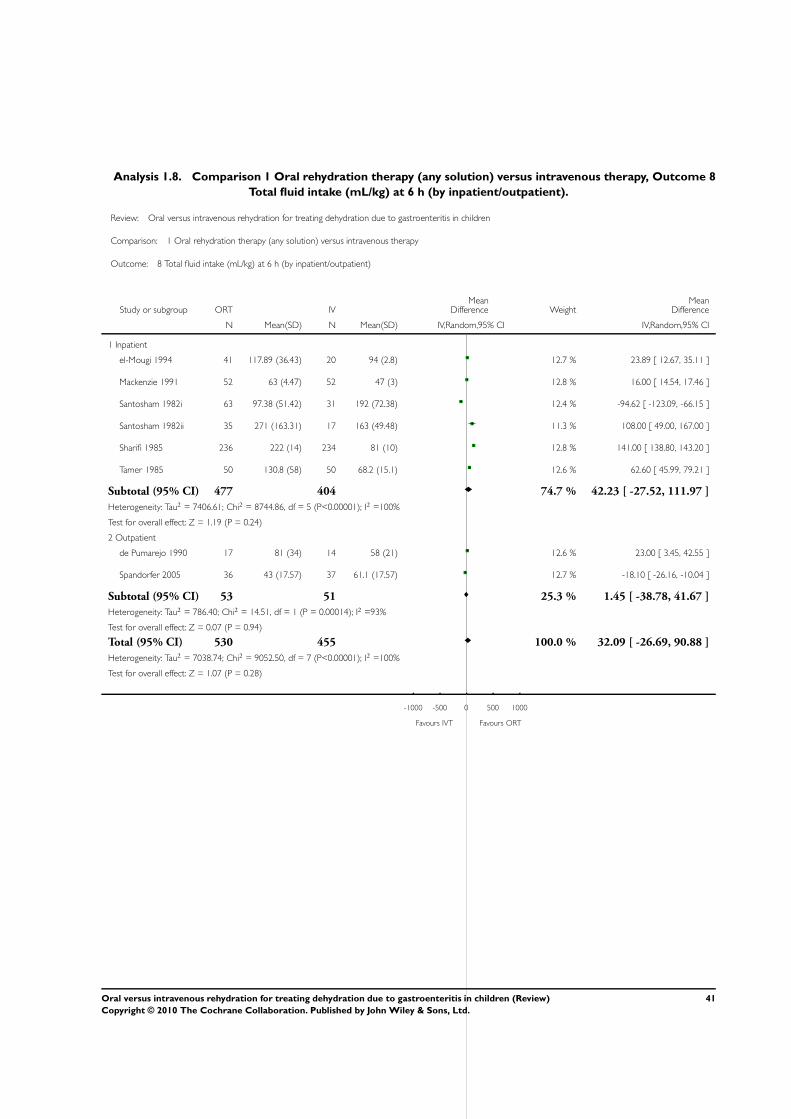
Analysis 1.8. Comparison 1 Oral rehydration therapy (any solution) versus intravenous therapy, Outcome 8
Total fluid intake (mL/kg) at 6 h (by inpatient/outpatient).
Review: Oral versus intravenous rehydration for treating dehydration due to gastroenteritis in children
Comparison: 1 Oral rehydration therapy (any solution) versus intravenous therapy
Outcome: 8 Total fluid intake (mL/kg) at 6 h (by inpatient/outpatient)
Study or subgroup ORT IVMean
Difference WeightMean
Difference
N Mean(SD) N Mean(SD) IV,Random,95% CI IV,Random,95% CI
1 Inpatient
el-Mougi 1994 41 117.89 (36.43) 20 94 (2.8) 12.7 % 23.89 [ 12.67, 35.11 ]
Mackenzie 1991 52 63 (4.47) 52 47 (3) 12.8 % 16.00 [ 14.54, 17.46 ]
Santosham 1982i 63 97.38 (51.42) 31 192 (72.38) 12.4 % -94.62 [ -123.09, -66.15 ]
Santosham 1982ii 35 271 (163.31) 17 163 (49.48) 11.3 % 108.00 [ 49.00, 167.00 ]
Sharifi 1985 236 222 (14) 234 81 (10) 12.8 % 141.00 [ 138.80, 143.20 ]
Tamer 1985 50 130.8 (58) 50 68.2 (15.1) 12.6 % 62.60 [ 45.99, 79.21 ]
Subtotal (95% CI) 477 404 74.7 % 42.23 [ -27.52, 111.97 ]
Heterogeneity: Tau2 = 7406.61; Chi2 = 8744.86, df = 5 (P<0.00001); I2 =100%
Test for overall effect: Z = 1.19 (P = 0.24)
2 Outpatient
de Pumarejo 1990 17 81 (34) 14 58 (21) 12.6 % 23.00 [ 3.45, 42.55 ]
Spandorfer 2005 36 43 (17.57) 37 61.1 (17.57) 12.7 % -18.10 [ -26.16, -10.04 ]
Subtotal (95% CI) 53 51 25.3 % 1.45 [ -38.78, 41.67 ]
Heterogeneity: Tau2 = 786.40; Chi2 = 14.51, df = 1 (P = 0.00014); I2 =93%
Test for overall effect: Z = 0.07 (P = 0.94)
Total (95% CI) 530 455 100.0 % 32.09 [ -26.69, 90.88 ]
Heterogeneity: Tau2 = 7038.74; Chi2 = 9052.50, df = 7 (P<0.00001); I2 =100%
Test for overall effect: Z = 1.07 (P = 0.28)
-1000 -500 0 500 1000
Favours IVT Favours ORT
41Oral versus intravenous rehydration for treating dehydration due to gastroenteritis in children (Review)
Copyright © 2010 The Cochrane Collaboration. Published by John Wiley & Sons, Ltd.
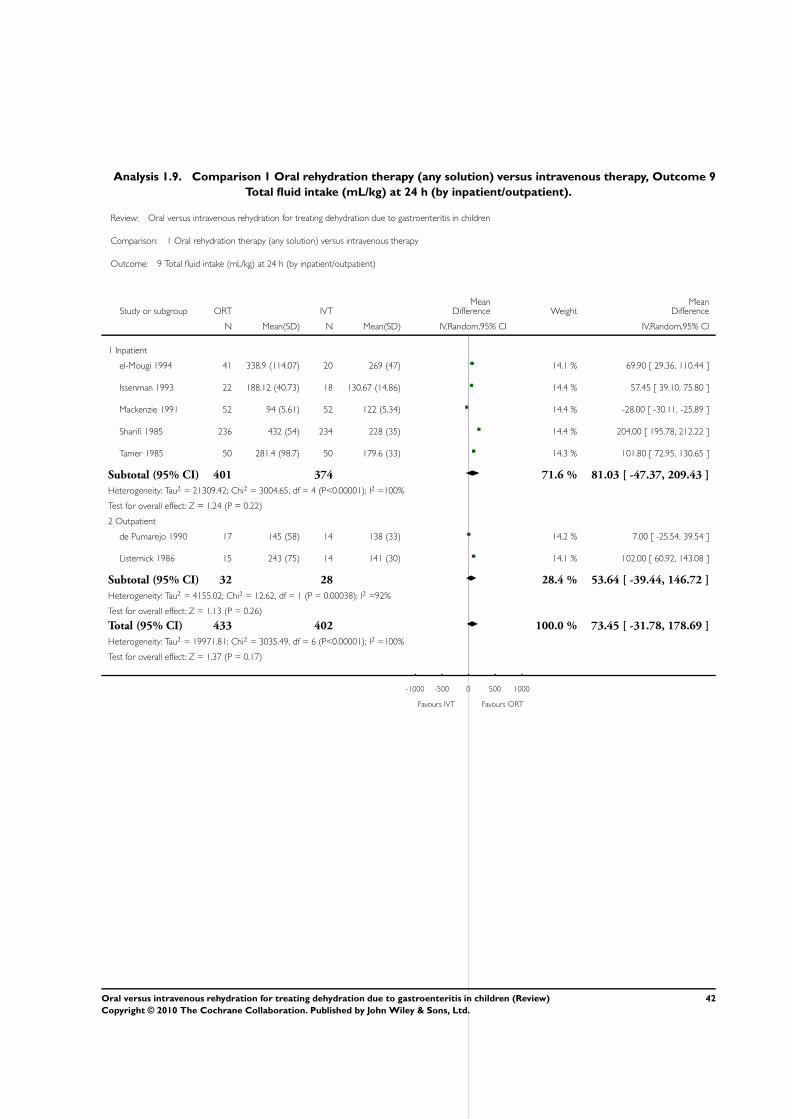
Analysis 1.9. Comparison 1 Oral rehydration therapy (any solution) versus intravenous therapy, Outcome 9
Total fluid intake (mL/kg) at 24 h (by inpatient/outpatient).
Review: Oral versus intravenous rehydration for treating dehydration due to gastroenteritis in children
Comparison: 1 Oral rehydration therapy (any solution) versus intravenous therapy
Outcome: 9 Total fluid intake (mL/kg) at 24 h (by inpatient/outpatient)
Study or subgroup ORT IVTMean
Difference WeightMean
Difference
N Mean(SD) N Mean(SD) IV,Random,95% CI IV,Random,95% CI
1 Inpatient
el-Mougi 1994 41 338.9 (114.07) 20 269 (47) 14.1 % 69.90 [ 29.36, 110.44 ]
Issenman 1993 22 188.12 (40.73) 18 130.67 (14.86) 14.4 % 57.45 [ 39.10, 75.80 ]
Mackenzie 1991 52 94 (5.61) 52 122 (5.34) 14.4 % -28.00 [ -30.11, -25.89 ]
Sharifi 1985 236 432 (54) 234 228 (35) 14.4 % 204.00 [ 195.78, 212.22 ]
Tamer 1985 50 281.4 (98.7) 50 179.6 (33) 14.3 % 101.80 [ 72.95, 130.65 ]
Subtotal (95% CI) 401 374 71.6 % 81.03 [ -47.37, 209.43 ]
Heterogeneity: Tau2 = 21309.42; Chi2 = 3004.65, df = 4 (P<0.00001); I2 =100%
Test for overall effect: Z = 1.24 (P = 0.22)
2 Outpatient
de Pumarejo 1990 17 145 (58) 14 138 (33) 14.2 % 7.00 [ -25.54, 39.54 ]
Listernick 1986 15 243 (75) 14 141 (30) 14.1 % 102.00 [ 60.92, 143.08 ]
Subtotal (95% CI) 32 28 28.4 % 53.64 [ -39.44, 146.72 ]
Heterogeneity: Tau2 = 4155.02; Chi2 = 12.62, df = 1 (P = 0.00038); I2 =92%
Test for overall effect: Z = 1.13 (P = 0.26)
Total (95% CI) 433 402 100.0 % 73.45 [ -31.78, 178.69 ]
Heterogeneity: Tau2 = 19971.81; Chi2 = 3035.49, df = 6 (P<0.00001); I2 =100%
Test for overall effect: Z = 1.37 (P = 0.17)
-1000 -500 0 500 1000
Favours IVT Favours ORT
42Oral versus intravenous rehydration for treating dehydration due to gastroenteritis in children (Review)
Copyright © 2010 The Cochrane Collaboration. Published by John Wiley & Sons, Ltd.
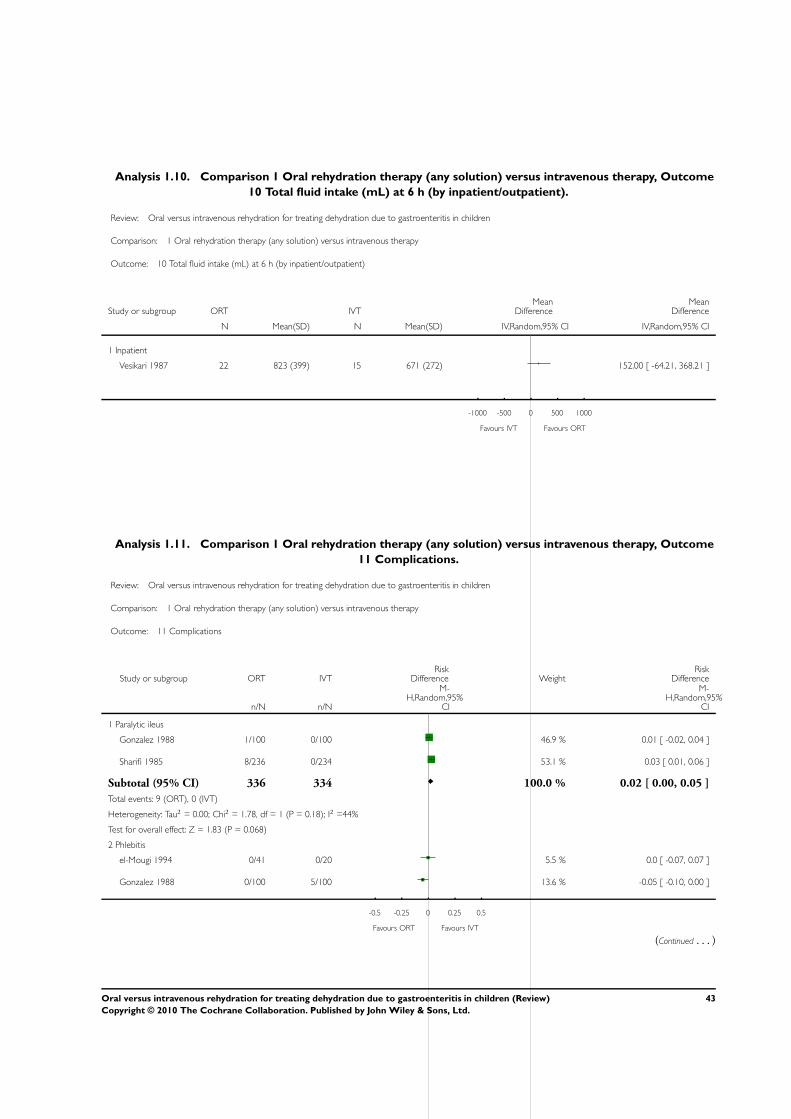
Analysis 1.10. Comparison 1 Oral rehydration therapy (any solution) versus intravenous therapy, Outcome
10 Total fluid intake (mL) at 6 h (by inpatient/outpatient).
Review: Oral versus intravenous rehydration for treating dehydration due to gastroenteritis in children
Comparison: 1 Oral rehydration therapy (any solution) versus intravenous therapy
Outcome: 10 Total fluid intake (mL) at 6 h (by inpatient/outpatient)
Study or subgroup ORT IVTMean
DifferenceMean
Difference
N Mean(SD) N Mean(SD) IV,Random,95% CI IV,Random,95% CI
1 Inpatient
Vesikari 1987 22 823 (399) 15 671 (272) 152.00 [ -64.21, 368.21 ]
-1000 -500 0 500 1000
Favours IVT Favours ORT
Analysis 1.11. Comparison 1 Oral rehydration therapy (any solution) versus intravenous therapy, Outcome
11 Complications.
Review: Oral versus intravenous rehydration for treating dehydration due to gastroenteritis in children
Comparison: 1 Oral rehydration therapy (any solution) versus intravenous therapy
Outcome: 11 Complications
Study or subgroup ORT IVTRisk
Difference WeightRisk
Difference
n/N n/N
M-H,Random,95%
CI
M-H,Random,95%
CI
1 Paralytic ileus
Gonzalez 1988 1/100 0/100 46.9 % 0.01 [ -0.02, 0.04 ]
Sharifi 1985 8/236 0/234 53.1 % 0.03 [ 0.01, 0.06 ]
Subtotal (95% CI) 336 334 100.0 % 0.02 [ 0.00, 0.05 ]
Total events: 9 (ORT), 0 (IVT)
Heterogeneity: Tau2 = 0.00; Chi2 = 1.78, df = 1 (P = 0.18); I2 =44%
Test for overall effect: Z = 1.83 (P = 0.068)
2 Phlebitis
el-Mougi 1994 0/41 0/20 5.5 % 0.0 [ -0.07, 0.07 ]
Gonzalez 1988 0/100 5/100 13.6 % -0.05 [ -0.10, 0.00 ]
-0.5 -0.25 0 0.25 0.5
Favours ORT Favours IVT
(Continued . . . )
43Oral versus intravenous rehydration for treating dehydration due to gastroenteritis in children (Review)
Copyright © 2010 The Cochrane Collaboration. Published by John Wiley & Sons, Ltd.
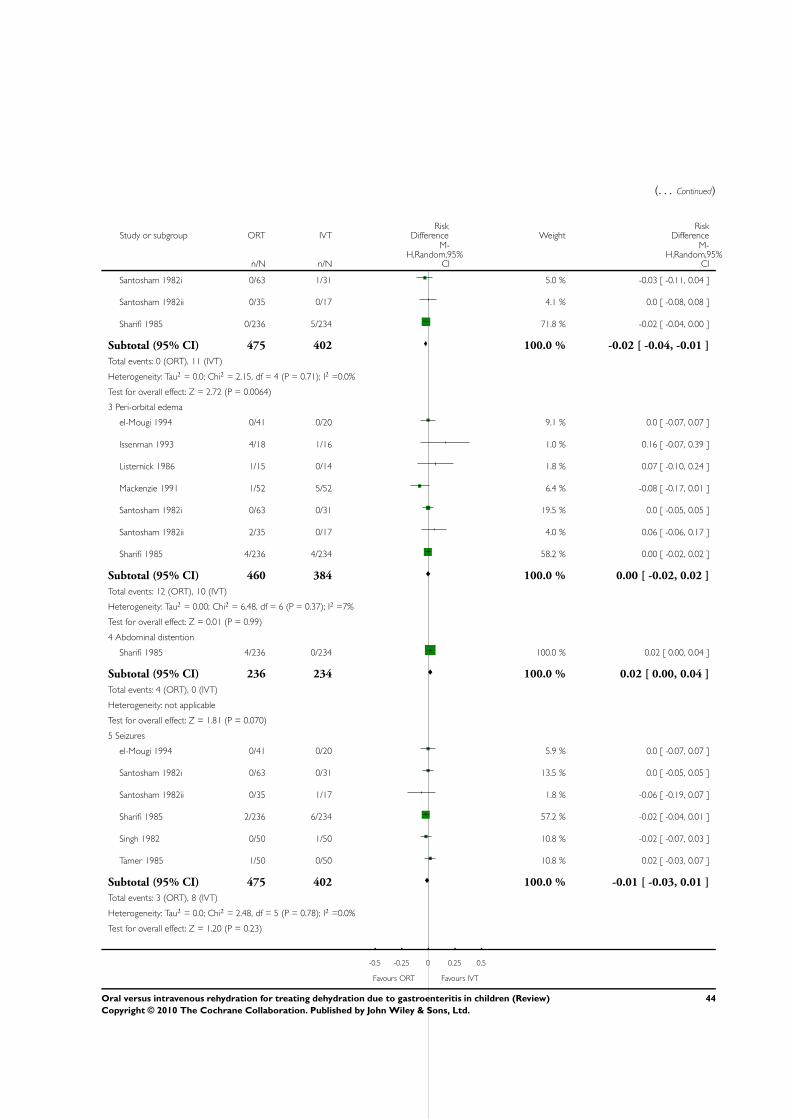
(. . . Continued)
Study or subgroup ORT IVTRisk
Difference WeightRisk
Difference
n/N n/N
M-H,Random,95%
CI
M-H,Random,95%
CI
Santosham 1982i 0/63 1/31 5.0 % -0.03 [ -0.11, 0.04 ]
Santosham 1982ii 0/35 0/17 4.1 % 0.0 [ -0.08, 0.08 ]
Sharifi 1985 0/236 5/234 71.8 % -0.02 [ -0.04, 0.00 ]
Subtotal (95% CI) 475 402 100.0 % -0.02 [ -0.04, -0.01 ]
Total events: 0 (ORT), 11 (IVT)
Heterogeneity: Tau2 = 0.0; Chi2 = 2.15, df = 4 (P = 0.71); I2 =0.0%
Test for overall effect: Z = 2.72 (P = 0.0064)
3 Peri-orbital edema
el-Mougi 1994 0/41 0/20 9.1 % 0.0 [ -0.07, 0.07 ]
Issenman 1993 4/18 1/16 1.0 % 0.16 [ -0.07, 0.39 ]
Listernick 1986 1/15 0/14 1.8 % 0.07 [ -0.10, 0.24 ]
Mackenzie 1991 1/52 5/52 6.4 % -0.08 [ -0.17, 0.01 ]
Santosham 1982i 0/63 0/31 19.5 % 0.0 [ -0.05, 0.05 ]
Santosham 1982ii 2/35 0/17 4.0 % 0.06 [ -0.06, 0.17 ]
Sharifi 1985 4/236 4/234 58.2 % 0.00 [ -0.02, 0.02 ]
Subtotal (95% CI) 460 384 100.0 % 0.00 [ -0.02, 0.02 ]
Total events: 12 (ORT), 10 (IVT)
Heterogeneity: Tau2 = 0.00; Chi2 = 6.48, df = 6 (P = 0.37); I2 =7%
Test for overall effect: Z = 0.01 (P = 0.99)
4 Abdominal distention
Sharifi 1985 4/236 0/234 100.0 % 0.02 [ 0.00, 0.04 ]
Subtotal (95% CI) 236 234 100.0 % 0.02 [ 0.00, 0.04 ]
Total events: 4 (ORT), 0 (IVT)
Heterogeneity: not applicable
Test for overall effect: Z = 1.81 (P = 0.070)
5 Seizures
el-Mougi 1994 0/41 0/20 5.9 % 0.0 [ -0.07, 0.07 ]
Santosham 1982i 0/63 0/31 13.5 % 0.0 [ -0.05, 0.05 ]
Santosham 1982ii 0/35 1/17 1.8 % -0.06 [ -0.19, 0.07 ]
Sharifi 1985 2/236 6/234 57.2 % -0.02 [ -0.04, 0.01 ]
Singh 1982 0/50 1/50 10.8 % -0.02 [ -0.07, 0.03 ]
Tamer 1985 1/50 0/50 10.8 % 0.02 [ -0.03, 0.07 ]
Subtotal (95% CI) 475 402 100.0 % -0.01 [ -0.03, 0.01 ]
Total events: 3 (ORT), 8 (IVT)
Heterogeneity: Tau2 = 0.0; Chi2 = 2.48, df = 5 (P = 0.78); I2 =0.0%
Test for overall effect: Z = 1.20 (P = 0.23)
-0.5 -0.25 0 0.25 0.5
Favours ORT Favours IVT
44Oral versus intravenous rehydration for treating dehydration due to gastroenteritis in children (Review)
Copyright © 2010 The Cochrane Collaboration. Published by John Wiley & Sons, Ltd.
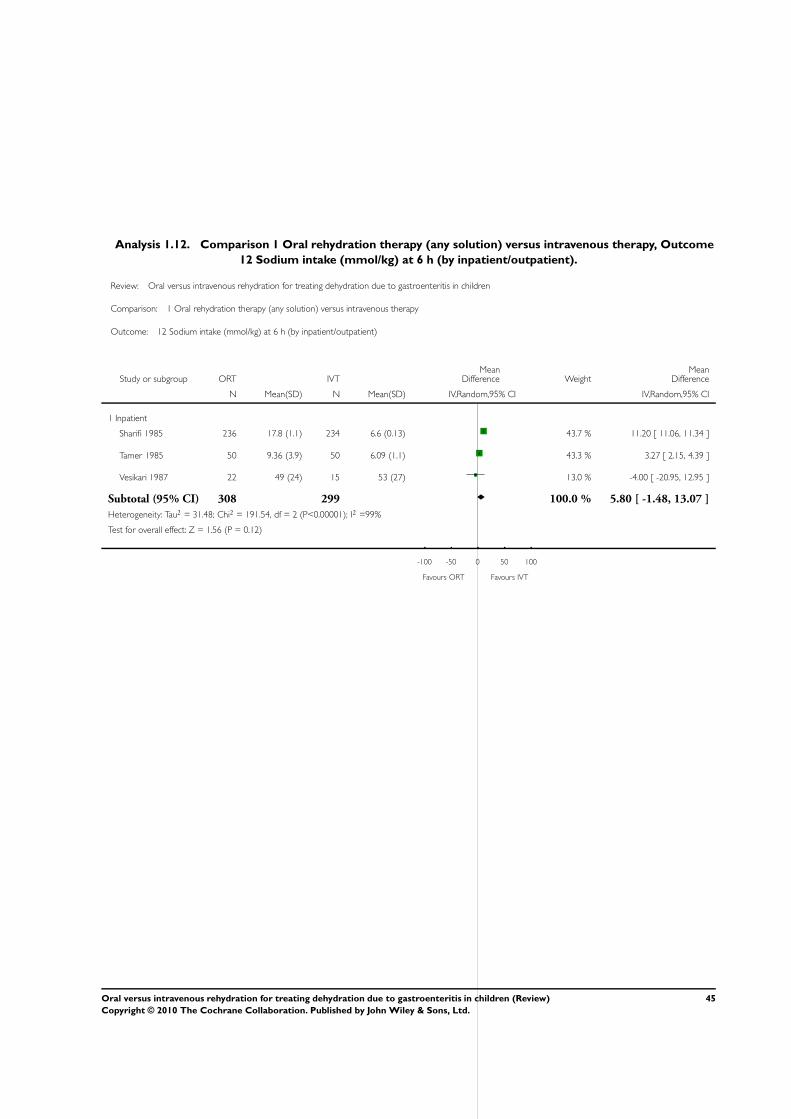
Analysis 1.12. Comparison 1 Oral rehydration therapy (any solution) versus intravenous therapy, Outcome
12 Sodium intake (mmol/kg) at 6 h (by inpatient/outpatient).
Review: Oral versus intravenous rehydration for treating dehydration due to gastroenteritis in children
Comparison: 1 Oral rehydration therapy (any solution) versus intravenous therapy
Outcome: 12 Sodium intake (mmol/kg) at 6 h (by inpatient/outpatient)
Study or subgroup ORT IVTMean
Difference WeightMean
Difference
N Mean(SD) N Mean(SD) IV,Random,95% CI IV,Random,95% CI
1 Inpatient
Sharifi 1985 236 17.8 (1.1) 234 6.6 (0.13) 43.7 % 11.20 [ 11.06, 11.34 ]
Tamer 1985 50 9.36 (3.9) 50 6.09 (1.1) 43.3 % 3.27 [ 2.15, 4.39 ]
Vesikari 1987 22 49 (24) 15 53 (27) 13.0 % -4.00 [ -20.95, 12.95 ]
Subtotal (95% CI) 308 299 100.0 % 5.80 [ -1.48, 13.07 ]
Heterogeneity: Tau2 = 31.48; Chi2 = 191.54, df = 2 (P<0.00001); I2 =99%
Test for overall effect: Z = 1.56 (P = 0.12)
-100 -50 0 50 100
Favours ORT Favours IVT
45Oral versus intravenous rehydration for treating dehydration due to gastroenteritis in children (Review)
Copyright © 2010 The Cochrane Collaboration. Published by John Wiley & Sons, Ltd.
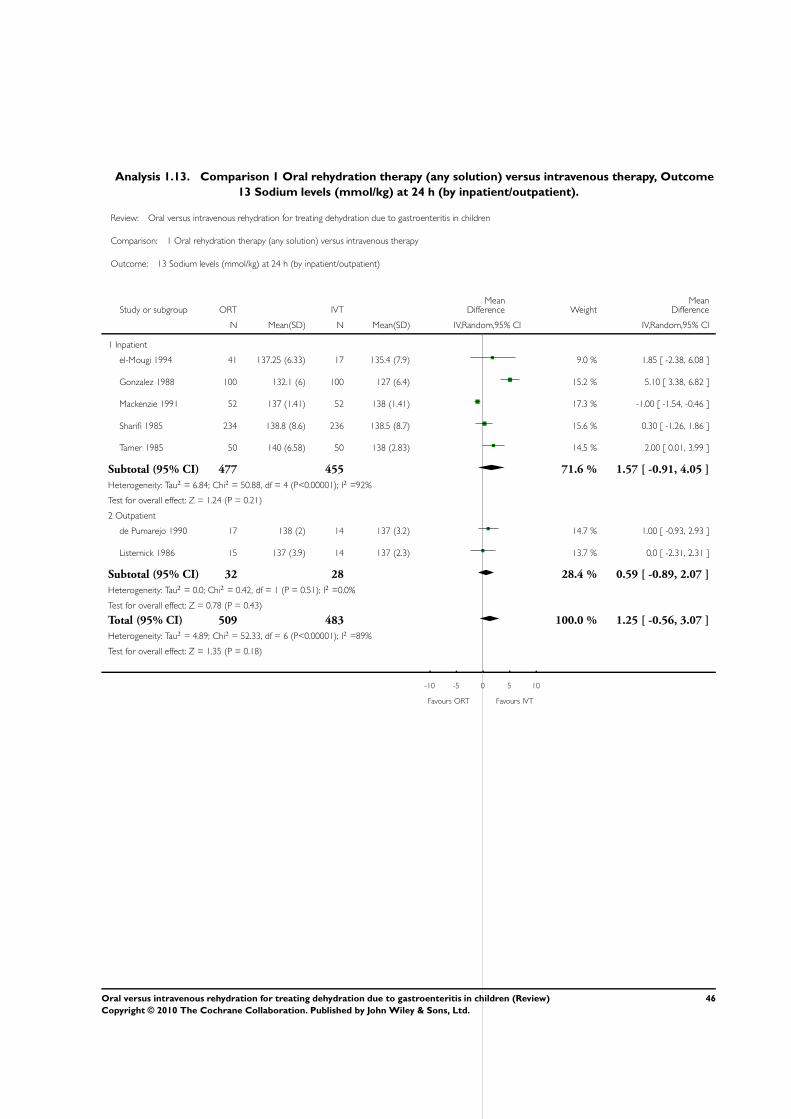
Analysis 1.13. Comparison 1 Oral rehydration therapy (any solution) versus intravenous therapy, Outcome
13 Sodium levels (mmol/kg) at 24 h (by inpatient/outpatient).
Review: Oral versus intravenous rehydration for treating dehydration due to gastroenteritis in children
Comparison: 1 Oral rehydration therapy (any solution) versus intravenous therapy
Outcome: 13 Sodium levels (mmol/kg) at 24 h (by inpatient/outpatient)
Study or subgroup ORT IVTMean
Difference WeightMean
Difference
N Mean(SD) N Mean(SD) IV,Random,95% CI IV,Random,95% CI
1 Inpatient
el-Mougi 1994 41 137.25 (6.33) 17 135.4 (7.9) 9.0 % 1.85 [ -2.38, 6.08 ]
Gonzalez 1988 100 132.1 (6) 100 127 (6.4) 15.2 % 5.10 [ 3.38, 6.82 ]
Mackenzie 1991 52 137 (1.41) 52 138 (1.41) 17.3 % -1.00 [ -1.54, -0.46 ]
Sharifi 1985 234 138.8 (8.6) 236 138.5 (8.7) 15.6 % 0.30 [ -1.26, 1.86 ]
Tamer 1985 50 140 (6.58) 50 138 (2.83) 14.5 % 2.00 [ 0.01, 3.99 ]
Subtotal (95% CI) 477 455 71.6 % 1.57 [ -0.91, 4.05 ]
Heterogeneity: Tau2 = 6.84; Chi2 = 50.88, df = 4 (P<0.00001); I2 =92%
Test for overall effect: Z = 1.24 (P = 0.21)
2 Outpatient
de Pumarejo 1990 17 138 (2) 14 137 (3.2) 14.7 % 1.00 [ -0.93, 2.93 ]
Listernick 1986 15 137 (3.9) 14 137 (2.3) 13.7 % 0.0 [ -2.31, 2.31 ]
Subtotal (95% CI) 32 28 28.4 % 0.59 [ -0.89, 2.07 ]
Heterogeneity: Tau2 = 0.0; Chi2 = 0.42, df = 1 (P = 0.51); I2 =0.0%
Test for overall effect: Z = 0.78 (P = 0.43)
Total (95% CI) 509 483 100.0 % 1.25 [ -0.56, 3.07 ]
Heterogeneity: Tau2 = 4.89; Chi2 = 52.33, df = 6 (P<0.00001); I2 =89%
Test for overall effect: Z = 1.35 (P = 0.18)
-10 -5 0 5 10
Favours ORT Favours IVT
46Oral versus intravenous rehydration for treating dehydration due to gastroenteritis in children (Review)
Copyright © 2010 The Cochrane Collaboration. Published by John Wiley & Sons, Ltd.
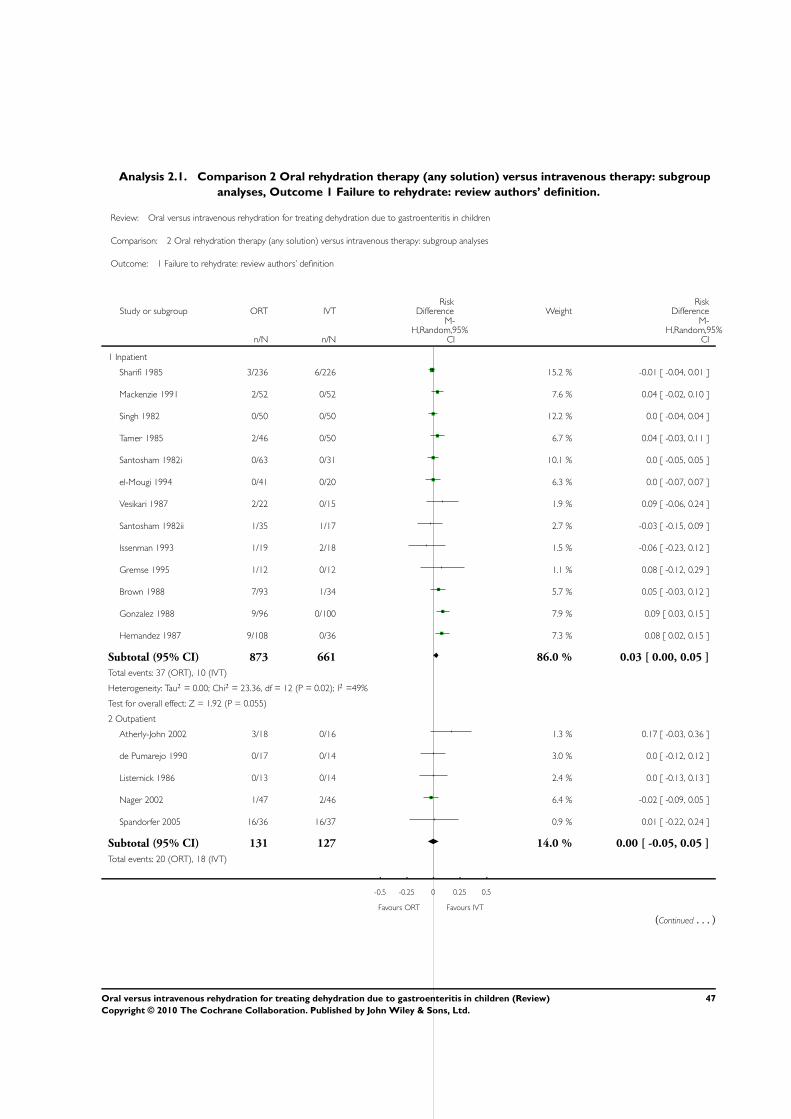
Analysis 2.1. Comparison 2 Oral rehydration therapy (any solution) versus intravenous therapy: subgroup
analyses, Outcome 1 Failure to rehydrate: review authors’ definition.
Review: Oral versus intravenous rehydration for treating dehydration due to gastroenteritis in children
Comparison: 2 Oral rehydration therapy (any solution) versus intravenous therapy: subgroup analyses
Outcome: 1 Failure to rehydrate: review authors’ definition
Study or subgroup ORT IVTRisk
Difference WeightRisk
Difference
n/N n/N
M-H,Random,95%
CI
M-H,Random,95%
CI
1 Inpatient
Sharifi 1985 3/236 6/226 15.2 % -0.01 [ -0.04, 0.01 ]
Mackenzie 1991 2/52 0/52 7.6 % 0.04 [ -0.02, 0.10 ]
Singh 1982 0/50 0/50 12.2 % 0.0 [ -0.04, 0.04 ]
Tamer 1985 2/46 0/50 6.7 % 0.04 [ -0.03, 0.11 ]
Santosham 1982i 0/63 0/31 10.1 % 0.0 [ -0.05, 0.05 ]
el-Mougi 1994 0/41 0/20 6.3 % 0.0 [ -0.07, 0.07 ]
Vesikari 1987 2/22 0/15 1.9 % 0.09 [ -0.06, 0.24 ]
Santosham 1982ii 1/35 1/17 2.7 % -0.03 [ -0.15, 0.09 ]
Issenman 1993 1/19 2/18 1.5 % -0.06 [ -0.23, 0.12 ]
Gremse 1995 1/12 0/12 1.1 % 0.08 [ -0.12, 0.29 ]
Brown 1988 7/93 1/34 5.7 % 0.05 [ -0.03, 0.12 ]
Gonzalez 1988 9/96 0/100 7.9 % 0.09 [ 0.03, 0.15 ]
Hernandez 1987 9/108 0/36 7.3 % 0.08 [ 0.02, 0.15 ]
Subtotal (95% CI) 873 661 86.0 % 0.03 [ 0.00, 0.05 ]
Total events: 37 (ORT), 10 (IVT)
Heterogeneity: Tau2 = 0.00; Chi2 = 23.36, df = 12 (P = 0.02); I2 =49%
Test for overall effect: Z = 1.92 (P = 0.055)
2 Outpatient
Atherly-John 2002 3/18 0/16 1.3 % 0.17 [ -0.03, 0.36 ]
de Pumarejo 1990 0/17 0/14 3.0 % 0.0 [ -0.12, 0.12 ]
Listernick 1986 0/13 0/14 2.4 % 0.0 [ -0.13, 0.13 ]
Nager 2002 1/47 2/46 6.4 % -0.02 [ -0.09, 0.05 ]
Spandorfer 2005 16/36 16/37 0.9 % 0.01 [ -0.22, 0.24 ]
Subtotal (95% CI) 131 127 14.0 % 0.00 [ -0.05, 0.05 ]
Total events: 20 (ORT), 18 (IVT)
-0.5 -0.25 0 0.25 0.5
Favours ORT Favours IVT
(Continued . . . )
47Oral versus intravenous rehydration for treating dehydration due to gastroenteritis in children (Review)
Copyright © 2010 The Cochrane Collaboration. Published by John Wiley & Sons, Ltd.
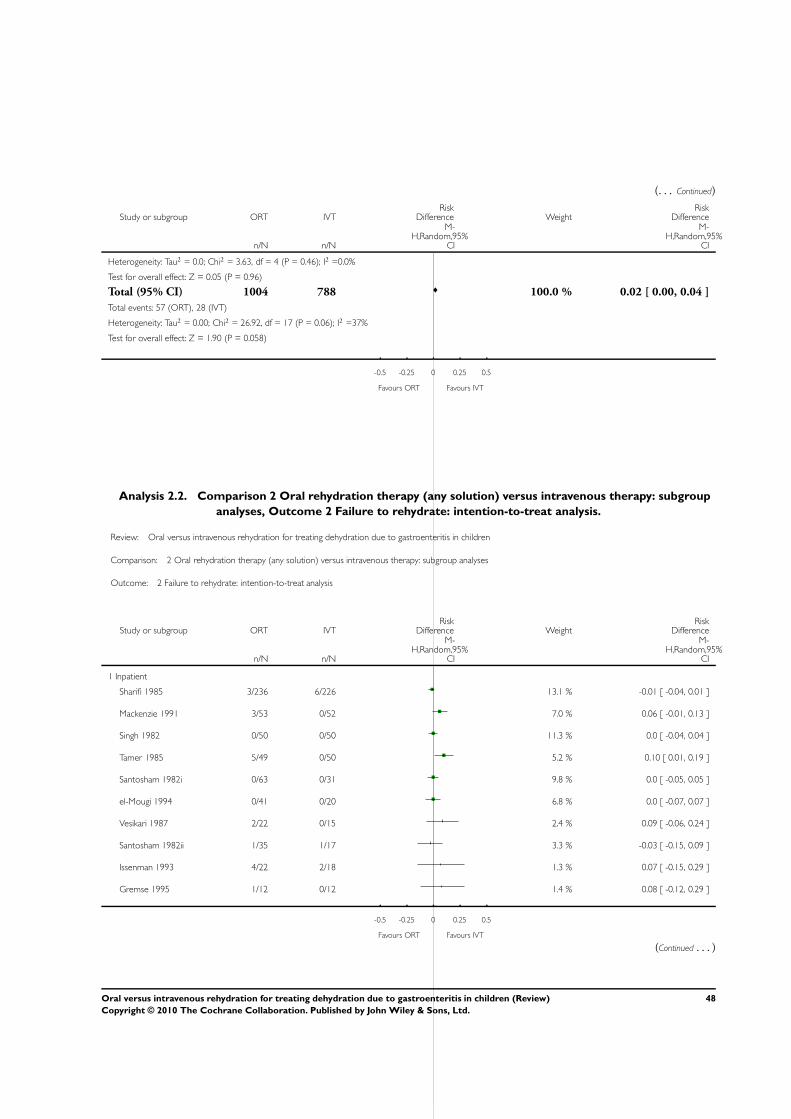
(. . . Continued)
Study or subgroup ORT IVTRisk
Difference WeightRisk
Difference
n/N n/N
M-H,Random,95%
CI
M-H,Random,95%
CI
Heterogeneity: Tau2 = 0.0; Chi2 = 3.63, df = 4 (P = 0.46); I2 =0.0%
Test for overall effect: Z = 0.05 (P = 0.96)
Total (95% CI) 1004 788 100.0 % 0.02 [ 0.00, 0.04 ]
Total events: 57 (ORT), 28 (IVT)
Heterogeneity: Tau2 = 0.00; Chi2 = 26.92, df = 17 (P = 0.06); I2 =37%
Test for overall effect: Z = 1.90 (P = 0.058)
-0.5 -0.25 0 0.25 0.5
Favours ORT Favours IVT
Analysis 2.2. Comparison 2 Oral rehydration therapy (any solution) versus intravenous therapy: subgroup
analyses, Outcome 2 Failure to rehydrate: intention-to-treat analysis.
Review: Oral versus intravenous rehydration for treating dehydration due to gastroenteritis in children
Comparison: 2 Oral rehydration therapy (any solution) versus intravenous therapy: subgroup analyses
Outcome: 2 Failure to rehydrate: intention-to-treat analysis
Study or subgroup ORT IVTRisk
Difference WeightRisk
Difference
n/N n/N
M-H,Random,95%
CI
M-H,Random,95%
CI
1 Inpatient
Sharifi 1985 3/236 6/226 13.1 % -0.01 [ -0.04, 0.01 ]
Mackenzie 1991 3/53 0/52 7.0 % 0.06 [ -0.01, 0.13 ]
Singh 1982 0/50 0/50 11.3 % 0.0 [ -0.04, 0.04 ]
Tamer 1985 5/49 0/50 5.2 % 0.10 [ 0.01, 0.19 ]
Santosham 1982i 0/63 0/31 9.8 % 0.0 [ -0.05, 0.05 ]
el-Mougi 1994 0/41 0/20 6.8 % 0.0 [ -0.07, 0.07 ]
Vesikari 1987 2/22 0/15 2.4 % 0.09 [ -0.06, 0.24 ]
Santosham 1982ii 1/35 1/17 3.3 % -0.03 [ -0.15, 0.09 ]
Issenman 1993 4/22 2/18 1.3 % 0.07 [ -0.15, 0.29 ]
Gremse 1995 1/12 0/12 1.4 % 0.08 [ -0.12, 0.29 ]
-0.5 -0.25 0 0.25 0.5
Favours ORT Favours IVT
(Continued . . . )
48Oral versus intravenous rehydration for treating dehydration due to gastroenteritis in children (Review)
Copyright © 2010 The Cochrane Collaboration. Published by John Wiley & Sons, Ltd.
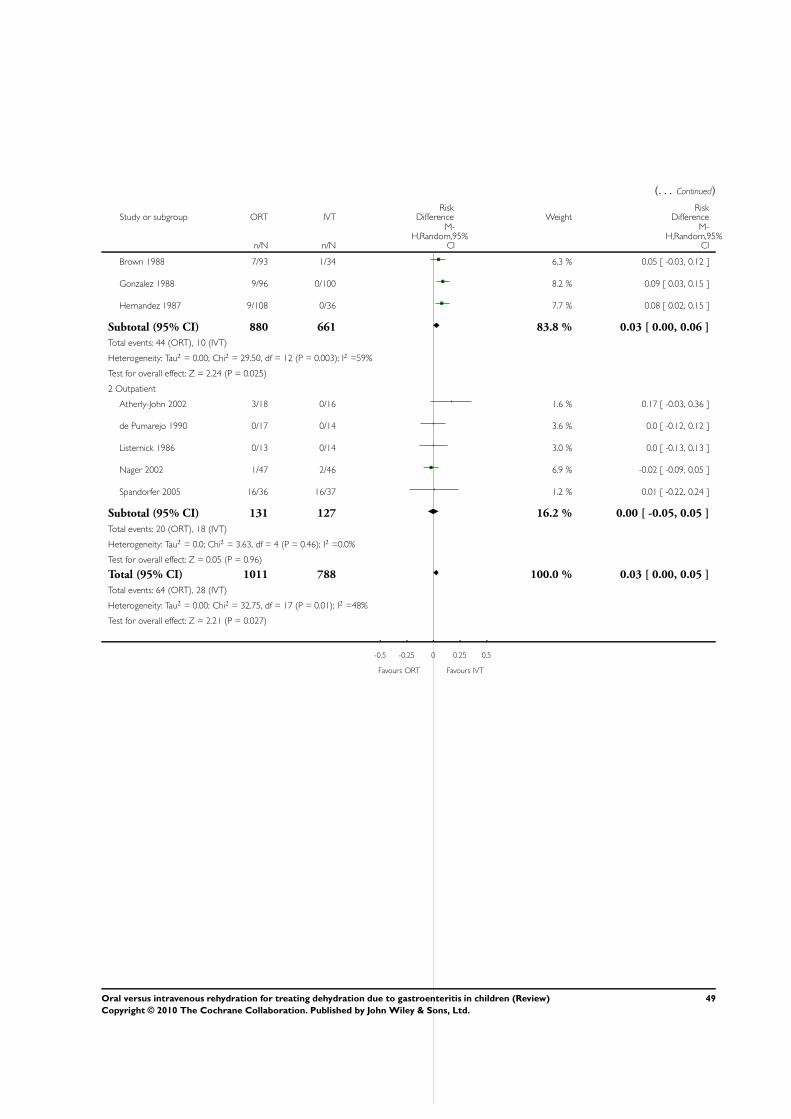
(. . . Continued)
Study or subgroup ORT IVTRisk
Difference WeightRisk
Difference
n/N n/N
M-H,Random,95%
CI
M-H,Random,95%
CI
Brown 1988 7/93 1/34 6.3 % 0.05 [ -0.03, 0.12 ]
Gonzalez 1988 9/96 0/100 8.2 % 0.09 [ 0.03, 0.15 ]
Hernandez 1987 9/108 0/36 7.7 % 0.08 [ 0.02, 0.15 ]
Subtotal (95% CI) 880 661 83.8 % 0.03 [ 0.00, 0.06 ]
Total events: 44 (ORT), 10 (IVT)
Heterogeneity: Tau2 = 0.00; Chi2 = 29.50, df = 12 (P = 0.003); I2 =59%
Test for overall effect: Z = 2.24 (P = 0.025)
2 Outpatient
Atherly-John 2002 3/18 0/16 1.6 % 0.17 [ -0.03, 0.36 ]
de Pumarejo 1990 0/17 0/14 3.6 % 0.0 [ -0.12, 0.12 ]
Listernick 1986 0/13 0/14 3.0 % 0.0 [ -0.13, 0.13 ]
Nager 2002 1/47 2/46 6.9 % -0.02 [ -0.09, 0.05 ]
Spandorfer 2005 16/36 16/37 1.2 % 0.01 [ -0.22, 0.24 ]
Subtotal (95% CI) 131 127 16.2 % 0.00 [ -0.05, 0.05 ]
Total events: 20 (ORT), 18 (IVT)
Heterogeneity: Tau2 = 0.0; Chi2 = 3.63, df = 4 (P = 0.46); I2 =0.0%
Test for overall effect: Z = 0.05 (P = 0.96)
Total (95% CI) 1011 788 100.0 % 0.03 [ 0.00, 0.05 ]
Total events: 64 (ORT), 28 (IVT)
Heterogeneity: Tau2 = 0.00; Chi2 = 32.75, df = 17 (P = 0.01); I2 =48%
Test for overall effect: Z = 2.21 (P = 0.027)
-0.5 -0.25 0 0.25 0.5
Favours ORT Favours IVT
49Oral versus intravenous rehydration for treating dehydration due to gastroenteritis in children (Review)
Copyright © 2010 The Cochrane Collaboration. Published by John Wiley & Sons, Ltd.
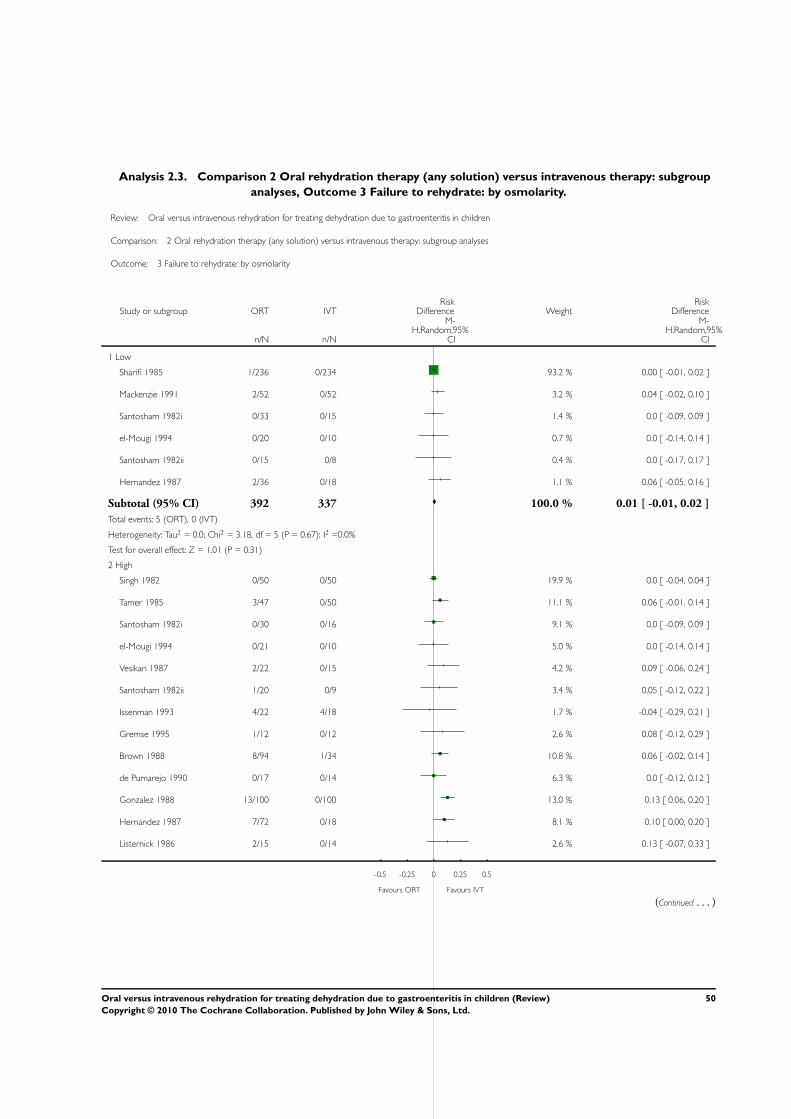
Analysis 2.3. Comparison 2 Oral rehydration therapy (any solution) versus intravenous therapy: subgroup
analyses, Outcome 3 Failure to rehydrate: by osmolarity.
Review: Oral versus intravenous rehydration for treating dehydration due to gastroenteritis in children
Comparison: 2 Oral rehydration therapy (any solution) versus intravenous therapy: subgroup analyses
Outcome: 3 Failure to rehydrate: by osmolarity
Study or subgroup ORT IVTRisk
Difference WeightRisk
Difference
n/N n/N
M-H,Random,95%
CI
M-H,Random,95%
CI
1 Low
Sharifi 1985 1/236 0/234 93.2 % 0.00 [ -0.01, 0.02 ]
Mackenzie 1991 2/52 0/52 3.2 % 0.04 [ -0.02, 0.10 ]
Santosham 1982i 0/33 0/15 1.4 % 0.0 [ -0.09, 0.09 ]
el-Mougi 1994 0/20 0/10 0.7 % 0.0 [ -0.14, 0.14 ]
Santosham 1982ii 0/15 0/8 0.4 % 0.0 [ -0.17, 0.17 ]
Hernandez 1987 2/36 0/18 1.1 % 0.06 [ -0.05, 0.16 ]
Subtotal (95% CI) 392 337 100.0 % 0.01 [ -0.01, 0.02 ]
Total events: 5 (ORT), 0 (IVT)
Heterogeneity: Tau2 = 0.0; Chi2 = 3.18, df = 5 (P = 0.67); I2 =0.0%
Test for overall effect: Z = 1.01 (P = 0.31)
2 High
Singh 1982 0/50 0/50 19.9 % 0.0 [ -0.04, 0.04 ]
Tamer 1985 3/47 0/50 11.1 % 0.06 [ -0.01, 0.14 ]
Santosham 1982i 0/30 0/16 9.1 % 0.0 [ -0.09, 0.09 ]
el-Mougi 1994 0/21 0/10 5.0 % 0.0 [ -0.14, 0.14 ]
Vesikari 1987 2/22 0/15 4.2 % 0.09 [ -0.06, 0.24 ]
Santosham 1982ii 1/20 0/9 3.4 % 0.05 [ -0.12, 0.22 ]
Issenman 1993 4/22 4/18 1.7 % -0.04 [ -0.29, 0.21 ]
Gremse 1995 1/12 0/12 2.6 % 0.08 [ -0.12, 0.29 ]
Brown 1988 8/94 1/34 10.8 % 0.06 [ -0.02, 0.14 ]
de Pumarejo 1990 0/17 0/14 6.3 % 0.0 [ -0.12, 0.12 ]
Gonzalez 1988 13/100 0/100 13.0 % 0.13 [ 0.06, 0.20 ]
Hernandez 1987 7/72 0/18 8.1 % 0.10 [ 0.00, 0.20 ]
Listernick 1986 2/15 0/14 2.6 % 0.13 [ -0.07, 0.33 ]
-0.5 -0.25 0 0.25 0.5
Favours ORT Favours IVT
(Continued . . . )
50Oral versus intravenous rehydration for treating dehydration due to gastroenteritis in children (Review)
Copyright © 2010 The Cochrane Collaboration. Published by John Wiley & Sons, Ltd.
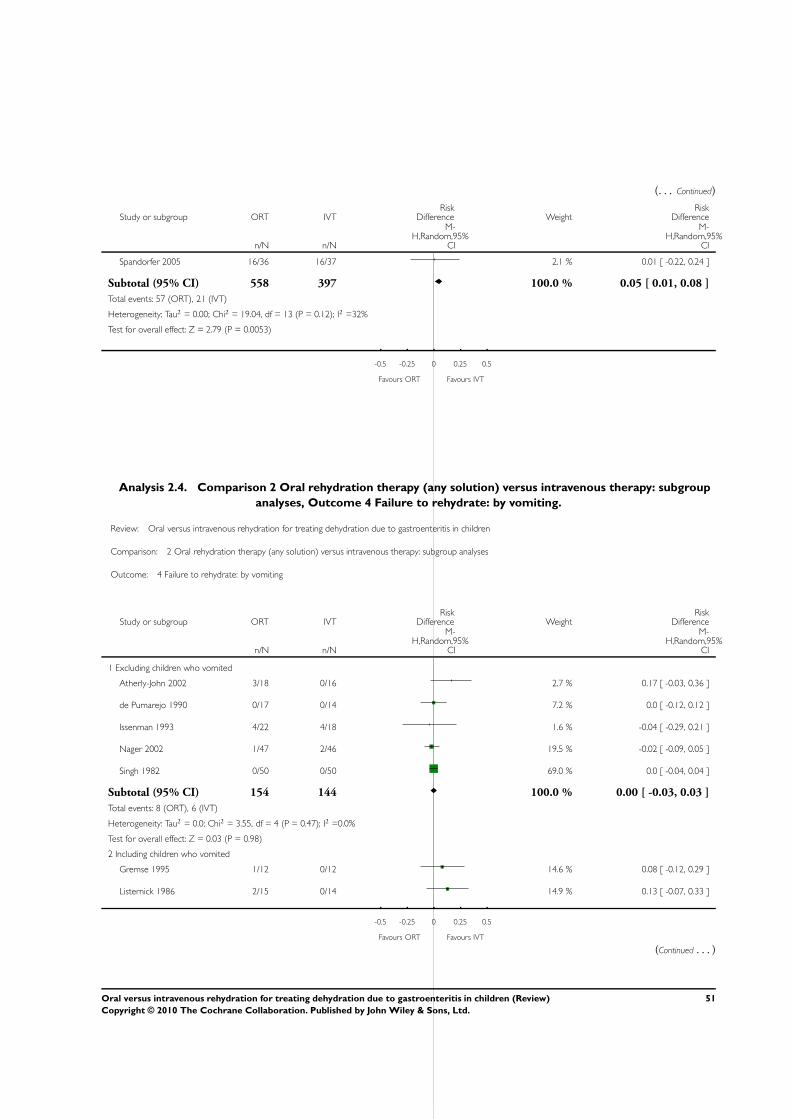
(. . . Continued)
Study or subgroup ORT IVTRisk
Difference WeightRisk
Difference
n/N n/N
M-H,Random,95%
CI
M-H,Random,95%
CI
Spandorfer 2005 16/36 16/37 2.1 % 0.01 [ -0.22, 0.24 ]
Subtotal (95% CI) 558 397 100.0 % 0.05 [ 0.01, 0.08 ]
Total events: 57 (ORT), 21 (IVT)
Heterogeneity: Tau2 = 0.00; Chi2 = 19.04, df = 13 (P = 0.12); I2 =32%
Test for overall effect: Z = 2.79 (P = 0.0053)
-0.5 -0.25 0 0.25 0.5
Favours ORT Favours IVT
Analysis 2.4. Comparison 2 Oral rehydration therapy (any solution) versus intravenous therapy: subgroup
analyses, Outcome 4 Failure to rehydrate: by vomiting.
Review: Oral versus intravenous rehydration for treating dehydration due to gastroenteritis in children
Comparison: 2 Oral rehydration therapy (any solution) versus intravenous therapy: subgroup analyses
Outcome: 4 Failure to rehydrate: by vomiting
Study or subgroup ORT IVTRisk
Difference WeightRisk
Difference
n/N n/N
M-H,Random,95%
CI
M-H,Random,95%
CI
1 Excluding children who vomited
Atherly-John 2002 3/18 0/16 2.7 % 0.17 [ -0.03, 0.36 ]
de Pumarejo 1990 0/17 0/14 7.2 % 0.0 [ -0.12, 0.12 ]
Issenman 1993 4/22 4/18 1.6 % -0.04 [ -0.29, 0.21 ]
Nager 2002 1/47 2/46 19.5 % -0.02 [ -0.09, 0.05 ]
Singh 1982 0/50 0/50 69.0 % 0.0 [ -0.04, 0.04 ]
Subtotal (95% CI) 154 144 100.0 % 0.00 [ -0.03, 0.03 ]
Total events: 8 (ORT), 6 (IVT)
Heterogeneity: Tau2 = 0.0; Chi2 = 3.55, df = 4 (P = 0.47); I2 =0.0%
Test for overall effect: Z = 0.03 (P = 0.98)
2 Including children who vomited
Gremse 1995 1/12 0/12 14.6 % 0.08 [ -0.12, 0.29 ]
Listernick 1986 2/15 0/14 14.9 % 0.13 [ -0.07, 0.33 ]
-0.5 -0.25 0 0.25 0.5
Favours ORT Favours IVT
(Continued . . . )
51Oral versus intravenous rehydration for treating dehydration due to gastroenteritis in children (Review)
Copyright © 2010 The Cochrane Collaboration. Published by John Wiley & Sons, Ltd.
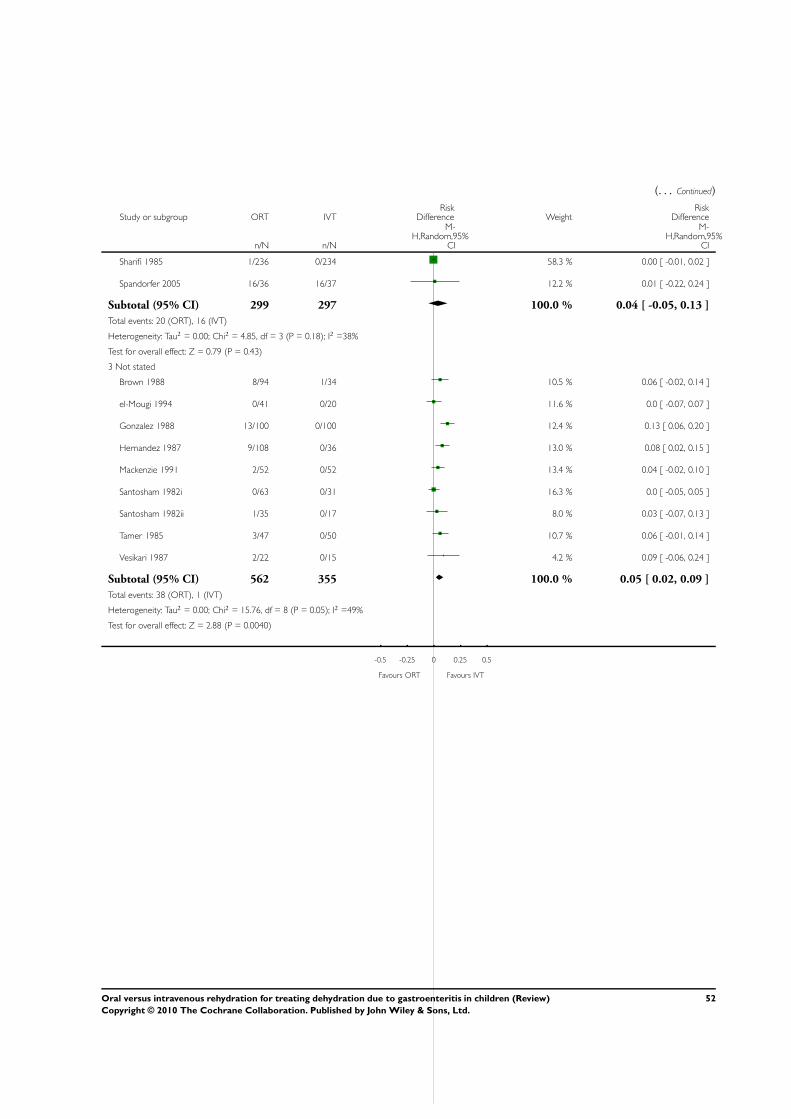
(. . . Continued)
Study or subgroup ORT IVTRisk
Difference WeightRisk
Difference
n/N n/N
M-H,Random,95%
CI
M-H,Random,95%
CI
Sharifi 1985 1/236 0/234 58.3 % 0.00 [ -0.01, 0.02 ]
Spandorfer 2005 16/36 16/37 12.2 % 0.01 [ -0.22, 0.24 ]
Subtotal (95% CI) 299 297 100.0 % 0.04 [ -0.05, 0.13 ]
Total events: 20 (ORT), 16 (IVT)
Heterogeneity: Tau2 = 0.00; Chi2 = 4.85, df = 3 (P = 0.18); I2 =38%
Test for overall effect: Z = 0.79 (P = 0.43)
3 Not stated
Brown 1988 8/94 1/34 10.5 % 0.06 [ -0.02, 0.14 ]
el-Mougi 1994 0/41 0/20 11.6 % 0.0 [ -0.07, 0.07 ]
Gonzalez 1988 13/100 0/100 12.4 % 0.13 [ 0.06, 0.20 ]
Hernandez 1987 9/108 0/36 13.0 % 0.08 [ 0.02, 0.15 ]
Mackenzie 1991 2/52 0/52 13.4 % 0.04 [ -0.02, 0.10 ]
Santosham 1982i 0/63 0/31 16.3 % 0.0 [ -0.05, 0.05 ]
Santosham 1982ii 1/35 0/17 8.0 % 0.03 [ -0.07, 0.13 ]
Tamer 1985 3/47 0/50 10.7 % 0.06 [ -0.01, 0.14 ]
Vesikari 1987 2/22 0/15 4.2 % 0.09 [ -0.06, 0.24 ]
Subtotal (95% CI) 562 355 100.0 % 0.05 [ 0.02, 0.09 ]
Total events: 38 (ORT), 1 (IVT)
Heterogeneity: Tau2 = 0.00; Chi2 = 15.76, df = 8 (P = 0.05); I2 =49%
Test for overall effect: Z = 2.88 (P = 0.0040)
-0.5 -0.25 0 0.25 0.5
Favours ORT Favours IVT
52Oral versus intravenous rehydration for treating dehydration due to gastroenteritis in children (Review)
Copyright © 2010 The Cochrane Collaboration. Published by John Wiley & Sons, Ltd.
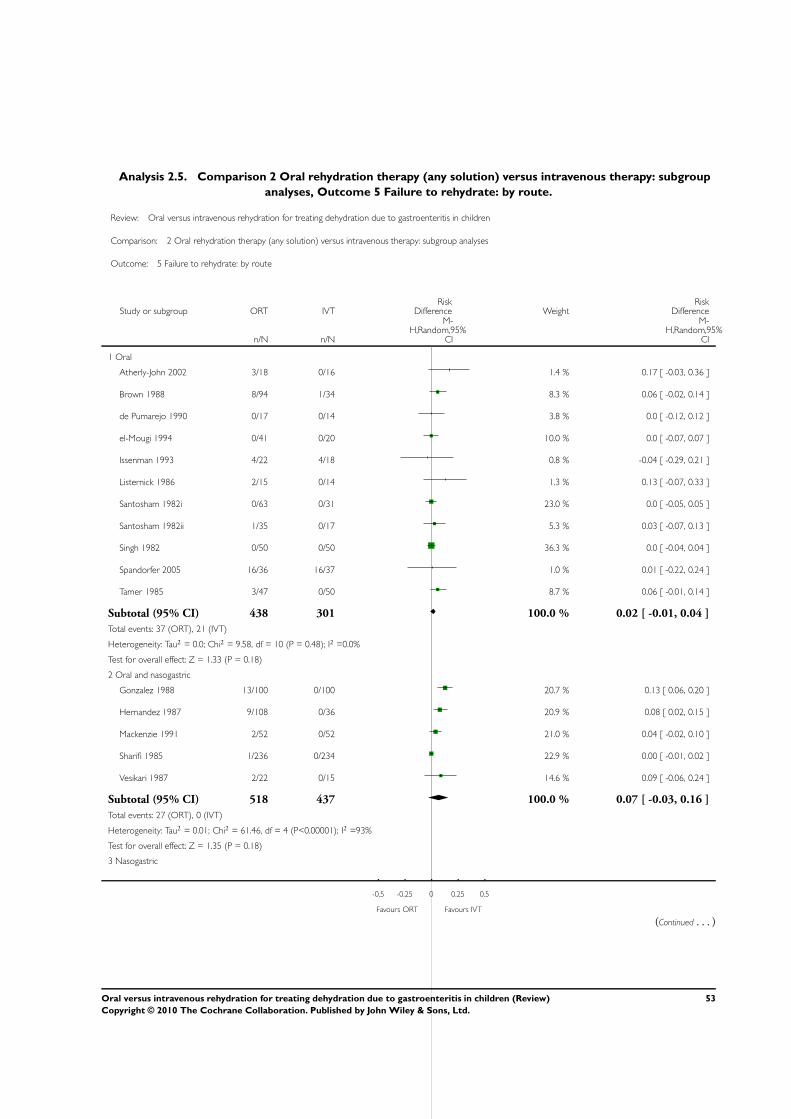
Analysis 2.5. Comparison 2 Oral rehydration therapy (any solution) versus intravenous therapy: subgroup
analyses, Outcome 5 Failure to rehydrate: by route.
Review: Oral versus intravenous rehydration for treating dehydration due to gastroenteritis in children
Comparison: 2 Oral rehydration therapy (any solution) versus intravenous therapy: subgroup analyses
Outcome: 5 Failure to rehydrate: by route
Study or subgroup ORT IVTRisk
Difference WeightRisk
Difference
n/N n/N
M-H,Random,95%
CI
M-H,Random,95%
CI
1 Oral
Atherly-John 2002 3/18 0/16 1.4 % 0.17 [ -0.03, 0.36 ]
Brown 1988 8/94 1/34 8.3 % 0.06 [ -0.02, 0.14 ]
de Pumarejo 1990 0/17 0/14 3.8 % 0.0 [ -0.12, 0.12 ]
el-Mougi 1994 0/41 0/20 10.0 % 0.0 [ -0.07, 0.07 ]
Issenman 1993 4/22 4/18 0.8 % -0.04 [ -0.29, 0.21 ]
Listernick 1986 2/15 0/14 1.3 % 0.13 [ -0.07, 0.33 ]
Santosham 1982i 0/63 0/31 23.0 % 0.0 [ -0.05, 0.05 ]
Santosham 1982ii 1/35 0/17 5.3 % 0.03 [ -0.07, 0.13 ]
Singh 1982 0/50 0/50 36.3 % 0.0 [ -0.04, 0.04 ]
Spandorfer 2005 16/36 16/37 1.0 % 0.01 [ -0.22, 0.24 ]
Tamer 1985 3/47 0/50 8.7 % 0.06 [ -0.01, 0.14 ]
Subtotal (95% CI) 438 301 100.0 % 0.02 [ -0.01, 0.04 ]
Total events: 37 (ORT), 21 (IVT)
Heterogeneity: Tau2 = 0.0; Chi2 = 9.58, df = 10 (P = 0.48); I2 =0.0%
Test for overall effect: Z = 1.33 (P = 0.18)
2 Oral and nasogastric
Gonzalez 1988 13/100 0/100 20.7 % 0.13 [ 0.06, 0.20 ]
Hernandez 1987 9/108 0/36 20.9 % 0.08 [ 0.02, 0.15 ]
Mackenzie 1991 2/52 0/52 21.0 % 0.04 [ -0.02, 0.10 ]
Sharifi 1985 1/236 0/234 22.9 % 0.00 [ -0.01, 0.02 ]
Vesikari 1987 2/22 0/15 14.6 % 0.09 [ -0.06, 0.24 ]
Subtotal (95% CI) 518 437 100.0 % 0.07 [ -0.03, 0.16 ]
Total events: 27 (ORT), 0 (IVT)
Heterogeneity: Tau2 = 0.01; Chi2 = 61.46, df = 4 (P<0.00001); I2 =93%
Test for overall effect: Z = 1.35 (P = 0.18)
3 Nasogastric
-0.5 -0.25 0 0.25 0.5
Favours ORT Favours IVT
(Continued . . . )
53Oral versus intravenous rehydration for treating dehydration due to gastroenteritis in children (Review)
Copyright © 2010 The Cochrane Collaboration. Published by John Wiley & Sons, Ltd.
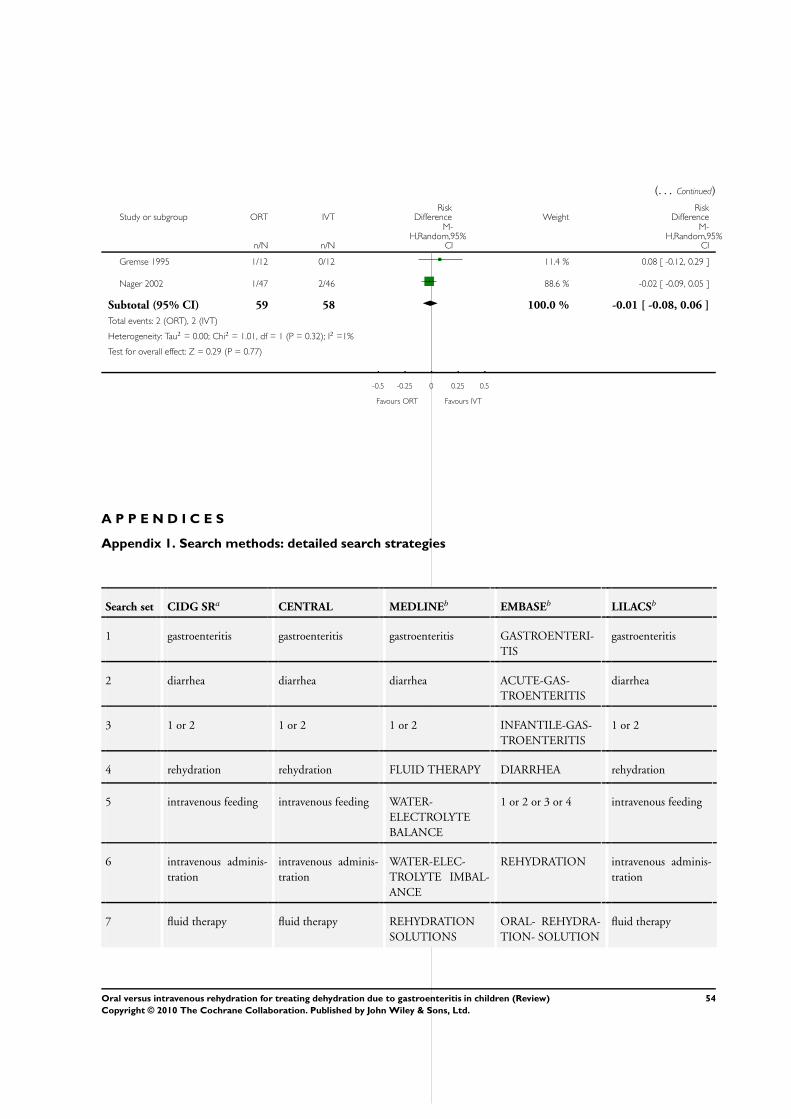
(. . . Continued)
Study or subgroup ORT IVTRisk
Difference WeightRisk
Difference
n/N n/N
M-H,Random,95%
CI
M-H,Random,95%
CI
Gremse 1995 1/12 0/12 11.4 % 0.08 [ -0.12, 0.29 ]
Nager 2002 1/47 2/46 88.6 % -0.02 [ -0.09, 0.05 ]
Subtotal (95% CI) 59 58 100.0 % -0.01 [ -0.08, 0.06 ]
Total events: 2 (ORT), 2 (IVT)
Heterogeneity: Tau2 = 0.00; Chi2 = 1.01, df = 1 (P = 0.32); I2 =1%
Test for overall effect: Z = 0.29 (P = 0.77)
-0.5 -0.25 0 0.25 0.5
Favours ORT Favours IVT
A P P E N D I C E S
Appendix 1. Search methods: detailed search strategies
Search set CIDG SRa CENTRAL MEDLINEb EMBASEb LILACSb
1 gastroenteritis gastroenteritis gastroenteritis GASTROENTERI-
TIS
gastroenteritis
2 diarrhea diarrhea diarrhea ACUTE-GAS-
TROENTERITIS
diarrhea
3 1 or 2 1 or 2 1 or 2 INFANTILE-GAS-
TROENTERITIS
1 or 2
4 rehydration rehydration FLUID THERAPY DIARRHEA rehydration
5 intravenous feeding intravenous feeding WATER-
ELECTROLYTE
BALANCE
1 or 2 or 3 or 4 intravenous feeding
6 intravenous adminis-
tration
intravenous adminis-
tration
WATER-ELEC-
TROLYTE IMBAL-
ANCE
REHYDRATION intravenous adminis-
tration
7 fluid therapy fluid therapy REHYDRATION
SOLUTIONS
ORAL- REHYDRA-
TION- SOLUTION
fluid therapy
54Oral versus intravenous rehydration for treating dehydration due to gastroenteritis in children (Review)
Copyright © 2010 The Cochrane Collaboration. Published by John Wiley & Sons, Ltd.
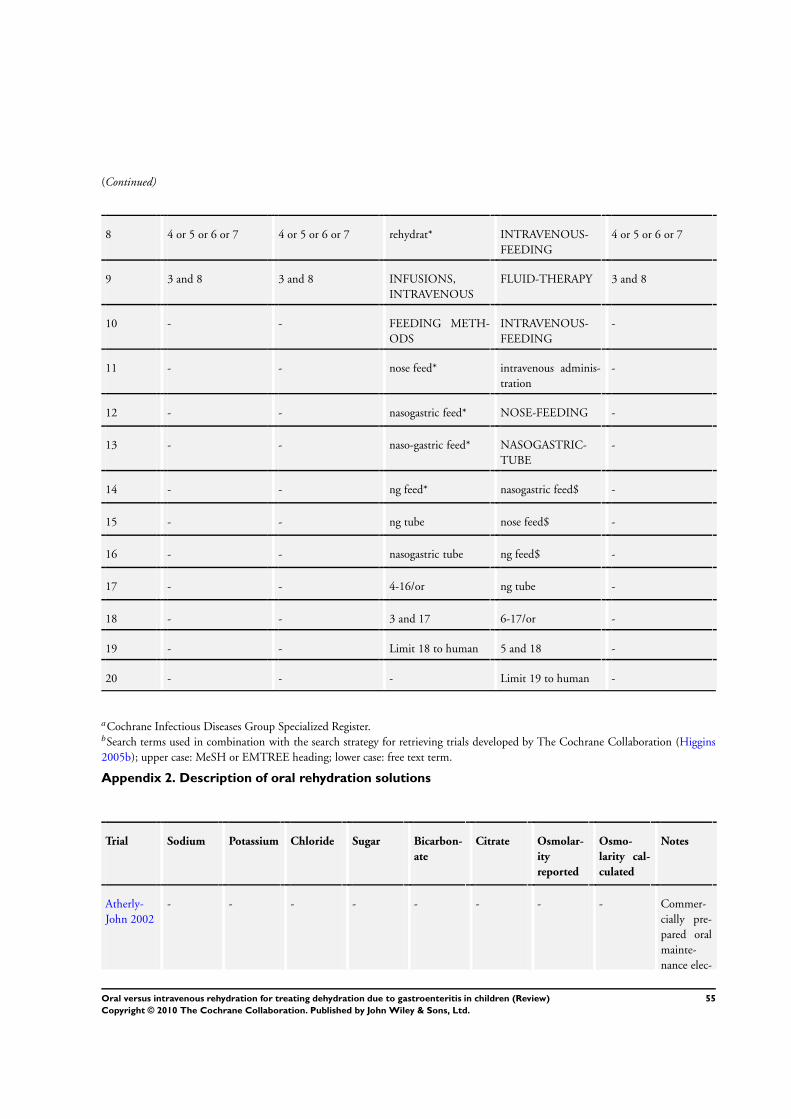
(Continued)
8 4 or 5 or 6 or 7 4 or 5 or 6 or 7 rehydrat* INTRAVENOUS-
FEEDING
4 or 5 or 6 or 7
9 3 and 8 3 and 8 INFUSIONS,
INTRAVENOUS
FLUID-THERAPY 3 and 8
10 - - FEEDING METH-
ODS
INTRAVENOUS-
FEEDING
-
11 - - nose feed* intravenous adminis-
tration
-
12 - - nasogastric feed* NOSE-FEEDING -
13 - - naso-gastric feed* NASOGASTRIC-
TUBE
-
14 - - ng feed* nasogastric feed$ -
15 - - ng tube nose feed$ -
16 - - nasogastric tube ng feed$ -
17 - - 4-16/or ng tube -
18 - - 3 and 17 6-17/or -
19 - - Limit 18 to human 5 and 18 -
20 - - - Limit 19 to human -
aCochrane Infectious Diseases Group Specialized Register.bSearch terms used in combination with the search strategy for retrieving trials developed by The Cochrane Collaboration (Higgins
2005b); upper case: MeSH or EMTREE heading; lower case: free text term.
Appendix 2. Description of oral rehydration solutions
Trial Sodium Potassium Chloride Sugar Bicarbon-
ate
Citrate Osmolar-
ity
reported
Osmo-
larity cal-
culated
Notes
Atherly-
John 2002
- - - - - - - - Commer-
cially pre-
pared oral
mainte-
nance elec-
55Oral versus intravenous rehydration for treating dehydration due to gastroenteritis in children (Review)
Copyright © 2010 The Cochrane Collaboration. Published by John Wiley & Sons, Ltd.
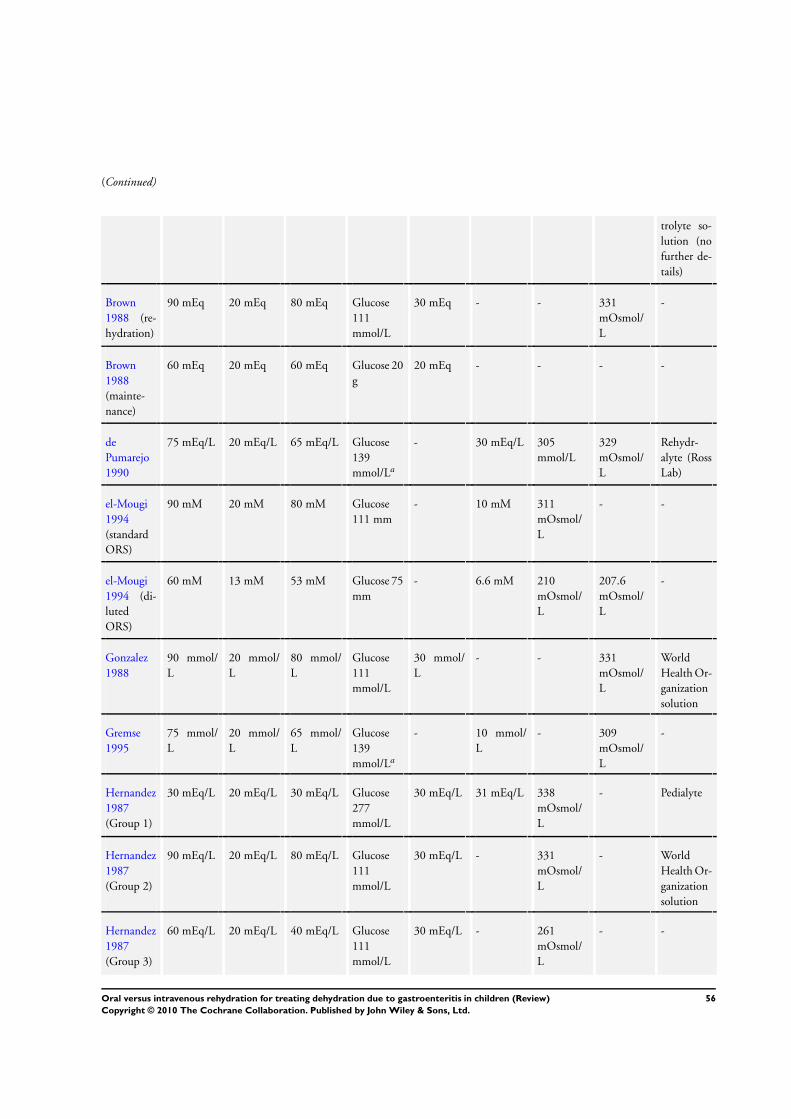
(Continued)
trolyte so-
lution (no
further de-
tails)
Brown
1988 (re-
hydration)
90 mEq 20 mEq 80 mEq Glucose
111
mmol/L
30 mEq - - 331
mOsmol/
L
-
Brown
1988
(mainte-
nance)
60 mEq 20 mEq 60 mEq Glucose 20
g
20 mEq - - - -
de
Pumarejo
1990
75 mEq/L 20 mEq/L 65 mEq/L Glucose
139
mmol/La
- 30 mEq/L 305
mmol/L
329
mOsmol/
L
Rehydr-
alyte (Ross
Lab)
el-Mougi
1994
(standard
ORS)
90 mM 20 mM 80 mM Glucose
111 mm
- 10 mM 311
mOsmol/
L
- -
el-Mougi
1994 (di-
luted
ORS)
60 mM 13 mM 53 mM Glucose 75
mm
- 6.6 mM 210
mOsmol/
L
207.6
mOsmol/
L
-
Gonzalez
1988
90 mmol/
L
20 mmol/
L
80 mmol/
L
Glucose
111
mmol/L
30 mmol/
L
- - 331
mOsmol/
L
World
Health Or-
ganization
solution
Gremse
1995
75 mmol/
L
20 mmol/
L
65 mmol/
L
Glucose
139
mmol/La
- 10 mmol/
L
- 309
mOsmol/
L
-
Hernandez
1987
(Group 1)
30 mEq/L 20 mEq/L 30 mEq/L Glucose
277
mmol/L
30 mEq/L 31 mEq/L 338
mOsmol/
L
- Pedialyte
Hernandez
1987
(Group 2)
90 mEq/L 20 mEq/L 80 mEq/L Glucose
111
mmol/L
30 mEq/L - 331
mOsmol/
L
- World
Health Or-
ganization
solution
Hernandez
1987
(Group 3)
60 mEq/L 20 mEq/L 40 mEq/L Glucose
111
mmol/L
30 mEq/L - 261
mOsmol/
L
- -
56Oral versus intravenous rehydration for treating dehydration due to gastroenteritis in children (Review)
Copyright © 2010 The Cochrane Collaboration. Published by John Wiley & Sons, Ltd.
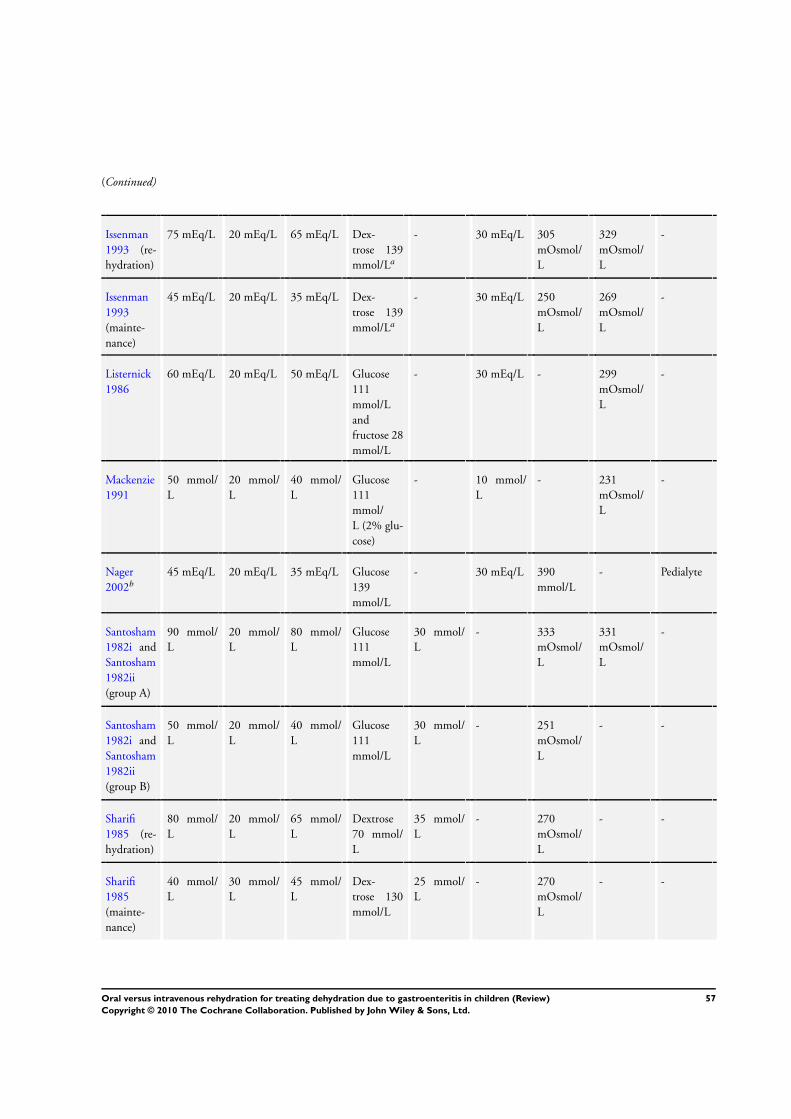
(Continued)
Issenman
1993 (re-
hydration)
75 mEq/L 20 mEq/L 65 mEq/L Dex-
trose 139
mmol/La
- 30 mEq/L 305
mOsmol/
L
329
mOsmol/
L
-
Issenman
1993
(mainte-
nance)
45 mEq/L 20 mEq/L 35 mEq/L Dex-
trose 139
mmol/La
- 30 mEq/L 250
mOsmol/
L
269
mOsmol/
L
-
Listernick
1986
60 mEq/L 20 mEq/L 50 mEq/L Glucose
111
mmol/L
and
fructose 28
mmol/L
- 30 mEq/L - 299
mOsmol/
L
-
Mackenzie
1991
50 mmol/
L
20 mmol/
L
40 mmol/
L
Glucose
111
mmol/
L (2% glu-
cose)
- 10 mmol/
L
- 231
mOsmol/
L
-
Nager
2002b
45 mEq/L 20 mEq/L 35 mEq/L Glucose
139
mmol/L
- 30 mEq/L 390
mmol/L
- Pedialyte
Santosham
1982i and
Santosham
1982ii
(group A)
90 mmol/
L
20 mmol/
L
80 mmol/
L
Glucose
111
mmol/L
30 mmol/
L
- 333
mOsmol/
L
331
mOsmol/
L
-
Santosham
1982i and
Santosham
1982ii
(group B)
50 mmol/
L
20 mmol/
L
40 mmol/
L
Glucose
111
mmol/L
30 mmol/
L
- 251
mOsmol/
L
- -
Sharifi
1985 (re-
hydration)
80 mmol/
L
20 mmol/
L
65 mmol/
L
Dextrose
70 mmol/
L
35 mmol/
L
- 270
mOsmol/
L
- -
Sharifi
1985
(mainte-
nance)
40 mmol/
L
30 mmol/
L
45 mmol/
L
Dex-
trose 130
mmol/L
25 mmol/
L
- 270
mOsmol/
L
- -
57Oral versus intravenous rehydration for treating dehydration due to gastroenteritis in children (Review)
Copyright © 2010 The Cochrane Collaboration. Published by John Wiley & Sons, Ltd.
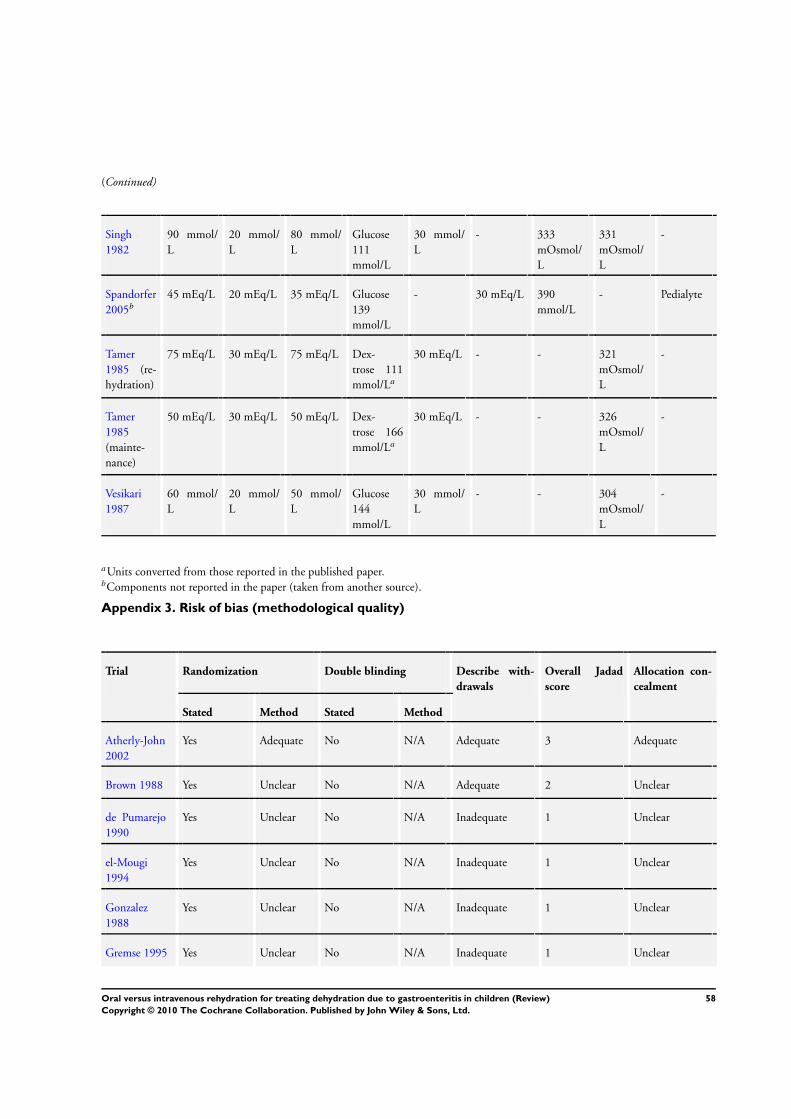
(Continued)
Singh
1982
90 mmol/
L
20 mmol/
L
80 mmol/
L
Glucose
111
mmol/L
30 mmol/
L
- 333
mOsmol/
L
331
mOsmol/
L
-
Spandorfer
2005b
45 mEq/L 20 mEq/L 35 mEq/L Glucose
139
mmol/L
- 30 mEq/L 390
mmol/L
- Pedialyte
Tamer
1985 (re-
hydration)
75 mEq/L 30 mEq/L 75 mEq/L Dex-
trose 111
mmol/La
30 mEq/L - - 321
mOsmol/
L
-
Tamer
1985
(mainte-
nance)
50 mEq/L 30 mEq/L 50 mEq/L Dex-
trose 166
mmol/La
30 mEq/L - - 326
mOsmol/
L
-
Vesikari
1987
60 mmol/
L
20 mmol/
L
50 mmol/
L
Glucose
144
mmol/L
30 mmol/
L
- - 304
mOsmol/
L
-
aUnits converted from those reported in the published paper.bComponents not reported in the paper (taken from another source).
Appendix 3. Risk of bias (methodological quality)
Trial Randomization Double blinding Describe with-
drawals
Overall Jadad
score
Allocation con-
cealment
Stated Method Stated Method
Atherly-John
2002
Yes Adequate No N/A Adequate 3 Adequate
Brown 1988 Yes Unclear No N/A Adequate 2 Unclear
de Pumarejo
1990
Yes Unclear No N/A Inadequate 1 Unclear
el-Mougi
1994
Yes Unclear No N/A Inadequate 1 Unclear
Gonzalez
1988
Yes Unclear No N/A Inadequate 1 Unclear
Gremse 1995 Yes Unclear No N/A Inadequate 1 Unclear
58Oral versus intravenous rehydration for treating dehydration due to gastroenteritis in children (Review)
Copyright © 2010 The Cochrane Collaboration. Published by John Wiley & Sons, Ltd.
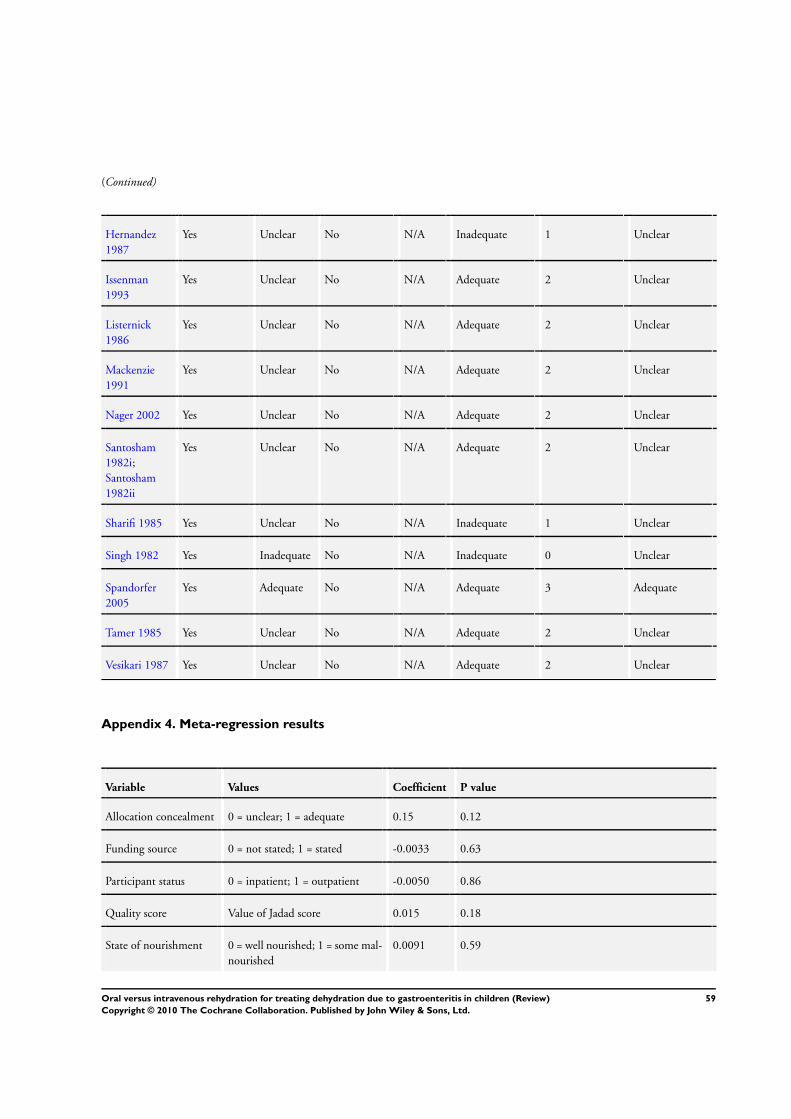
(Continued)
Hernandez
1987
Yes Unclear No N/A Inadequate 1 Unclear
Issenman
1993
Yes Unclear No N/A Adequate 2 Unclear
Listernick
1986
Yes Unclear No N/A Adequate 2 Unclear
Mackenzie
1991
Yes Unclear No N/A Adequate 2 Unclear
Nager 2002 Yes Unclear No N/A Adequate 2 Unclear
Santosham
1982i;
Santosham
1982ii
Yes Unclear No N/A Adequate 2 Unclear
Sharifi 1985 Yes Unclear No N/A Inadequate 1 Unclear
Singh 1982 Yes Inadequate No N/A Inadequate 0 Unclear
Spandorfer
2005
Yes Adequate No N/A Adequate 3 Adequate
Tamer 1985 Yes Unclear No N/A Adequate 2 Unclear
Vesikari 1987 Yes Unclear No N/A Adequate 2 Unclear
Appendix 4. Meta-regression results
Variable Values Coefficient P value
Allocation concealment 0 = unclear; 1 = adequate 0.15 0.12
Funding source 0 = not stated; 1 = stated -0.0033 0.63
Participant status 0 = inpatient; 1 = outpatient -0.0050 0.86
Quality score Value of Jadad score 0.015 0.18
State of nourishment 0 = well nourished; 1 = some mal-
nourished
0.0091 0.59
59Oral versus intravenous rehydration for treating dehydration due to gastroenteritis in children (Review)
Copyright © 2010 The Cochrane Collaboration. Published by John Wiley & Sons, Ltd.
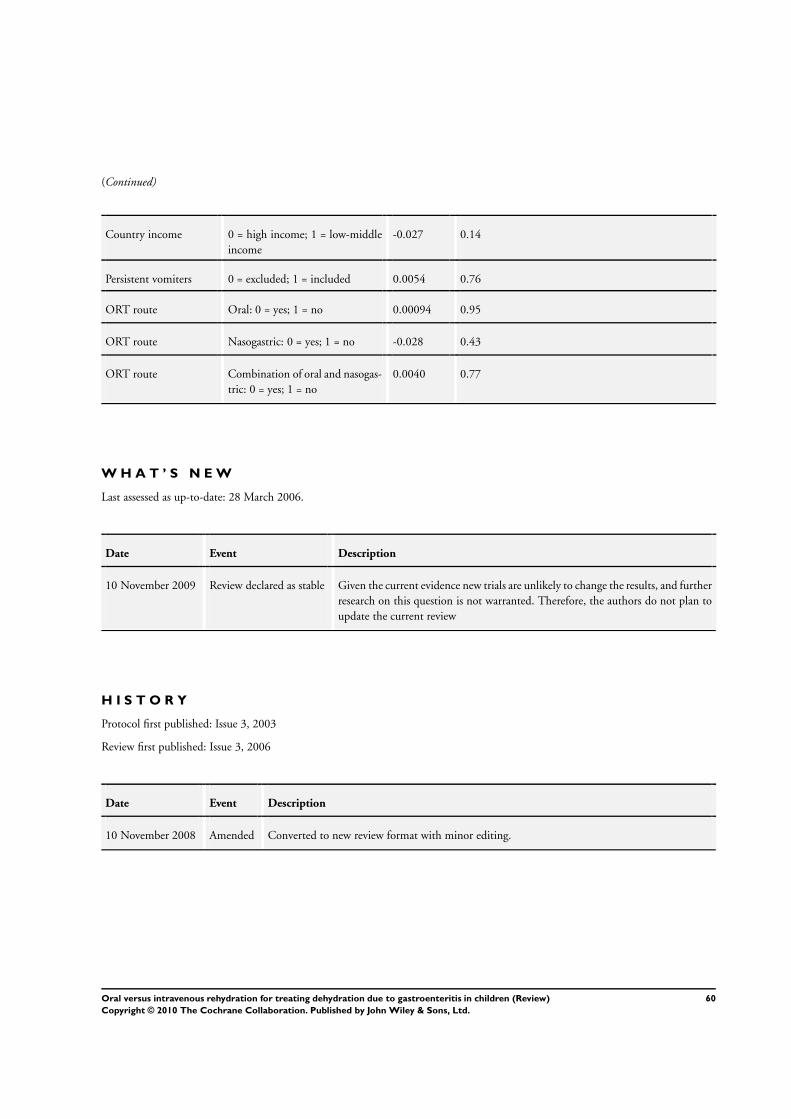
(Continued)
Country income 0 = high income; 1 = low-middle
income
-0.027 0.14
Persistent vomiters 0 = excluded; 1 = included 0.0054 0.76
ORT route Oral: 0 = yes; 1 = no 0.00094 0.95
ORT route Nasogastric: 0 = yes; 1 = no -0.028 0.43
ORT route Combination of oral and nasogas-
tric: 0 = yes; 1 = no
0.0040 0.77
W H A T ’ S N E W
Last assessed as up-to-date: 28 March 2006.
Date Event Description
10 November 2009 Review declared as stable Given the current evidence new trials are unlikely to change the results, and further
research on this question is not warranted. Therefore, the authors do not plan to
update the current review
H I S T O R Y
Protocol first published: Issue 3, 2003
Review first published: Issue 3, 2006
Date Event Description
10 November 2008 Amended Converted to new review format with minor editing.
60Oral versus intravenous rehydration for treating dehydration due to gastroenteritis in children (Review)
Copyright © 2010 The Cochrane Collaboration. Published by John Wiley & Sons, Ltd.
C O N T R I B U T I O N S O F A U T H O R S
L Hartling provided overall project coordination and contributed to protocol development, literature searching, screening of articles for
relevance and inclusion, assessment of study quality, data extraction, data analysis, and preparation of completed review. S Bellemare
contributed to protocol development, literature searching, relevance screening of articles, assessment of study quality, data extraction, data
analysis, and preparation of completed review. N Wiebe conducted the statistical analysis and contributed to the protocol development
and preparation of completed review. K Russell contributed to screening of articles for relevance and inclusion, data extraction and
entry, and preparation of completed review. T Klassen contributed to protocol development and preparation of completed review,
and provided methodological and content expertise. W Craig contributed to protocol development, quality assessment, preparation of
completed review, and provided content expertise.
D E C L A R A T I O N S O F I N T E R E S T
None declared.
S O U R C E S O F S U P P O R T
Internal sources
• Alberta Research Centre for Child Health Evidence, Canada.
External sources
• Alberta Heritage Foundation for Medical Research, Canada.
D I F F E R E N C E S B E T W E E N P R O T O C O L A N D R E V I E W
2006, Issue 3 (deviations from protocol).
• We used risk difference for our primary outcome instead of risk ratio because we have too many trials with zeros in both
treatment groups; we did say how we would calculate baseline risk in the protocol, and we are simply expanding upon this.
• Our primary analysis changed from using the fixed-effect model to the random-effects model before we looked at the data; this
change was based on the comments from statisticians in Cochrane’s Statistical Methods Group.
• We chose to use the I-squared statistic rather than the chi-square test for heterogeneity based on comments from statisticians in
Cochrane’s Statistical Methods Group.
• Heterogeneity is always present, but it may not always be quantifiable (too small). We used the fixed-effect model in the
sensitivity analyses to give a sense of whether the treatment effect may ever be significant, because the random-effects model may be
biased when there is funnel plot asymmetry, and for a conservative approach to an equivalence hypothesis if there could be one.
• Omitting the trim-and-fill method from the protocol was an oversight.
• We added the participant subgroup inpatient/outpatient status before looking at the data, but after the protocol was published.
• We added ’sodium intake and sodium levels’ as an outcome measure; since hyponatremia and hypernatremia were part of the
protocol, this makes sodium levels and intake relevant, and we therefore chose to include this outcome measure post-hoc as it was
frequently reported in the included trials.
61Oral versus intravenous rehydration for treating dehydration due to gastroenteritis in children (Review)
Copyright © 2010 The Cochrane Collaboration. Published by John Wiley & Sons, Ltd.
I N D E X T E R M S
Medical Subject Headings (MeSH)
Administration, Oral; Dehydration [etiology; ∗therapy]; Fluid Therapy [∗methods]; Gastroenteritis [∗complications]; Infusions, Intra-
venous; Randomized Controlled Trials as Topic; Rehydration Solutions [∗administration & dosage]
MeSH check words
Child; Humans
62Oral versus intravenous rehydration for treating dehydration due to gastroenteritis in children (Review)
Copyright © 2010 The Cochrane Collaboration. Published by John Wiley & Sons, Ltd.


![[PRODUCT LIS T] - IMPERIA LIFE SCIENCES · Pirenoxine Sodium Eye Drops Taurine Eye Drops . 13 DECONGESTANT Xylometazoline Nasal Spray DEHYDRATION TREATMENT Oral Rehydration Salts](https://img.pdfslide.us/doc/110x75/5d25d3b488c993b3788b9278/product-lis-t-imperia-life-pirenoxine-sodium-eye-drops-taurine-eye-drops.jpg)


![Rapid intravenous rehydration of children with acute … › content › pdf › 10.1186 › s12887-018... · 2018-02-09 · those children receiving fluid-bolus therapy [12], includ-ing](https://img.pdfslide.us/doc/110x75/5f266e7fc9ce4d0d3c4a0da0/rapid-intravenous-rehydration-of-children-with-acute-a-content-a-pdf-a-101186.jpg)